
Abstract
Framework Programs (FPs) of the European Union (EU) finance collaboration among research units located in different parts of Europe and as such they mediate the flow of a significant amount of knowledge across distantly located European regions. Contrary to expectations, no evidence has been found in the literature on the supposed positive regional innovation impact of FP participation. We assume in this article that the overall missing impact of EU FP participation on regional patenting masks an important spatial regime effect. Our results are supportive of this assumption. While FP research subsidies act as a substitute for funding from other sources in regions of old EU member states, innovation in lagging regions in Central and Eastern Europe tends to rely more on the external knowledge transferred via FP-funded research networks to compensate for their less developed local knowledge infrastructures. Our findings are important, as they suggest that, in combination with other policies, strengthening research excellence and international scientific networking in relatively lagging regions could be a viable option to increase regional innovativeness.
Keywords
Introduction
The complexity of innovation necessitates firms to source significant parts of knowledge externally. As a result, innovation has become a collective process involving different actors like competing and related firms, supporting business services, private, or public research organizations (Lundvall 2010). External knowledge is obtained via several channels, including (among others) formal collaborations, labor markets, technology licensing, or pure knowledge spillovers (Amin and Cohendet 2004). The geographic dimension of interactions in innovation has received a particular attention in the literature, the key role of spatial proximity being underlined in several studies (Varga and Horváth 2015). Geographical proximity is important in innovation for several reasons. Close location of actors is beneficial for establishing and maintaining social connections (Agrawal, Kapur, and McHale 2008), which can facilitate quick and efficient flows of both tacit and codified knowledge. These connections are also advantageous for the development of trust and the establishment of common codes of communication, both essential for collaborative innovation (Koschatzky 2000). Additionally, some of the main facilitators of knowledge transfers such as spin-off firm formation (Klepper 2007) or labor mobility (Breschi and Lissoni 2009) also tend to operate within small geographical areas.
Despite the focal role of geography, some channels of innovation-related knowledge flows do not necessarily require the spatial proximity of actors. Collaborative research is one of those knowledge transfer mechanisms that operate even over large distances without requiring frequent personal interactions. The synergy between different types of proximities in knowledge transfers (Boschma 2005) and the fact that nonspatial forms of proximities (such as cognitive, social, or institutional proximities) may efficiently compensate for geographical distance help understand why research collaboration is possible even over long distances. Cognitive proximity of scientists working in the same field ensures common understanding of the codes of scientific communication (Meder 2008), while social and relational proximities among researchers help build and maintain the necessary level of trust even without frequent interactions (Autant-Bernard, Billand, and Massard 2007; Basile, Capello, and Caragliu 2012).
While there is ample evidence that research-related interactions among closely located actors increase innovation, contrary to expectations, the literature has not provided unequivocal evidence for the supposed positive impact of nonspatially mediated interregional research collaborations on innovation. Although Hoekman, Frenken, and van Oort (2008) find a positive and significant relationship between research activity of scientific collaborators (measured by coauthorship) and patenting at the regional level for two technologies (biotechnology and semiconductors), comparable evidence is not reported in other papers. Maggioni, Nosvelli, and Uberti (2007) study research networks supported by the Framework Programs (FPs) which are the European Union’s (EU) major research funding instruments. At the Nomenclature of Territorial Units for Statistics (NUTS) 2 1 regional level, they found no relationship between patenting and the number of collaborative projects funded by the Fifth FP (FP5). In Varga, Pontikakis, and Chorafakis (2014), there is also no direct effect of FP5-funded research collaboration on regional patenting. Sebestyén and Varga (2013a) dig deeper into the issue and found evidence that nonspatial interregional learning in patenting in Europe is mediated by copatenting linkages and not by FP5 participations. Extending the panel of European NUTS 2 regions including data on FP5 (1998–2002), FP6 (2002–2006), and FP7 (2007–2013) programs, Hazir and Autant-Bernard (2013) reinforce what is already reported in the articles surveyed before: interregional research and development (R&D) knowledge flows mediated by EU FP participation are not related to patenting at the regional level. 2
Thus, while a positive association is observed between regional patenting and learning mediated by interregional copublication networks, this relationship disappears for learning mediated by research collaborations financed by the FPs—the EU’s main research funding instrument. Differences in the results might arise from certain features of FP networks that have not been considered explicitly in the previous analyses. One of these specific features is the observed strong spatial regime effect of FP participation in the production of new knowledge. The literature already shows very interesting regional patterns in this respect for different stages of innovation. With respect to Pasteur-type (precompetitive) research, it is found that EU FP participation increases future publication activities, but this positive impact is more prevalent for regions located in the periphery of Europe. According to Hoekman et al. (2012), FP funding appears to be more efficient in promoting copublications between previously poorly connected regions than strengthening already established copublication ties. On the basis of this result, the authors conclude that FPs are successful in promoting copublication activities of scientists located in the periphery of the EU while the effect in the core is nonexistent or even negative.
A related finding in Sebestyén and Varga (2013c) is the geographically differentiated FP effect on future publications. Their analysis shows that knowledge flows from FP5 partner regions increase the number of publications associated with any level of R&D expenditures in the region, but this positive impact on the productivity of research is higher in peripherally located regions than in the rest of the EU. This result has implications for Edison-type (competitive) research as well. Varga, Pontikakis, and Chorafakis (2014) find evidence for a positive relationship between research productivity in publication and the inflow of R&D in subsequent time periods. Together with the spatial regime effect in R&D productivity and publication found in Sebestyén and Varga (2013c), this result suggests that participation in collaborative research funded by EU FPs has a stronger influence on peripheral regions’ future R&D, which (ceteris paribus) suggests a more pronounced indirect FP impact on patenting in lagging areas of Europe. Maggioni, Uberti, and Nosvelli (2014) also show that Central and Eastern European (CEE) countries behave differently from other European regions in the production of new knowledge. While in CEE regions geographical spillovers play a limited role, FP6 contacts provide a one-way long-distance information channel for them.
Wouldn’t it be the case that the generally missing evidence on a direct impact of EU FP participation-mediated knowledge transfer on patenting masks important and regular spatial differences in Europe? Influenced by earlier findings in the literature, we assume in this article that the direct impact of knowledge transfers between FP network partners on regional patenting follows different trends in core and peripheral regions in Europe. As there are no antecedents in the literature on the nature of these trends, we formulate two alternative hypotheses. According to the first one, we assume that lagging areas, resulting from their low levels of absorptive capacities, are not yet equipped to utilize learning from FP research networks (Radosevic and Yoruk 2013) thus their patenting activity will not be affected by collaborations funded by the FPs contrary to core regions where strong innovation effects are expected. The alternative hypothesis (in the spirit of Hoekman et al. 2012) states that since FP subsidies are only substitutes for other research funds in core EU regions, they do not influence patenting significantly there, whereas in peripheral regions, FP research support acts as a complementary resource and as such it becomes an important factor in innovation.
Thus, we assume that the overall missing impact of EU FP participation on regional patenting is related to a spatial regime effect. To this aim, we separate the EU regions into two subsamples in the analysis: peripheral regions in recently joined CEE countries on the one hand and regions in “old member states” together with more developed regions of CEE countries on the other. We then econometrically test the relationship between knowledge learned from FP participations and regional patenting in the two subsamples separately. Our measure of knowledge accessed from research networks is the ego network quality (ENQ) index (Sebestyén and Varga 2013a, 2013b). This index has been developed to provide a summary measure of learning potential from a particular position in the network. With this index, the aim is to overcome a frequent shortcoming of many previous studies in the geography of innovation field that focus exclusively on the effect of partners’ knowledge while important structural features of knowledge networks are not taken into account. Additionally, with the application of the ENQ index, it is possible to explicitly account for dynamic changes in extraregional knowledge networks contrary to the usual approach, which operates with fixed collaboration matrices (Hazir and Autant-Bernard 2013). To control for extraregional knowledge flows mediated by geographical proximity, a systematic panel spatial econometric methodology is applied. Our data cover three subsequent FPs: FP5, FP6, and FP7 spanning over the time period of 1998–2009. Only a limited number of research fields can consistently be identified during the subsequent periods of EU FPs. In this article, we selected information and communication technology (ICT) for study.
The subsequent section of this article presents the empirical model and the methodologies applied in measuring localized and network-mediated knowledge flows. The third section introduces the data followed by an exploratory analysis of the main variables in this study. In the fourth section, we present our empirical results. Summary concludes this article.
Empirical Research Methodology
The Empirical Model
Our empirical framework is built on the knowledge production function (KPF) introduced in Romer (1990) and then further developed by Jones (1995):

where dA i/dt is the change in technological knowledge over time, HAi refers to human capital in research, Ai is the total stock of already existing scientific and technological knowledge (knowledge codified in publications, patents, etc.), and i stands for the spatial unit. Therefore, technological change is associated with contemporary R&D efforts and previously accumulated knowledge. The same number of researchers can have a varying impact on technological change depending on the stock of already existing knowledge.
In order to empirically test our hypotheses on the role of external knowledge (mediated by FP research networks) in technical change, we apply the following econometric specification. Using subscripts i to denote individual regions, the empirical counterpart of the Romerian KPF is specified as:

where PAT i stands for new technological knowledge measured by patent applications, RD i is expenditure on R&D, and PAT_STOCK i proxies technological knowledge accumulated over time in region i. In accordance with usual interpretations, a 1 reflects the influence of localized knowledge flows from R&D carried out by firms and public research institutions on regional patenting, while a 2 estimates the relation between patenting and accumulated knowledge. Besides regional controls, Zi stands for variables measuring the two extraregional knowledge sources: knowledge accessed via the participation of FP networks on the one hand and geographically proximate knowledge sources on the other. The following two subsections explain our measures of the two extraregional knowledge sources one after another.
Measuring Extraregional Knowledge Accessed via Research Networks: The ENQ Index
The theory of innovation emphasizes the role of interactions among different actors in innovation. These interactions follow a system and the characteristics of the system determine the efficiency of new knowledge production to a large extent (Lundvall 2010; Nelson 1993). An extensive survey-based empirical literature evidences that innovation is indeed a collective process where the knowledge and expertise of partners and the intensity of collaborations among them determine the production of new, economically useful knowledge (e.g., Diez 2002; Fischer and Varga 2002). Representing actors as nodes and their connections as ties, interactions of collaborating agents can be mapped as a network. On the basis of this representation, the application of network analysis extends the frontiers of the study of knowledge interactions well beyond the possibilities of traditional innovation surveys.
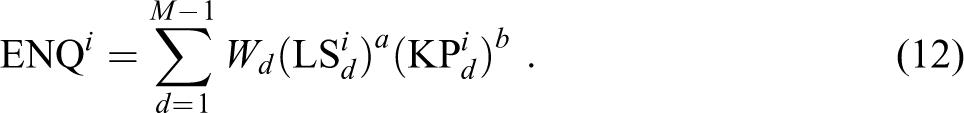
In this article, we employ the previously developed ENQ index, which tries to capture the quality or value of knowledge, which can be accessed by a given region (represented as a node) in the network of knowledge flows. Behind the concept of ENQ, there are three intuitions directly influenced by the theory of innovation. The first intuition is that the level of knowledge in an agent’s network is in a positive relationship with the agent’s productivity in knowledge creation. The second intuition is that the structure of connections in the agent’s network can serve as an additional source of value (see, e.g., Coleman 1986; Burt 1992). Following the third intuition, we assume that partners in the ego network not only increase the amount of knowledge accessible but also contribute to its diversity through building connections to different further groups not linked directly to the ego network.
According to these intuitions, we structure ENQ around basically two dimensions, which are then augmented with a related third aspect. The two dimensions are knowledge potential (KP) and local structure (LS). KP measures knowledge accumulated in the direct neighborhood and it is related to the number of partners and the knowledge of individual partners. LS is associated with the structure of links among partners. The third aspect is called global embeddedness (GE), as it intends to capture the quality of distant parts of the network (beyond immediate partners). However, this aspect is implemented by applying the concepts of KP and LS for consecutive neighborhoods of indirect partners in the network. 3 Here we give a brief summary of the ENQ index with the most important aspects. The reader is directed to Sebestyén and Varga (2013a, 2013b) for more detailed discussions.
The notation in the proceeding formulation is as follows. We represent the network under question by the adjacency matrix
Given the conceptual model presented above, we formalize ENQ as follows:

In this formula, superscript i refers to the node for which ENQ is calculated and subscript d stands for distances measured in the network (geodesic distance). M is the size of the network, Wd
is a weighting factor used for discounting values at different distances d from node i,
4
whereas
Knowledge potential
The concept of KP relates to the amount of knowledge an agent’s partners possess. Using the notation presented before, the concept of KP can be formulated in the following way:
The KP, as perceived by node i, can thus be calculated for the neighborhoods at different distances d from node i, and for all these distances, it is the sum of knowledge possessed by nodes at these distances.
Local structure
Following the theory of innovation, we assume that the potentially accessible knowledge from immediate network partners depends not only on the partners’ accumulated knowledge but also on new knowledge that potentially arises from mutual learning of the partners. The concept of LS refers to the structure of connections in different neighborhoods of a node. How one defines the “good” structure, though, remains an open question. There is a concurrent debate in the literature of social capital and network position whether cohesive, tightly linked neighborhoods provide a better position (Coleman 1986) or structural holes, which puts weight on gatekeepers connecting different groups in the network (Burt 1992). However, the formula for ENQ in equation (3) is specified in a way that LS can be filled with different concepts. In this article, we use the cohesion approach, that is, we attach higher weights to neighborhoods in which more ties are present. 5
As a consequence, LS is associated with the number and strength of ties among partners. It is the sum of the edge weights present in a given neighborhood, normalized by the size of this neighborhood:
where
Modeling Extraregional Localized Knowledge Flows: Panel Spatial Econometric Methodology
Increasing availability of spatial data collected over longer periods of time created the demand for econometric models accounting for spatial dependence in panel data. Methodological developments of models in this domain (Elhorst 2003; Anselin, Le Gallo, and Jayet 2008; LeSage and Pace 2009) and the growing number of their applications in empirical research (Autant-Bernard 2012) are one of the most significant recent changes in spatial analysis.
In the subsequent econometric analyses, we consider the following specification issues: identification of the network effect, identification of the effect of localized knowledge transfer, and identification of the panel effects. Equations (6) –(11) provide the actual spatial panel representations of equation (2) used for estimation. In equations (6)–(8), ENQ enters the right-hand side as a stand-alone variable. In these cases, we measure the direct influence of interregional knowledge flows mediated by FP networks on patenting in a given region. On the other hand, equations (9)–(11) represent an alternative specification when ENQ interacts with R&D. In this type of models, the influence of network knowledge on patenting works through improved productivity of research. With regard to the impact of localized knowledge flows on regional patenting, three types of spatial models will be tested against each other: the spatial lag, the spatial error, and the spatial Durbin models. In spatial lag models (equations [6] and [9]), spatial dependence is modeled through the spatially lagged dependent variable. In spatial error models (equations [7] and [10]), dependence is modeled in the error term. Alternatively, with the spatial Durbin model (equations [8] and [11]), spatial dependence is modeled through both the dependent and the independent variables.

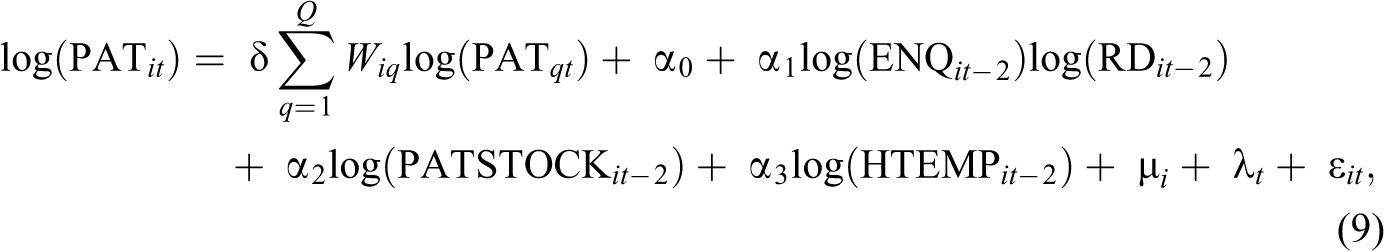

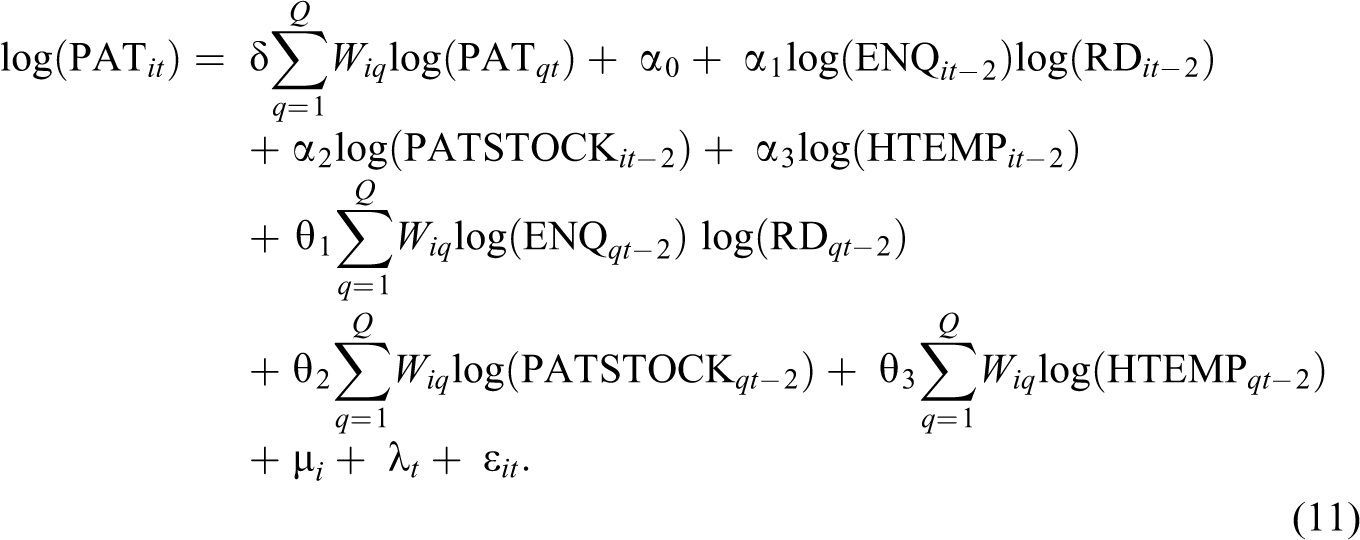
There are some variables in equations (6) –(11) not yet introduced before. HTEMP is employment in high technology industries. Its estimated parameter is considered as a proxy for the impact of the localized flows of nonresearch-related industrial knowledge on patenting. μ i and λ t represent spatial and time period (fixed or random) effects.
Selection among the spatial error, lag and Durbin models are guided by testing the so-called common factor hypothesis (Anselin 1988):

where θ, just as α, is a K × 1 vector of parameters. The first hypothesis examines whether the spatial Durbin model can be simplified to the spatial lag model, and the second hypothesis examines whether it can be simplified to the spatial error model (Burridge 1981). We applied the Wald test (Elhorst 2012) to empirically test the common factor hypothesis.
Regarding panel effect identification, we run likelihood ratio (LR) tests on the joint significance of spatial fixed effects and time period fixed effect, subsequently (Elhorst 2012). Hausman’s specification test is used to test the random effects model against the fixed effects model (Lee and Yu 2010).
Data Description and an Exploratory Analysis
The empirical analysis in this article is based on a sample of 262 European NUTS 2 regions. We use a panel database, covering the period between 2000 and 2009. As our main aim is to estimate the knowledge flow effects over a longer period of time, we need to join data from FP5, FP6, and FP7 running over this time. In order to have a consistent data set, we need to restrict our analysis to those thematic areas that can be identified in all three FPs. Three such areas can be identified: “quality of life,” mainly covering life sciences, biological, and medical research; “information society and technology,” mainly covering ICT; and “Euratom,” focusing on nuclear research (see also Hoekman et al. 2012). From these three areas, we focus on the information society and technology thematic area in this article. The specific thematic areas are User-friendly Information Society in FP5, Information Society Technologies in FP6, and ICTs in FP7—the same grouping is used by, for example, Hoekman et al. (2012). The dependent variable is patenting activity in the ICT sector at the regional level as proxied by patent applications to the European Patents Office (PAT it ). 8 Although using patents as a proxy for technological innovation is far from a perfect solution, there are several reasons why it still remains one of the most widely used and accepted measures (see, e.g., Griliches [1990], for a comprehensive study on the issue or Acs, Anselin, and Varga [2002], for an analysis on the links between patent and other innovation counts at the level of regions).
Following Romer (1990), the importance of knowledge stocks (or a “standing on the shoulders of giants” effect) for knowledge production has been verified empirically (Furman, Porter and Stern, 2002; Zucker et al. 2007). In order to capture this effect, we use proxies of regional knowledge stocks by calculating patent stocks for each region (PATSTOCK it ) according to the perpetual inventory method for the 1995–2009 period (see the details in Varga, Pontikakis, and Chorafakis 2014).
EU FP cooperation networks mediate knowledge flows between regions in the information technology and society thematic areas (as discussed previously) over the period of 1998–2009 in the sample. There are good reasons to expect that participation in the FP can be an appropriate proxy of the relational structure of interregional knowledge diffusion across Europe. The FPs were designed to support “precompetitive,” collaborative research with no national bias as to the types of technologies promoted and the distribution of funds. The precompetitive character of supported research ensured that community funding did not clash with the competition principles of the common market and did not function as a form of industrial subsidy; the collaborative character of research and the cost-sharing provisions were seen to guarantee the diffusion of technologies and the involvement of various types of actors from the whole technological knowledge creation spectrum, such as large and small firms, universities, and public research institutes. One potential drawback of the FP as a data source is the fact that it is artificial; that is, collaborating teams will not always coincide with naturally emerging networks of researchers. (Varga, Pontikakis, and Chorafakis 2014)
The regional information (address) of participants in FP projects together with the information of the date of cooperation (duration of FP programs) allows us to construct a simple network assigning to each FP project the regions where the partners are resident. Then, this two-mode network is converted into a one-mode network where the nodes are regions and the links between the regions refer to the cooperation between the regions. This conversion is done on the basis of the assumption that all partners listed for a given FP project are linked to each other. For example, if three actors, A, B, and C, cooperated in one project, and actors A and B belong to region 1 while actor C belongs to region 2, then we conclude that there is a link between regions 1 and 2. Furthermore, the links in this interregional network is weighted, the link weights corresponding to the number of projects in which the organizations from the two regions are involved. This method is then iterated for each FP project and each year in the sample to obtain the annual adjacency matrices describing the network structure of knowledge flows. These matrices are then used to calculate the ENQ measures in this study.
The aggregation method we use also has its shortcomings. We assume that there is an “individual” link between all project members and then interregional links are established according to the number of projects in which two participants from two regions cooperate. This method hides the possibly more refined structure of interrelations among partners and hence regions. Unfortunately, though, there is no information on the specific collaboration structure (e.g., internal groups and hierarchies) of the projects. With less project members, the complete connectedness can be a reasonable proxy, but at larger projects with many participants, this method may overestimate the true intensity of collaboration among regions.
Although there is an example in the literature to use different internal network structures for the projects (see, e.g., Maggioni, Uberti, and Nosvelli 2012), we would argue that in these projects, the possibility is given for all participants to communicate through project events and meetings. As a result, it is rather the strength of ties is important than their pure existence; however, there is no available information for this in our data set.
Our data cover three subsequent FPs: FP5, FP6, and FP7 spanning over the time period of 2000–2009. We carry out the analysis with two European subsamples: lagging the EU regions in CEE (CEE objective 1 regions 9 —51 regions in the sample) and regions in old member states together with non-objective 1 CEE regions (rest of the EU regions—211 regions). Variable description is provided in Table 1, while descriptive statistics of the main variables are presented in Table 2.
Variable Description.
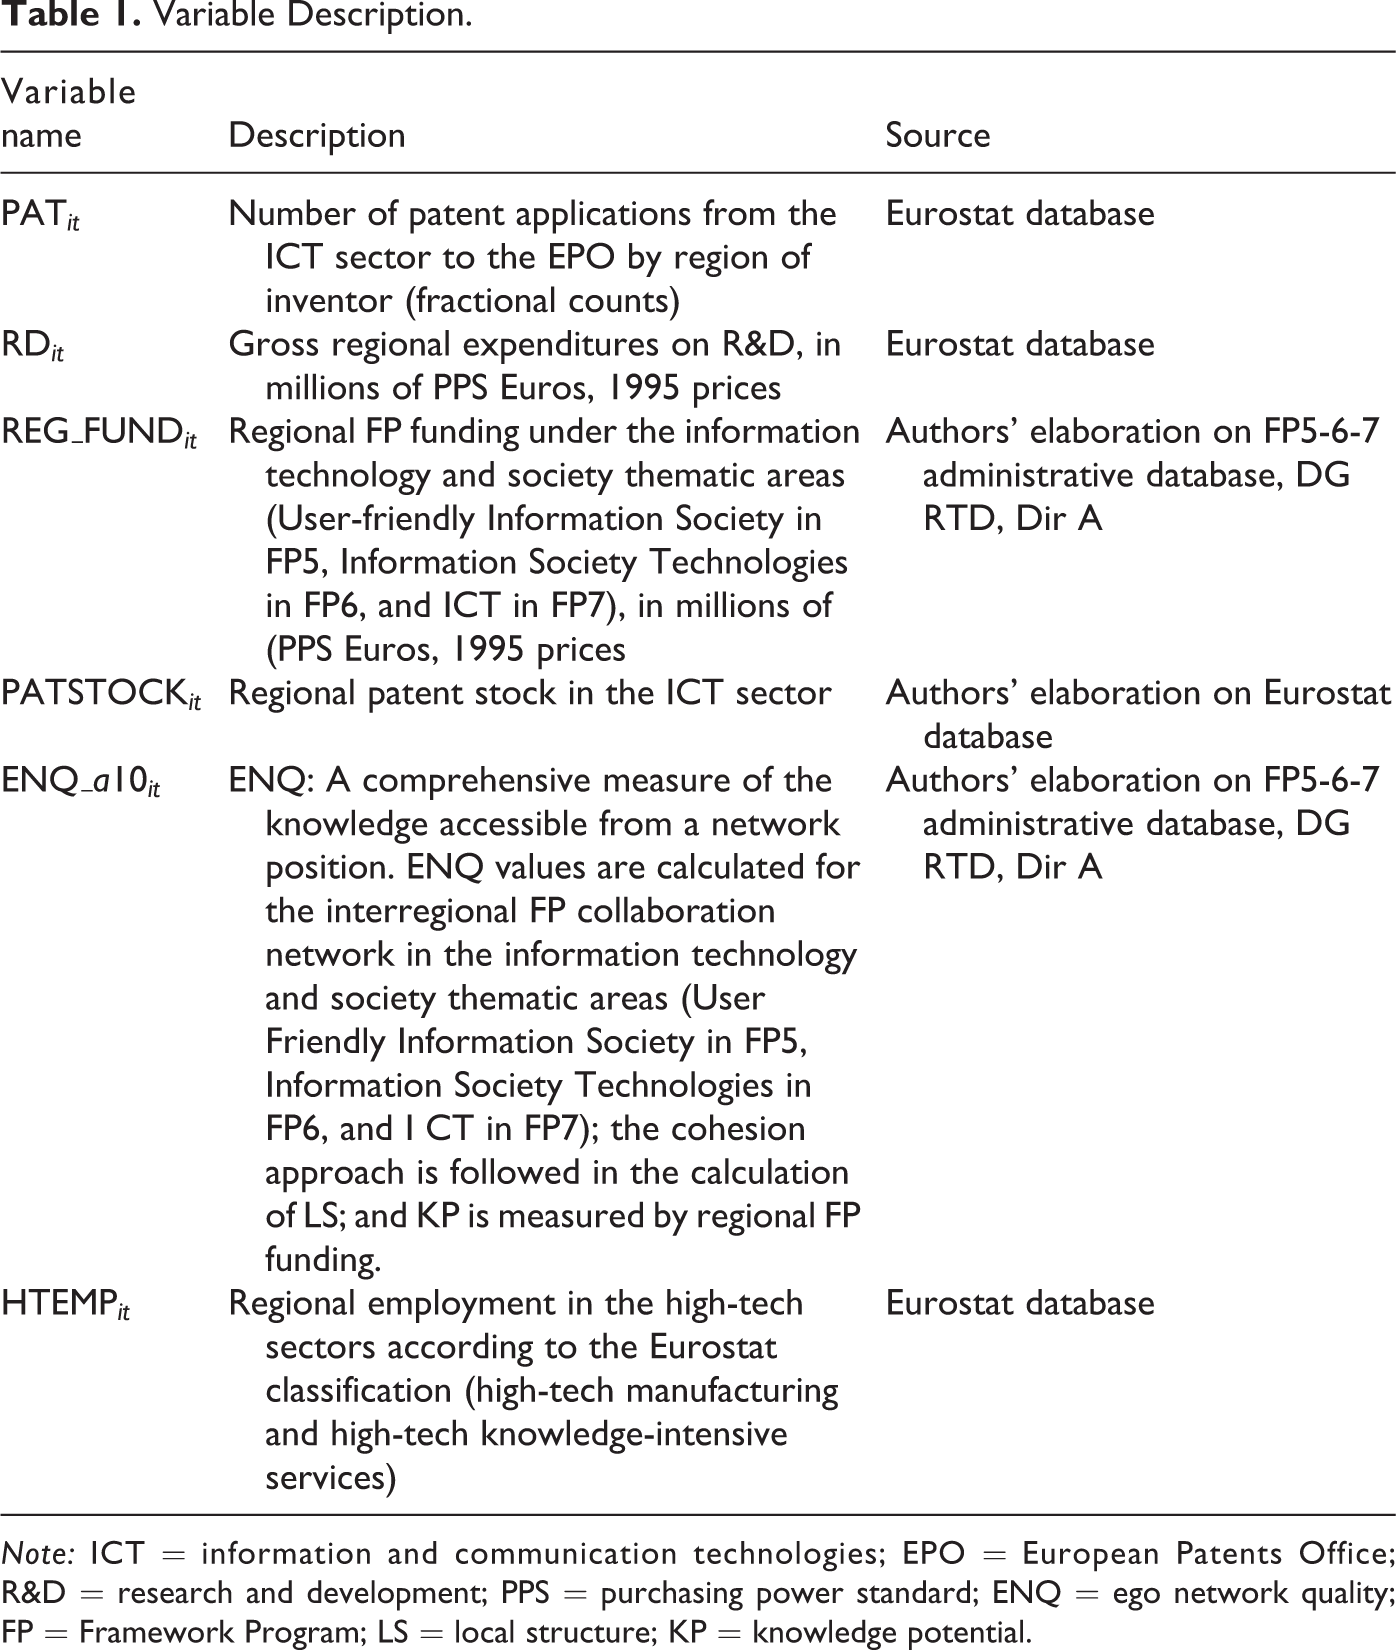
Note: ICT = information and communication technologies; EPO = European Patents Office; R&D = research and development; PPS = purchasing power standard; ENQ = ego network quality; FP = Framework Program; LS = local structure; KP = knowledge potential.
Variable Descriptive Statistics.
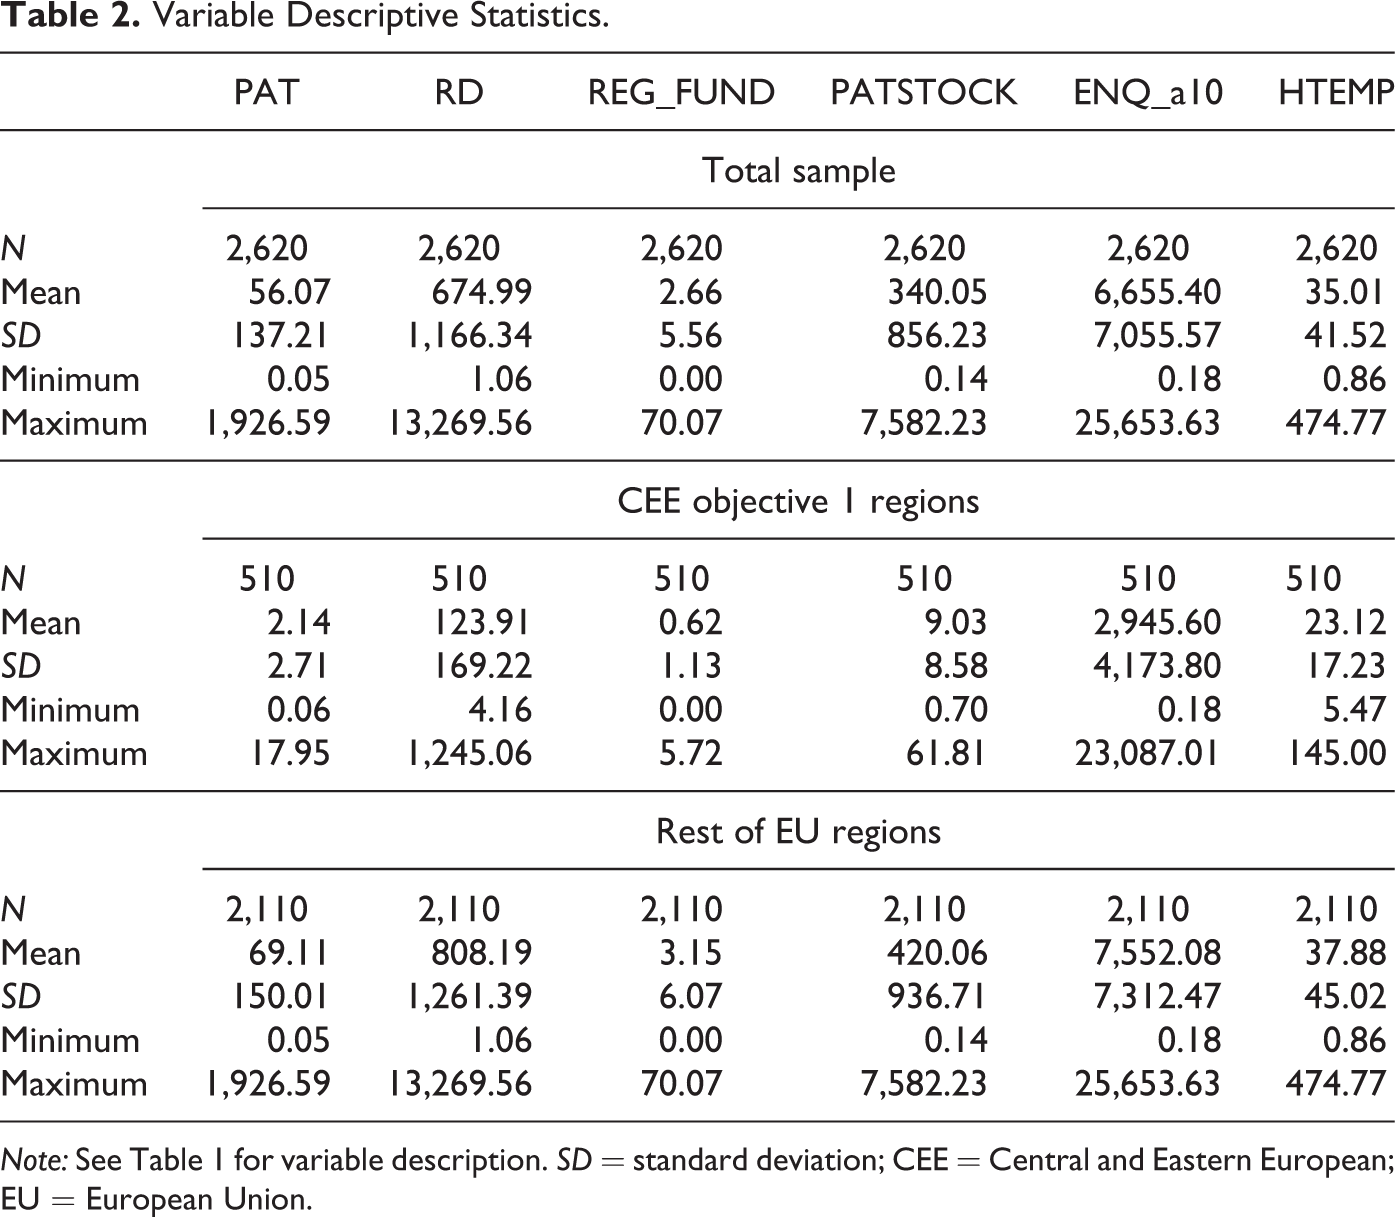
Note: See Table 1 for variable description. SD = standard deviation; CEE = Central and Eastern European; EU = European Union.
In what follows, some exploratory analysis is provided with respect to our basic variables. Figure 1 shows the evolution of patenting activity in CEE objective 1 regions and the rest of the EU regions in the sample. First, it is evident form the figure that there is a magnitude difference between the two categories of regions in favor of rest of the EU regions. On the other hand, we observe an increasing trend for CEE objective 1 regions while a decreasing one for the other regions, marking a catch-up process in the former. This is reinforced by the relative patenting activity (see the right axes), however, the relative patenting intensity of CEE objective 1 regions is still only at 5–6 percent of that of the rest of the EU regions.
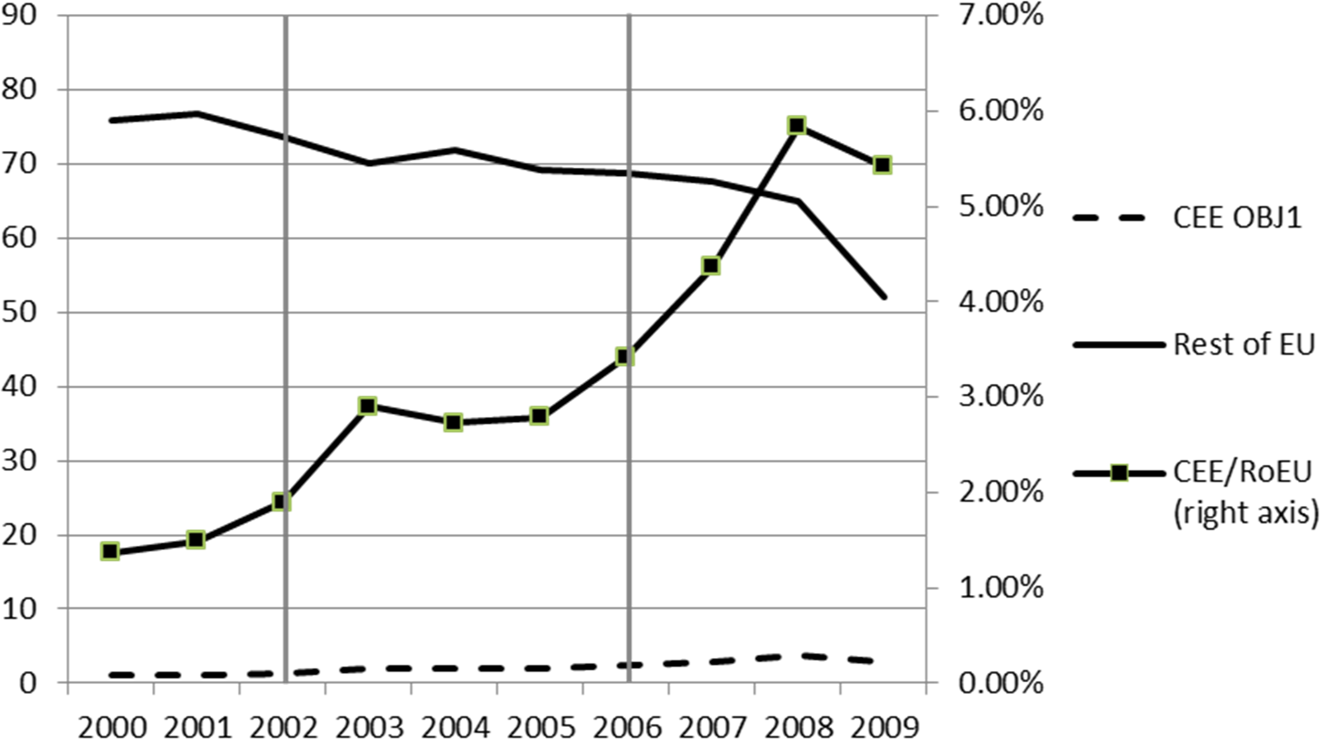
Average and relative patenting activity in Central and Eastern European objective 1 and rest of European Union regions (information and communication technology).
Figure 2 shows average regional funding for CEE objective 1 and rest of the EU regions in the sample as well as the relative position of CEE objective 1 regions compared to the rest of regions in the EU. It is also apparent that CEE objective 1 regions acquire far less funding through FP projects than other EU regions. However, they show an increasing trend in this respect resulting in a catch-up process through the period between 2000 and 2006. In 2006, these lagging regions acquired on average 25 percent of the FP funding realized in other regions. From 2006 to 2009, however, the relative position of the CEE objective 1 regions is worsening and rest of the EU regions acquire still almost five times more funding at the end of the observation period. The vertical bars mark the turning points between different FPs. During FP5 (although the period in the figure is truncated for this FP), we observe an increasing trend both for CEE objective 1 regions and rest of the EU regions. Through FP6, though, this trend breaks for the rest of the EU regions and remains for CEE objective 1 regions while in FP7 funding stagnates (and even decreases slightly for CEE regions).
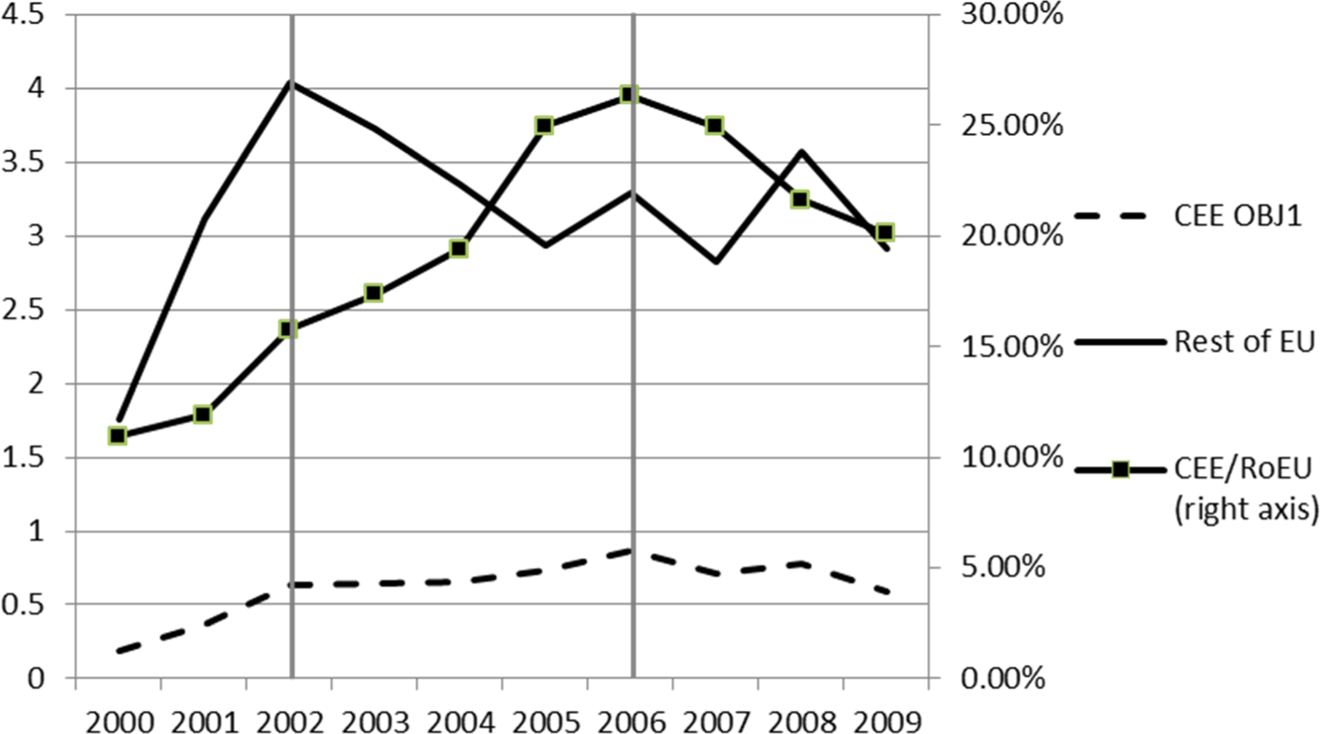
Average and relative Framework Program funding in Central and Eastern European objective 1 and rest of European Union regions (information and communication technology).
Turning to the ENQ index, Figure 3 shows how the average ENQ indices evolved over our sample period. Rest of the EU regions step ahead of their CEE objective 1 partners with respect to their ENQ index over the whole period, while the difference in absolute terms increase in the middle of the period. Although the relative differences remain quite stable up to 2008 (slightly under 35 percent), there is a marked increase between 2004 and 2009 up to almost 50 percent. This shows that the relative position of CEE objective 1 regions in interregional knowledge networks improved significantly in the second half of the sample period but still remains at half of the rest of the EU regions. In addition, it is interesting to see the marked differences across different FPs. A heavily increasing trend in FP5 breaks under FP6 and there is a sharp drop under FP7 for both samples. However, this latter two periods lead to the catch up for CEE objective 1 regions as the drop there is less marked.
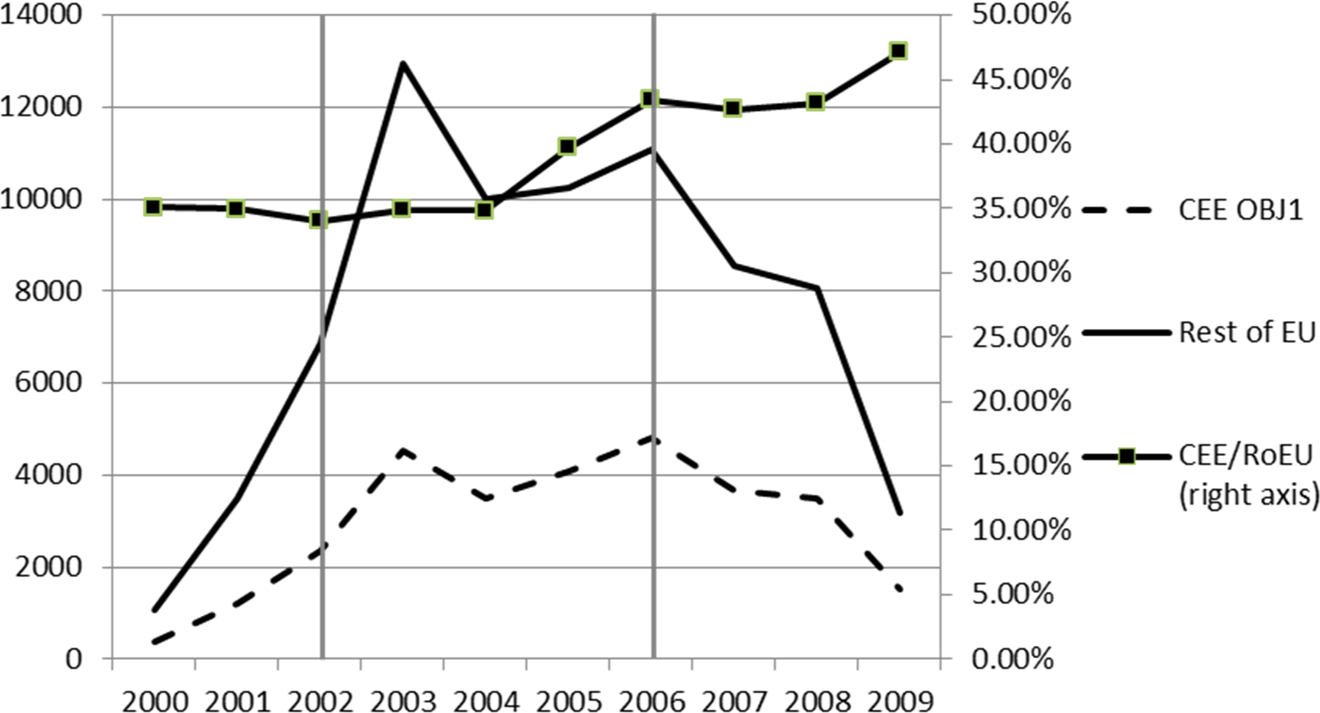
Average and relative ego network quality index (ENQ_a10) of Central and Eastern European objective 1 and rest of European Union regions (information and communication technology).
With respect to the two subindices (KP and LS, capturing the properties of the direct neighborhood of the regions in the sample), we can see that CEE objective 1 regions could increase their position significantly according to their LS, from around 35 percent to over 50 percent at the end of the sample. In other words, these regions tend to reach more favorable positions in interregional knowledge networks with respect to the connectedness of their neighborhood: they are better connected in the sense that they are surrounded by more intensive collaboration structures, getting more similar in this respect to other EU regions in our sample. In the case of KP, we observe a maintained difference between CEE objective 1 and rest of the EU regions over the sample period. This shows that the direct partners of CEE objective 1 regions in FP collaborations tend to possess less knowledge (proxied by FP funding). This can be explained by the typical network formation principle that nodes with some characteristics (in our case less knowledge) tend to connect to nodes with similar characteristics. On the other hand, we observe a relative increase in the KP scores of CEE regions, reaching 40–45 percent at the end of the sample. Overall, we can conclude that the relative catch-up process of CEE regions in terms of their ENQ index can be traced back to the relative improvement in their KP and local connectivity scores. In other words, their better position measured at the end of the sample relative to their initial positions stems from both more knowledge at their direct partners (which can be a result of either higher knowledge at already existing partners or forming connections to more knowledgeable ones) and a more intensive collaboration structure among the partners.
Figure 4 shows the spatial distribution of regional patent counts and ENQ values for CEE objective 1 regions calculated for 2008. Note that non-objective 1 CEE regions (mostly the capital regions) are not depicted in this figure. There are marked differences between the countries and also the regions. Poland, the Czech Republic, and the Baltic countries show above average regional ENQ values and they are also over average in patenting. Overall, there seems to be a positive correlation between the ENQ and patenting in these regions.
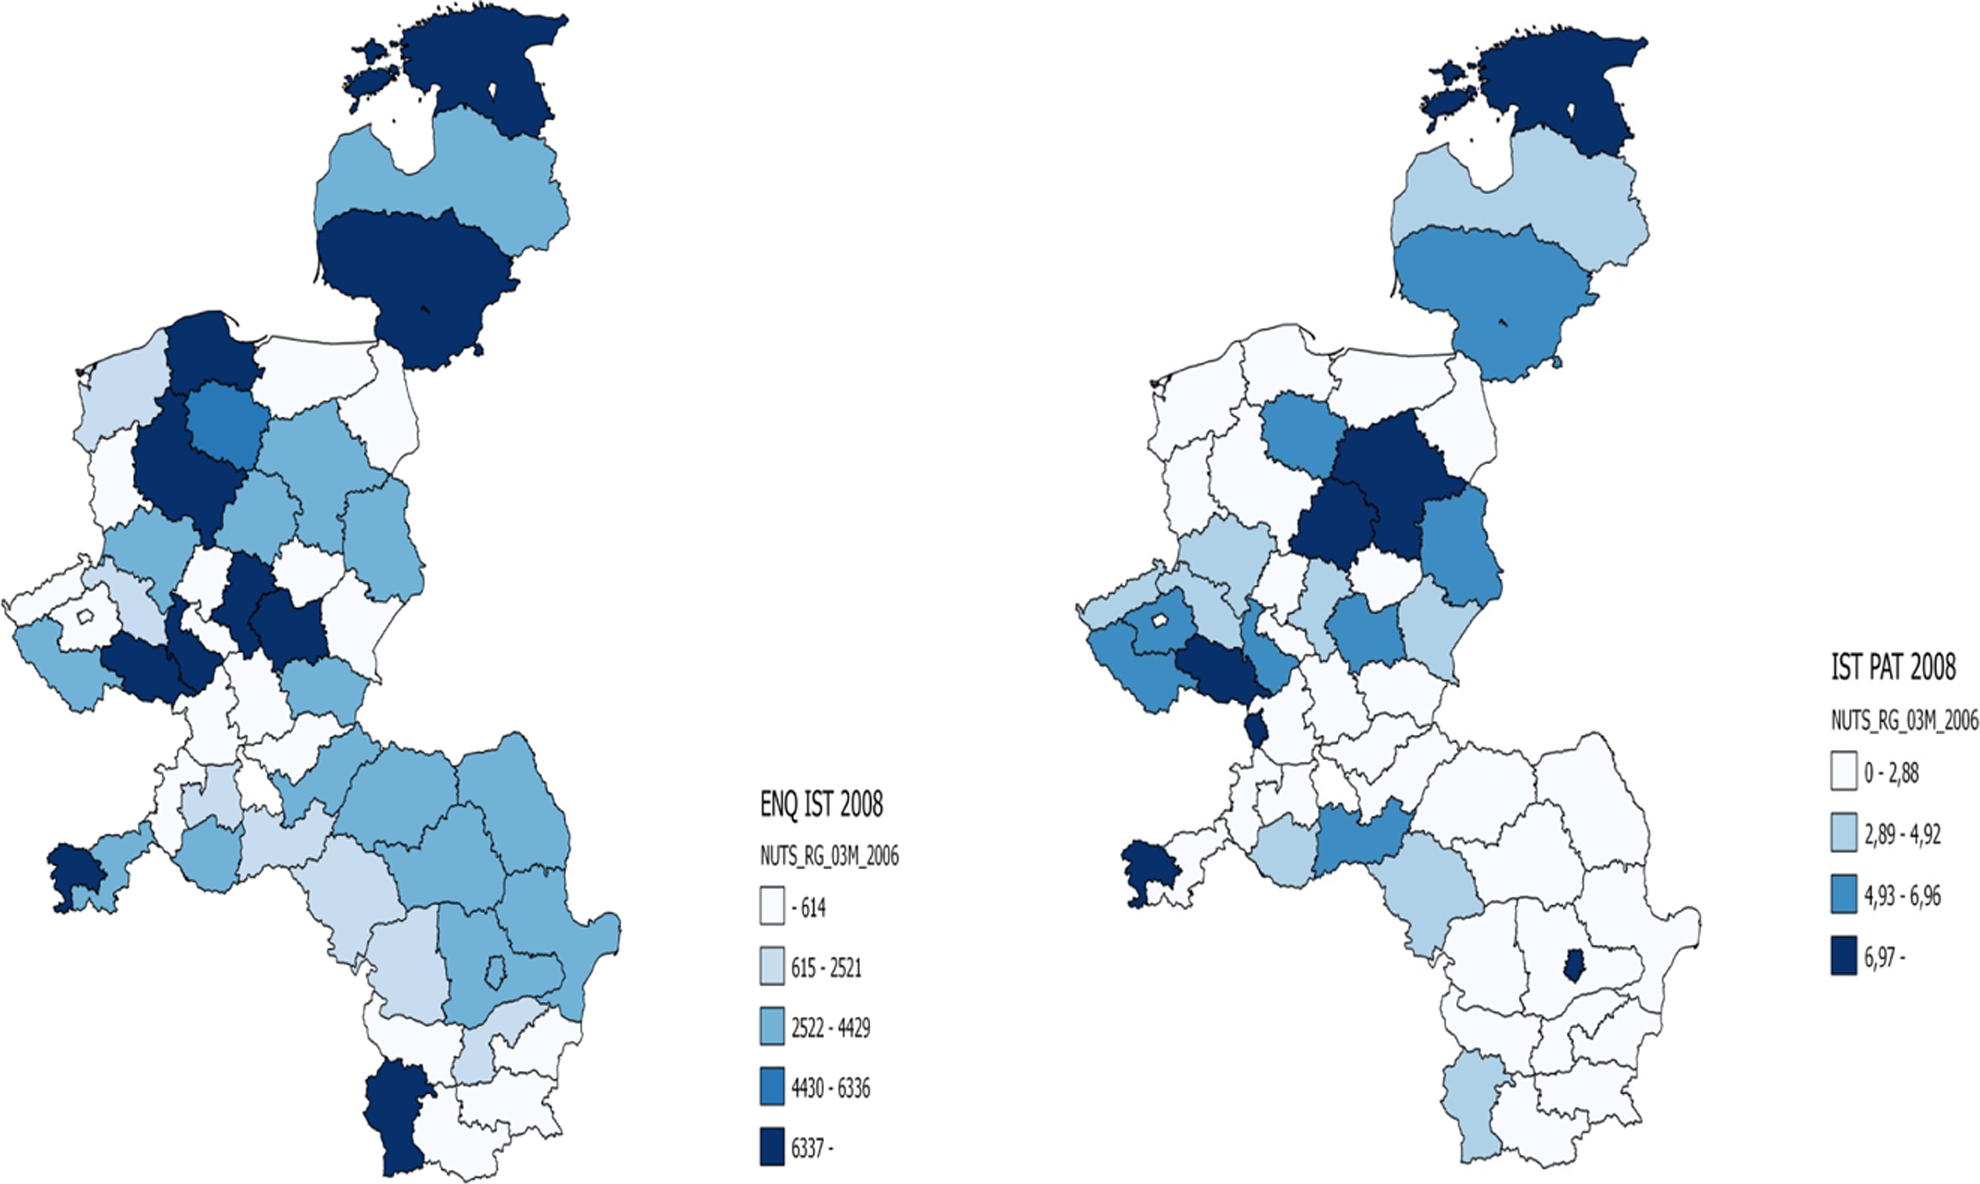
The spatial distribution of ego network quality index values and patent counts in Central and Eastern European objective 1 regions (information and communication technology).
Empirical Analysis
Previous studies reported that the impact of EU FPs’ research subsidies on scientific publication follow different patterns in peripheral regions of the EU compared to the rest of the EU. We assume in this article that the generally missing impact of EU FP participation on regional patenting is also related to a spatial regime effect. To this aim, we separated the EU regions into two subsamples: CEE lagging (objective 1) regions and rest of EU (Western and Southern) regions, the latter category also containing non-objective 1 regions in the CEE countries (practically the most developed capital regions). As shown in the preceding section, objective 1 regions in the recently joined CEE countries indeed follow different patterns in patenting and also in FP participation.
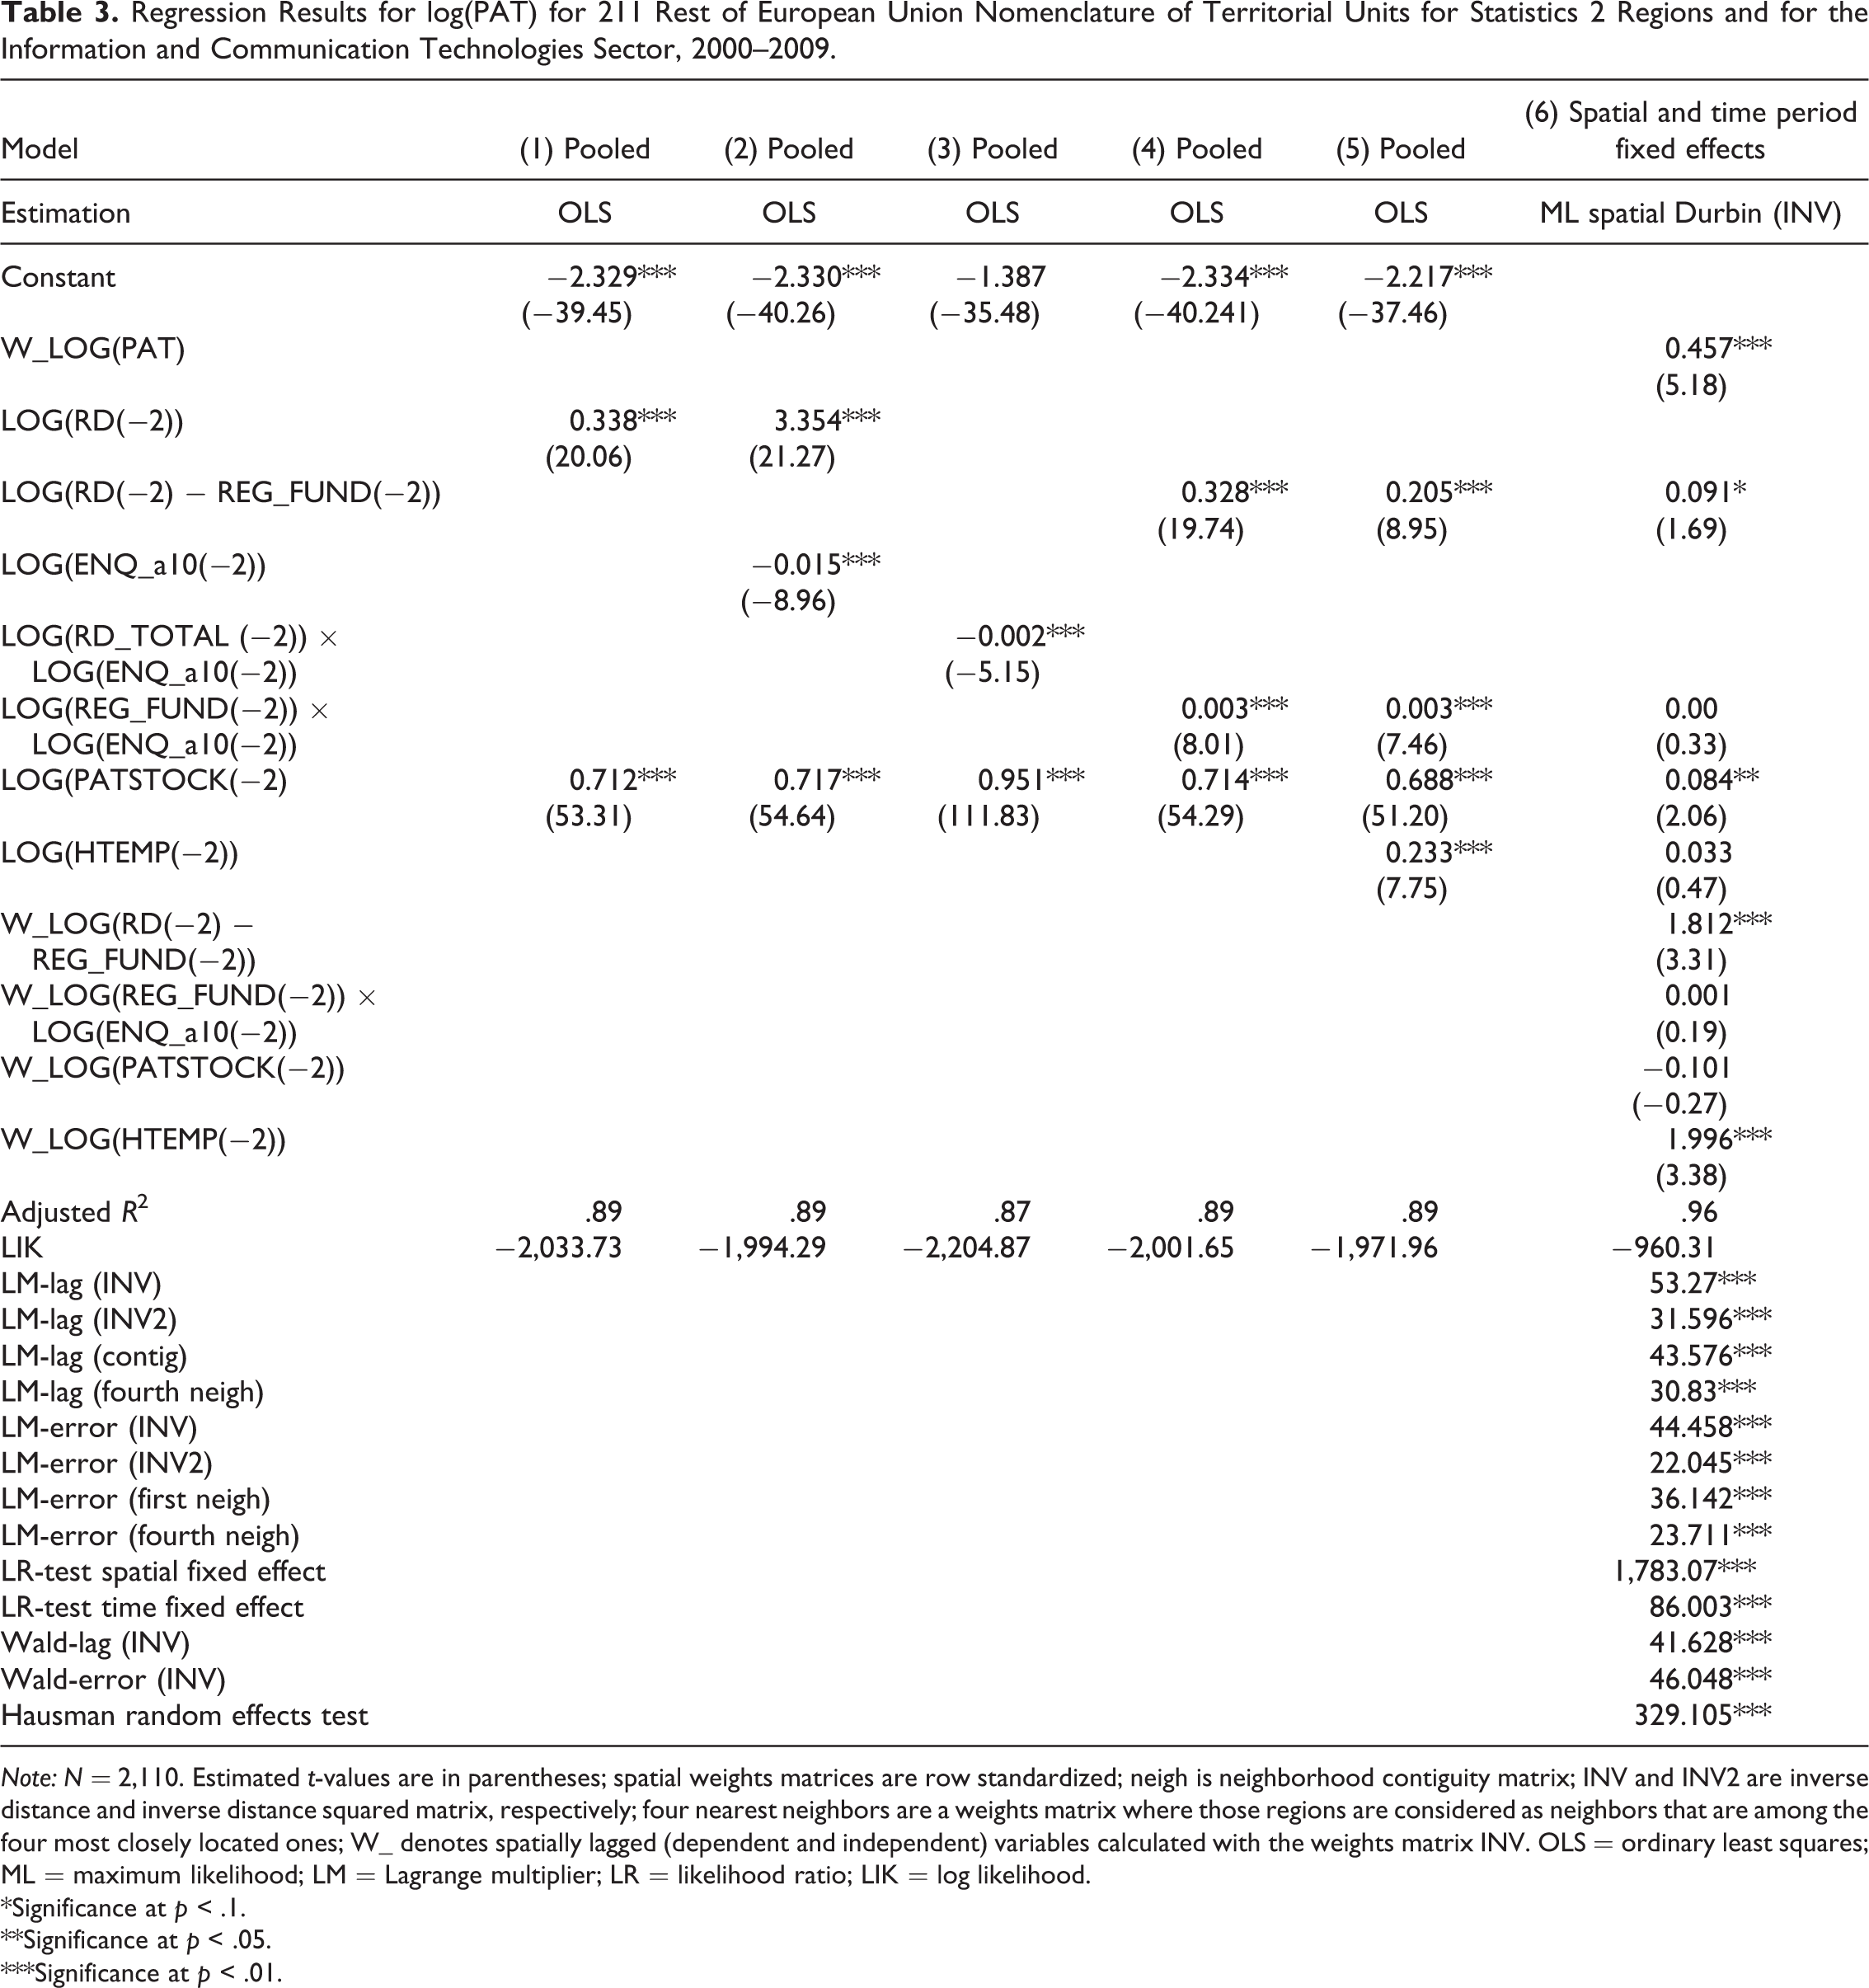
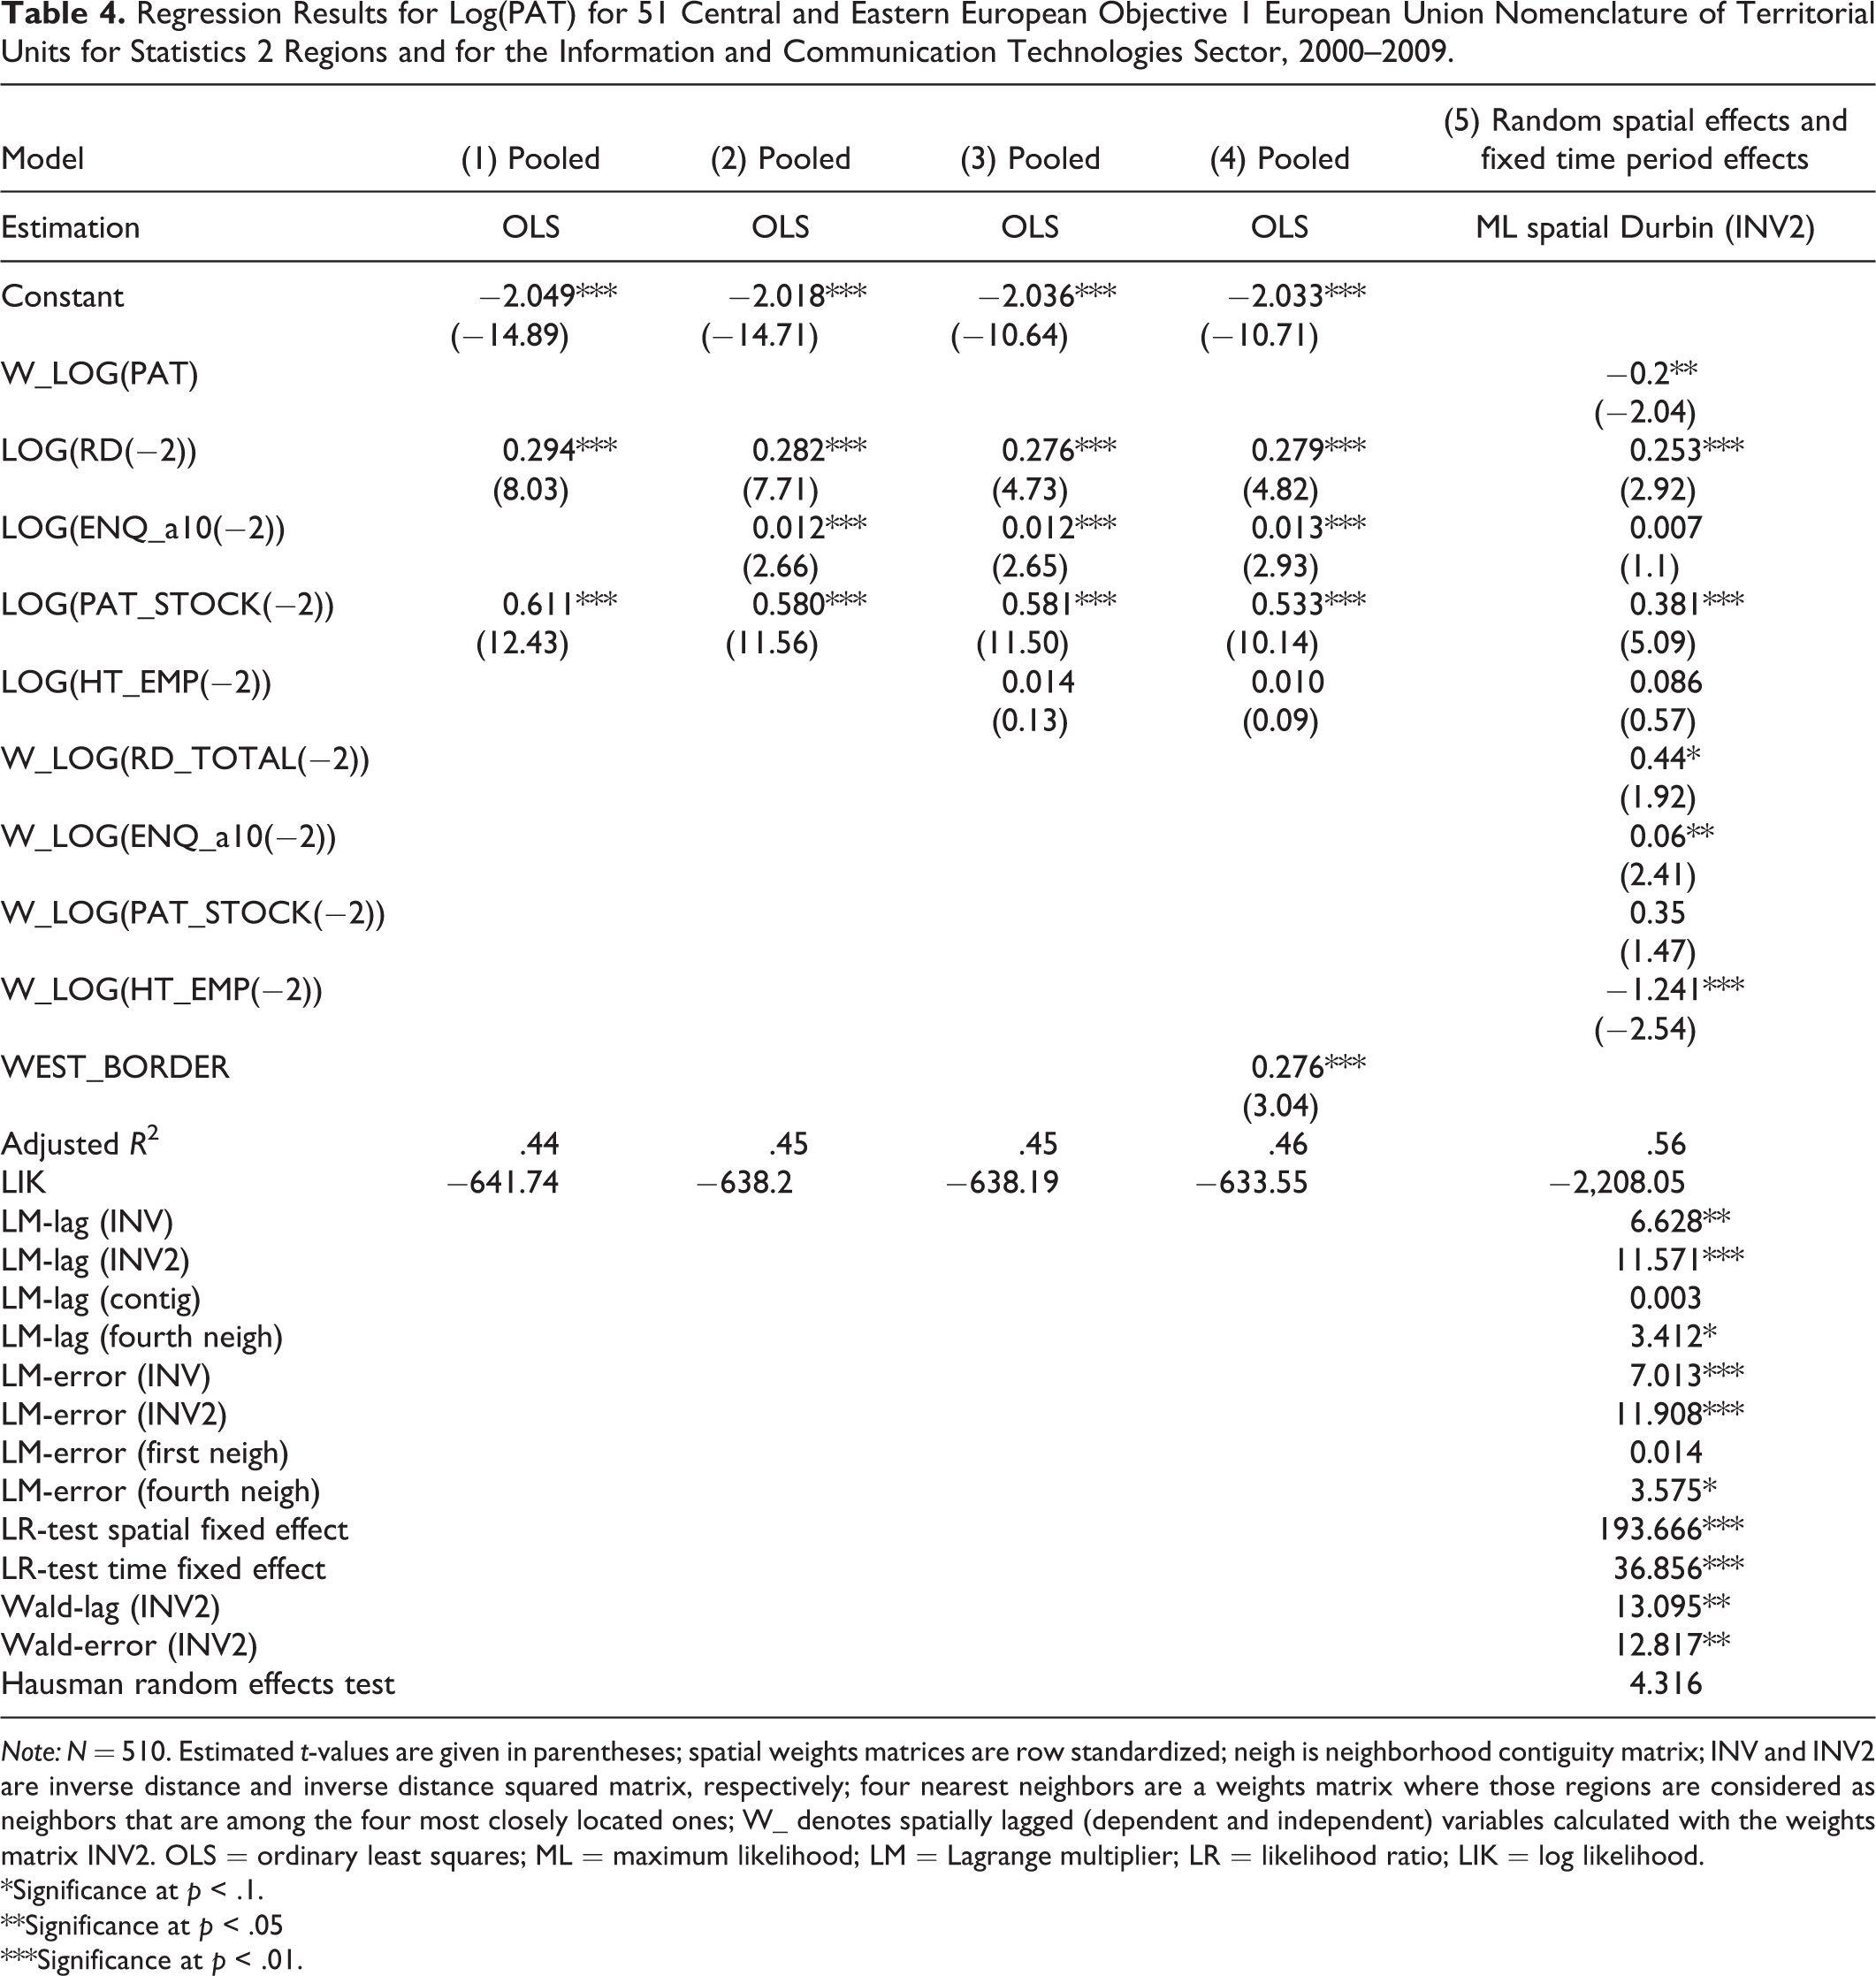
Tables 3 and 4 present the results of the regression analysis for regions in the two subsamples of the EU for the ICT area. We first study the regression outputs for the rest of the EU regions then the results for CEE objective 1 regions. The usual two-year time lag between inputs to regional knowledge production and patenting are applied. 10 In model 1 of Table 3, the two main variables of equation (2; R&D expenditures and stock of patents) appear with the expected positive sign and also with high significances. The fit of the regression is considerably high (adjusted R 2 equals .89) especially taking into account the panel nature of the data. Models 2–4 document the results of our exploration of the role of extraregional knowledge flows mediated by the FP networks. The negative and significant coefficient of the ENQ variable in model 2 is a consequence of the strong correlation between log(RD) and log(ENQ_a10). An alternative specification is model 3 where log(RD) interacts with log(ENQ_a10). The negative and significant coefficient indicates that the productivity of R&D expenditures in patenting is negatively affected by FP participations in this ordinary least squares specification. In model 4, a different setup is followed: the interaction of Log(REG_FUND), which is the funding received through FP projects in the region under the ICT area, and log(ENQ_a10), which is significant and positive. Considering the higher regression fit of model 4, the results so far thus suggest that knowledge flows from FP networks positively influence the productivity of FP research subsidies in regional patenting. However, it should be kept in mind that up to this point neither panel effects nor spatial dependence has been taken into consideration. In model 5, HTEMP enters the equation as an additional variable with a significant and positive coefficient.
Regression Results for log(PAT) for 211 Rest of European Union Nomenclature of Territorial Units for Statistics 2 Regions and for the Information and Communication Technologies Sector, 2000–2009.
Note: N = 2,110. Estimated t-values are in parentheses; spatial weights matrices are row standardized; neigh is neighborhood contiguity matrix; INV and INV2 are inverse distance and inverse distance squared matrix, respectively; four nearest neighbors are a weights matrix where those regions are considered as neighbors that are among the four most closely located ones; W_ denotes spatially lagged (dependent and independent) variables calculated with the weights matrix INV. OLS = ordinary least squares; ML = maximum likelihood; LM = Lagrange multiplier; LR = likelihood ratio; LIK = log likelihood.
*Significance at p < .1.
**Significance at p < .05.
***Significance at p < .01.
Regression Results for Log(PAT) for 51 Central and Eastern European Objective 1 European Union Nomenclature of Territorial Units for Statistics 2 Regions and for the Information and Communication Technologies Sector, 2000–2009.
Note: N = 510. Estimated t-values are given in parentheses; spatial weights matrices are row standardized; neigh is neighborhood contiguity matrix; INV and INV2 are inverse distance and inverse distance squared matrix, respectively; four nearest neighbors are a weights matrix where those regions are considered as neighbors that are among the four most closely located ones; W_ denotes spatially lagged (dependent and independent) variables calculated with the weights matrix INV2. OLS = ordinary least squares; ML = maximum likelihood; LM = Lagrange multiplier; LR = likelihood ratio; LIK = log likelihood.
*Significance at p < .1.
**Significance at p < .05
***Significance at p < .01.
From the bottom part of model 6, it is clear that both spatial lag and spatial error dependence are present no matter which spatial weight matrix is used in the tests. Since the strongest effect is observed with the inverse distance (INV) weights matrix, this matrix will be used in spatial econometric estimations. The significant LR tests (bottom part of the column of model 6) support the extension of model 5 with spatial and time period (two-way) fixed effects. On the other hand, the significant Wald lag and Wald error test statistics of model 6 indicate that both the spatial lag and the spatial error model should be rejected in favor of the spatial Durbin model. Thus, after controlling for unmeasured regional and temporal characteristics as well as spatial dependence, model 6 provides the final regression results.
Although the size of the parameters of the R&D and patent stock variables decreased in model 6, these two parameters are still significant. One important change in model 6 compared to model 5 is the now insignificant parameter of the variable Log(REG_FUND) × Log(ENQ _a10). This result is a strong indication that in rest of the EU regions, knowledge flows from FP networks do not play a sensible role in patenting. Further essential results are the significant and positive parameters of the spatially lagged dependent variable and the spatially lagged R&D and high technology employment variables. These results together with the insignificant FP network effects (note that both Log(REG_FUND) × Log(ENQ_a10) and W_Log(REG_FUND) × Log(ENQ_a10) are insignificant) indicate that more developed regions in the Western and Southern part of the EU tend to rely on localized knowledge inputs in patenting instead of extraregional knowledge communicated via FP research networks.
Table 4 reports the regression results for CEE objective 1 regions. In model 1, parameters of the two major variables are positive and significant, similar to what is observed for the rest of the EU regions. However, there are two important differences in the results of model 1 in the periphery compared to the results of the same model for the rest of the EU. First, the estimated parameters of the R&D and patent stock variables are smaller, and second, regression fit is apparently lower (adjusted R 2 is .44 in Table 4 compared to .89 in Table 3). The other important difference is the highly significant and positive ENQ parameter for CEE objective 1 regions in model 2. The significant FP network impact remains unchanged after the introduction of the high technology employment variable in model 3. It is also a meaningful difference between model 3 in Table 4 and model 5 in Table 3 that for CEE objective 1 regions, the estimated parameter of the high technology employment variable is negative and insignificant suggesting limited roles of the presence of local industry in patenting. The positive and significant parameter of the west border dummy in model 4 clearly indicates that there are important unmeasured differences in C EE in innovation. Regions neighboring old member states (ceteris paribus) appear to use local resources more efficiently than the rest of the CEE regions.
The spatial statistics in model 5 indicates the presence of both spatial lag and spatial error dependence while LR panel tests guide us to extend this model with spatial and time period fixed effects. The insignificant Hausman spatial random effect test on the one hand and the significant Wald lag and Wald error tests in model 5 point toward the random spatial and fixed time period effect spatial Durbin model. Model 5 depicts regression outputs when unmeasured regional and time period effects as well as spatial dependence are controlled for.
A comparative analysis of the outputs of the final models in Tables 3 and 4 documents different patterns in the absorption of local and network knowledge in the two areas of the EU. Intense spatial dependence among regions indicates that the territorial unit of interactions in innovation clearly extends regional borders in both large areas of Europe. Indeed, knowledge flows from R&D in proximate regions are even more influential on innovation than within-region knowledge transfers as indicated by the systematically larger sizes of the parameters of spatially lagged R&D expenditures than those of regional R&D expenditures in model 6 of Table 3 and model 5 of Table 4.
However, despite the similarities, there are important differences between the territorial patterns of innovation in CEE and rest of EU. The first difference is related to the sizes of territories where interactions in innovation take place. Steep distance decay of INV squared weights in the INV2 matrix compared to moderately decreasing INV weights in the INV matrix suggests that the territory of interactions is wider in rest of EU than in CEE. Second, territories in rest of EU are more homogeneous: the positive and significant parameters of W_log(PAT) and high technology employment clearly indicate the advantages of concentration. Contrary to this innovation in CEE is less agglomerated, despite its less extensive territories: the negative signs of W_log(PAT) and W_Log(HTEMP) imply a chessboard-like structure where relatively better performing regions are surrounded by less innovative regions. Further differences with respect to territorial patterns of interactions are suggested by the larger and more significant parameters of the R&D and lagged R&D variables in rest of EU. This suggests more intensive localized R&D-related interactions in old member states than in countries accessed the EU about a decade ago.
With respect to the absorption of network knowledge, an important difference between the two large areas of Europe arises when one studies the size and significance patterns of the ENQ variables in Tables 3 and 4. Insignificant parameters of the two ENQ variables (i.e., Log(ENQ) and W_Log(ENQ)) in Table 3 indicate that in rest of EU learning from FP networks is not among the essential inputs of innovation. Contrary to this, the significant and positive parameter of W_Log(ENQ) in C EE is a clear sign of the absorption of FP network knowledge by firms from their territory of innovation. This is an important finding of our study, as it supports the second hypothesis stated in the introduction.
Robustness Issues
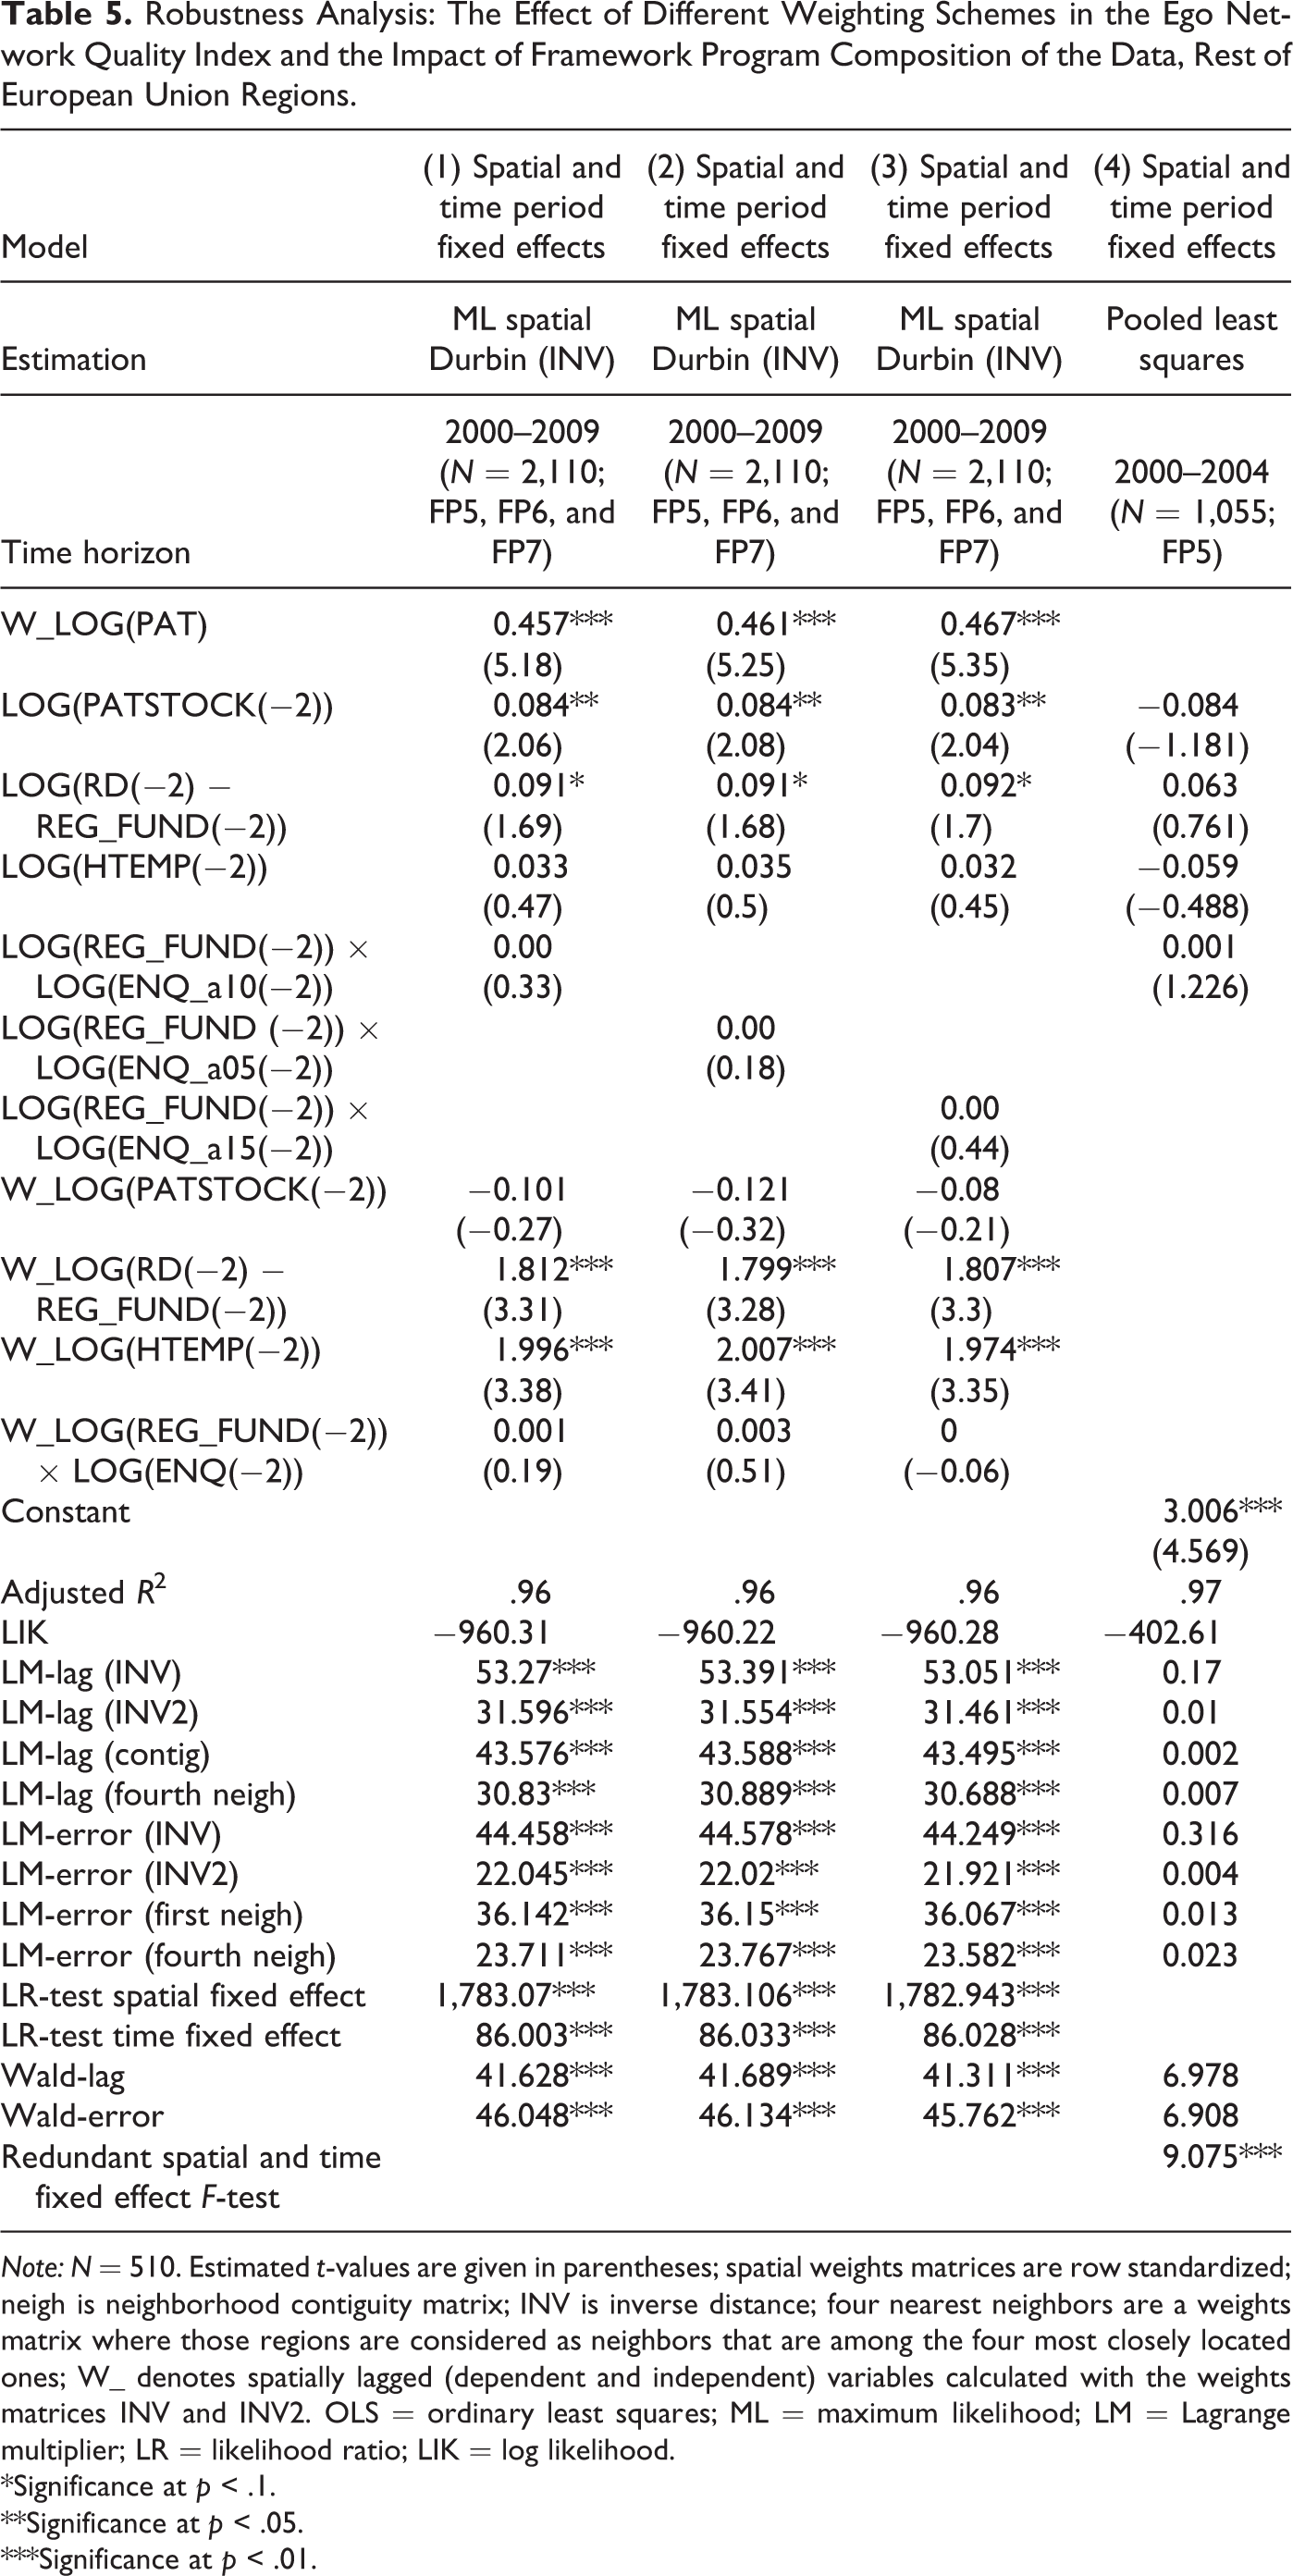
Empirical findings of the fourth section are important, as they suggest that there is a spatial regime effect in network knowledge absorption in Europe. However, these results might be sensitive to the particular construction of the applied ENQ index, which plays a central role in our analysis. Also changes in the philosophies, structures, and regulations of subsequent EU FPs might cause differences with respect to regional absorption of network knowledge (Maggioni, Uberti, and Nosvelli 2014), and our analysis based on data spanning over three consecutive FPs might mask these cross-program differences. In this section, we carry out a series of robustness analyses addressing first, whether our results are sensitive to the particular construction of the ENQ index, and second, whether the above-indicated changes in EU FP programs might cause differences in regional network knowledge absorption.
This article uses the ENQ index in order to capture the available knowledge from a specific point in the network. In this attempt, it combines node characteristics (knowledge levels) with structural characteristics of the network (intensity of interactions and distance among partners). The main aim is to reflect available knowledge. If network structure was not taken into account, we could simply add up the knowledge levels of direct and indirect partners. As the intuition behind the ENQ index is to consider also network structure, we use two dimensions of weighting: partners’ knowledge levels are weighted by (i) the intensity of interactions among them and (ii) by the distance of partners. Note that the LS subindex is designed in a way that it takes the value of one exactly if a neighborhood has the least possible number of connections. 11 This way the LS subindex is a weighting factor reflecting the intensity of interactions: the more interactions we observe in a neighborhood, the higher the weight attached to the knowledge available from this neighborhood. On the other hand, we also weight the KP subindex with the distance decay parameter Wd . This way the ENQ is structured around the concept of summing up partners’ knowledge and weighting them with the structure of the network.
An important question is how the choice of these weighting schemes alters our results provided using the ENQ index. Sebestyén and Varga (2013b) give a detailed description of some robustness analyses with respect to the LS and distance weighting. With respect to LS, they ask whether a drastically different approach, namely, using the number of connected components as the weighting factor leads to significant changes. The analysis shows that irrespective of extreme network structures (star topologies), there is no significant difference. With respect to distance, the author also analyzes different possibilities and shows that the choice of the specific distance decay function has only a shift effect on ENQ values under realistic network structures: the relative values are unaffected.
In this article, we add a third kind of robustness check to the analysis, which focuses on the way knowledge levels and the intensity of collaboration are combined from neighborhood to neighborhood. We can rewrite equation (3) in a slightly different form:
This formulation draws attention to the fact that our definition of the ENQ index technically provides a substitution between knowledge levels (KP) and interaction intensity (LS) within a neighborhood: less knowledge may be compensated by more intensive collaboration. 12 In the previous analyses and the formulation in equation (3), we used the assumption that a = b = 1. Altering these parameters, we may attach higher and lower weights to the two components within each neighborhood. Keeping b = 1 in the following robustness tests, we analyze the effect of using a lower (a = 0.5) and higher (a = 1.5) relative weight for the LS subindex, so we check whether assuming a less or more significant role for the interconnectedness of the partners relative to their knowledge levels has a significant effect on our results.
Models 1–3 in Tables 5 and 6 present the result of the sensitivity analyses. The first column in both tables repeats the final results in Tables 3 and 4 with a = 1. The second and third columns in Tables 5 and 6 presents the model results for the cases of a = 0.5 and a = 1.5. As clearly seen in this tables, regression outputs are not affected significantly by the use of different elasticities. Models in the second and third columns follow very closely the main results of this article regarding both the estimated parameters and significances and different test statistics. This suggests that our results are not sensitive to different elasticities in ENQ.
Robustness Analysis: The Effect of Different Weighting Schemes in the Ego Network Quality Index and the Impact of Framework Program Composition of the Data, Rest of European Union Regions.
Note: N = 510. Estimated t-values are given in parentheses; spatial weights matrices are row standardized; neigh is neighborhood contiguity matrix; INV is inverse distance; four nearest neighbors are a weights matrix where those regions are considered as neighbors that are among the four most closely located ones; W_ denotes spatially lagged (dependent and independent) variables calculated with the weights matrices INV and INV2. OLS = ordinary least squares; ML = maximum likelihood; LM = Lagrange multiplier; LR = likelihood ratio; LIK = log likelihood.
*Significance at p < .1.
**Significance at p < .05.
***Significance at p < .01.
Robustness Analysis: The Effect of Different Weighting Schemes in the Ego Network Quality Index and the Impact of Framework Program Composition of the Data, Central and Eastern European Regions.
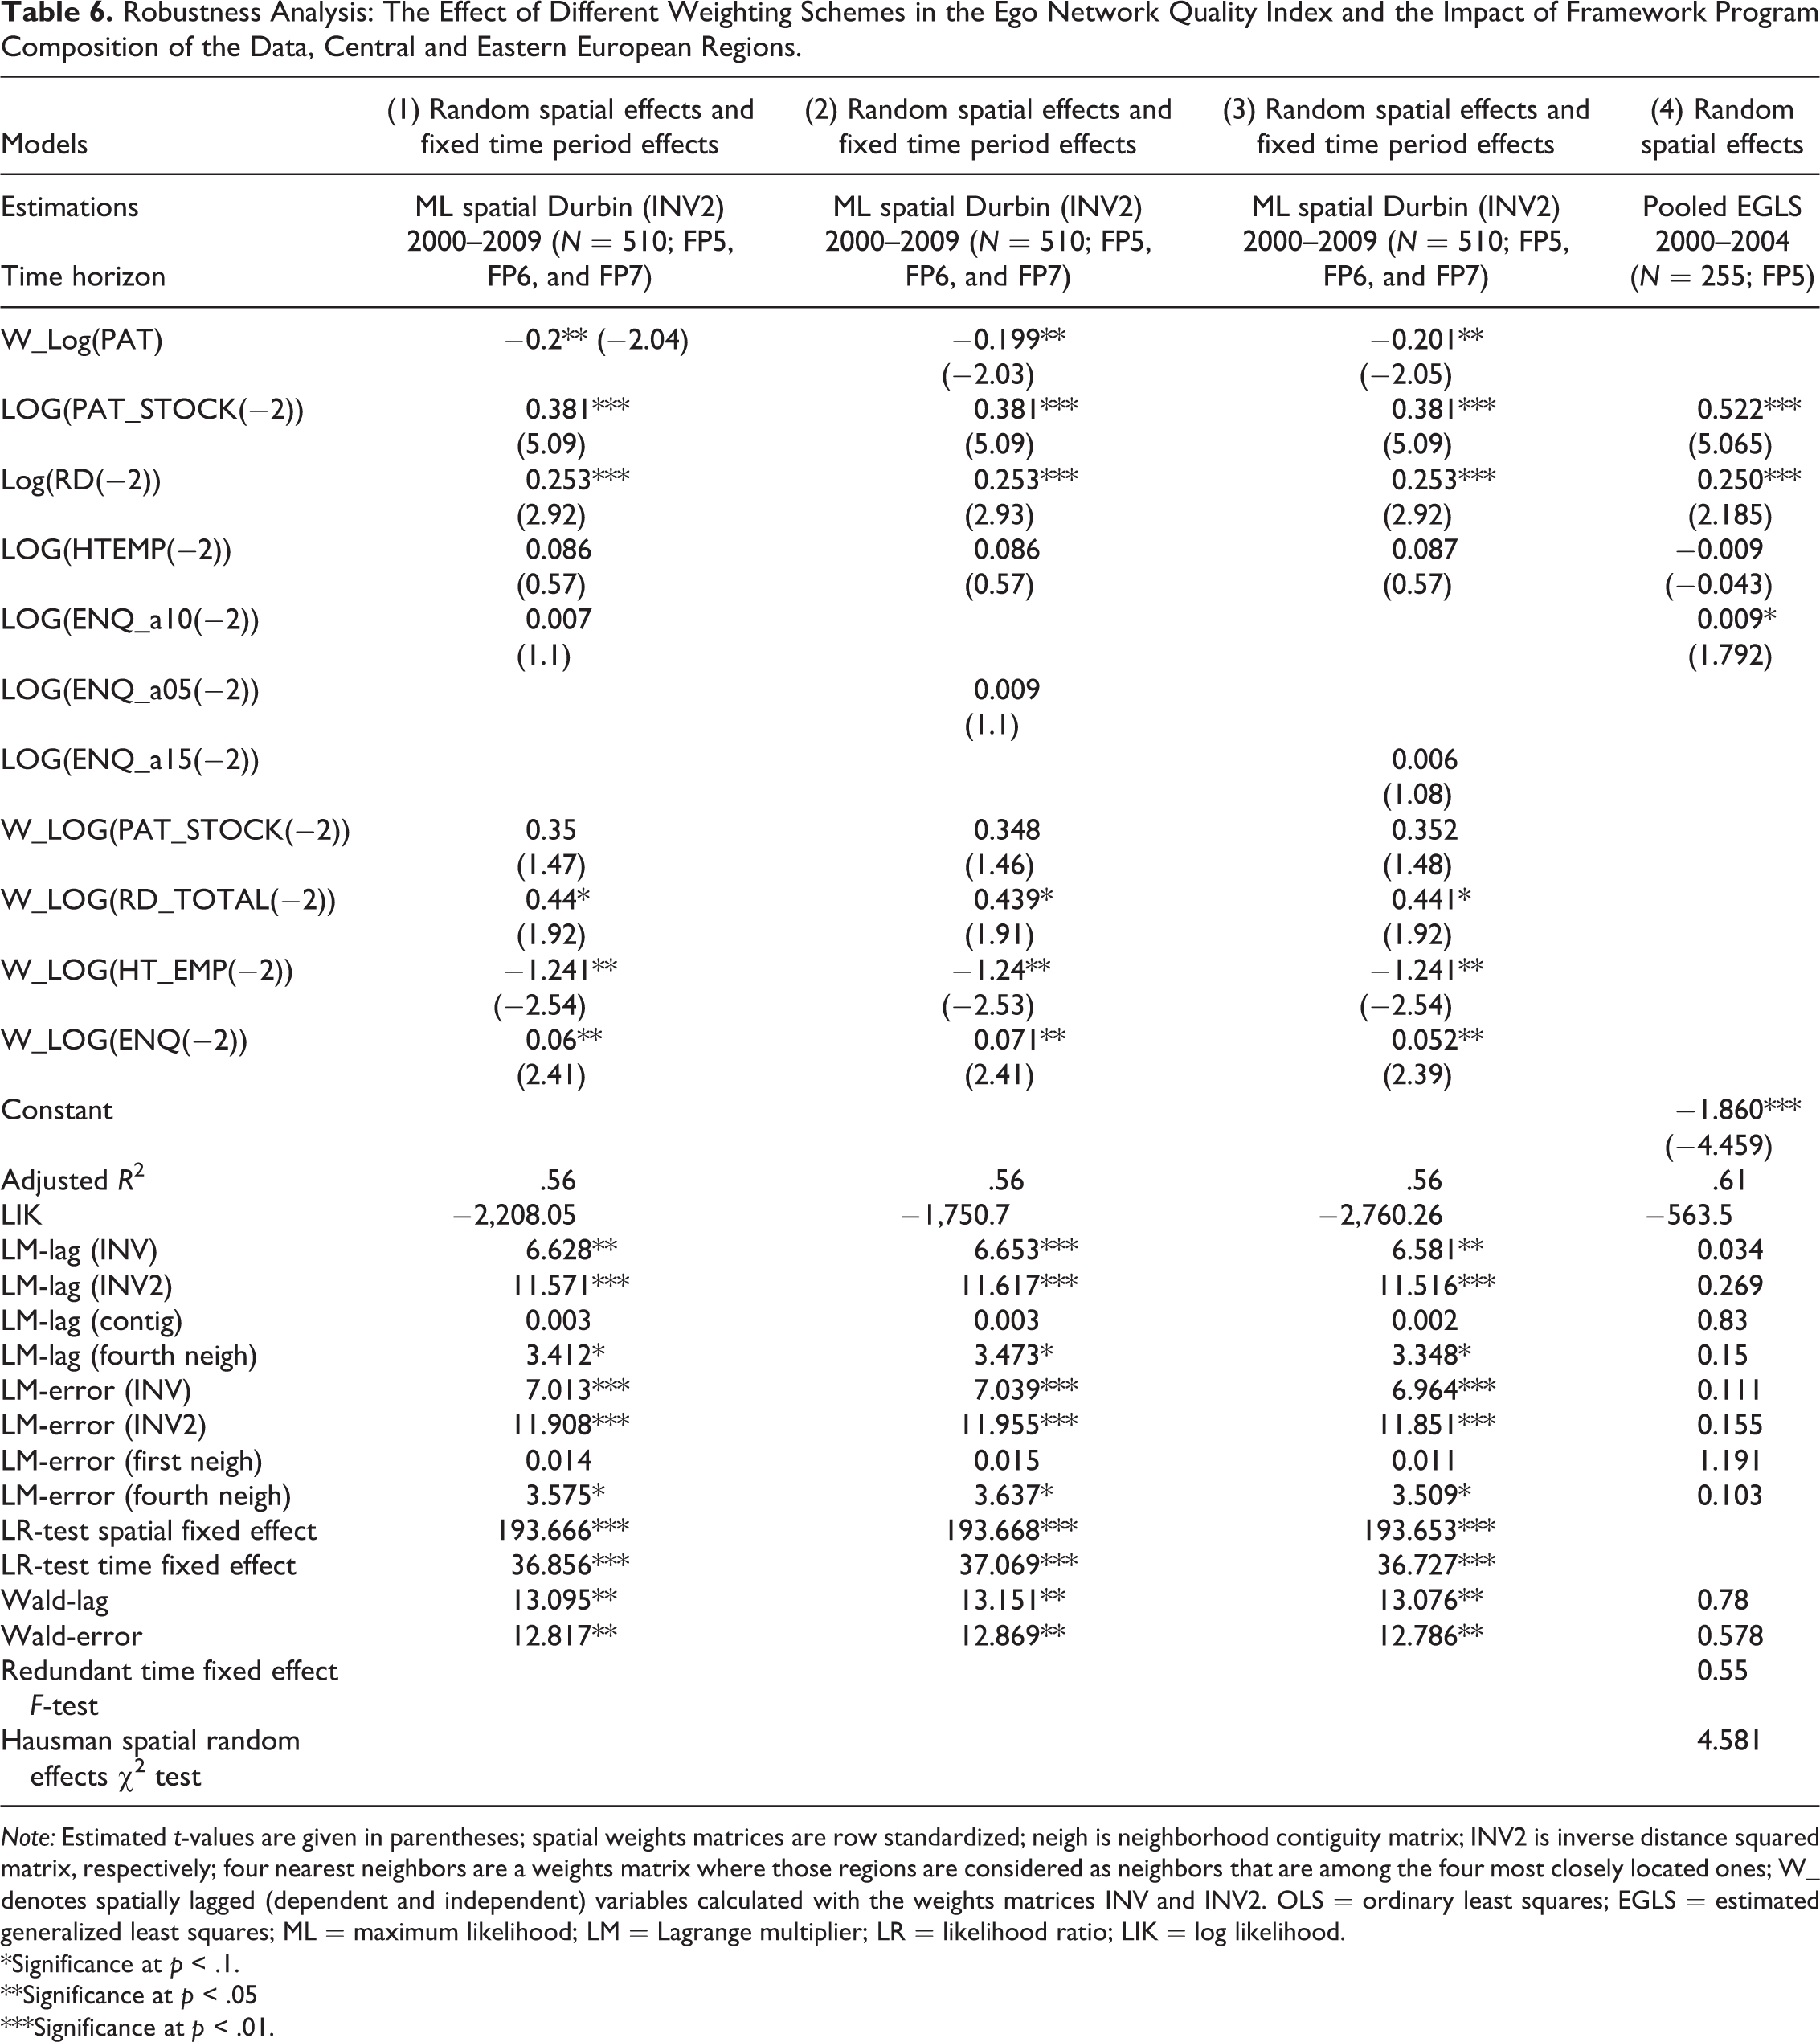
Note: Estimated t-values are given in parentheses; spatial weights matrices are row standardized; neigh is neighborhood contiguity matrix; INV2 is inverse distance squared matrix, respectively; four nearest neighbors are a weights matrix where those regions are considered as neighbors that are among the four most closely located ones; W_ denotes spatially lagged (dependent and independent) variables calculated with the weights matrices INV and INV2. OLS = ordinary least squares; EGLS = estimated generalized least squares; ML = maximum likelihood; LM = Lagrange multiplier; LR = likelihood ratio; LIK = log likelihood.
*Significance at p < .1.
**Significance at p < .05
***Significance at p < .01.
In the subsequent sensitivity analysis, we focus on the potential effect of differences in the designs of FPs on regression results. Maggioni, Uberti, and Nosvelli (2014) argue that the accession of CEE countries in 2004 and 2007 and the resulting changes in FP regulations from FP5 to FP6 (and FP7) altered network structures significantly. Here we assume that this change could have also affected the absorption of FP network knowledge. In order to test whether such structural change is present in the data, we now run separate regressions for FP5 (1998–2002) to compare the results with the findings of our original analysis. If regression outputs are significantly different for FP5 from the results related to the time frame of the three FP programs (i.e., the periods of FP5 [1998–2002], FP6 [2002–2007], and part of FP7 [2008–2009] as in Tables 3 and 4), we take this as an indication of the supposed structural change. We carry out our structural change analysis along three dimensions: variable structure in the KPF (which is then compared to our initial structures indicated in equations [2] and [6]–[11]), spatial dependence structure (compared to the structures described in equations [6]–[11]), and panel effects structure (in comparison with the outputs in Tables 3 and 4). While the first columns in Tables 5 and 6 present the results of the original analyses, the last columns of the same tables depict the findings with the separate FP5 regressions.
For rest of the EU regions, the comparison of the results in the fifth column of Table 5 with those shown in the first column of the same table suggests a structural change: not only the size and significance patterns of estimated parameters but also the test statistics in the bottom of the last column point to an alternative knowledge production model structure for FP5. On the contrary, for CEE regions, the comparison of the results in the fourth and first columns suggests that the main findings of our longer-term analysis (i.e., significant knowledge production impact of regional R&D and accumulated knowledge stock and interregional FP knowledge absorption) are replicated with FP5 data. Thus, our results for rest of EU (EU 15) regions are most probably importantly affected by the behavioral change of EU 15 regions from FP5 to FP6 (and FP7), which seems to be in accordance with the findings in Maggioni, Uberti, and Nosvelli (2014).
Summary and Conclusions
FPs are the largest research support instruments of the EU. These programs finance collaboration among research units located in different parts of Europe and as such they mediate the flow of a significant amount of knowledge across distantly located European regions. Therefore, knowledge transferred via FP research networks can potentially serve as substantial inputs to regional innovation. Contrary to expectations though, no evidence has been found on the supposed positive regional innovation impact of FP participation. On the other hand, a related research indicates important differences between lagging and core regions of the EU in the role of FP-mediated knowledge transfers in regional scientific publication activity. These findings motivated us to assume that the missing overall impact of EU FP participation on regional innovation masks important differences between core and peripheral regions in Europe.
Within the Romerian KPF framework, we tested empirically if knowledge potentially accessed via FP network linkages has any relationship with regional patenting. We carried out the analysis on two subsamples covering the years of 2000–2009: CEE lagging (objective 1) regions (51 regions) and generally more developed regions in the rest of the EU (211 non-CEE regions and non-objective 1 [capital] CEE regions). The selected research area of study was ICT, as this area can be identified through three FPs (FP5, FP6, and FP7) in a relatively consistent manner. While studying the FP network impact on innovation, we controlled for localized knowledge flows via a systematic panel spatial econometric methodology.
We found that clear differences exist between CEE objective 1 and rest of the EU regions. While knowledge transferred via FP networks acts as a further important input to patenting in CEE objective 1 regions, this is not observed in rest of the EU regions. On the other hand, it is clear that localized learning in patenting is more important for regions located in rest of the EU regions, whereas knowledge flows from neighboring regions play relatively less significant role in the innovation activity of CEE objective 1 regions.
Thus, our results suggest that FP research subsidies act as a substitute for funding from other (mainly national) sources in regions of old EU member states and capital regions in CEE countries. On the other hand, innovation tends to rely more on external knowledge transferred via FP-funded research networks in CEE objective 1 regions, somewhat compensating for their less developed local knowledge infrastructures. Our findings are important, as they suggest that strengthening research excellence and international scientific networking in relatively lagging regions (such as regions in CEE countries) could be a viable option to increase regional innovativeness, which in combination with other policies could also form a base for a systematic support of regional development in Europe (Foray 2015; McCann and Ortega-Argiléz 2015).
Footnotes
Acknowledgments
The author wish to thank George Chorafakis for giving him access to the raw data, Richárd Farkas, Márton Horváth, Dóra Longauer, and Réka Pusztai for their excellent research assistance in preparing the database applied in this research and two anonymous reviewers for their useful comments on earlier versions of this article. The present scientific contribution is dedicated to the 650th anniversary of the foundation of the University of Pécs, Hungary.
Declaration of Conflicting Interests
The author(s) declared no potential conflicts of interest with respect to the research, authorship, and/or publication of this article.
Funding
The author(s) disclosed receipt of the following financial support for the research, authorship, and/or publication of this article: The research leading to this article has received funding from the Országos Tudományos Kutatási Alapprogramok (National Scientific Research Programs; OTKA-K101160) and the Sharing KnowledgE Assets: InteRegionally Cohesive NeigHborhoods, 266834, FP7 projects.