




Abstract
Agglomeration spillovers are a major driver of policy creating science parks across the world. However, agglomeration benefits may be offset by competition arising out of spatial proximity of firms. Analysis of Taiwanese firms’ total factor productivity distribution shows that, depending on location choice, the impact of agglomeration and selection is heterogeneous across firm types. Spatial analysis is applied to evaluate the regional innovation policy of establishing science parks. A sectoral analysis of productivity distributions reveals that there is a positive relationship between technology intensity of the production process and firm productivity levels when firms are located in science parks.
Introduction
Evaluating the effectiveness of local policies designating science parks requires an analysis of the productivity of firms located in those areas compared to firms located elsewhere. Given the large expenditures—often in terms of foregone tax revenues—associated with these policies, it is important to understand their effectiveness and the mechanisms underlying any possible productivity gains arising from them. To emphasize the level of public funds involved, it may be noted that in the case of Taiwan, estimated annual tax credits from a single policy instrument, Statute for Upgrading Industries, accounted for approximately one-third of the total NT$100 billion tax revenue loss for the government which is close to 1 percent of the country’s gross domestic product (Lien et al. 2007).
Estimation of firm-level productivity is recognized as a fundamental performance evaluation parameter in the heterogeneous firms’ literature. For instance, recent models of trade and industry such as that presented in the seminal work of Melitz (2003) describe how the idiosyncratic productivity of heterogeneous firms determines their survival in domestic and foreign markets. However, Melitz does not address the issue of what actually determines firm productivity. Productivity is a key metric to evaluate firm success, so understanding how spatial policies designating science and technology parks might impact this productivity is of paramount importance.
As Parr (2002) points out “the concept of agglomeration economies continues to represent an important aspect of locational analysis and regional economics” p. 151). However, while the regional economics literature has focused largely on the effects of large cities (Rosenthal and Strange 2004), small cities (Gabe 2004), and industrial clusters (Ciccone and Hall 1996; Cooke 2002) on productivity, a detailed study of the effect of science parks on productivity is still missing. Moreover, more recently, some contributions—both theoretical and empirical—point out that the increased productivity of firms located in large cities or industrial clusters might be related to either self-selection or spatial sorting rather than agglomeration economies (Baldwin and Okubo 2006).
There are three main issues with the current literature on the effect of science parks on productivity. First, site-specific methodologies, such as the case study of seventy-two US parks by Luger and Goldstein (1991), are often adopted, making generalization difficult and leaving little margin for meaningful policy recommendations. Second, the empirical evidence for firm profitability, survival rates, and so on, is generally mixed. Third, and most importantly, the variable of interest used for the evaluation of science parks might suffer from selectivity bias as pointed out by Phan, Siegel, and Wright (2005). For example, an endogeneity problem may arise if the analysis uses the rate of firm survival as the dependent variable, given that science incubators are designed specifically to increase the life span of firms.
Our contribution addresses these issues by presenting a research methodology not restricted to a particular estimation model or specific park objective(s), but based instead on a robust theoretical foundation which provides a solid basis for generalization and policy evaluations of different contexts.
In order to do so, we extend Combes et al. (2012) using firm-level panel data from Taiwan for the period 2009–2011. Productivity distributions for firms in cities and science parks are simultaneously analyzed to identify the impact of agglomeration and selection effects. The analysis includes estimates for aggregate manufacturing and also specific industrial sectors defined on the basis of technology intensity of the production process and measured through the percentage of employment in technology-oriented jobs (Hecker 2005).
The analysis generates the surprising result that only firms employing a higher proportion of technology-oriented workers display an increase in productivity when located in a science park. As the proportion of technology-oriented workers drops, so does the level of mean productivity. Controlling for sorting bias, the differential effect of agglomeration economies and selectivity on firms’ productivity is identified. Selection effects, although present, are much less in magnitude than agglomeration effects. Moreover, firms located in science parks also benefit from colocation with other firms in the same sector, which is consistent with the presence of Marshallian (localization) externalities. Interestingly, the opposite holds for Jacobian (diversification) externalities, which have a negative impact on the productivity of firms in science parks.
From a policy perspective, these results suggest that efficiency in the utilization of public incentives—offered via science parks—increases with the technological level of the industry and that, while science parks do help in correcting innovation market failures, they may turn out to be protection against market competition if extended to industries that are not technology intensive.
Regional Productivity and Spatial Innovation Policy
There seems to be a consensus on the positive relationship between productivity levels and regional density of employment, economic, and industrial activity, so that firms located in large cities are—on average—more productive, see, for example, Fogarty and Garofalo (1988) and Tabuchi (1986). There are three main reasons often quoted in the literature for this relationship. The first is agglomeration economies: economies external to firms arising out of sharing and spillovers and ultimately causing increasing returns for the entire neighborhood. The second is competition-based selection: firm heterogeneity results in their varying placement across the productivity scale and as selection is tougher in large urban areas so only the most productive firms may survive or profitably operate there. The third is sorting: ex ante, more productive firms or talented individuals may choose to locate in larger cities.
With respect to agglomeration economies associated with urban regions, a detailed review of relevant studies and their findings is reported in Rosenthal and Strange (2004). A very significant contribution by the same authors is the estimate that productivity increases by 3–8 percent if city size is doubled. Marshallian externalities are generally attributed to agglomeration economies associated with firms located in large cities and industrial clusters with the theoretical underpinnings dating back more than a century to the influential work of Marshall (1890). The agglomeration economies literature explains productivity gains resulting from labor–market pooling, input sharing, and knowledge spillovers (Cainelli, Fracasso, and Marzetti 2015).
Apart from the agglomeration economies story, high-level productivity observed in the case of large cities/regions can also be explained in terms of competitive selection associated with large markets. This explanation draws on Melitz (2003) who introduced product differentiation and international or interregional trade into the framework of industry dynamics due to Hopenhayn (1992). In a subsequent contribution, Melitz and Ottaviano (2008) developed a monopolistically competitive model with heterogeneous firms and variable price–cost markups, their key results showing that larger national markets contain more productive firms, which makes competition tougher, average markups being lower in equilibrium. This result also holds when national markets become more integrated due to trade liberalization. As Baldwin and Okubo (2006) point out, Melitz and Ottaviano establish a new agglomeration force: as firms cluster in larger markets, increased competition may reduce profits and thereby their willingness to remain in those markets. Consequently from a process of “natural” selection, a remaining mass of higher than average productivity firms supply both the domestic and export markets, and the least efficient firms supply either the domestic market or are driven from the market altogether.
Another strand of literature that combines aspects of the new economic geography with an assumption of heterogeneous firms shows that high-productivity firms may sort into larger markets with trade liberalization. Baldwin and Okubo assume a setting with two regions, one small and one large, where capital is mobile between regions, subject to an adjustment cost, and units of capital in each region embody a particular level of labor productivity. Assuming monopolistic competition with fixed price–cost markups, decreasing trade costs cause the most efficient firms to relocate from the small to the large region. Baldwin and Okubo also establish that subsidizing firms to move from the large to the small region induces only the least productive firms to relocate. Based on the Melitz and Ottaviano setup, as well as finding that decreasing trade costs lead to agglomeration of efficient firms in the large region, Okubo, Picard, and Thisse (2010) also establish that less efficient firms relocate to the smaller region. However, as the two regions become increasingly integrated, inefficient firms eventually relocate to the larger region in order to access a larger pool of consumers. Finally, Forslid and Okubo (2014) use a structure similar to Baldwin and Okubo, where higher capital intensity among more productive firms is also sector-specific. Their theoretical results generate two-sided sorting: firms with the highest return to capital have the strongest incentive to move from the small to the large region, which would include both the most productive firms and the least productive firms that are labor intensive, that is, depending on the sector of production, such firms may lie at either tail of the productivity distribution.
The phenomenon of selection and spatial sorting clearly raises serious endogeneity concerns when evaluating the impact of spatial clustering policies on firm productivity. As noted by Baldwin and Okubo, standard econometric analysis of agglomeration economies is very likely to overestimate the benefits of agglomeration on firm productivity due to the fact that only the most productive firms either survive in or relocate to larger and more competitive markets. In addition, as Forslid and Okubo point out, while agglomeration economies, selection, and sorting all result in higher than average productivity for firms located in a cluster, they also generate quite different shaped firm productivity distributions. In the case of agglomeration economies, all firms located in the core benefit, the productivity distribution shifting to the right. For the case of selection, the productivity distribution of firms in the core will be left truncated as the least-productive firms exit the core, while for two-sided sorting, the productivity distribution will be wider as the least- and most-productive firms relocate to the core.
The specific theoretical basis of this article is the nested model of Combes et al. (2012), which distinguishes agglomeration from selection effects. Combes et al. extend Melitz and Ottaviano, by introducing agglomeration economies in the manner of Fujita and Ogawa (1982) and Lucas and Rossi-Hansberg (2002), and develop a model that includes both agglomeration and selection effects. Under monopolistic competition with free entry, profits decline as the number of competitors increases in one location. This results in reduced survival for less efficient firms. Combes et al., with two-digit industry-level data, structurally parameterize and use rightward shift, dispersion, and left truncation of log total factor productivity (TFP) distributions to indicate the strength of agglomeration and selection effects.
In contrast to their approach, in this article, the focus is on a sample of specific sectors (computers and electronics, chemicals, and scientific and technical services) rather than on the aggregate manufacturing sector alone, so that sector-specific dynamics such as market conditions for supply of inputs, demand for output, and the form of production functions can be controlled for in the estimation. Using Syverson’s (2004) approach, we identify proxies for shift and truncation in the log-TFP distributions across regions to estimate the impact of agglomeration and selection. The possibility of sorting bias is controlled using the two-stage Heckman (1979) selection model.
The empirical analysis conducted in this article depends on bias-free estimates of TFP distributions. The estimation method used is from Olley and Pakes (1996), their technique being robust to two econometric concerns: simultaneity and selectivity bias. However, the proxy variable for free inputs in Olley and Pakes’s method is firm’s investment. Often data sets report missing values regarding investments made by firms and thus a large number of observations have to be dropped in the estimation process. To avoid this, Levinsohn and Petrin’s (2003) method is adopted, which uses intermediate inputs to proxy for productivity shocks. Given the limitations of the data set available for this study, the return on capital is used as a proxy for investment while estimating TFP through Olley and Pakes’s method.
Many definitions of science parks have been proposed, mostly by professional organizations, for example, the Association of University Research Parks (AURP 1998), and by parks themselves as a way to define their activities. Common among these definitions is that a park is a type of public–private partnership that fosters knowledge flows often among park firms and universities and thereby contributes to regional economic growth and development. Empirical support for agglomeration effects in a park is provided by Jaffe (1989); Jaffe, Trajtenberg, and Henderson (1993); Audretsch (1998); and Rothaermel and Thursby (2005a, 2005b). A comprehensive overview of the research related to science park performance is given by Dabrowska (2011). Most studies focus on the impact of science park intervention on innovative capability, survival rates, profitability, and job creation. The empirical evidence is largely mixed and inconclusive, providing little margin for policy recommendation (Monck 2010).
Inspired by the success of California’s Silicon Valley, the Taiwanese government embarked on a pursuit of upgrading its economy with technology and capital-intensive industries. In 1979, a statute was enacted for the establishment of an industrial park. The first park was established in December 1980 in Hsinchu city and it now stretches over both the city and county of Hsinchu. The park was a public project in its entirety, as it was developed using public land and publicly funded infrastructure. The central government provides strong policy regulations along with preferential fiscal and other investment incentives. Similar science parks were subsequently established in Central and Southern Taiwan with the objective of providing a favorable environment with appropriate incentives to attract current technologies and skilled human resources.
Model and Empirical Strategy
A model explaining the impact of external economies of scale and competitive selection on log-TFP distribution as developed in Combes et al. (2012) and extended for regions by Arimoto, Nakajima, and Okazaki (2009) is presented in this section. We further extend these models to accommodate the sectoral impact on firm entry/exit decisions within a region.
General Framework of the Model
Modifying and applying the model of Combes et al., the theoretical background of the productivity improvement effects in large cities and science parks in Taiwan is described.
Preferences and demand
First, the general framework of the model is introduced. A consumer’s utility is given as follows:

where qi denotes the consumption of variety i from a set Ω of differentiated varieties of manufactured goods and q 0is the numeraire good. Using the demand function for variety i, the utility maximization problem is solved subject to a budget constraint. Taking P as the average price of varieties with positive consumption, the demand function for variety i can be written as follows:

where
Production
The numeraire is produced under constant returns to scale using one unit of labor per unit of output which implies that the cost to firms of hiring one unit of labor is always unity. Differentiated products are produced under monopolistic competition. By incurring a sunk entry cost s, a firm manufactures a product using h units of labor per unit of output. The value of h differs across firms depending on their productivity and is randomly drawn from a distribution with known probability density function g(h) and cumulative density function G(h) common to all regions. The total sales of a firm are Q(h) = Cq(h), where C is the mass of consumers. Firms maximize their profit as follows:

In the monopolistically competitive industry with free entry firms enter until ex ante profits can no longer offset the sunk entry cost,

Using the optimal pricing rule the zero cutoff profit condition is derived as:

where N is the mass of surviving firms, which is equivalent to the number of varieties produced, and H is the average cost of surviving firms.
Agglomeration effect
Combes et al. assume in their model that each worker supplies a single unit of labor. If the agglomeration effect is present, it is assumed that the workers’ productivity increases with the number of firms within a region. That is, effective labor supply by a single worker is a(N), a′ > 0, a′<0, and a′(0)=1. On the other hand, if agglomeration of firms does not improve workers’ productivity, for any value of N, a(N) = 1. It is also assumed that if the agglomeration effect is present, it benefits workers across both the differentiated good and numeraire good sectors.
Given agglomeration effects, a firm of unit labor requirement h hires labor such that

Using the change of variables theorem, the probability density function of firms’ log productivities is given as follows:

The numerator in equation (7) follows from use of equation (6) and the change of variables theorem, while the denominator
Selection effect for different regions in Taiwan
In order to adopt the model for regional location of firms in any industry, one more assumption is imposed. For any region, r ∊ {1 … R}, it is assumed that fixed sunk entry costs sr vary across regions based on the intensity of factor demands and provision of public policy incentives. The free entry condition for any region r is given by Arimoto, Nakajima, and Okazaki as follows:

We extend the regional model of Arimoto, Nakajima, and Okazaki by adding an industry dimension to show that

Using the model outlined above, and also the implications noted in Arimoto, Nakajima, and Okazaki, we test the following two hypotheses:
TFP Estimation
The econometric analysis conducted in this article primarily hinges on estimation of TFP. The TFP distribution of firms located in any region is then predicted from the residual of their production functions. For this study, firm-level TFP is calculated, assuming that the technology for revenue generated is Cobb–Douglas in factors of production with the following logarithmic form:

where in terms of logs, for firm i at time t, yit is the physical output and kit and lit are the inputs of capital and labor, respectively. β0 is the mean efficiency level across firms over time and ∊ it is the deviation from the mean which can be further decomposed into an observable vit and an unobservable component uit as:

From equation (11), firm-level log-productivity is
Possible Sources of Bias in TFP Estimation
The productivity estimate from equation (11) may suffer from simultaneity bias and competitive selection bias as discussed below.1
Simultaneity
Marschak, Andrews, and William (1944) indicated that a firm’s knowledge of its own efficiency helps it to determine the quantity of flexible inputs. As the firm’s productivity is not observed by the econometrician, its correlation with inputs causes simultaneity bias in the estimation (De Loecker 2007). The direction of the bias depends on the intensity of factor use in the production process.
Selection bias
Another issue raised by Olley and Pakes (1996) relates to the entry and exit of firms. Several theoretical models, such as that of Hopenhayn (1992), predict that the growth and exit of firms are motivated to a large extent by productivity differences at the firm level. If firms have some knowledge about their productivity level ω it prior to their exit, this will generate correlation between ω it and the fixed input capital (Ackerberg et al. 2007). This correlation has its origin in the fact that firms with a higher capital supply will, ceteris paribus, be able to withstand lower ω it without exiting (Van Beveren 2012).
Econometric Analysis
TFP Estimation Techniques
In this section, the techniques used in this article for estimation of unbiased and consistent production function coefficients are described. As noted above, ordinary least squares (OLS) estimates are likely to yield biased values of the coefficients. To avoid this, multiple methods are used to ensure robustness of the results. These include two-stage least squares (2SLS) with instrumental variables (IV), the semiparametric Olley and Pakes (1996), and the Levinsohn and Petrin (2003) techniques.
Instrumental variables
One method to achieve consistency of coefficients in the production function is through use of IV for the endogenous independent variables, that is, the freely alterable inputs in the production function. Besides input prices, demand shifters are sometimes used as instruments in the literature. Keeping in mind data availability, recent values of county-level wages and population density are used as a measure of demand shifters to overcome the endogeneity of inputs problem.
Olley and Pakes estimation methodology
Olley and Pakes were the first to introduce a semiparametric estimation algorithm that takes both the selection and simultaneity problem directly into account. This estimator solves the simultaneity problem by using the firm’s investment decision as a proxy for unobserved productivity shocks.
Selection issues are addressed by incorporating an exit provision into the model. At the start of each period, each surviving firm decides whether to exit or to continue its operations. If it exits, it receives a particular sell-off value. If it continues, it chooses an appropriate level of variable inputs and investment. The firm is assumed to maximize the expected discounted value of net cash flows and investment and exit decisions will depend on the firm’s perceptions about the distribution of future market structure.
Olley and Pakes’s technique is based on three key assumptions. First, the only unobserved state variable is the firm’s productivity which evolves as a first-order Markov process. Second, investment is monotonically related to productivity and hence during econometric analysis, nonnegative values of the investment variable are required. This investment is shown as a function of capital and productivity,
The Olley and Pakes technique proceeds in two stages. In the first-stage regression, using the relationship in equation (11) the free input variable(s) coefficients are derived. The second stage evaluates the temporal productivity level to compare it with the lower bound or the threshold. Using coefficients from the first stage and the survival probability and by applying a nonlinear least squares method, the coefficient on the capital variable is estimated. Although Olley and Pakes’s technique is robust to simultaneity and selectivity problems, the empirical estimation using it may return unreliable results if either the investment variable has nonpositive values or there are no firms exiting the market. An alternative is to use the Levinsohn and Petrin method which takes care of the simultaneity problem by using intermediate inputs as proxy for productivity instead of investment.
Empirical Analysis
The main objective of this article is to distinguish how agglomeration economies and competitive selection affect the log-TFP distribution of firms located in a science park as compared to firms located elsewhere. To obtain reliable assessments of these effects, the first step is to generate statistically unbiased and consistent log-TFP estimates for firms.
Data
To determine the agglomeration and selection effects on firms’ TFP in Taiwan, firm data disaggregated at the county–industry (three-digit North American Industry Classification System [NAICS]) level are used from the Emerging Markets Information Services (EMIS). The data for the years 2009–2011 are in an unbalanced panel form. The data set provides information about the physical location, industry, operational status of the firm, and its listing and trading status on the stock market. For each firm there is an information available about financial indicators as shown in balance sheet and income statements, which include noncurrent assets, total employment, and sales revenues. Indicators such as return on capital, profitability, liquidity, and growth trend ratios are also part of the data set.
The main data set is supplemented with county-level income and industry price data available at the website of the National Statistics Office, Taiwan (2010). These data are used for two purposes. The industry-level price deflators are used to deflate the revenue figures. The county-level population and wages historical data are used as IV. The data up to a two-period lag are used to gauge local demand trends, while deep-lagged data are used to control selectivity bias of firms in high-productivity regions.
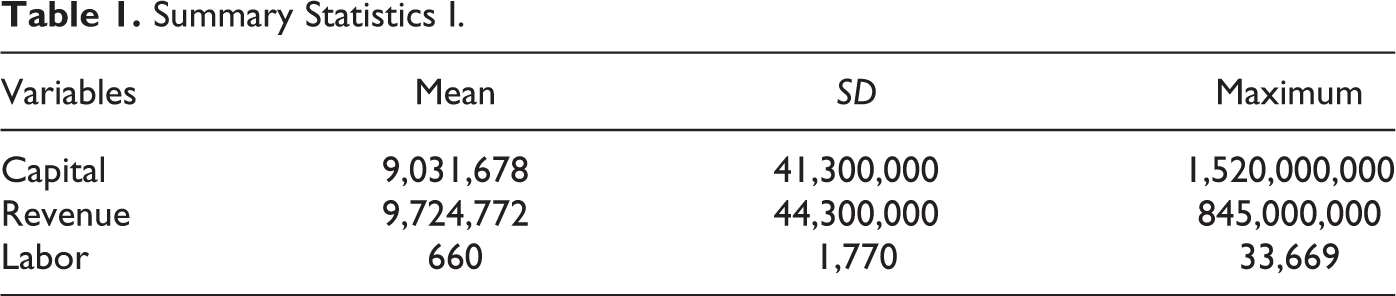
The raw data containing 4,662 observations are cleaned via a two-step process. In the first step, revenue figures are deflated using industry-level prices for the year 1996. Then using box plots, the data observations are examined for outliers, and the entities with top and bottom 1 percent TFPs are removed in order to avoid their influence on the regression results. The remaining 4,655 observations constitute the final data set. Table 1 reports the summary statistics of the mean and standard deviation of inputs and output variables used in the Cobb–Douglas production function.
Summary Statistics I.
The county-wise location of selected industries is shown in Table 2. The data set gives the three-digit NAICS for all the firms, although it also provides four-digit classification for a subset of these enterprises. This helps in detailed TFP analysis while segregating the firms in terms of the technology intensity of their production. For NAICS 325, there is a total of 310 observations of which 71 are in the pharmaceutical sector (NAICS 3254), and the rest are in basic chemical manufacturing (NAICS 3251). It can be seen that computer and electronics firms (NAICS 334) constitute half of the total number of observations. Here, from the total of 2,150 observations, 389 are in semiconductor manufacturing (NAICS 3344). Finally, the scientific and technical industry (NAICS 541) is examined, in which case there are around twenty observations belonging to the biotechnology industry. All of these industries have a presence in all three regions, namely, science park counties, small cities, and large cities.
Summary Statistics II.

For the spatial analysis, large cities/counties in Taiwan are divided into three exclusive regions based on the population density and location of science parks. These regions are with above median population density (hereinafter large cities), or with below median population density (hereinafter small cities), or those housing science parks. Using this delineation, we estimate firm’s TFP for each market while controlling for potential simultaneity and selectivity bias using the Olley and Pakes (1996) method. In Figure 1, a visual indication is given of the correlation between employment density and productivity. It can be observed that productivity levels are highest in large regions followed by regions that have science parks.

Population density and total factor productivity (TFP; county level for Taiwan). Map based on data used in this study. The trend is increasing from light (yellow) to dark (brown). (a) County–market mean TFP. (b) County-level population density.
As the focus of this article is on separating agglomeration and selection effects, the geographical unit of estimation is the county/city market. This choice is made to capture spillover effects of large markets. In the case of science parks, particularly the Hsinchu Science Park, ever increasing demand has forced a greater area in the county being designated as the science park. Based on population and labor density statistics, Taipei County, New Taipei City, Keelung City, and Chiayi City are classified as the large cities. The regions designated science park counties are Hsinchu County, Tainan City, Yunlin City, and Kaohsiung City.
Results
The estimates for coefficients of input factors in the Cobb–Douglas production function using different methods are reported in Table 3. The OLS estimates for coefficients of labor and capital inputs are reported in column 1 of Table 3. To test the reliability of the OLS estimates, the Durbin–Wu–Hausman test of endogeneity is performed. The small p value indicates that the estimates are not reliable. To avoid simultaneity bias, we use 2SLS/IV. The overidentification test indicates that the instruments are not correlated with the residual term. However, while the estimates as shown in column 2 of Table 3 overcome the simultaneity bias, they still do not take care of the selectivity bias and hence the results are likely to be biased.
Production Function Coefficients.

Note: OLS = ordinary least squares; IV = instrumental variables; 2SLS = two-stage least squares; OP = Olley and Pakes; DWH = Durbin Wu Hausman.
*Significant at 10 percent level.
**Significant at 5 percent level.
***Significant at 1 percent level.
Olley and Pakes Method
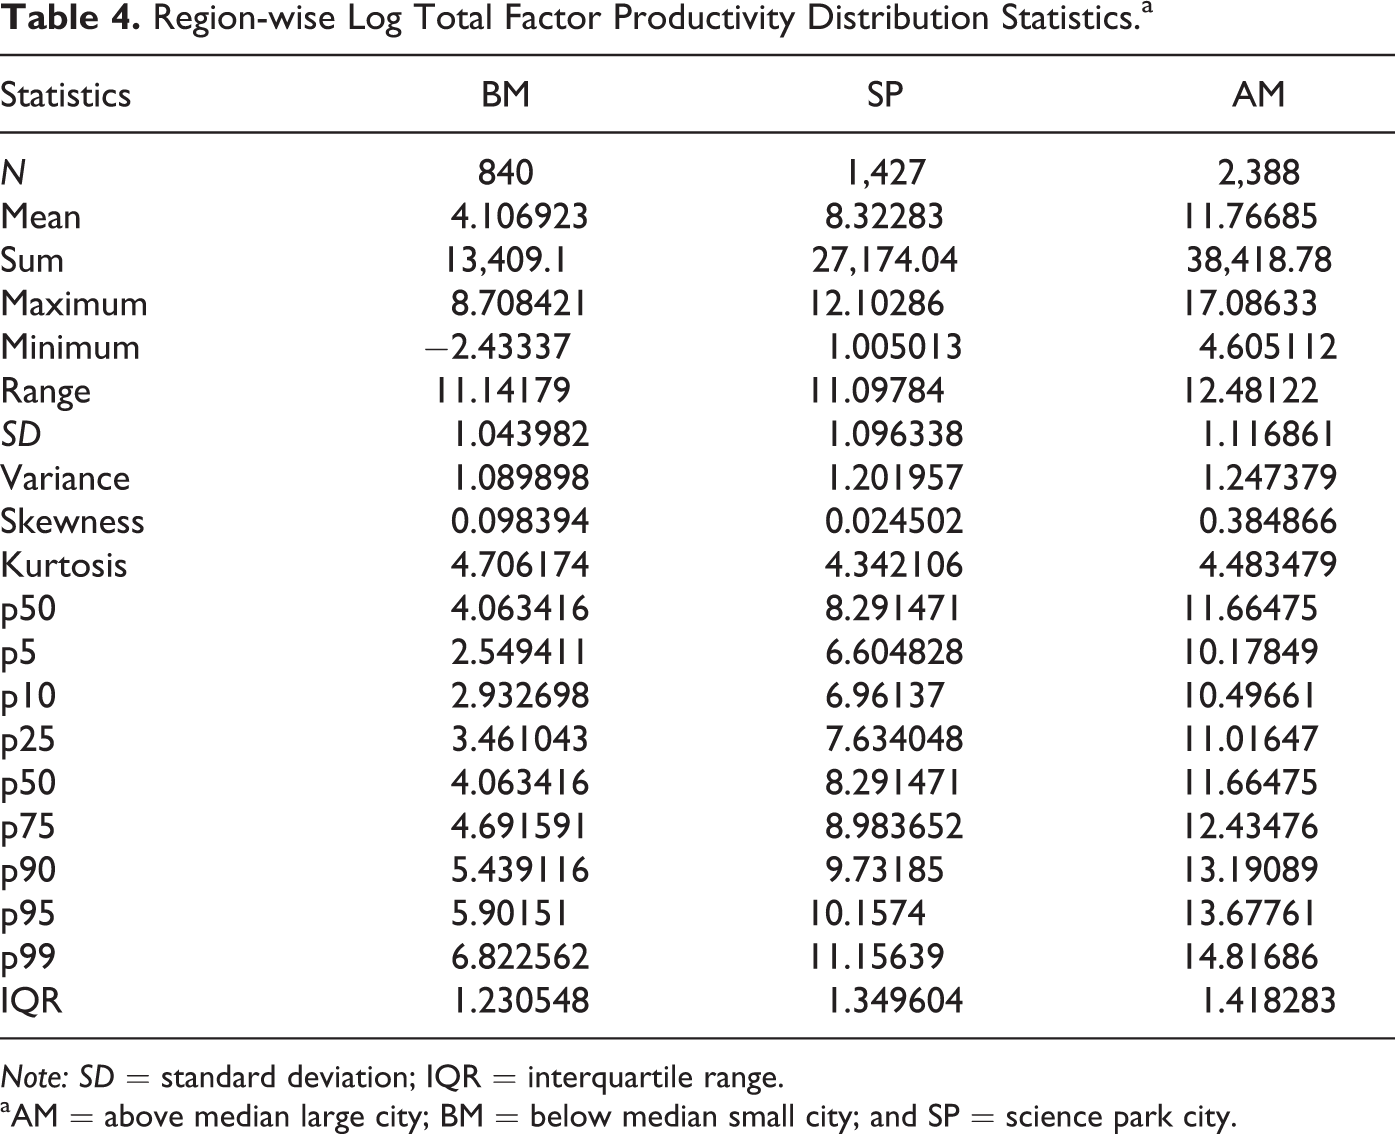
Keeping in mind the shortcomings of the techniques used above, TFP was predicted using the method proposed by Olley and Pakes (1996). The standard errors of all Olley and Pakes’s estimation routines are bootstrapped using 200 replications to derive appropriate standard errors. From the results, log-TFP distributions were drawn for each market. Here the return on capital is used as a proxy for investments made by the firm along with control variables such as the number of employees to control for size. Using the TFP estimates from the Olley and Pakes method, the summary statistics for each of the regions are examined, as detailed in Table 4. It is evident that at the aggregate level, large cities have the highest mean TFP value followed by that of science parks.
Region-wise Log Total Factor Productivity Distribution Statistics.a
Note: SD = standard deviation; IQR = interquartile range.
aAM = above median large city; BM = below median small city; and SP = science park city.
Robustness Check for TFP Estimation
As a robustness check, we obtain three additional productivity estimates, namely, labor productivity, the TFP estimates from the Levinsohn and Petrin (2003) method, and the Ackerberg, Caves and Frazer (2006) method. Ackerberg, Caves and Frazer (2006) have pointed out the likelihood of collinearity between inputs in both the Olley and Pakes and the Levinsohn and Petrin approaches. These authors consider that labor may not be chosen independently but is rather a function of capital and productivity. To avoid this eventuality, Wooldridge (2009) argues that coefficients for flexible and quasi-fixed inputs can be jointly estimated by generalized method of moments (GGM) in a one-step procedure. As our data set does not provide information on either labor skills or education levels, we use dynamic panel estimation to control for the unobserved worker heterogeneity in TFP estimation. These alternative productivity measures confirm that our results remain consistent. However, in the case of labor productivity, overestimation in the size and significance of agglomeration variables are observed.
Agglomeration and Selection: Controlling for Spatial Sorting Bias
The focus of this section in this article is on firms falling under NAICS 334. This is the dominant industry in Taiwan and for which a sufficient number of observations are available for county markets in each of the three regions. In order to identify the impact of agglomeration, two variables, namely, localization and urbanization economies are used to capture the effect of specialization and diversification of economic activity, respectively. Following Henderson, Kuncoro, and Matthew (1995), localization L is quantified as the regional employment share (E) of the specific industry (defined at the three-digit NAICS level) in the manufacturing sector: thus, localization for industry j in region r at time t is given as L = [Ejr
/Er
]/[Ej
/Etot
]. As in Mameli, Faggian, and McCann (2014), urbanization is measured using the Herfindahl–Hirschman Index which is computed as
Also, as noted earlier, agglomeration may entail diseconomies, for example, through higher land rents that trigger a selection process. As information on industrial land prices is not available, population density is used instead as a proxy, following a number of authors including Guimarães, Figueiredo, and Woodward (2000). It can be argued that population density may in fact capture demand-side agglomeration economies, that is, firms locating near their potential markets. However, given the dominance of exporting firms in the industry under consideration, the relevant market for these firms is not the local Taiwanese market, hence it is reasonable to assume that population density does not capture market-size effects.
At this point, the main econometrics-related concern that still needs to be addressed before conducting agglomeration analysis is the likelihood of spatial sorting of heterogeneous firms in markets with specific characteristics. While using the Olley and Pakes technique for estimation of production functions, the survival-based selection of firms is already taken care of. The focus is now on heterogeneous firm’s spatial sorting as pointed out by Okubo, Piccard, and Thisse (2010). Due to the heterogeneous nature of firms and regions in our study, we also try to determine the type of regional productivity distribution as discussed by Forslid and Okubo (2014).
Identification of Firm Sorting
In order to estimate the competitive selection effect, the Heckman (1979) two-step estimator for selection models is used here. Such models are common in microeconometric studies in the estimation of wage equations or consumer expenditure. The statistical significance of the coefficient of the inverse Mill’s ratio indicates if there is any selection bias. To identify the process through which high-productivity firms sort into science parks and large cities, a selection and an outcome equation are used. Considering firm’s sorting in science parks, the relevant selection equation is as follows:

where

where Srt is the region-time-specific distributional measure, that is, the mean (and the median as a robustness check) and the tenth percentile of the log-TFP distribution. Art is an industry-specific agglomeration variables for region r at time t, Xrt is the region-time-specific control variables, and υ rt is the error term. The expected signs of localization and urbanization as defined here are positive and negative, respectively, whenever such effects result in agglomeration economies. The following two dependent variables in equation (13) are generated following Syverson (2004):
Mean (median)—to capture the productivity gains due to agglomeration causing rightward shift of the log-TFP distribution.
Tenth percentile—to capture the selection effect as higher competition causes left truncation of the log-TFP distribution.
Using these as dependent variables, their significance is evaluated with respect to the agglomeration variables (localization and urbanization) and selection (population density). These steps are repeated for big cities and science parks and for different industries at the three-digit NAICS level. To account for the panel structure of the data, the data are transformed into a form suitable for fixed effects analysis, followed by application of the Heckman procedure.
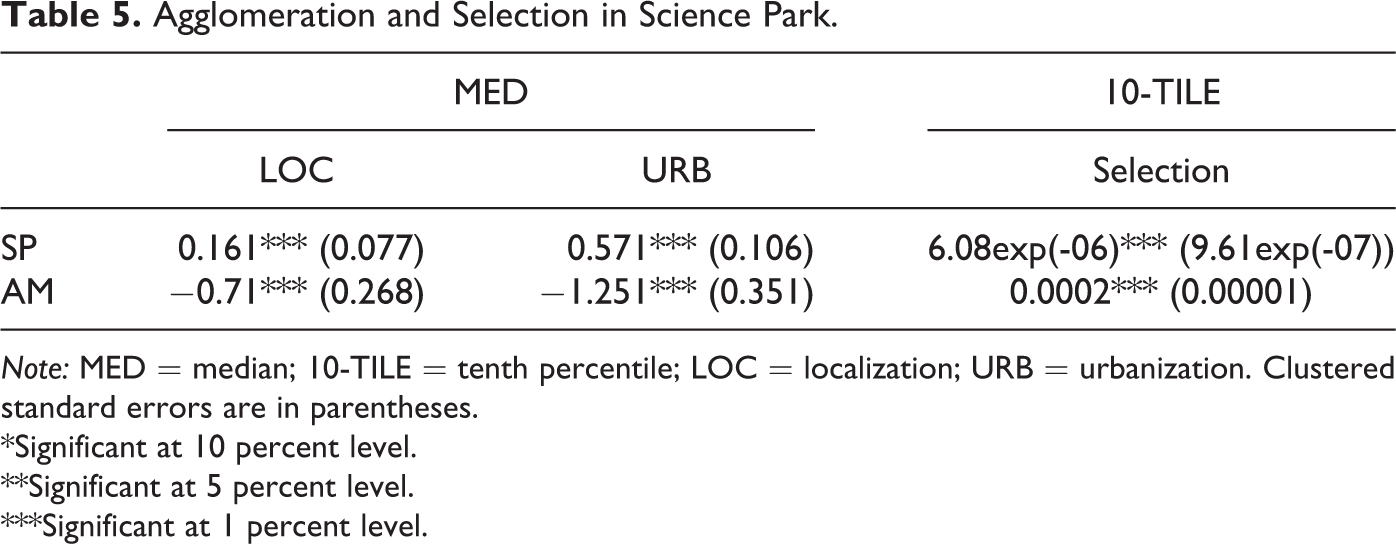
The results reported in Table 5 indicate that the magnitude of competitive selection is very small compared to the agglomeration variables. Another interesting result is that firms located in science parks benefit from specialization and firms located in large cities benefit form diversification of economic activity. Interestingly, diversification and specialization have a negative impact on firm productivity in the case of science parks and large cities, respectively.
Agglomeration and Selection in Science Park.
Note: MED = median; 10-TILE = tenth percentile; LOC = localization; URB = urbanization. Clustered standard errors are in parentheses.
*Significant at 10 percent level.
**Significant at 5 percent level.
***Significant at 1 percent level.
Firm Sorting and Type of Regional Productivity Distribution
The results presented in the last section confirm sorting behavior by firms, implying wider dispersion of the firm productivity distribution as either very low-productivity or very high-productivity firms self-select in a region in expectation of higher profits. As noted earlier, any region that experiences both types of sorting will have a firm productivity distribution with fat tails. This is in contrast to the impact of competitive selection which results in the left truncation of the firm productivity distribution.
Given firm productivity distributions are simultaneously affected by agglomeration economies, competitive selection, and sorting, it is important to segregate each effect before determining the type of productivity distribution. In order to filter out sorting from agglomeration and selection effects, the methodology of Forslid and Okubo is employed. First, the firm productivity distribution is demeaned in order to remove the agglomeration effect. Second, a region-specific regression equation, such as equation (14), is used to determine the likelihood of any firm lying within a certain percentile of the productivity distribution as indicated by the coefficient of a regional dummy variable:

A positive coefficient for the regional dummy variable indicates the likelihood of sorting within the given percentile of the log-TFP distribution. Conversely, a negative value for β implies dominance of the selection effect. Therefore, the estimated βs for various percentiles pick up the difference between selection and sorting effects on the productivity distribution of the region under consideration in contrast to the rest of the country. For example, a negative (positive) estimate of β at low percentiles implies a dominant selection (sorting) effect at the lower tail of the productivity distribution. To estimate the β coefficient from equation (14), we use the joint probability distribution of all firms in NAICS 334 and then perform regressions in the case of the large city, science park, and small city regions. The results are reported in Table 6 and illustrated in Figure 6. As the β coefficients are highly significant at all the selected percentiles, we use these to develop profiles to identify the dominance of either selection or sorting: one-sided or two-sided effects on a region’s log-TFP distribution.
β Coefficients for Large City, Science Park, and Small City.

***Significant at 1 percent level, based on robust standard errors.
Robustness Check for Firm Sorting to Science Parks/Large Cities
Apart from using the Heckman (1979) model, we use regional dummy variables and IV to confirm and control for sorting. For the latter approach, the possibility of reverse causality can be controlled through the use of IV correlated with firm’s productivity but not correlated with agglomeration economies.
For this study, the following instruments are used: deep lag of population density (log of 1,950 number), log of return on equity, and capital are used as IV. The validity of the instruments is established using the Sargan (1958) test of overidentification restrictions. The results confirm that spatial sorting is present and may bias the estimates of agglomeration and competitive selection.
Discussion of Results
The results of this research can be divided into four parts. First, nonparametric comparisons are made of the log-TFP distribution for aggregate manufacturing sector firms located in the three identified regions. This analysis helps in understanding the extent to which policy intervention is able to act as a productivity shock and disturb the equilibrium in which more productive firms are located in large cities. Consistent with the literature, for the overall manufacturing sector, the highest mean log-TFPs are for firms located in large cities and the lowest mean log-TFP is for firms located in small cities. Additionally, we find that the mean log-TFP for science park firms falls in between the two as shown in Figure 2. This indicates that factors driving productivity gain in large cities are not affected by policy incentives elsewhere, although establishment of science parks does lead to increased regional growth.

Kernel density plots for the three regions.
Although there are other examples of science parks that have had a significant impact on regional economic growth, such as North Carolina’s Research Triangle Park and Singapore’s Biopolis, the results presented in this article for the case of Taiwan are in contrast to some previous empirical findings for cluster policy. For example, Martin, Mayer, and Mayneris (2011) found that promotion of clusters in France failed to reverse the relative decline in productivity of targeted firms, while Okubo and Tomiura (2012) found that the Japanese policy designed to relocate plants to peripheral regions actually attracted low-productivity plants. While the current article does not explicitly evaluate why science parks in Taiwan appear to be successful, a recent study by the European Commission (2013) of regional clusters in the semiconductor sector acknowledges that, compared to European clusters, those in Taiwan and elsewhere in Asia have benefited more from government incentives. In addition, Asian clusters in this sector have been aided by increased global collaboration, removal of trade restrictions (tariff and nontariff), and establishment of linkages between research and development organizations, academia, and industry as well as favorable tax policies. However, in the case of Japan, Eto (2005) identifies several obstacles that have hampered the growth of technology parks and clusters in Japan, including concentration of investments in cities, a poor reward system for technology park workers and dichotomy of values in dealing with large and small firms.
The mixed empirical evidence on the impact of clusters on regional economic growth has motivated researchers into finding out the determinants of success. Unfortunately, this search has not yielded any particular “ingredients” that guarantee the success of a science park (Wallsten 2004). What has been generally identified so far is that clusters differ widely depending on the type of products and services that they produce, their development stage, and their economic environment (Ketels 2003). The latter author believes that what really distinguishes winners from losers is not only a strong cluster-specific business environment and a critical mass of activity but also the focus on a specific area or market for which the cluster provides unique value to companies and researchers. Specifically, Taiwan has been recognized as developing capabilities to sustain export success (Oyelaran-Oyeyinka and Rasiah 2009). At this point though, there is clearly room for more research on the cross-country evaluation of cluster policies.
Second, for detailed analysis, we disaggregate the manufacturing sector into firms classified under NAICS 325, 334, and 541. The TFP distributions for the selected industries are shown in Figures 3, 4, and 5, respectively. The sector-based interregional comparison of manufacturing firms indicates that computer and electronics firms located in large cities are the ones with the highest level of mean log-TFP, followed by those in science parks and then by those located in small cities. However, as the technology intensity of the production process is lowered, that is, the chemicals industry, firms in science parks lose their comparative advantage and end up being those with the lowest mean log-TFPs. We extend this analysis to incorporate interregional comparison for service sector firms, specifically the scientific and technical services which employ a very high proportion of technology-oriented workers. The results show that firms located within science parks have higher mean log-TFP values in comparison to those located in large cities.
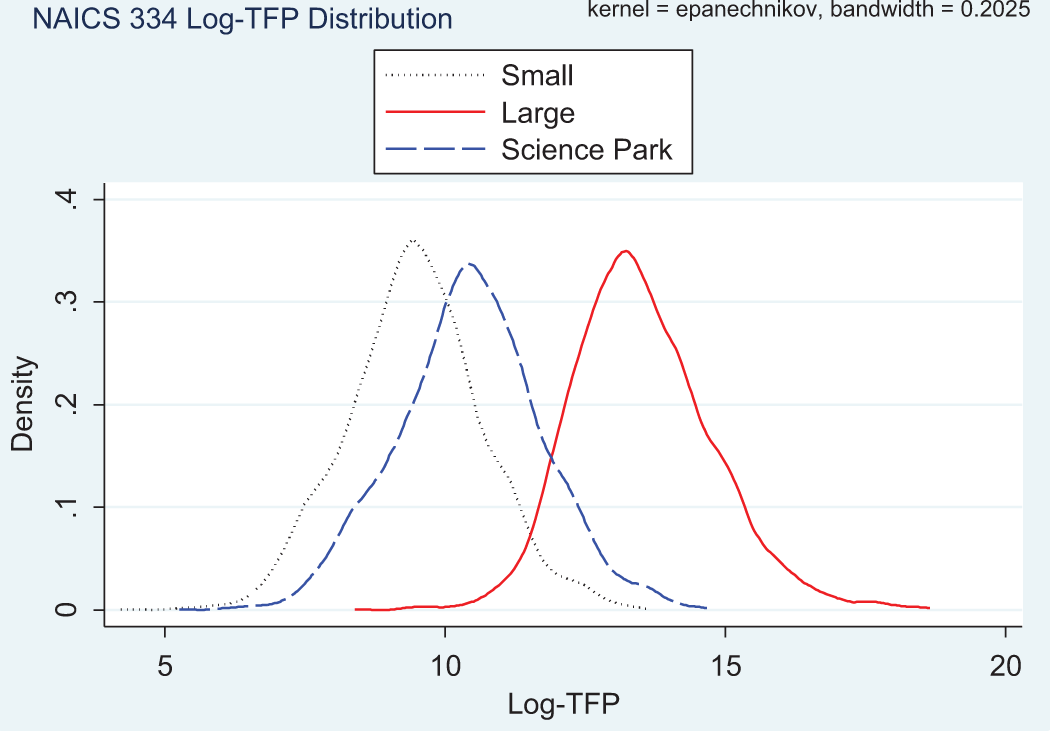
Kernel density plots for computer and electronics firms for the three regions.

Kernel density plots for chemical manufacturing firms for the three regions.

Kernel density plots for scientific and technical services firms.
Third, intraregional comparisons are made for manufacturing firms within science parks. Here, sample comparisons are conducted for two sectors and we find that manufacturing firms in computer and electronics industry have the highest mean log-TFP whereas those in basic chemical manufacturing have much lower values. This suggests that within science parks, there is a direct relation between firm-level productivity and technology intensity of the production process.
Fourth, the results are analyzed to establish the impact of agglomeration and competitive selection. The Heckman selection model confirms that firms do self-select in regions of high productivity and hence it is important to control for sorting behavior in the model. Also, it is important to segregate the selection effect from sorting and find out which of these is dominant in a particular region. The results presented in Table 6 and Figure 6 indicate that two-sided sorting behavior is prevalent in the case of science parks whereas a competitive selection effect is dominant in the case of large cities. Therefore, science parks tend to attract, both low-productivity and high-productivity firms, the incentives there lowering their costs. However, in any region, not all the productivity gains can be attributed to this phenomenon. Even after controlling for sorting, it is found that the agglomeration variables, namely, localization and urbanization, are statistically significant. The regression results indicate that selection due to competition is also significant. As shown in Table 5, the coefficients for competitive selection are much smaller than those for the agglomeration variables. Moreover, the mean of the regional log-TFP distribution for firms in science parks indicates that they do benefit from specialization of economic activity.

β profile for large city and science park.
In summary, this study generate four key findings in the case of Taiwan: firms located in large cities have the highest mean log-TFP; of firms in large cities, those in the computer and electronics sector have the highest mean log-TFP; across science parks, firms in the computer and electronics sector also have the highest mean log-TFP; and controlling for sorting by firms, agglomeration effects dominate competitive selection. Finally, the research presented in this study can also be set in the context of the inconclusive literature concerning agglomeration externalities, that is, whether Marshallian specialization or Jacobian diversification favors economic development—see, for example, van der Panne (2004). The empirical results suggest that firms located in science parks largely benefit from specializing in a particular economic activity, whereas firms located in large cities with a more diverse production base benefit from agglomeration spillovers across industries. The comparison of log-TFP distributions for these two regions confirms that external economies of scale due to diversity in production have a higher impact in the case of large cities. However, while the empirical results indicate that creation of science parks is perhaps not an optimal growth strategy, the fact that firms located in science parks have higher log-TFP than firms based in small cities suggests it might rate as a second best policy instrument. The latter observation aside, the results by NAICS industry suggest an important caveat: the relationship between technology and productivity level for firms located in science parks provides some support for targeting policy at those industries in need of a “Schumpeterian type” technology push.
Conclusion
Science parks have traditionally been established with the purpose of enhancing comparative advantage by supporting a regional innovation system through a place-based policy instrument (Cooke 2001). However, there are hardly any studies that evaluate the use of such policy measures via methods of regional economic analysis. This article is an attempt to examine the impact of science parks on regional productivity levels and to establish the determinants of observed differences. As such, this approach proposes uniform evaluation criteria for policy-driven industrial clusters.
In the case of Taiwan, firms located in science parks have productivity distributions proportional to the technology intensity of their sector. Also, even after controlling for sorting bias, firms located in science parks benefit from agglomeration economies arising out of specialization of economic activity. The results also confirm that sorting in science parks by high-productivity firms is empirically established. The elasticity of competition-based selection is much less in science parks compared to large cities. Thus, science park incentives insulate firms from the competition they might face in open markets. This finding is also substantiated by the survival of low-technology chemicals manufacturing firms located in a science park with productivity distributions that lag even that of small cities.
The regional productivity distributions show that the relative intensity of economic and/or industrial activity causes right shift and greater dispersion. Also, firms in large cities face competition analogous to being in an open economy. Thus, firms below a certain threshold level of productivity cannot survive there. All these findings confirm that the impact of industrial clusters such as science parks is not homogenous across firms and the resultant productivity shock is weak at the aggregate level.
The policy implication that arises from this study is based on robust theoretical foundations. An attempt has been made tease out the impact of policy on firm’s productivity; the indicator of its heterogeneity. The interplay of selection and agglomeration with probability of sorting makes the analysis a daunting task. However, controlling for various observable and unobservable factors, the study suggests that incentives such as science parks do contribute in productivity improvements of the firms. The level to which benefits of science parks are taken advantage of by firms as depicted in their productivity depends on the underlying technology of their production process.
In conclusion, this study presents an alternate methodology for evaluating the effectiveness of science parks. Importantly, science parks as instruments of innovation and development have been implemented across the globe for a variety of industries, and therefore it is important that the current approach be replicated for science parks with a different industrial focus. Further research focused on countries implementing different models of growth at the national level would also be a means of testing the robustness of the methodology.
Footnotes
Acknowledgments
The authors would like to thank an anonymous reviewer, as well as participants at the 2013 annual meetings of the Agricultural and Applied Economics Association (AAEA) and North American Regional Science Council (NARSC) and participants in the Leibniz Institute of Agricultural Development in Transtion Economies (IAMO) symposium in Halle in 2014 for their valuable comments and suggestions on earlier versions of this article. Hasan acknowledges the Institute of International Education for granting the doctoral scholarship which made this research possible.
Declaration of Conflicting Interests
The author(s) declared no potential conflicts of interest with respect to the research, authorship, and/or publication of this article.
Funding
The author(s) received no financial support for the research, authorship, and/or publication of this article.