




Abstract
This paper separates two mechanisms through which agglomeration increases average firm innovation: selection (less innovative firms being forced out of agglomerations) and true agglomeration (firms become more innovative). I apply a quantile regression to estimate the distribution of firm innovation and separate these two mechanisms. Linking a unique establishment-level dataset with the patent dataset in the state of Maryland for the period 2004–2013, I find that a 1-mile radius area with above-median employment concentration significantly encourages firm innovation. An average establishment that files for at least one patent during the study period increases citation-weighted patent applications by 31.2% to 31.5% in such employment centers. I also find evidence of selection: non-innovators are 1.3% less likely to survive in agglomerations. The coexistence of agglomeration and selection causes the result of an ordinary least squares regression to be upwardly biased. By eliminating the selection effect, this study more precisely estimates the agglomeration effect, which can be applied to cost–benefit and cost-effectiveness analyses of urban and industrial policies.
Keywords
Introduction
In 2014, 54% of the world’s population lived in cities; this is expected to reach 66% by 2050 (United Nations, 2015). Cities are attractive to people as hubs of innovation and growth: They foster invention, productivity, and entrepreneurship (Combes et al., 2012; Glaeser and Kerr, 2009; Packalen and Bhattacharya, 2015). These benefits come from agglomerations—the geographical concentrations of people and firms (Glaeser, 2010). One famous demonstration is Silicon Valley, an IT cluster that employed 10% of information technology workers and had 12% of patents in the USA as of 2013 (Bureau of Labor Statistics, 2013; Joint Venture Silicon Valley and Silicon Valley Community Foundation, 2014).
Recognizing the role of agglomerations in generating new ideas, policymakers have invested heavily in supporting industrial concentrations. For instance, Boston launched a US$1 billion initiative in 2006 to grow a life science cluster (Mills, Reynolds and Reamer, 2008). The US Department of Commerce invested US$50m in 2009 to assist regional cluster initiatives (US National Research Council, 2012). In 2010, the US Department of Energy awarded US$129m to the Energy Regional Innovation Cluster in Philadelphia (Pool, 2010).
Aside from policymakers, researchers have also devoted considerable attention to the agglomeration–innovation relationship. In theory, agglomeration enables firms to share tacit knowledge (Gertler, 2003), build personal networks (Bell, 2005), cultivate an innovative atmosphere (Saxenian, 1994), and save costs (Helsley and Strange, 2002). These expand the capacities of firms to make breakthroughs. Prior studies also empirically established a positive correlation between agglomeration and innovation (Carlino and Kerr, 2015; Packalen and Bhattacharya, 2015). However, the estimated agglomeration effect usually suffers from selection bias: less innovative firms are more likely to be forced out of agglomerations. This occurs because (a) competition in the input or output market is tougher in agglomerations (Baldwin and Okubo, 2006); and (b) high-skilled labor in major employment centers does not match the needs of less innovative firms (Behrens et al., 2014).
A few studies so far have dealt with the selection bias in the agglomeration–productivity relationship. For example, Combes et al. (2012) employed a continuous quantile estimator and found no evidence that market competition forces out the least productive firms in denser employment areas in France. Arimoto et al. (2014) applied a similar method to the Japanese silk-reeling industry and identified the selection effect. Other studies have dealt with the selection bias using the instrumental variable approach, the Heckman two-step approach, as well as the propensity score matching approach (Cainelli and Ganau, 2018; Falck et al., 2010; Vásquez-Urriago et al., 2014). Similar methods can be applied to the study of the agglomeration–innovation relationship. This paper takes on this task and applies a method similar to that used by Combes et al. (2012) and Arimoto et al. (2014). Using a quantile estimator, I place bounds on the agglomeration effect and the selection bias at different percentiles of firm innovation.
This paper uses a unique establishment-level 1 dataset from the Quarterly Census of Employment and Wages for the state of Maryland for the period 2004–2013, and the patent dataset from the US Patent and Trademark Office. I find that a 1-mile radius area with above-median employment concentration increases citation-weighted patent applications by 31.2–31.5% for an average patenting establishment. I also find a sizable selection effect, with non-innovators 1.3% less likely to survive in employment centers. These results are robust across time periods and alternative specifications and measurements.
The contribution of this paper is twofold. First, it introduces a bounded estimator to confine the true effect of agglomeration. This estimator is more flexible than that of Combes et al. (2012). Instead of imposing a single dilation parameter for the entire distribution of firm innovation, this estimator allows for different levels of dilation across percentiles. Second, this paper speaks to the geographical dimension of agglomeration. To date, most studies define agglomeration by predetermined administrative boundaries (Combes et al., 2012; Ellison et al., 2010; Figueiredo et al., 2015). A few recent studies adopted firm-level data to study how the effect of agglomeration on firm performance attenuates over distance, and found that the effect may concentrate at short distances (Andersson et al., 2016; Cainelli and Ganau, 2018; Drennan, 2018; Ruffner and Spescha, 2018; Wallsten, 2001). Such efforts are still limited, and few focused on firm innovation. This paper locates every plant on a map, and is thus able to compare the effect of agglomeration across different geographical scales.
The rest of the paper proceeds as follows. The next section reviews the literature on agglomeration and its impact on firm innovation. The following section introduces the data and methodology. The main results and robustness tests follow, and the final section concludes.
Literature
The theory of agglomeration starts with Marshall (1890). He emphasized input sharing, labor market pooling, and knowledge spillover as the main benefits of agglomeration. Since then, agglomeration has been widely recognized as one of the main drivers of regional economic growth (Glaeser, 2000), with its benefits expanded to diversified business environments (Jacobs, 1969), demand linkages (Krugman, 1991), localized competition (Porter, 1998), and learning and innovative atmospheres (Gertler, 2003). As beneficiaries, co-located firms tend to be more productive, more innovative, and more competitive.
Prior studies have taken three main approaches to examining the relationship between agglomeration and firm and urban performances: the micro-industrial approach, the geographical approach, and the macro-territorial approach (Camagni et al., 2016). The micro-industrial approach focuses on the clustering of firms in geographical proximity and scales down the research territory to (relatively small) physical distance or geometric space. The geographical approach, adopted by Meijers et al. (2016), examines the effect of agglomeration in a broader geographical context. This approach does not limit the agglomeration effect to the physical boundaries of a city, but allows it to spill over to surrounding areas. Finally, the macro-territorial approach introduced by Camagni et al. (2016) takes the time element into consideration and explores the dynamics of agglomeration over time in cities of various sizes. Each approach has its strengths and weaknesses, with the micro-industrial approach having it strengths in the more clearly identified sources of the estimated agglomeration effect. Since separating the agglomeration effect from the selection effect is the main aim of this paper, the micro-industrial approach—which can be helpful in achieving this aim—is adopted here.
Prior empirical studies found that co-located firms on average innovate more than isolated firms. For example, Aharonson et al. (2004) found that biotechnology firms in Canada are eight times more innovative in agglomerations. Similarly, Baptista and Swann (1998) reported that UK manufacturing firms are considerably more innovative when locating in clusters. Ruffner and Spescha (2018) found that for Swiss firms, increased concentration of employment in the same industry is associated with higher innovation output and higher productivity. At the same time, a greater number of firms in the same industry are associated with lower innovation output and lower productivity, likely an impact of competition. These findings are visible within a distance of 500 m, but vanish for longer distances. Figueiredo et al. (2015) found that patent citation decays across distance, and the spillover of knowledge correlates positively with industry localization. Negative and insignificant effects have also been identified (Ferrand et al., 2009), but less frequently. These studies, however, potentially overestimated the true effect of agglomeration, as mentioned above, because of selection bias.
A few researchers attempted to tease out selection bias using instrumental variables and quasi-experimental design. For example, Vásquez-Urriago et al. (2014) applied propensity score matching and instrumental variable approaches, and used the number of companies in a Spanish science and technology park as a share of total companies in a region as the instrument. They found that Spanish science and technology parks increase product innovation by 9.75%, but the instrument does not appear to satisfy the exclusion restriction. Falck et al. (2010) employed a triple-difference design and found that cluster-oriented policies in Germany increase the likelihood of innovation by 4.6–5.7%, but the cluster policies are likely to be endogenous and favor more innovative regions. Cainelli and Ganau (2018) dealt with the selection bias with a Heckman two-step method, and found that for Italian manufacturing firms there is a positive effect of intra-industry externalities within 15 km, which decreases with distance. At the same time, the short-distance negative effect of inter-industry externalities (up to 5 km) becomes positive at longer distances (15–30 km).
While the true effect of agglomeration is surely important to know, the effect of selection may also be of interest. It sheds light on firm dynamics, and the creation and destruction of jobs. Thus, estimating the selection effect itself can deliver useful policy implications as well. It is noteworthy that various mechanisms can lead to selection and they likely operate at different geographical scales. The competition over product, labor, and suppliers operates on larger, urban areas. Another competition mechanism, the competition over space, happens at the same geographical scale as the agglomeration benefits. This competition over space is precisely caused by the desire of firms to locate close to each other to capture the agglomeration benefits. As mentioned above, since the agglomeration effect may happen at a local scale, this type of competition can also happen at a local scale. However, the selection effect has rarely been empirically estimated and the geographical scale at which it operates is underexplored, except for a few studies measuring selection with firm survival and location choices (De Silva and McComb,2012; Rosenthal and Strange, 2003; Staber, 2001).
Data and method
Data
This paper studies the state of Maryland over the period 2004–2013. Maryland is a state with strong clusters in information technology, pharmaceutical, and education industries, active innovation practices, and diligent economic development endeavors. It ranked third among US states in terms of innovation (Fast company, 2013). Crucial state players, such as the governor, the Department of Business & Economic Development, universities, research institutions, and local independent organizations have closely collaborated to strengthen clusters and spur innovation (The Maryland Department of Business & Economic Development, TEDCO). These characteristics make Maryland an ideal setting to study the agglomeration–innovation relationship.
I measure agglomeration as the concentration of employment within a local region (the size varies), and measure innovation as the number of citation-weighted patent applications. Alternative measures of agglomeration, such as the concentration of establishments and Ellison and Gleaser’s (EG) index of coagglomeration (Ellison and Glaeser, 1997), are also adopted in the robustness tests. The measurement of innovation ignores unpatented innovation, but thus far there is no other source of plant-level innovation data spanning time and geographical scales. 2 The data come from two sources: The patent application and citation data are collected from the US Patent and Trademark Office (USPTO), and the establishment data are obtained from the restricted version of the Quarterly Census of Employment and Wages (QCEW).
The USPTO documents all patent applications and includes information about the date of application, the technology class, names of the inventor and assignee, and their locations (country, state, and city). I tackle several concerns about these data. First, a patent filed by an establishment is sometimes assigned to the firm’s headquarters (Blind and Grupp, 1999). This distorts the spatial distribution of innovation. Following Deyle and Grupp (2005), I address this concern by assigning an application to the address of the inventor rather than that of the assignee, whenever such information is available, as these studies point out that inventors are more likely to be local branches that initiated the inventions. Second, patents differ in quality (Harhoff et al., 1999). This concern is mitigated by weighting patent applications with the subsequent frequency of citations, 3 similar to Harhoff et al. (1999). I also experiment with six alternative weighting schemes in the robustness tests. Third, the exact date of patent filing is uninformative, as a patent can be filed up to 12 months after the invention is first introduced to the market or otherwise disclosed (United States Patent and Trademark Office, 2015). Thus, I dismiss the exact date and measure patent filing annually. The total number of patent applications traced to Maryland establishments during the study period is 10,355. Co-inventors are assumed to share patents equally.
The QCEW publishes quarterly counts of establishment, employment, and wages reported by employers, which covers 98% of jobs in the USA. The publicly available data are aggregated to the level of counties, while the restricted version of the data contains micro-level information of every plant. This paper has the luxury of access to the restricted data, which disclose the following information for every establishment: name, address, age, size, wages, and six-digit North American Industry Classification System (NAICS) code. These data are quite unique and advantageous: they allow a continuous and flexible treatment of space. With the exact address of every establishment, I can map and measure the proximity between establishments and employment. Thus, the measured agglomeration effect can be independent of jurisdictional division and overcomes a major problem in prior studies with aggregated data. These data also permit a flexible change of the geographical scale at which agglomeration is defined and measured, and thus can potentially reveal the optimal geographical scope for the prevalence of agglomeration benefits. For consistency, the establishment data are also analyzed annually. 4 The total number of establishment–year observations is 1,503,114, and 94% are successfully mapped. Only mapped establishments are used in the analysis.
The USPTO and QCEW datasets are matched by establishment name and location at the city level; 7% of the patent filings failed to match with any establishment and are excluded from the analysis. A measurement issue surfaces when the combination of establishment name and city fails to identify a unique pair of establishment and patent filing. This happens if a patent is applied by a firm with multiple plants located in the same city. In such cases, I assign the patent equally to these plants. Though obviously an imprecise measurement, this issue arises for only 31 firms, a fairly small proportion of the sample (less than 0.01%), and thereby unlikely to have a quantitatively relevant impact on the results.
Method
This paper defines agglomerations as local regions with above-median employment density, following Combes et al. (2012). This implicitly assumes that employment in all industries ubiquitously encourages innovation, which is later tested against the assumptions that only same-industry and related-industry employment encourage innovation. As mentioned above, alternative definitions, such as the above-median establishment density and the EG index of coagglomeration (Ellison and Glaeser, 1997), are also adopted in the robustness tests.
Different from the Combes paper and most prior studies, in this paper a local region is defined as a circular area around every establishment in the above industries rather than an administrative unit. The area is defined with a range of flexible radii: 0.5, 1, 2, 5, and 10 miles. This continuous and flexible treatment of space, as mentioned above, has two advantages.
It allows a firm located at the border of an administrative unit to be affected by multiple neighboring units. It enables a comparison of the agglomeration effect and selection effect across geographical scopes and overcomes the over-aggregation problem (Burger et al., 2010).
It is also noteworthy that a comparison of the selection effect across scales can help shed light on the two mechanisms of competition. The competition over space should not exist beyond the scope at which the agglomeration benefits prevail, but the competition over product, labor, and suppliers likely operates on the entire metropolitan area. The five radii applied in this paper are chosen based on radii used in prior studies (Arzaghi and Henderson, 2008; De Silva and McComb, 2012; Wallsten, 2001), so that the results can be compared across studies. Though tested with different radii, this paper primarily focuses on the 1-mile radius, within which signs of agglomeration and selection have been previously detected (De Silva and McComb, 2012; Wallsten, 2001). As the same time, since the exact distance between establishments can be measured, this paper also adopts a continuous measurement of distance as a robustness test.
This paper disentangles selection from the true effect of agglomeration. This is dealt with by estimating the distribution of firm innovation, instead of the mean. According to Combes et al. (2012), while the effect of agglomeration and selection both upshift the average firm innovation in agglomerations and therefore cannot be separated in an OLS regression, the distributional implications are different. The agglomeration effect improves every firm’s innovation; thus, it right-shifts the distribution of firm innovation, as shown in Figure 1(a). On the other hand, selection forces out the least innovation firms in agglomerations, or lowers their chance of survival. As a result, it truncates or lowers the left tail of the innovation distribution, as shown in Figure 1(b). These two cases, as well as their combination as a third case, can be separated with a quantile regression.
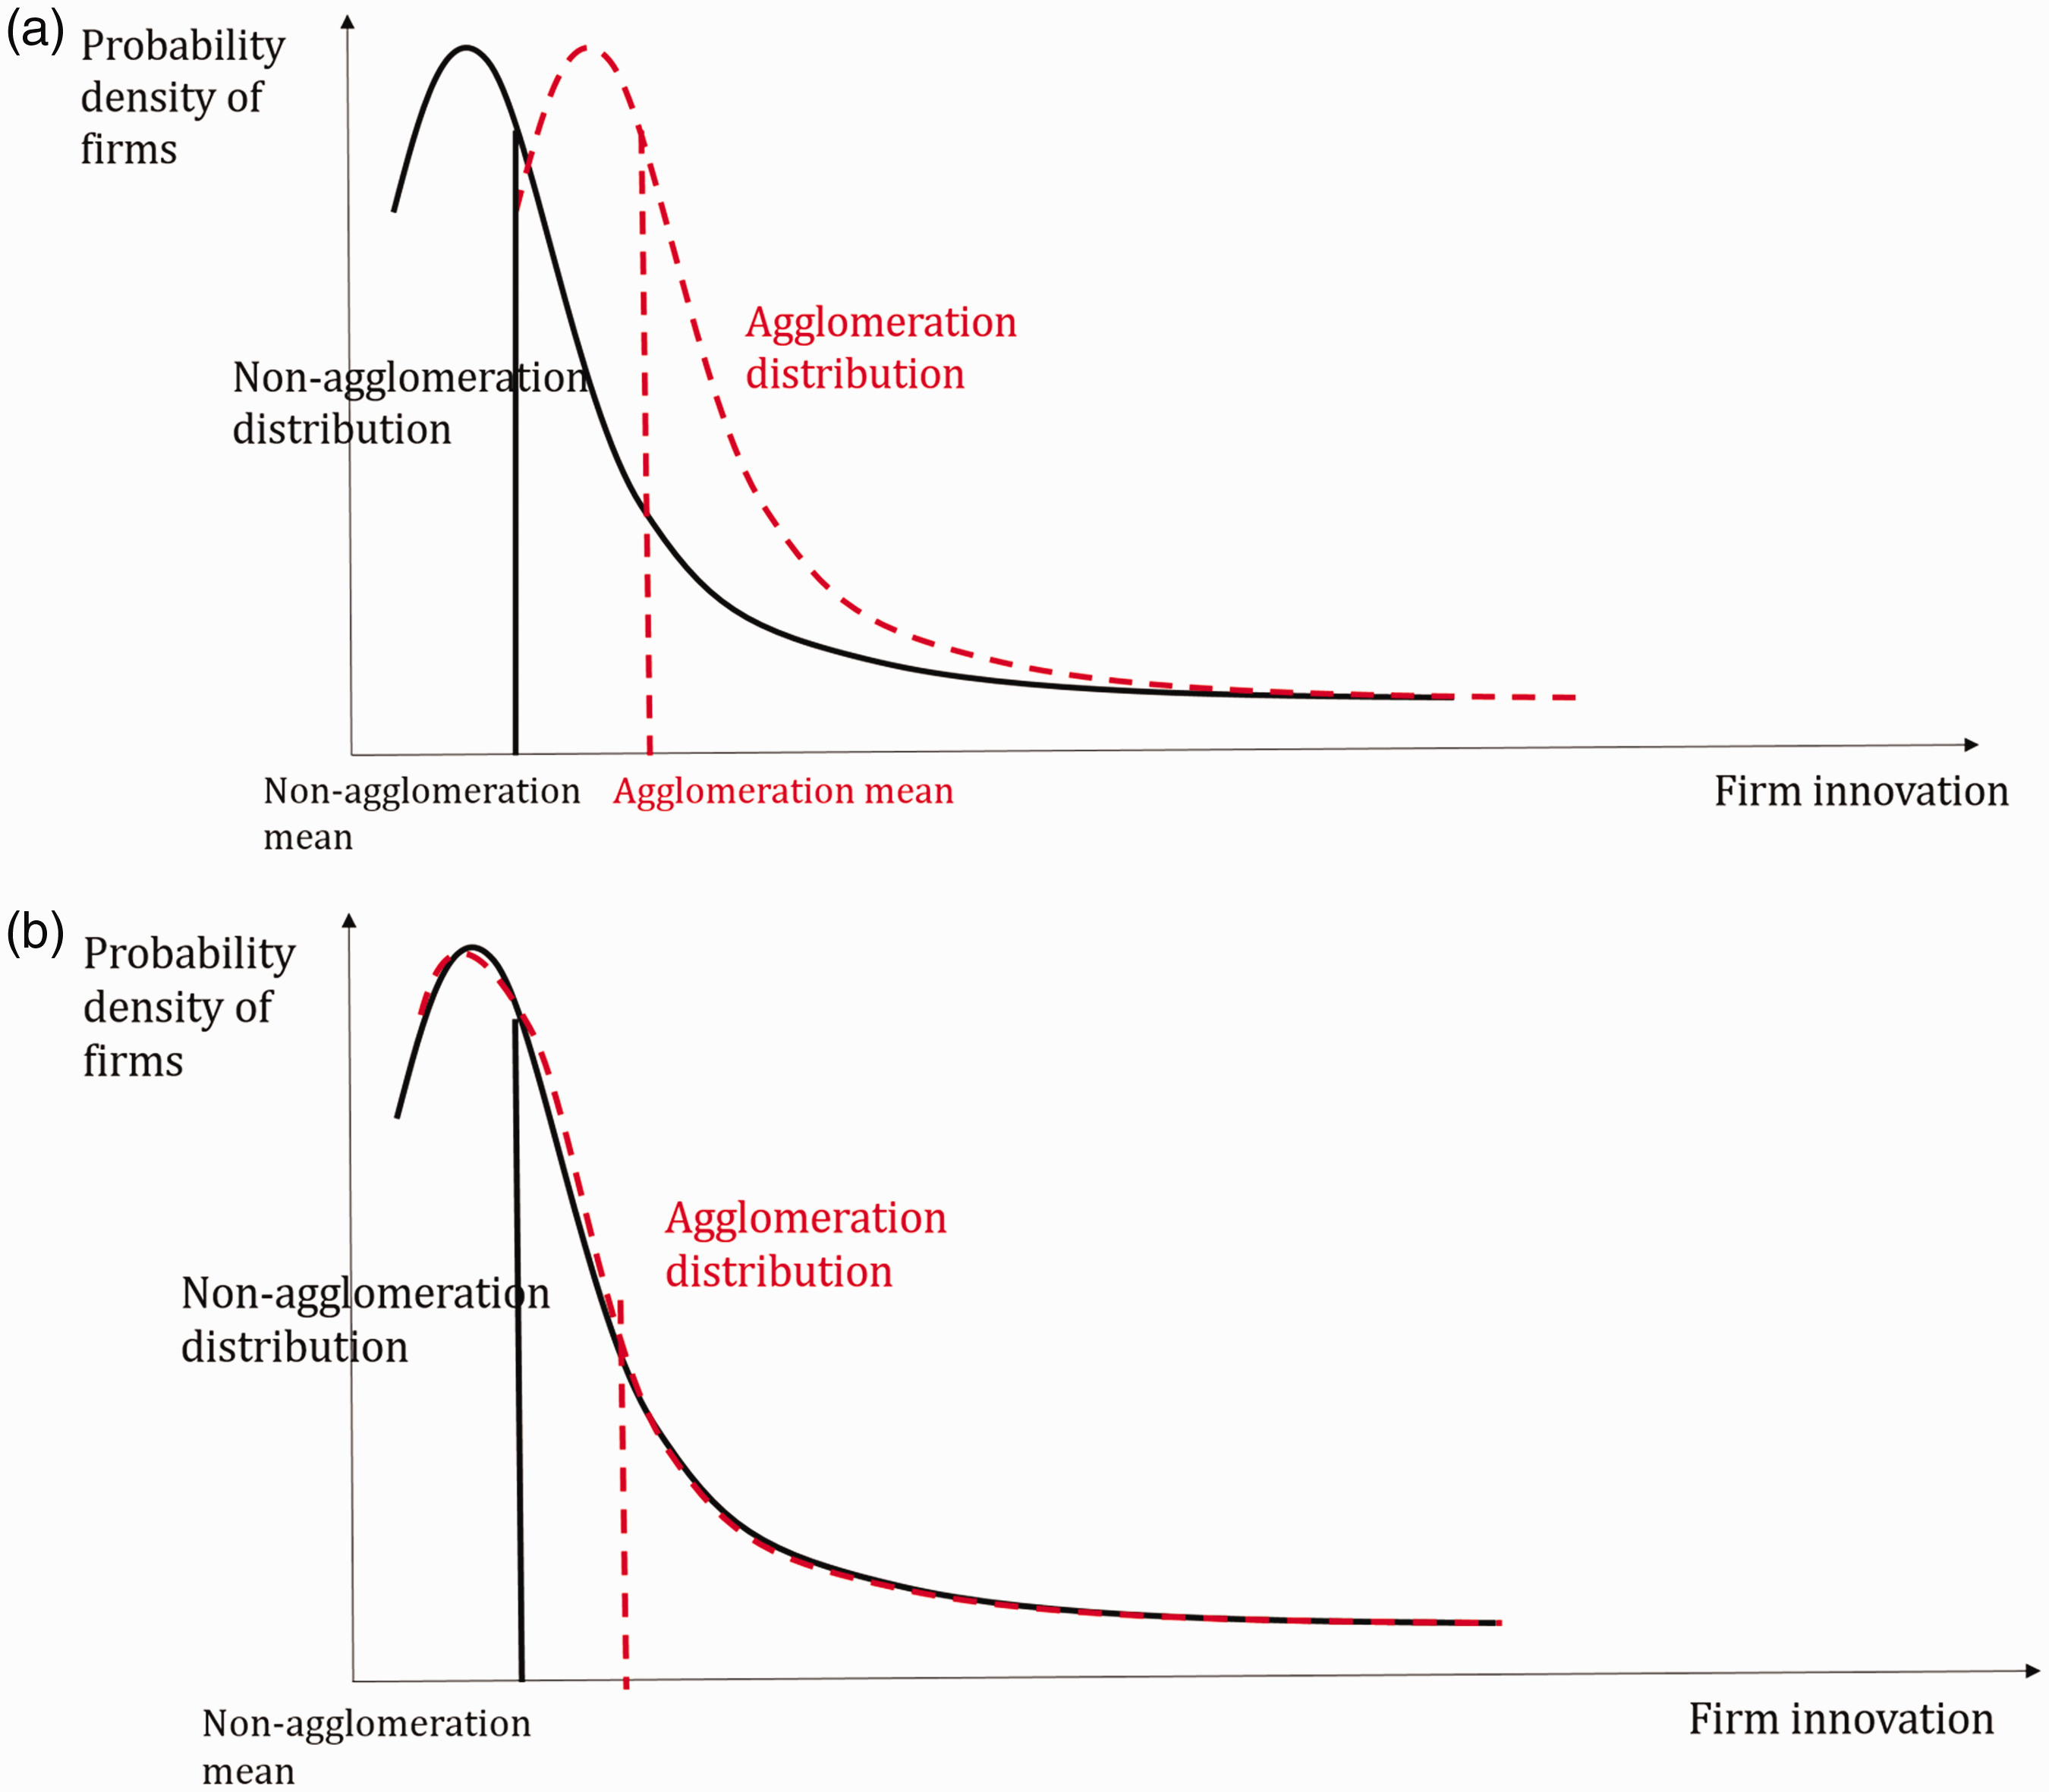
The distributional change of firm innovation in different cases. (a) The agglomeration effect: firm innovation right-shifts in agglomerations. (b) Natural selection: the left tail of firm innovation truncates or lowers in agglomerations.
A quantile regression estimates the difference in firm innovation among all innovative firms between agglomerations and non-agglomerations across a range of percentiles, contrary to the single mean estimate in an OLS regression. These quantile-specific estimates systematically compare the agglomeration with non-agglomeration distributions, and reveal selection at the left tail and detect the agglomeration effect by the overall right-shift. This approach is implemented with the following specification:

For
Variations of
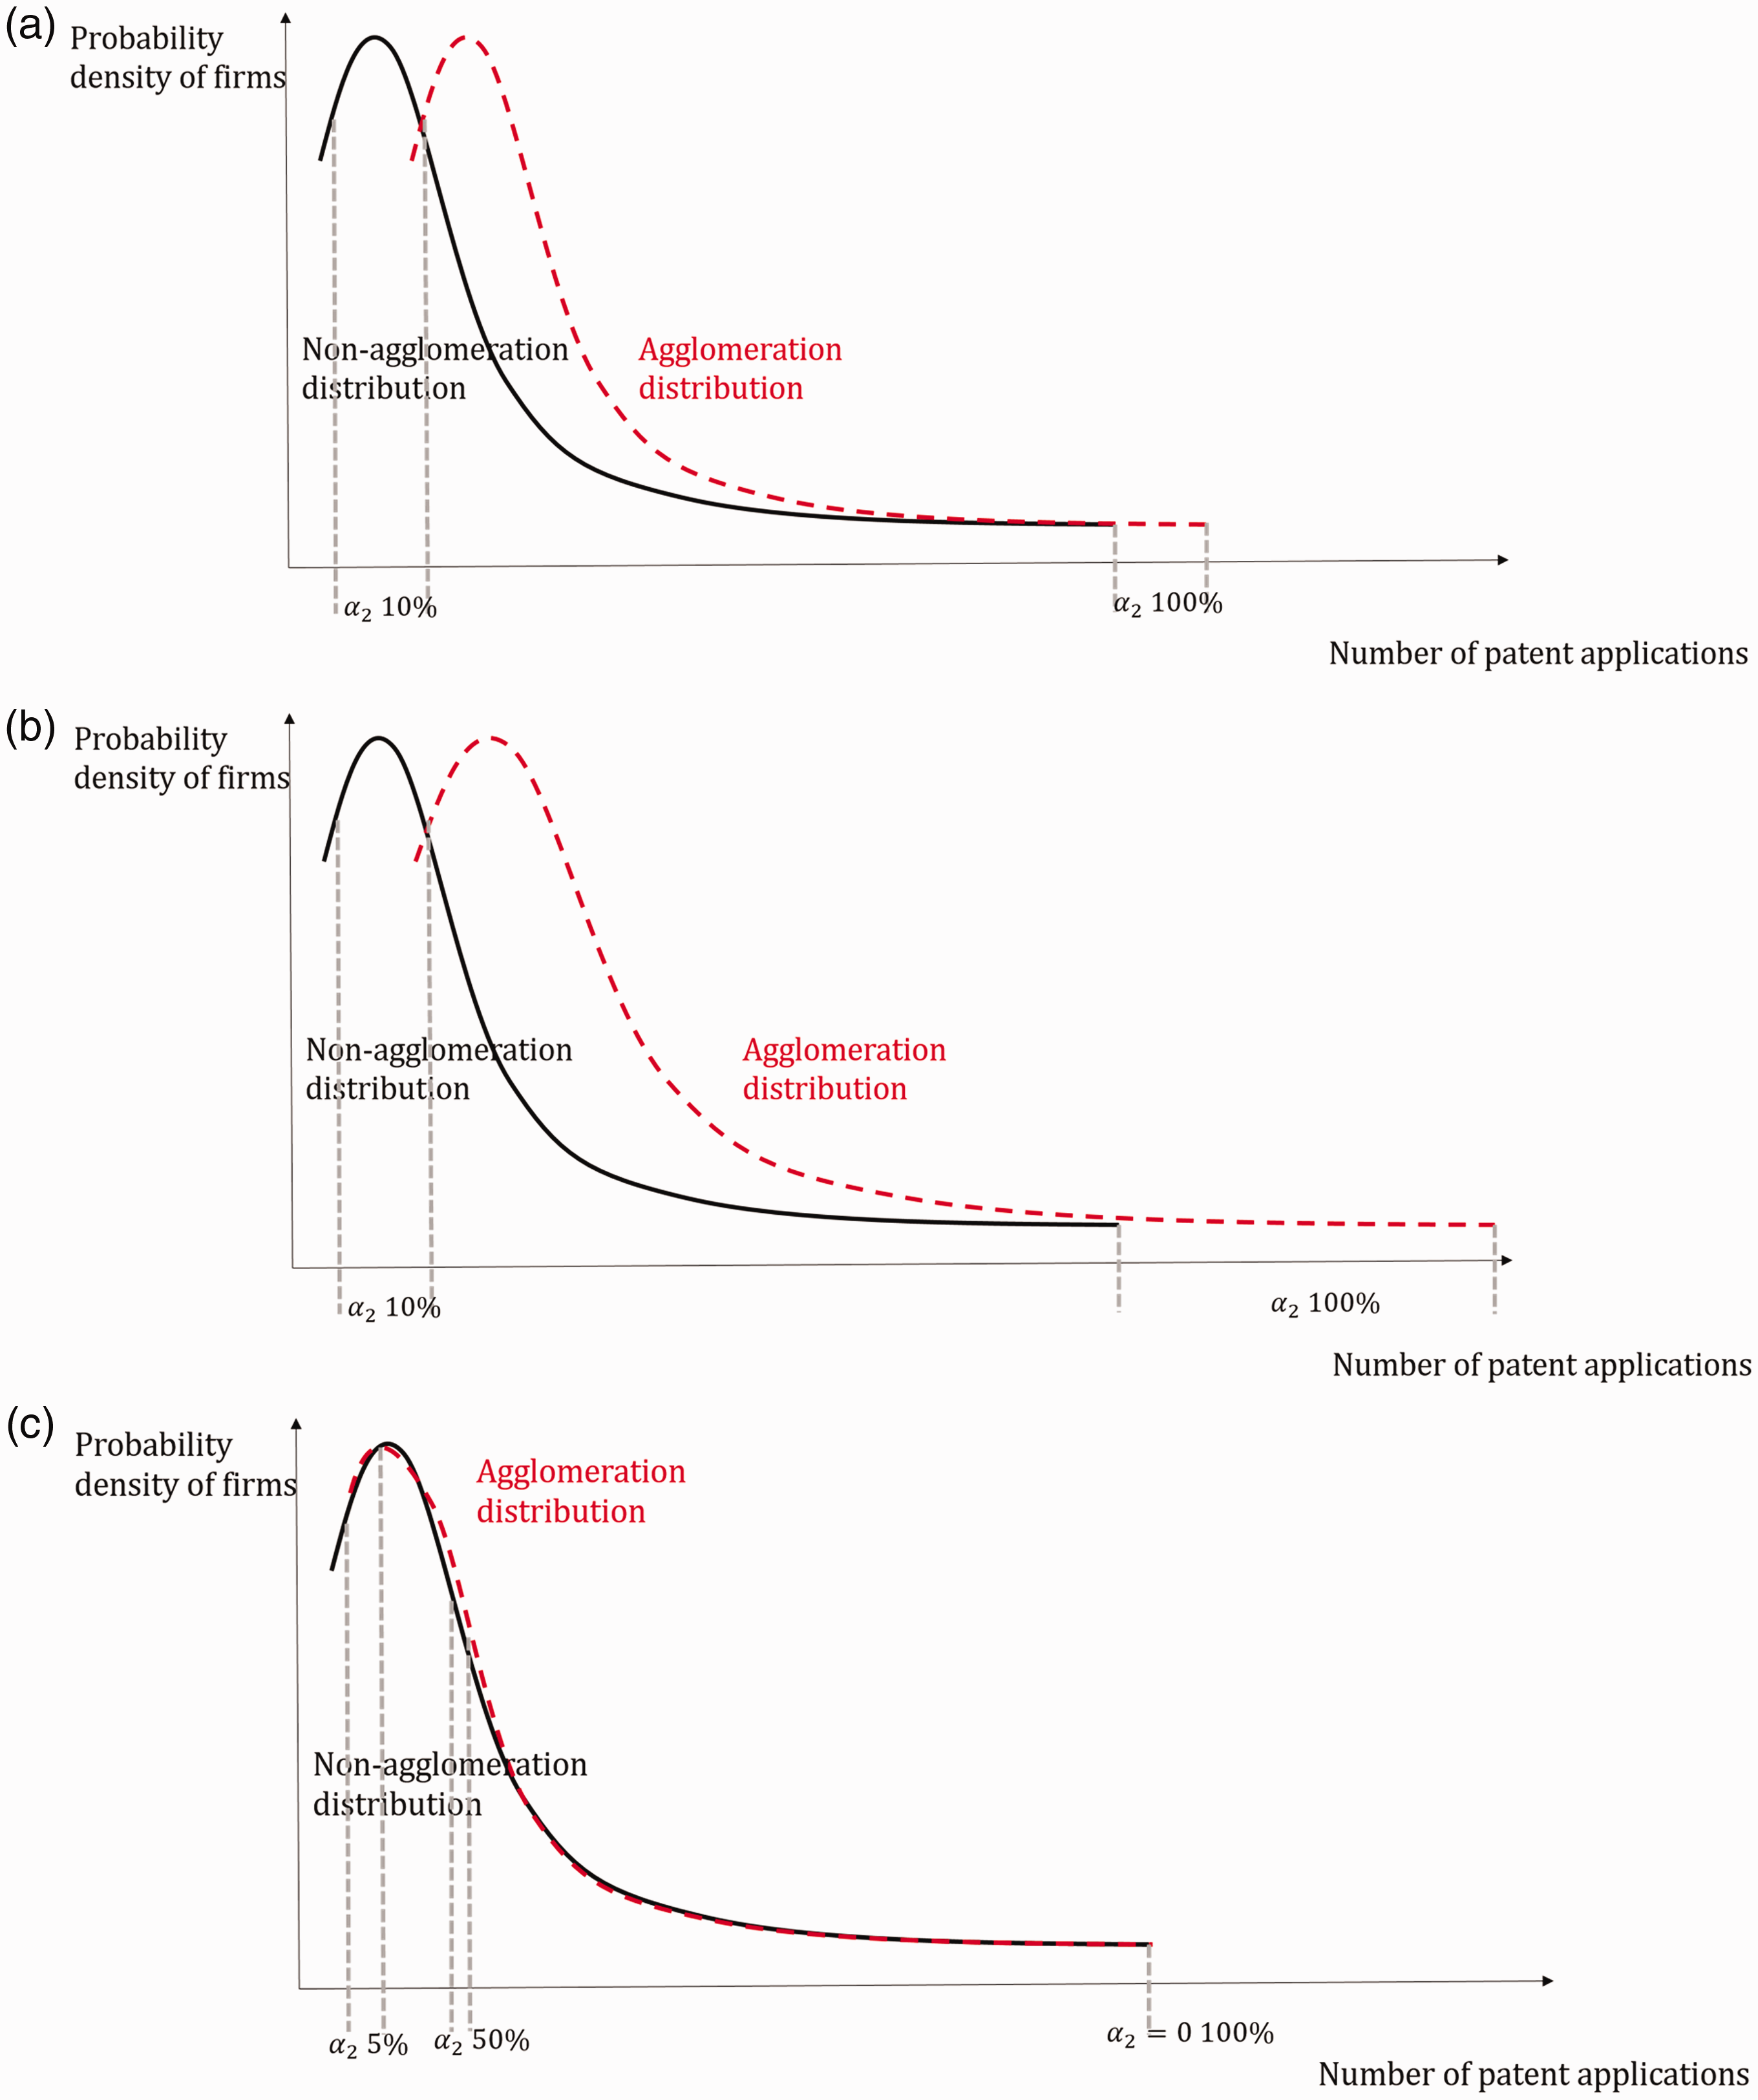
Variations of
Prior to this paper, Combes et al. (2012) used a continuous quantile estimator to estimate the distributional change between firm innovation in agglomerations and non-agglomerations with three parameters: a left truncation S, a right-shift A, and a dilation D. Their method, being continuous, has the advantage of making use of full information of every percentile, but the weakness is that it only delivers an average estimator. The average estimator may not be informative enough, especially for D; for example, it is possible that the dilation effect is actually concentrated in the few top productive firms and their method would not be able to tell.
The discrete quantile method adopted by this paper has the weakness of losing some decile information, as it does not deliver an estimator for every decile, but does have the strength of being more flexible. It is more flexible in the sense that it does not just deliver an average estimator, but delivers a set of estimators at different percentiles. This would allow the dilation effect to differ across percentiles, and to use the previous case again, if the enhanced agglomeration effect is only evident for the top 5% of firms but not the rest of the firms, this method can separate it out.
In addition, the left truncation in Combes et al. (2012) is caused by firms with low total factor productivity exiting by market competition in agglomerations, while that in this case is caused by non- or less innovative firms being more likely to be forced out of the market in agglomerations. The similarities are that it is harder for both less productive and less innovative firms to survive highly competitive markets (agglomerations), and in both cases survival, keeping productivity or innovation constant, still depends on other firm characteristics (such as financial channels, firm size, and the capability of the management team). Thus, the quantile method can detect selection in both cases, and the detected selection effect in both cases contains some level of uncertainty, as relevant firm characteristics cannot be completely controlled. The difference, however, is that the level of uncertainty in this current case is greater than that in the Combes et al. (2012) case: a lot of non-innovative firms do survive. Thus, given that in both cases firm characteristics determining productivity and innovation cannot be completely controlled for, the detected selection effect in this paper contains a greater level of uncertainty and should be interpreted with that in mind.
The bounded estimates for the agglomeration effect from above may still be contaminated by the self-selection bias. More innovative establishments may be systematically attracted by agglomerations (Baldwin and Okubo, 2006), although they survive both agglomerations and non-agglomerations (and thus are not affected by market selection). This concern is especially relevant if
Results
The data confirm that non-innovative firms are less likely to survive in agglomeration. In non-agglomeration locations, non-innovative firms survive at a rate of 99%, while they survive only at a rate of 97.4% in agglomerations. The 1.6% difference is statistically significant at the 5% level. The effects of agglomeration on innovation at different percentiles are reported in Table 1. Agglomeration exhibits significant positive effects on innovation at almost all deciles except the third and fifth deciles, with the magnitudes first decreasing and then increasing—indicating both the selection and the true agglomeration effects. At the first decile, firms in agglomerations file 4.9% more citation-weighted patents than firms outside, while this effect wanes to only 0.3% at the third decile. The coefficient associated with agglomeration at the first decile is also statistically significantly different from those at the second and third deciles at the 5% level, so are the coefficients at the second and third deciles themselves. Beyond the third decile, the effect continuously increases with deciles and finally scales to 193.8% at the 99th percentile. Therefore, the most innovative firms, by locating in agglomerations, almost triple their production of patents. The increase from the third decile is also statistically significant at the 5% level at each subsequent decile except the fifth.
The effect of agglomerations on patent filing at different deciles.
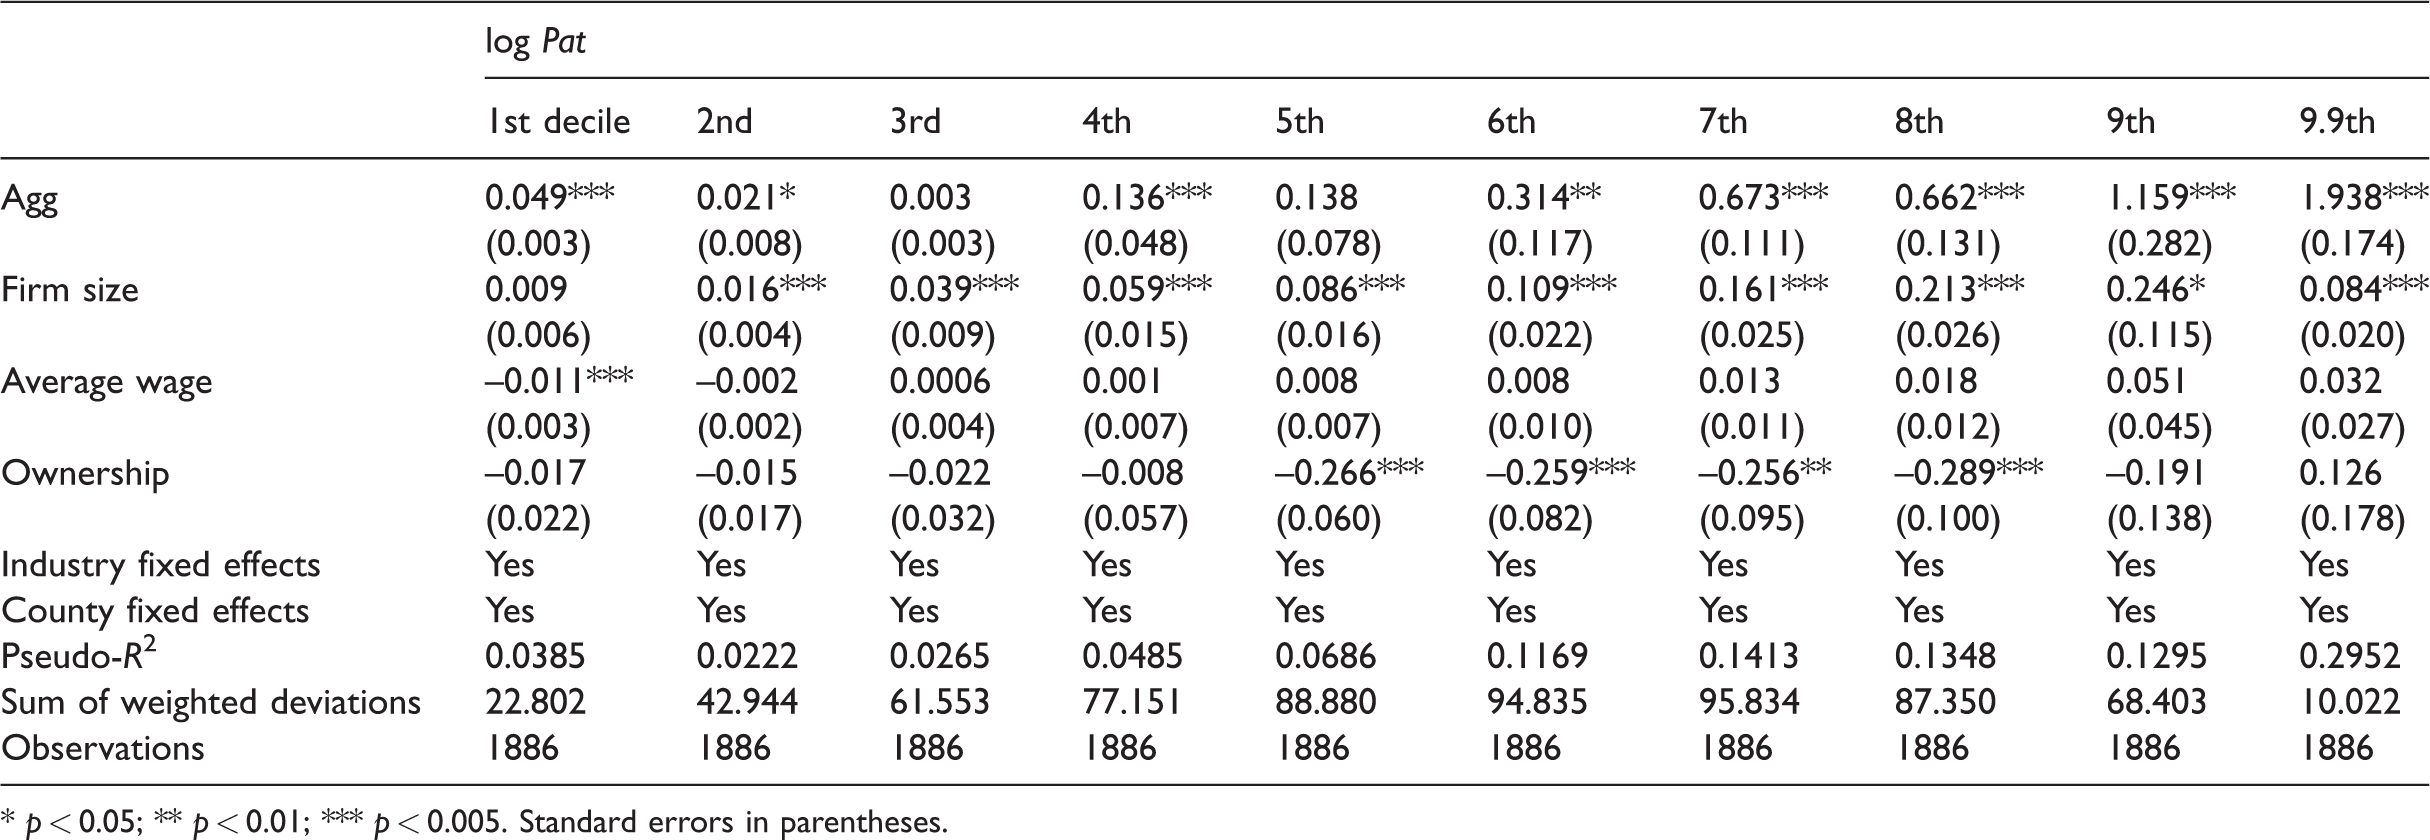
* p < 0.05; ** p < 0.01; *** p < 0.005. Standard errors in parentheses.
Note that the pseudo-R2 for some of these regressions are small, especially compared with studies that measured agglomeration at the aggregate level (metropolitan areas with above-median density) with a similar method, such as Combes et al. (2012) and Arimoto et al. (2014), in which R2 is about 0.7 to 0.9. But in studies that measure agglomeration at the firm-specific level, R2 typically drops significantly. For example, in the study by Cainelli and Ganau (2018), pseudo-R2 for firm survival is only about 0.05, while adjusted R2 for firm productivity is around 0.2. And for studies with innovation as the dependent variable, R2 tends to be small. For example, Belenzon and Schankerman (2013) have R2 mostly around 0.07. In Bünstorf and Schacht (2013), pseudo-R2 is within the range of 0.02 to 0.38. In particular, this study regresses by quantile, which may lead to even smaller R2. An example is Orlando (2004); in its quantile regressions for certain quantiles, pseudo-R2 even drops to –0.00. Thus, compared to prior studies, while the pseudo-R2 of this paper is not large, it is by no means abnormal.
Table 2 places bounds on the agglomeration effect and the selection effect. Using the results presented in Table 1, I find that the agglomeration effect at best encourages median innovative establishments to apply for 13.8% additional citation-weighted patents per year. The effect is more than 10 times larger at the 99th percentile. Thus, the agglomeration effect benefits innovative establishments much more than the less innovative establishments, and most of these benefits are reaped by the top 10%, or even the top 1% of establishments. To put this into perspective, a median innovative establishment not in an agglomerations files 0.32 citation-weighted patent applications per year, so a 13.8% increase implies 0.04 additional patent applications; in monetary terms, this transforms to 0.11 to 0.13 million dollars of firm value, using estimates of stock market return of patents given by Hirschey and Richardson (2001). In comparison, an average 99th percentile establishment not in an agglomeration files 10.2 citation-weighted patent applications per year, so a 193.8% increase implies 19.77 more patents; this transforms to US$54.36–64.25m in firm value. To generalize to all innovating establishments, the median agglomeration effect lies between 13.5% and 13.8%, while the average effect ranges from 31.2% to 31.5%. At the same time, the magnitude of the selection bias is much larger than that of the true agglomeration effect at the first two deciles, and of comparable size at the third decile. These imply a bias of an OLS estimator. To formally evaluate the bias, I run an OLS regression with equation (1) and the coefficient on the agglomeration status for all innovative establishments is 38.7%. Thus, the upward bias is around 7.2–7.5%.
The bounds on the true agglomeration effect and the selection effect on patent filing at different deciles.
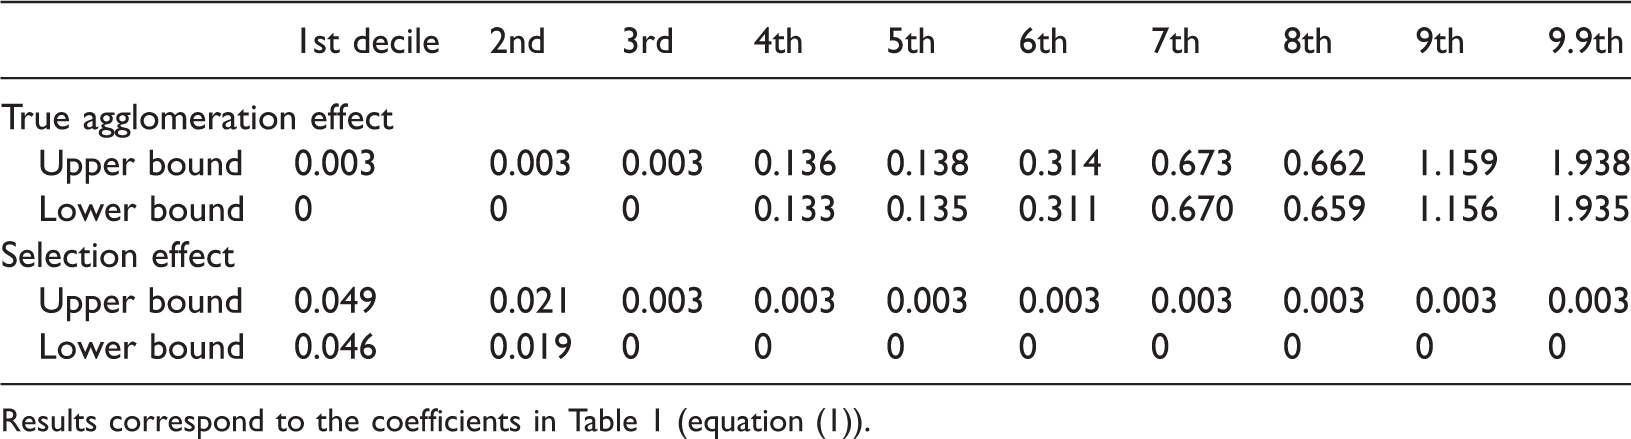
Results correspond to the coefficients in Table 1 (equation (1)).
The above analyses show that the effect on innovation is sizable in 1-mile-radius agglomerations. This finding is in line with Wallsten (2001), Arzaghi and Henderson (2008), and De Silva and McComb (2012). The essence of this “agglomeration” effect is likely related to the knowledge spillover and network building associated with face-to-face communications (Glaeser, 1998; Storper and Venables, 2004). Among the three major benefits of agglomerations (Marshall, 1920), inputs sharing and labor pooling are likely to prevail at a larger geographical scale. However, the third, and likely also the most important, benefit for innovation, knowledge spillover, may prevail at a local scale if the relevant knowledge is uncodified and relies on face-to-face interactions. While it is difficult to measure uncodified knowledge, some of this uncodified knowledge becomes codified later on and establishments file for patents on the portion that is eventually codified (Senker, 2008). Thus, I use the application for patents as an imperfect measurement for knowledge spillover, while fully acknowledging its negligence of some other innovative activities. Allen and Cohen (1969) measured uncodified knowledge spillover by another imperfect measurement, the frequency of interactions between people, and found even within a single building that physical distance still significantly affects that frequency. This paper confirms that similar conclusions hold for interactions between businesses.
Table 3 compares the effect of agglomeration across geographical scales. The results show that selection is smaller in magnitude in half-a-mile agglomerations, but it may or may not exist at all in agglomerations beyond 2 miles in radius. And at 10 miles in radius, selection completely vanishes. This result is consistent with De Silva and McComb (2012), who found that in 1-mile-radius clusters, the share of own-industry employment increases firm mortality. While it is impossible for this paper to completely disentangle different mechanisms causing the selection effect, the results seem to suggest that the competition of local scales to facilitate face-to-face communications is the dominating source. The other source, the competition over product, labor, and suppliers, which likely operates on the scale of the entire metropolitan area, is not found at the scale of 10 miles in radius. At the same time, the average effect of agglomeration on innovating establishments in half-a-mile agglomerations is 35.89%, in 2-mile ones 22.07%, in 5-mile ones 39.54–40.04%, and in 10-mile ones 48.3%. In comparison, a 1-mile-radius agglomeration exhibits an average effect of 31.2–31.5%.
The effect of agglomerations across geographical scales.
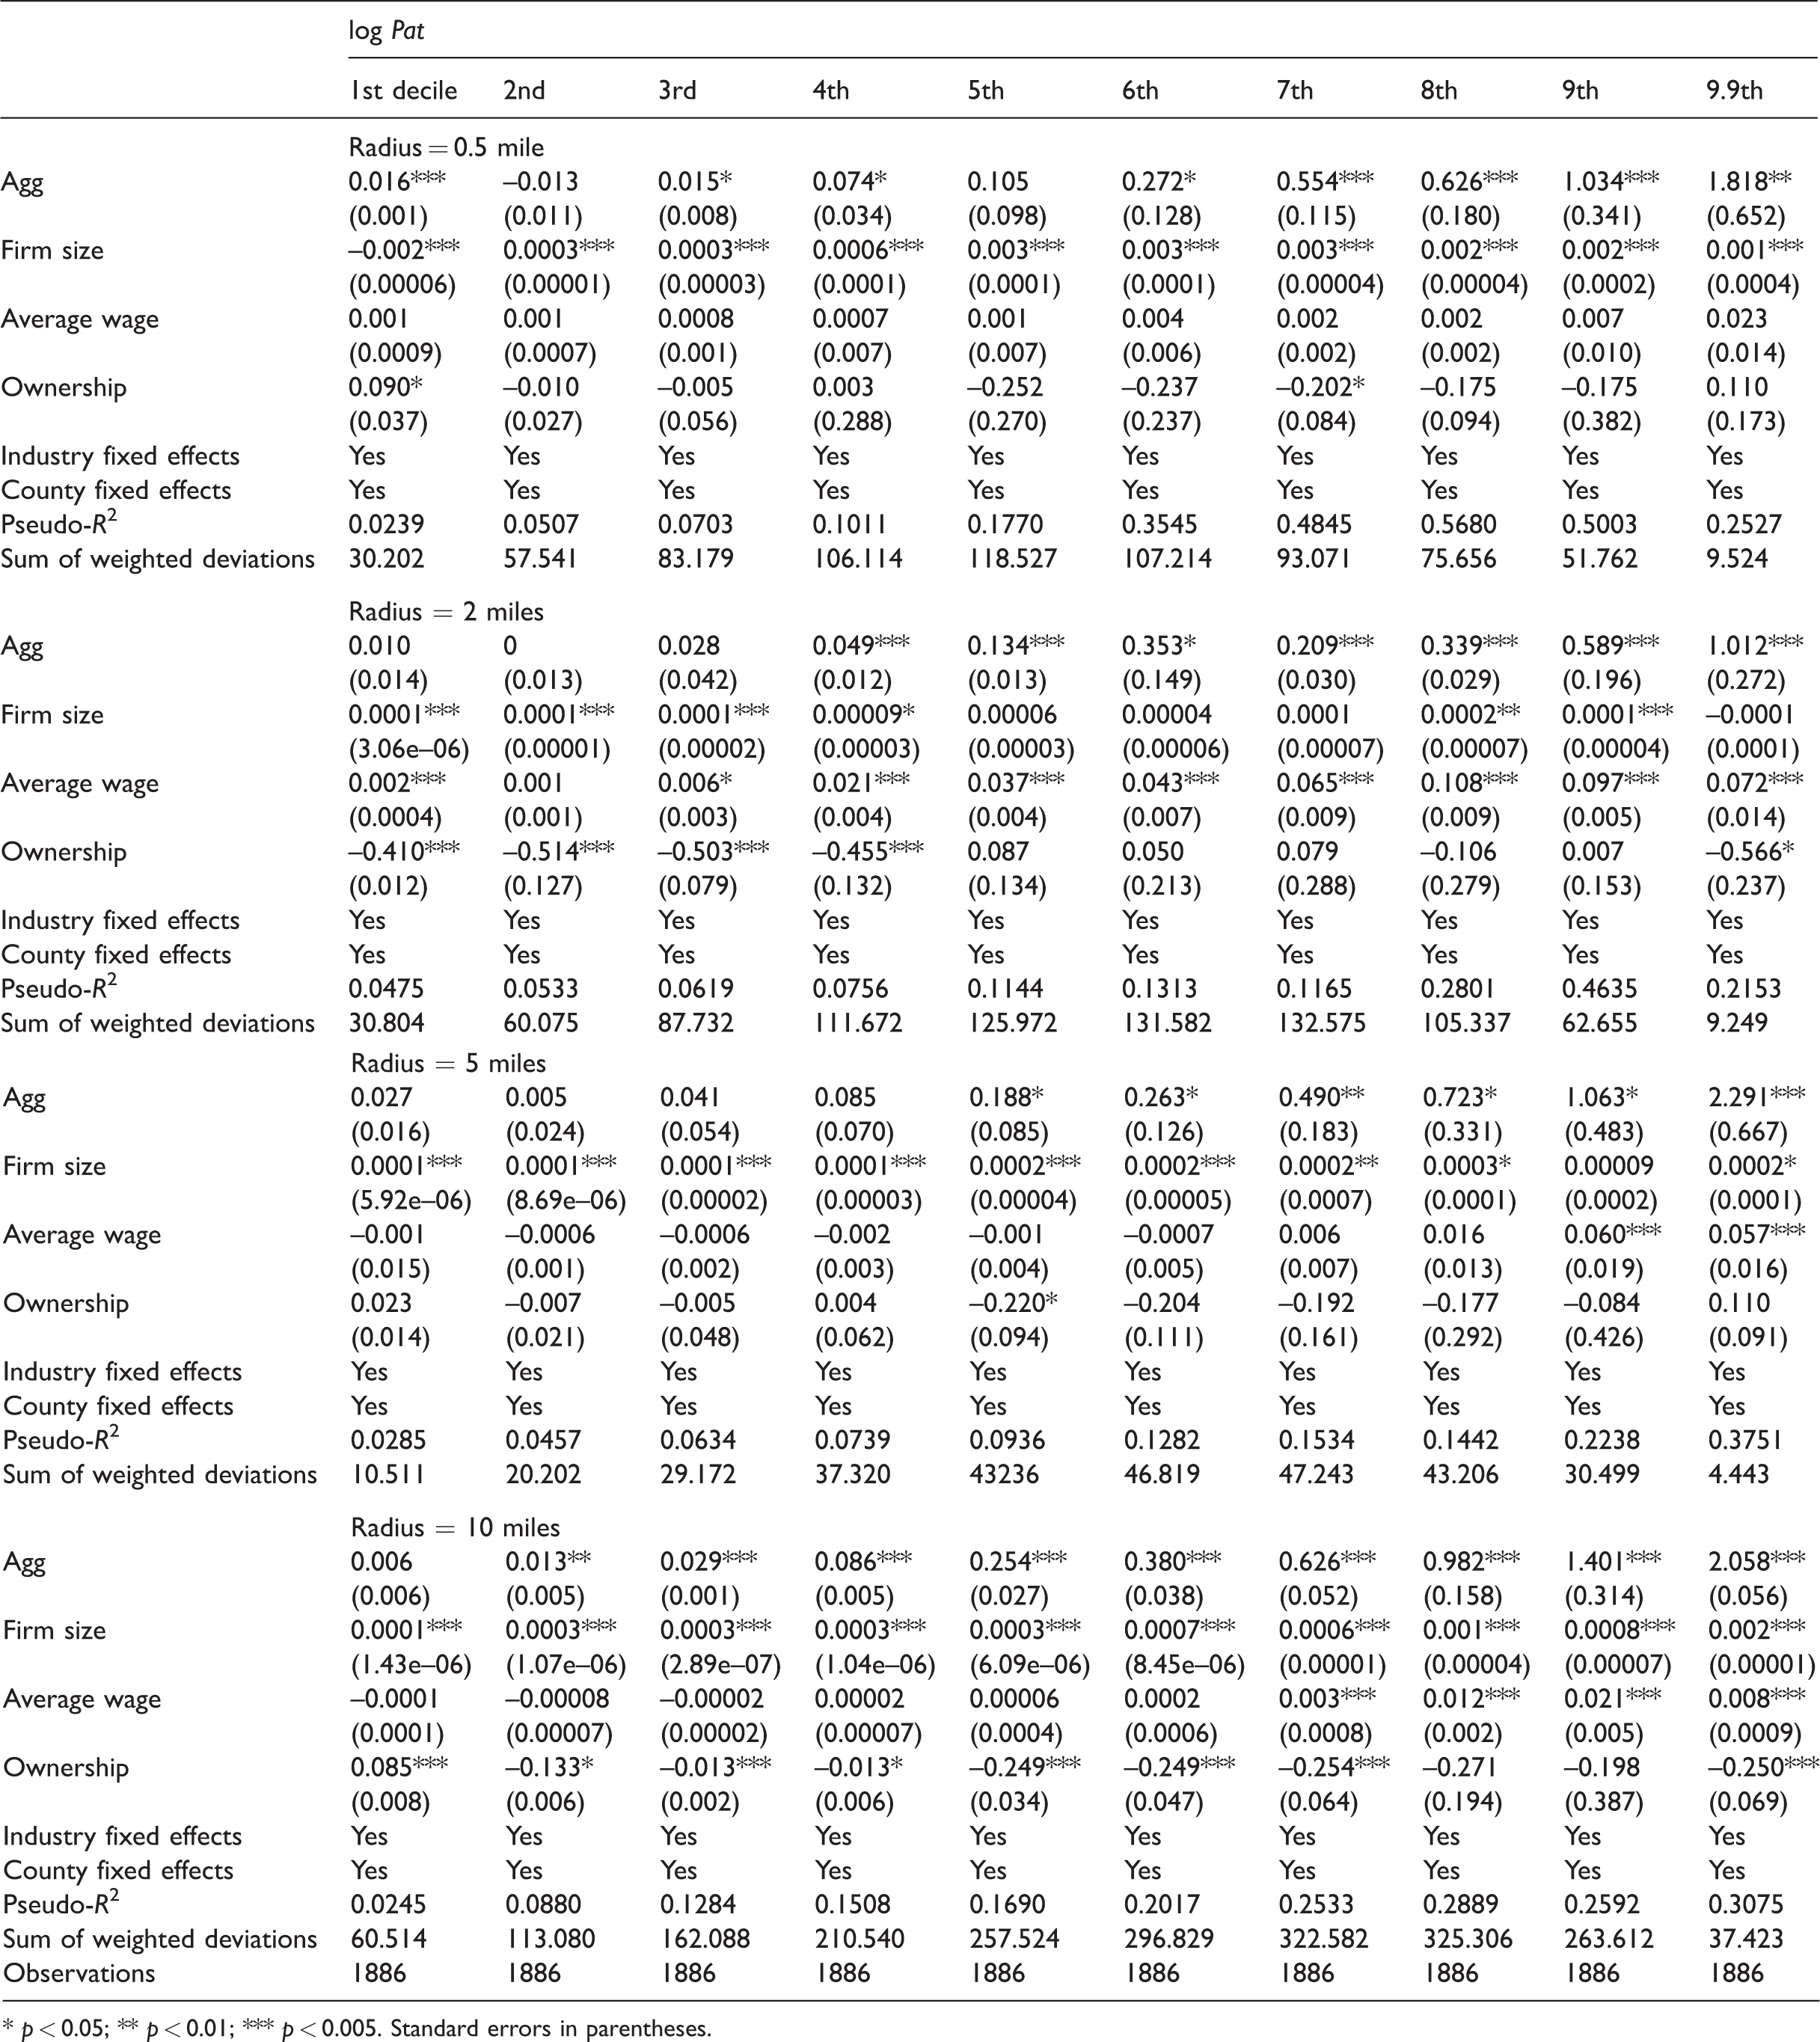
* p < 0.05; ** p < 0.01; *** p < 0.005. Standard errors in parentheses.
I also deal with the potential contamination of the self-selection effect. I run equation (1) with the new firm sample and find self-selection negligibly small at all deciles and in agglomerations of all sizes. They are no more than 5% of the coefficients in Table 1 and statistically indistinguishable from zero. Thus, the complication caused by self-selection is minimal and the bounded estimates are trustworthy.
Robustness tests
Alternative specifications
I adopt two alternative specifications to test the sensitivity of the results to the discrete decile specification adopted in the main analysis. First, I apply the Combes et al. (2012) method to test whether the bounded estimates are in line. The estimated results are shown in Table 4. The left truncation is 1%, and statistically insignificant; this is slightly larger than the average estimate in the main analysis of this paper (selection effect around 0.4–0.7%), but the latter falls into the 95% confidence interval of the former. The average right-shift is 43.72%. While the point estimate is larger than the estimates in the main analysis (31.2–31.5%), the latter again falls right into the 95% confidence interval of the former. Thus, these estimates are not statistically distinguishable from each other, and this confirms that the bounded estimates are trustworthy and informative of the true effect. The right dilation is 249%, with the 95% confidence interval ranging from 135% to 362%.
The effect of agglomerations on patent filing with the Combes method.

** p < 0.01; *** p < 0.005. Standard errors in parentheses.
Second, I adopt zero-inflated negative binomial regression to estimate the effect of agglomeration on all establishments, including those that are non-innovative. I use the stock of previous patents (before 2004, the start of the study period, since 1980) to predict the subsequent innovation outcome, and equation (1) to estimate how innovative establishments are. The number of industry dummy variables is quite large and the negative binomial regression will not converge with them; thus, I have to drop the industry dummy variables in order to estimate this specification. The results are shown in Table 5, with the average agglomeration effect being 64.9%. This point estimate is larger than both the main result and the result from the Combes et al. method. Similar to the OLS regression, the zero-inflated negative binomial regression does not fully separate the impact of the selection effect. Nonetheless, the 95% confidence intervals of these three estimates all overlap with each other.
The effect of agglomerations on patent filing with the zero-inflated negative binomial method.
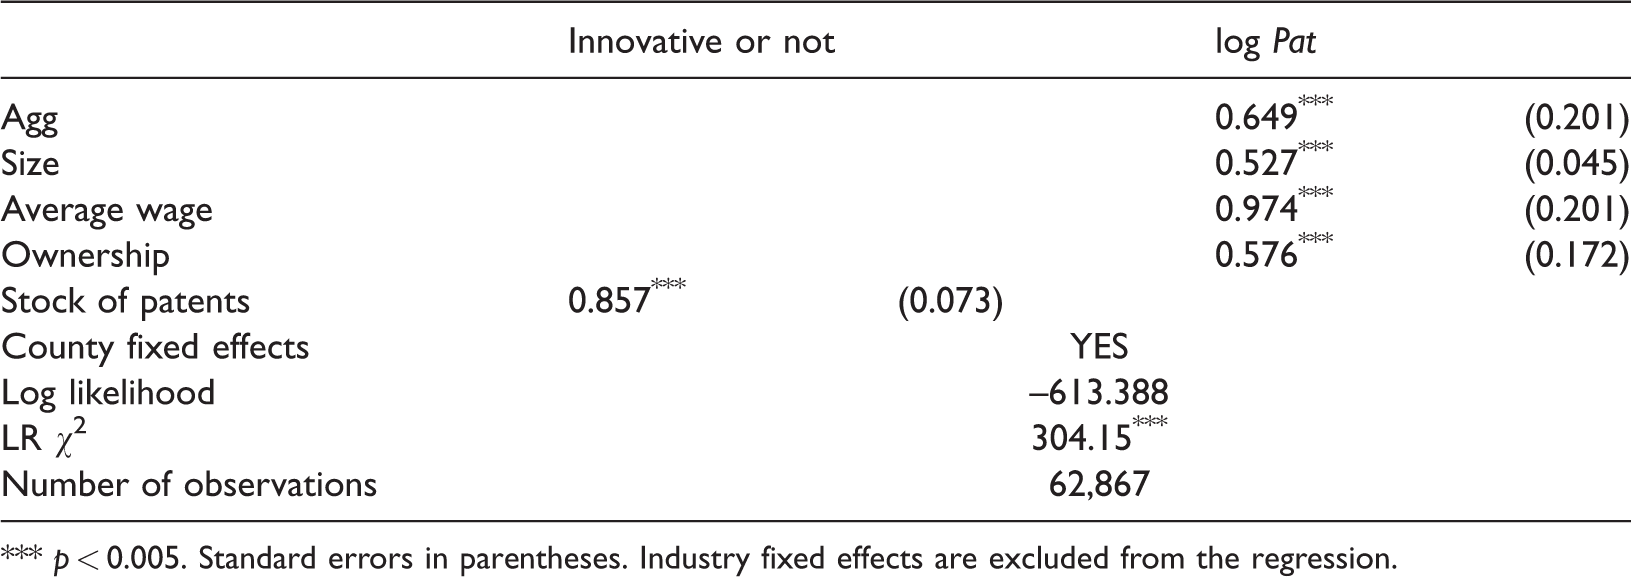
*** p < 0.005. Standard errors in parentheses. Industry fixed effects are excluded from the regression.
Alternative definition of agglomerations and alternative treatment of distance
I adopt three alternative measurements for agglomerations, and two of them also involve an alternative treatment of distance. First, I use the density of establishments instead of employment to define agglomerations. The results, shown in Table 6, are quite robust, while the selection effect estimated at the lowest two deciles is smaller in magnitude. The main measurement in this paper, the density of employment, assumes spillover between workers, while the alternative measurement, the density of establishments, assumes spillover between establishments. Both are found to be true and of comparable size in the study region of this paper.
The effect of agglomerations, defined by establishment density, on patent filing at different deciles.
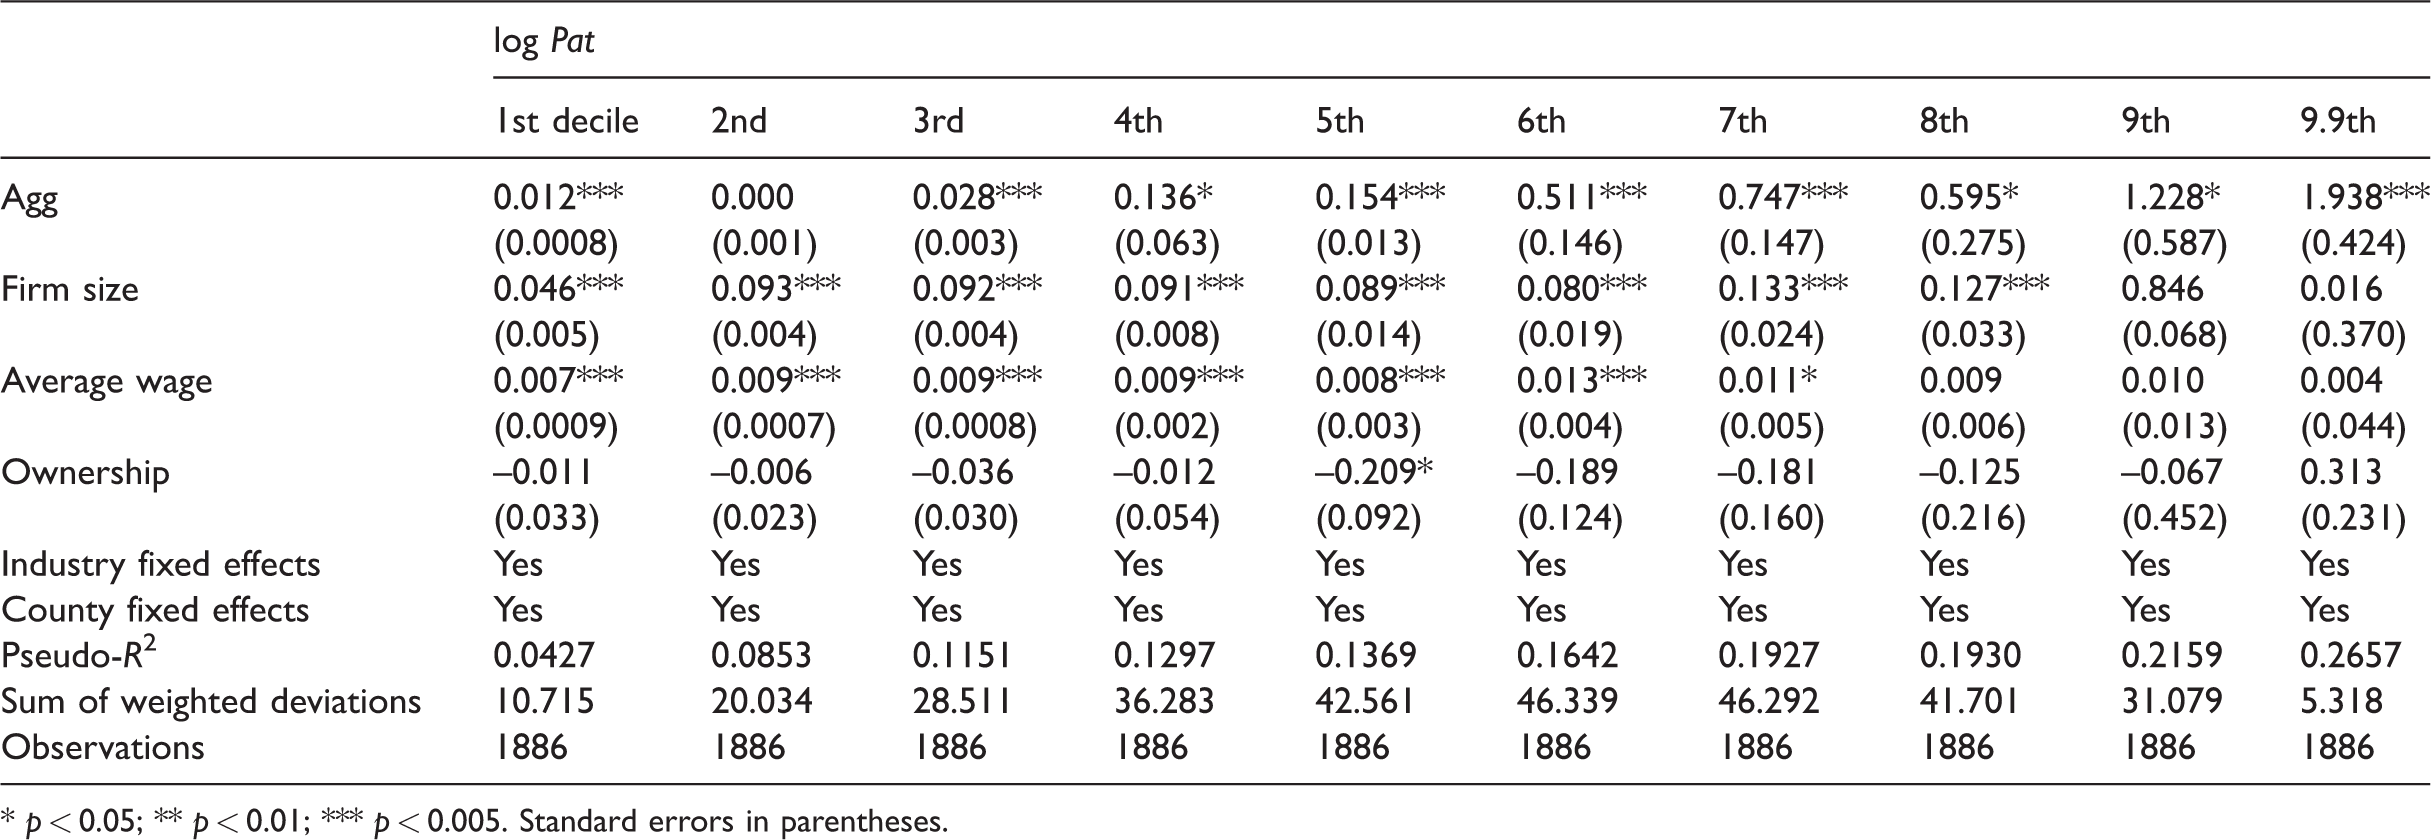
* p < 0.05; ** p < 0.01; *** p < 0.005. Standard errors in parentheses.
Second, I define agglomeration by above-median employment density in a county, a similar definition as used by Combes et al. (2012). Note that this is also a different treatment of space, as the administrative boundary is used as the boundary for agglomeration. The results are shown in Table 7 and again are quite robust. Numerically, the selection effect becomes larger while the true agglomeration effect becomes smaller; statistically, the results are not significantly different from those in the main regression.
The effect of agglomerations, defined by employment density at the county level, on patent filing at different deciles.
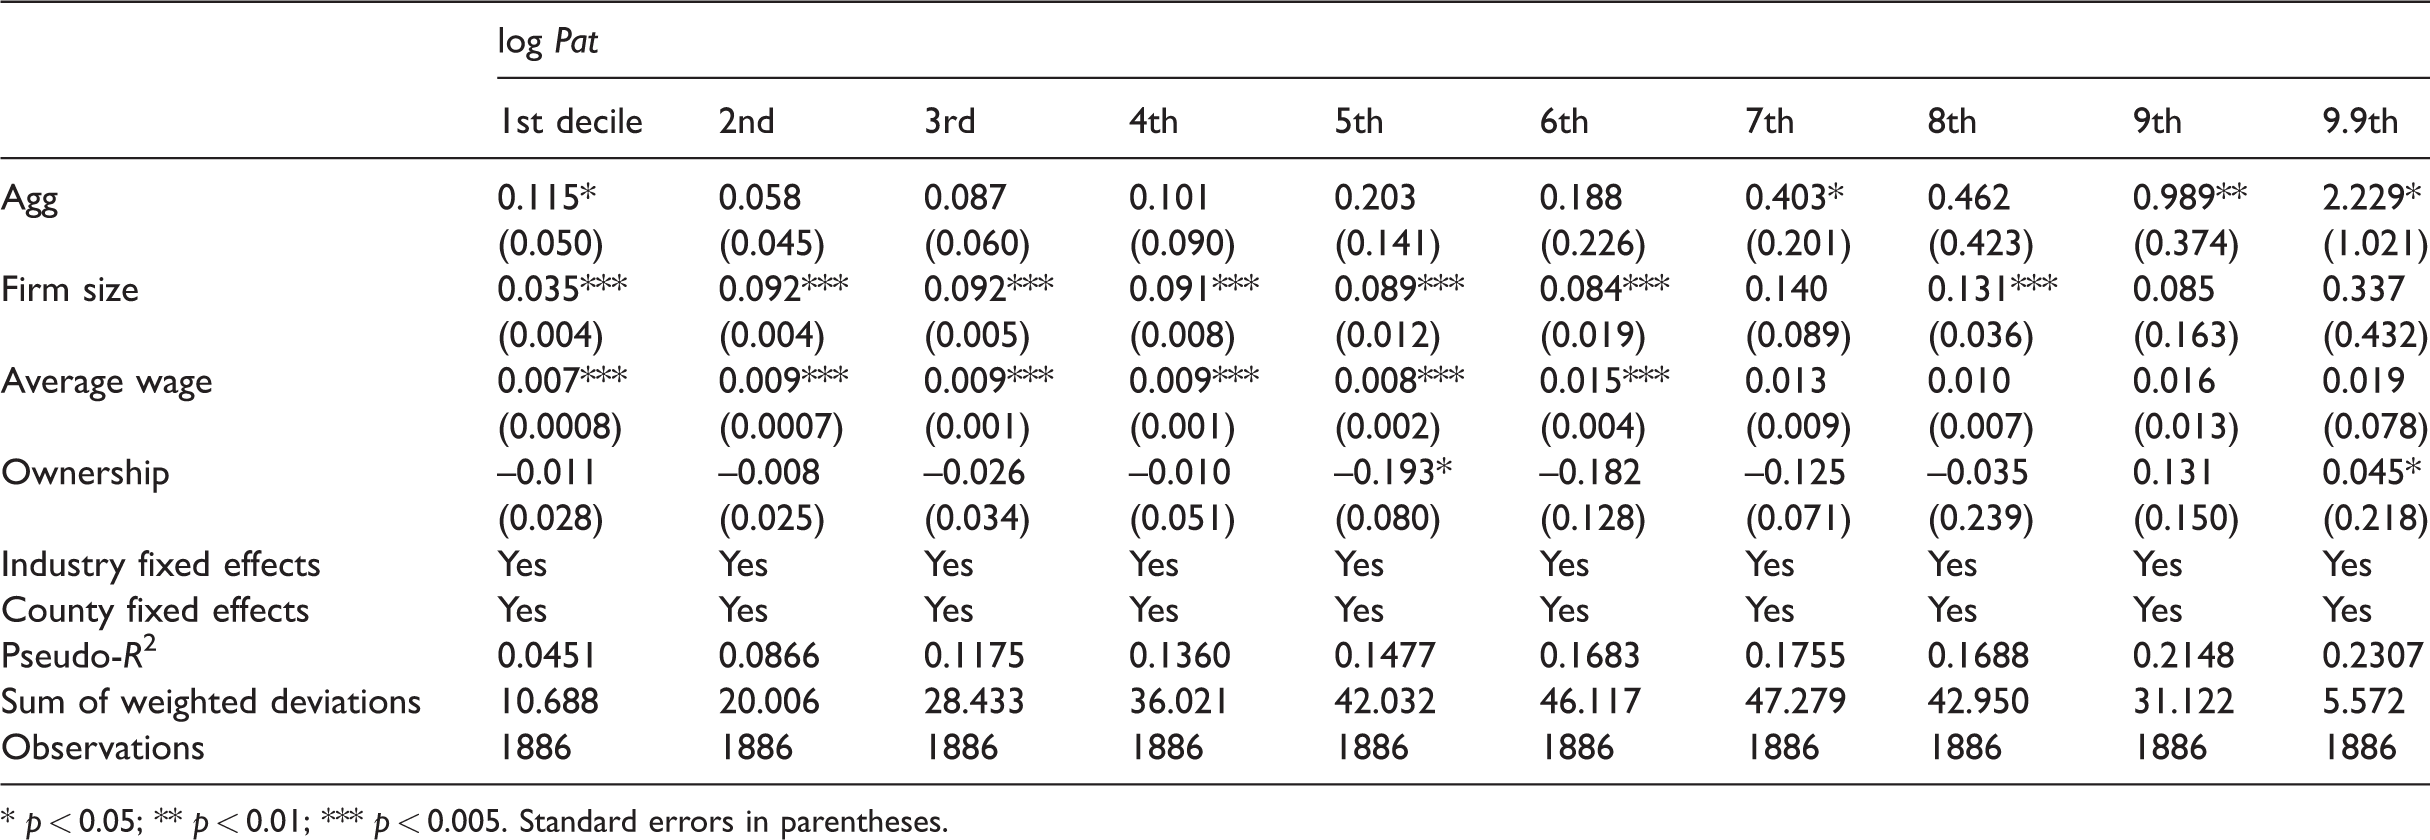
* p < 0.05; ** p < 0.01; *** p < 0.005. Standard errors in parentheses.
Finally, I adopt the EG index of coagglomeration (Ellison and Glaeser, 1997) to capture various agglomeration mechanisms aside from pure employment or establishment concentration. Instead of a dummy variable, agglomeration is measured here with a continuous variable. Due to the fact that the EG index requires breaking down the overall geographical area into a finite number of subareas, this index is calculated at the county level and is standardized for easier interpretation. The results, shown in Table 8, again are quite consistent with the main analysis results. The selection effect is detected at the first and second deciles, while the true agglomeration effect is detected at the sixth decile and above; the agglomeration effect increases with deciles.
The effect of agglomerations, measured by Ellison and Gleaser’s index of coagglomeration (EG), on patent filing at different deciles.

* p < 0.05; ** p < 0.01; *** p < 0.005. Standard errors in parentheses.
As a side point, in Table 9 I also test which mechanism of agglomeration, the Marshallian localization (Marshall, 1890) or the Jacobs’ diversity (Jacobs, 1969), causes the impact on innovation. The Marshallian localization is measured by the Herfindahl index, while the Jacobs’ diversity is measured by the industry Gini index; both are indices frequently adopted by previous studies (Beaudry and Schiffauerova, 2009). Both indices are standardized so that their coefficients can be directly compared; also note that the coefficients on the Gini index are expected to be negative, as a larger Gini index means a less diverse industrial structure. Two findings stand out from Table 9. First, the selection effect at the lower deciles is mostly caused by the Marshallian localization, that is the concentration of same-industry employment; this is precisely the cause of competition. Second, the true agglomeration effect on innovation is predominantly driven by the Jacobs’ industry diversity, especially at the sixth decile and above.
The effect of Marshallian localization versus Jacob’s diversity on patent filing at different deciles.
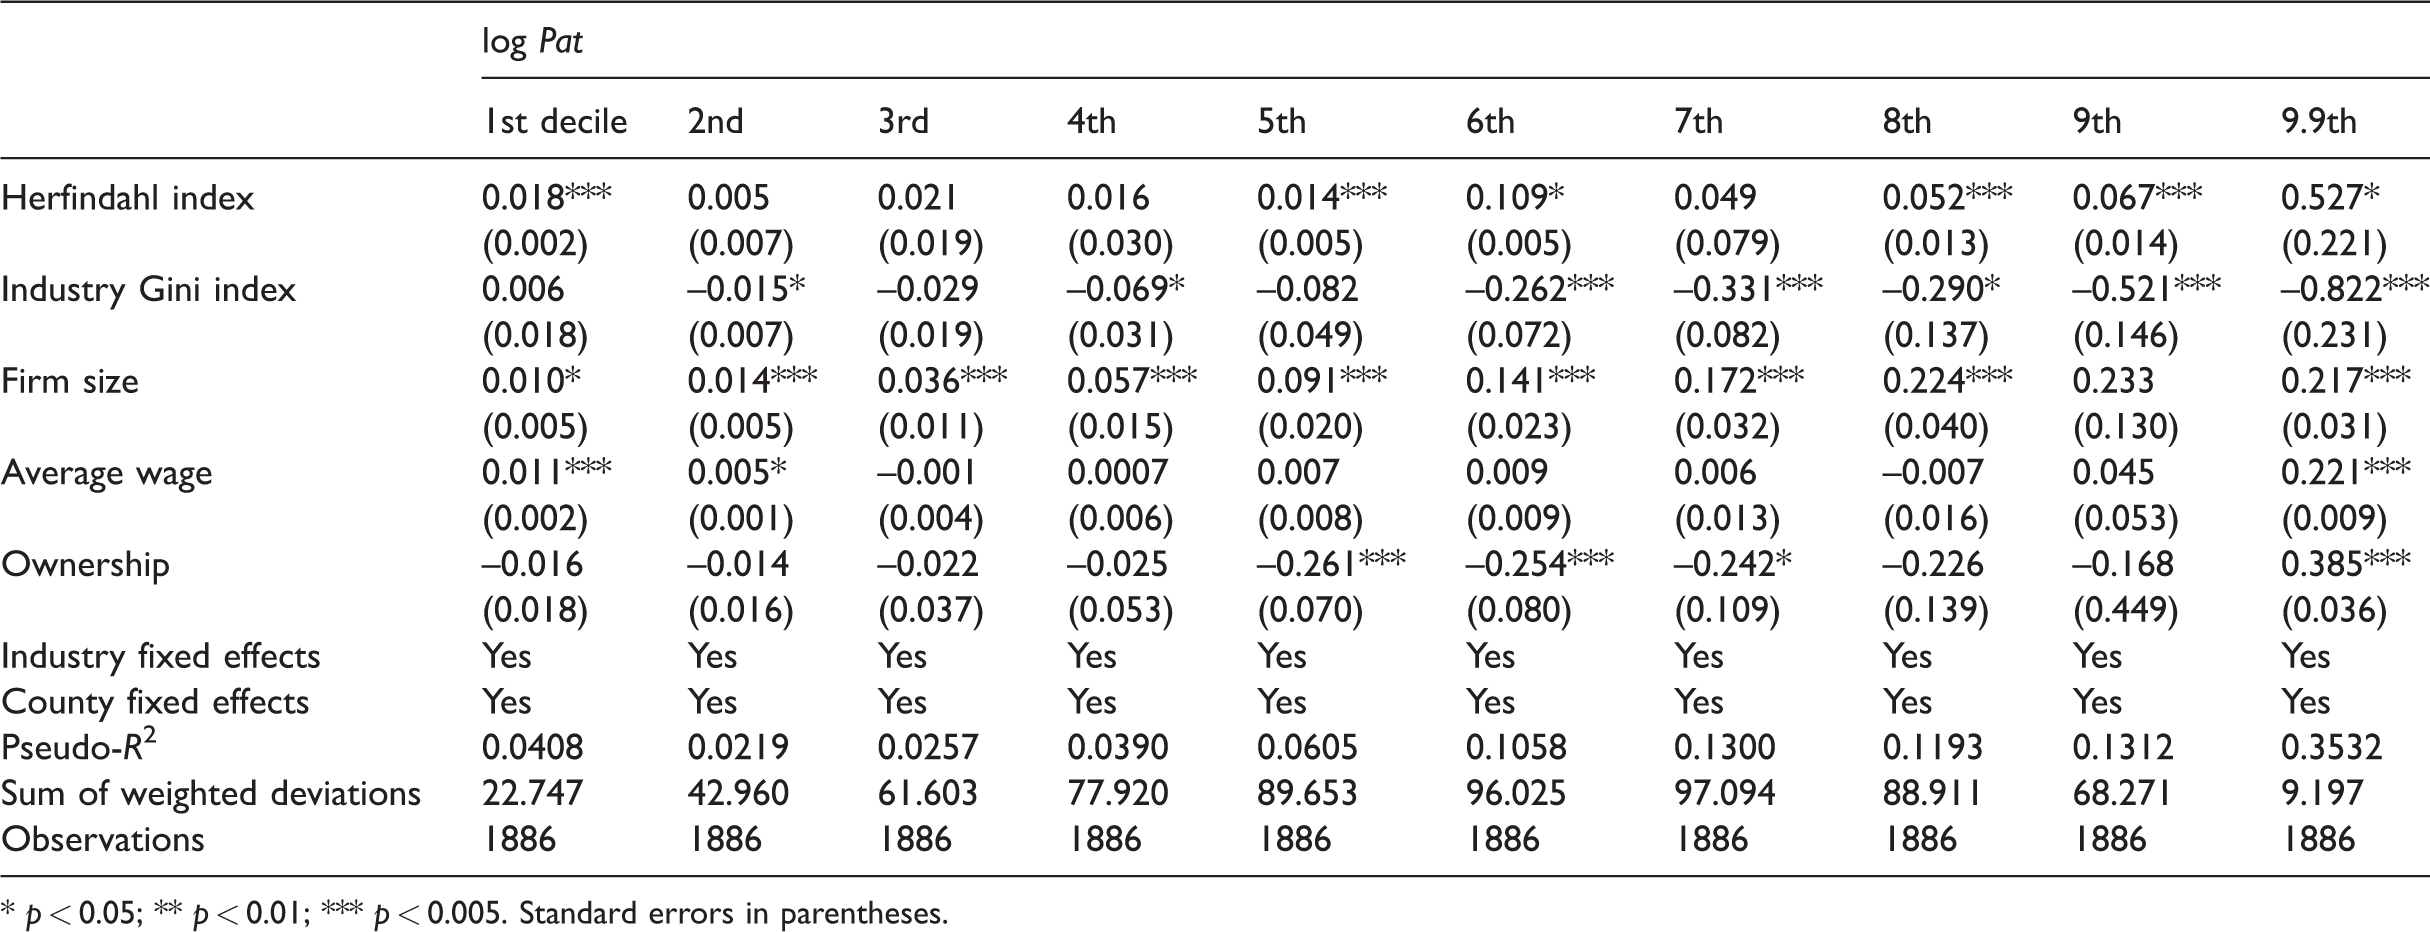
* p < 0.05; ** p < 0.01; *** p < 0.005. Standard errors in parentheses.
Aside from using the administrative boundary to measure distance, I also use continuous distance to measure space. In Table 10, I use inverse distance to weight employment around an establishment as the definition for agglomeration, and standardize the variable for easy comparison with previous results. Table 10 shows a consistent pattern of the coexistence of selection (at lower deciles) and true agglomeration effect (at the fifth decile and beyond). The coefficients are smaller compared to previous results; this is sensible as in this specification, faraway employment is also taken into consideration as a part of the agglomeration effect, while their effect may be quite small.
The effect of agglomerations, measured by inverse-distance-weighted employment, on patent filing at different deciles.

* p < 0.05; ** p < 0.01; *** p < 0.005. Standard errors in parentheses.
Alternative weighting schemes of patent applications
I apply six other weights to patent applications. First, I assign zero weights on ungranted applications, that is I count patent grants instead of applications. This reduces the magnitudes of the selection effect and the agglomeration effect, but does not change the conclusion. Second, I apply no weights to patent filings. The selection effect rises by about 0.06% while the agglomeration effect falls by 2.1–3.4%. Third, I weight by number of citations relative to the average citation in the same technology class and of the same age. Compared to the main weighting scheme, this weight considers the difference in citations across technology class and the nonlinearity of the accumulation of citations over the lifecycle of patents. However, subject to the relatively small number of patents in each technology-class-by-age group, this weight is also more sensitive to outliers. Nevertheless, I find the main results barely change either qualitatively or quantitatively with this weight. Fourth, I weight by total citations, and the results are still qualitatively robust, with the agglomeration effect boosting by about 3–10% in the top three deciles. Last, I exclude self-citations. This does not affect the main results much except at the top decile, where the coefficient decreases by 15.6%. It shows that only top innovators self-cite frequently.
Change over time
I also test the change of the agglomeration effect over time by dividing the 10-year study period into halves. The result, while qualitatively robust in both periods, is quantitatively enlarged in the second. The agglomeration as well as the selection effect grow over time. The potential erosion of the agglomeration effect in the modern age identified by prior studies (Packalen and Bhattacharya, 2015) is not evident in this case.
The impediment effect of county boundaries
I further test the potential impediment effect of county boundaries on knowledge spillovers. I run the same regressions on agglomerations spanning multiple counties, and the result remains fairly robust with minimal change in the coefficients. Thus, county boundaries do not appear to inhibit knowledge spillovers, and this strengthens my case of treating space continuously instead of cutting it by administrative boundaries.
Conclusion
This paper brings to our attention that the agglomeration effect and the selection effect coexist. As a result, the effect of agglomerations on innovation estimated by OLS regression is upwardly biased. A more precise estimate of the agglomeration effect is provided using quantile regression, applied to the establishments in the state of Maryland over the 2004–2013 period. An average establishment that files for at least one patent during the study period increases patent applications by 31.2–31.5% by locating in agglomerations, while at the same time, non-innovators are 1.3% less likely to survive in agglomerations.
This paper informs policymakers and entrepreneurs. The more precisely estimated agglomeration effect can be applied to cost–benefit and cost-effectiveness analyses of urban and industrial policies, while the different effects across geographical scales can be used to determine how close policymakers should aim for encouraging firms to locate near to each other. For firm managers making locational choices, the innovativeness of their firms needs to be carefully evaluated. Highly innovative firms benefit the most by locating in denser employment centers, while non-innovators can increase their chance of survival by avoiding competitive locations.
Despite this paper’s efforts to estimate the true agglomeration effect and the selection effect, behind both of these effects there are multiple Marshallian mechanisms at work, such as sharing, matching, and pooling (Rosenthal and Strange, 2001). A test between the Marshallian localization versus the Jacobs’ diversity is conducted in the robustness test, but aside from that a detailed breakdown of the Marshallian mechanisms is beyond the scope of this study. The estimation of the detailed mechanisms can help us further understand the fundamental determinants of the agglomeration forces. I look forward to seeing other studies taking on the task.
Supplemental Material
Supplemental material for Agglomeration and innovation: Selection or true effect?
Supplemental Material for Agglomeration and innovation: Selection or true effect? by Li Fang in Environment and Planning A: Economy and Space
Footnotes
Acknowledgments
The author is grateful to Dr. Gerrit Knaap and Dr. Robert Schwab at the University of Maryland, College Park for their suggestions on an earlier version of this paper.
Declaration of conflicting interests
The author(s) declared no potential conflicts of interest with respect to the research, authorship, and/or publication of this article.
Funding
The author(s) disclosed receipt of the following financial support for the research, authorship, and/or publication of this article: This work was supported by the Lincoln Institute of Land Policy.
Notes
References
Supplementary Material
Please find the following supplemental material available below.
For Open Access articles published under a Creative Commons License, all supplemental material carries the same license as the article it is associated with.
For non-Open Access articles published, all supplemental material carries a non-exclusive license, and permission requests for re-use of supplemental material or any part of supplemental material shall be sent directly to the copyright owner as specified in the copyright notice associated with the article.
