




Abstract
We examine the relationship between higher education institutions (HEIs) and local population and employment growth, using a sample of fifty-seven New Zealand territorial local authorities between 1986 and 2013. We account for HEI endogeneity by estimating with difference generalized method of moments; by including lagged growth plus a large set of other controls; and by including official demographic projections to account for growth-related factors, including university student numbers, which were projected by official statisticians but are otherwise unobservable to the econometrician. Holding all else equal, we find that a greater share of university equivalent full-time students (EFTS) to working-age population raises population and employment growth. At the means, a one percentage point increase in the university EFTS share is associated with a 0.19 (0.14) percentage point increase in the annual average population (employment) growth rate. This (significant) relationship holds under virtually all alternative specifications, including different HEI activity definitions, samples, and specifications. Growth related to polytechnic activity is much weaker and is estimated far less precisely. Consistent with urbanization (but not localization) externalities, we find no evidence for complementarities between HEI activity and several innovation-related area characteristics, possibly reflecting the primary industry base of New Zealand.
Do higher education institutions (HEIs), such as universities and polytechnics, affect economic outcomes in their hosting areas? This question is important for national policy makers considering strategies for promoting local development, and for local policy makers wishing to attract people and jobs to their local area. We provide new insights on this question by estimating the relationship between HEIs and local population and employment growth, using a sample of fifty-seven New Zealand territorial local authorities (TLAs) between 1986 and 2013. 1 We pay particular attention to controlling for past and projected factors associated with local growth trajectories. We find, ceteris paribus, that TLAs with a higher ratio of university equivalent full-time students (EFTS) to working-age population experience faster population and employment growth. Consistent with a number of urban studies internationally (e.g., Glaeser, Scheinkman, and Shleifer 1995), we estimate city growth using demographic rather than monetary variables, reflecting the idea that a well-performing area is one that is consistently able to attract and retain population and workers.
We test this relationship using various specifications, including alternative samples, HEI variable definitions, and various estimation techniques including ordinary least squares (OLS), weighted least squares (WLS), and difference generalized method of moments (GMM). Within these specifications, we control for local time-invariant factors, national and local time-variant factors, and lagged growth, with the latter included to control for the possibility of reverse causality (i.e., growth leading to increased HEI activity).
A challenge for any regional panel study such as this is to isolate an identification strategy that enables interpretation of the estimates as indicating a causal, rather than purely associative, relationship. In addition to estimating the relationship using difference GMM and controlling for lagged growth, so accounting for one source of potential reverse causality, we incorporate two other strategies to assist identification.
First, we adopt an innovative approach to capture unobserved, local time-variant factors by including the five-, ten- and twenty-year (medium) population projections, prepared by demographers from the official statistical agency (Statistics New Zealand). These projections were publicly available in each period. The methodology used by Statistics New Zealand to prepare these projections is discussed in Estimation section, but we note here that they explicitly account for the arithmetic impacts of university student numbers on projected population growth so that any estimated effect in our regression of student numbers on population growth is additional to this arithmetic student numbers effect. We use the population projections to control for the possibility that variation in HEI activity could be driven by perceived future potential (rather than current, past, or long-term performance) of the area. Inclusion of the projections also controls for any endogenous actions taken by policy makers based on the official projections since these official projections may play a role in shaping strategies of local and central government.
Our second additional strategy is to examine whether one source of local variation in tertiary fee setting policy—which affected just one city—causes an idiosyncratic sequence of residuals for that city. If it does so, it would imply that our other strategies to deal with endogeneity have not been entirely successful. The specific policy is discussed further in the second section.
Across all our specifications, we find a positive and nonlinear (concave) relationship between the relative size of the university EFTS population and local population and employment growth, which is significant in virtually all cases. At the means, a one percentage point increase in the university EFTS share is associated with a 0.19 (0.14) percentage point increase in the annual average population (employment) growth rate. Estimates for the effects of increases in polytechnic EFTS shares were much weaker and estimated far less precisely.
Our results can be interpreted in the context of endogenous growth models (Romer 1986; Lucas 1988; S. T. Rebelo 1991; S. Rebelo 1998). In these models, HEIs can contribute positively to growth by increasing the local stock of knowledge and human capital (Mankiw, Romer, and Weil 1992; Glaeser et al. 1992; Glaeser, Scheinkman, and Shleifer 1995; Doppelhofer, Miller, and Sala-i-Martin 2000; Barro 2001; Gregorio and Lee 2002). For example, research and development (R&D), training of workers, or linking graduates to business can all improve the economic performance of an area. Furthermore, HEIs may enhance quality of life (Winters 2011a) by improving the local stock of civic amenities (e.g., theater halls, galleries) and natural amenities (through conservation projects). Given the improved quality of life in HEI-hosting areas, in-migrants often stay in the area after completing their education (Winters 2011b).
Spillovers from HEIs to their hosting areas may occur if the (growth relevant) output produced is tacit (Jacobs 1969), that is, if benefits produced are geographically bounded so that agents located near HEIs can more cheaply and easily utilize their intellectual output (Jovanovic and Rob 1989; Jaffe 1989; Jaffe, Trajtenberg, and Henderson 1993; Glaeser 1999; Deltas and Karkalakos 2013). Holding all else equal, the productivity of these local agents can be expected to increase, leading to faster overall growth in these areas (Karlsson and Andersson 2007; Wang 2010).
However, it is possible that geographical proximity is insufficient to promote growth if other local conditions (e.g., political, social, and institutional) are unfavorable (Fagerberg 1987; Nelson and Phelps 1966; Benhabib and Spiegel 1994; Fagerberg, Verspagen, and Caniels 1997; Asheim and Gertler 2006; Ascani, Crescenzi, and Iammarino 2012; Rodríguez-Pose 1999). For example, several studies examining subnational regions across Europe have found that, while the rate of return to education was similar across all regions, returns to R&D investment were only positive and significant in less peripheral regions which had a large preexisting proportion of educated workers and high patent density (Crescenzi 2005; Sterlacchini 2008; Rodríguez-Pose and Crescenzi 2008; Duch-Brown, García-Estévez, and Parellada-Sabata 2011).
We can divide these various conceptual approaches into two groups. In the first group, the relationship between local skills and city growth is explained by the presence of localization externalities; in the second group, it is explained by the presence of urbanization externalities. Localization externalities arise from spillovers due to industrial concentrations of similar firms, making these firms more productive (Marshall 1890). Urbanization externalities arise from the presence of diverse firms that enable complementarities, leading to greater productivity (Jacobs 1969). In each case, the higher productivity attracts firms and workers leading to a higher rate of city growth. Conceptually, consumption amenity effects can be treated as a form of urbanization externality, given their nonspecialized nature in relation to industry productivity.
We expect the relationship between HEIs and local innovation characteristics to differ depending on the two forms of externality. In the former, we hypothesize that the presence of HEIs will lead to a more concentrated industry structure, and we would expect differential impacts of HEIs on growth depending on the industrial characteristics of the city. In the latter, this concentration effect need not be present, and the HEI impact will instead be spread across a range of diverse industries. Thus, complementarities of HEIs with particular sectors will not (necessarily) be apparent.
In our empirical work, we investigate potential complementarities by testing a number of specifications which interact HEI activity with various proxies for local innovative activity. We find no evidence for such growth-related complementarities or that HEI activity influences the local industrial employment shares. This suggests for the case of New Zealand—in which the industrial structure is based more on agricultural industries than in many developed countries—that urbanization externalities have been more important than localization externalities in promoting city growth.
Our study is organized as follows. The second section provides an outline of New Zealand’s tertiary education system. The third section describes our sample and our estimation strategy, including our strategies to control extensively for other growth determinants. The fourth section provides descriptive statistics. The main results of the analysis are discussed in the fifth section. The sixth section summarizes and discusses our main findings.
Background on Tertiary Education in New Zealand
The New Zealand tertiary education system ranges from foundation studies and industry training up to doctoral degree qualifications (Ministry of Education 2006). Tertiary education services are provided by a variety of publicly funded institutions (e.g. universities, polytechnics and institutes of technology, colleges of education, and wānanga 2 ) and privately funded tertiary institutions. In 2016, there were eight universities, sixteen polytechnics, three wānanga, and several hundred private training establishments operating in New Zealand (New Zealand Qualifications Authority [NZQA] 2016). 3
New Zealand universities, like those in most Organization for Economic Cooperation and Development (OECD) countries, focus on advanced training and research. New Zealand colleges of education specialize in training teachers, whereas polytechnics and institutes of technology place greater focus on vocational training. Private training establishments provide a wide variety of courses (mostly below bachelor degree level), while wānanga deliver an array of qualifications in a Māori cultural context.
Historically, this categorization of institutions was more defined, with universities being the only type of institution legally empowered to train at bachelor degree level or above. Furthermore, universities were the only type of institution obliged to conduct research in exchange for receiving public funding (Taonga 2015). Reforms in the Education Act (New Zealand Parliament 1989) removed these restrictions, enabling all tertiary providers to offer courses at all levels, provided they satisfy certain criteria.
The 1989 reforms resulted in each HEI being given governance autonomy (Crawford 2016). Funding was delivered to each HEI as a bulk fund, using EFTS as the metric, and institutions became responsible for their own capital expenditure decisions. A standard tertiary fee (for students) was created, initially at 25 percent of the costs of tuition, and in 1992 a student loan scheme was created. 4 These policies are set at national level and apply to all universities and polytechnics. Thus, as we control for time (plus area) fixed effects in our empirical work, we cannot use these policy changes as a source of identification in our analysis. We do, however, use one local policy change as a strategy to check the robustness of our other identification strategies. Specifically, we examine the residuals of our estimated GMM equations to see if they are impacted by a single area’s change in a polytechnic’s fee structure. The Southern Institute of Technology (SIT) based in a midsized city, Invercargill, introduced a zero fees scheme in calendar year 2001. The scheme entailed the abolition of tuition fees on all courses. It was funded by outside charitable agencies within the local region and so constituted an exogenous shock to polytechnic education in the city. 5 While this constitutes a single-city observation (over multiple years), and so precludes any meaningful statistical test, we examine whether Invercargill becomes an outlier following the fee scheme change. If it were to do so, this would indicate that our other strategies to deal with endogeneity are not appropriate.
Despite the regulatory changes, universities retain a stronger focus on training at higher levels. Between 2007 and 2014, 95 percent of all university EFTS were studying toward a bachelor degree qualification or above. This contrasts with approximately a quarter of all polytechnics EFTS (including institutes of technology) and under a tenth of all wānanga and private training establishments students (Ministry of Education-Education Counts 2015). Universities also remain dominant in R&D, accounting for approximately half of New Zealand’s research staff (Hughes 2012) and almost all PhD students (Ministry of Education Education Counts 2015).
One change evident in New Zealand’s tertiary education institutes following the 1989 reforms was an increase in mergers. For example, by 2007, all colleges of education had amalgamated with universities; to ensure data consistency, we treat these colleges of education as part of the merged entity for our entire sample. Some HEIs also expanded their geographic base by establishing satellite campuses. However, the vast majority of students still train at a main campus. 6 In another institutional change during our sample period, one polytechnic (Auckland Institute of Technology [AIT]) was granted university status (as Auckland University of Technology [AUT]) in 2000. In our core empirical work, we treat AIT students as polytechnic students and AUT students as university students, In robustness checks, 7 we variously include AIT students as university students throughout the sample or include AUT students as polytechnic students throughout the sample, and find that our core results stay robust.
Overall, in 2014, there were more than 360,000 domestic students, about a tenth of the working-age population (Ministry of Education-Education Counts 2015), participating in formal tertiary education. Figure 1 shows the total number of students enrolled in tertiary courses and the total population between 1965 and 2014. 8

Students in formal tertiary education and population, 1965–2014. Student numbers are sourced from the Ministry of Education-Education Counts (2015). Population data are sourced from Statistics New Zealand’s (2015b) long-term series (1965–1990) and official population estimates (1991–2014).
Estimation and Sample
Estimation
Our approach for estimating the contributions of HEIs to their hosting area is based on insights from spatial equilibrium literature (Rosen 1979; Roback 1982; Overman, Rice, and Venables 2010; Grimes 2014) that in turn reflects the localization and urbanization externalities discussed above. We consider HEIs as a form of infrastructure, with the potential to improve both productivity and/or the stock of amenities in the hosting area.
For example, assume that productivity increases in a hosting area following the establishment or expansion of an HEI, or as a result of some growth-relevant output being generated by an existing HEI. The increased productivity of local firms enables them to pay greater wages to workers and/or to increase employment. At the same time, local living costs initially remain unchanged. This incentivizes individuals and firms to relocate to the area, increasing the local population and workforce. Eventually, migration flows increase the local cost of living, especially for nontradable goods (e.g., land prices), so the benefits relative to the costs of locating in the area are fully exhausted, with no further incentive for others to migrate. However, if agglomeration forces are sufficiently strong (Krugman 1991), migration itself could lead to additional (positive) productivity gains, in turn attracting more migrants, and especially skilled migrants (Simon 1998; Berry and Glaeser 2005). Thus, there could be a self-reinforcing feedback loop between HEI size, migration (i.e., population growth), productivity, and economic growth. If these forces are sufficiently strong, long-term differences in the rates of population and employment growth could arise between areas hosting HEIs and those that do not.
Reflecting the process just described, we estimate the benefits generated from HEIs in terms of population and employment growth; thus, we evaluate the success of an area by its ability to attract and retain individuals and firms. 9 We estimate local growth over time as a function of local-level characteristics in each initial period t:

For area j in period t, growth is defined by the annual average growth rate in population and employment, respectively, between periods t and t + S. Growth is estimated as a function of the degree to which HEIs (HEI j,t ) are present in the area, a set of time-variant local and surrounding area-specific controls (Xj ,t ), time-invariant local area effects (ζ j ), period effects (η t ), and an idiosyncratic error term (ε j ,t ).
Universities (and most polytechnics) were established before the first year that we can observe (1986), and closures are rare. In addition, most institutions that were officially established after 1986 have evolved from smaller institutions (e.g., community colleges) previously operating in the area. Due to this low variation, simply including an indicator capturing whether an institution is physically present in the area is not likely to reveal meaningful relationships. Instead, we capture the level of HEI “presence” in an area by calculating the ratio of local EFTS to local working-age population (i.e., aged fifteen or above). We hypothesize that, holding all else equal, a greater share of EFTS population is associated with greater accumulation of knowledge and human capital, leading to a faster rate of population and employment growth. 10 We capture differences in the relationship between different types of HEIs and growth by including these ratios separately for universities (including teacher colleges) and polytechnics (including institutes of technology). We include the EFTS terms as quadratics in order to capture nonlinearities in relationships.
To isolate the effect of HEIs on local growth from other factors, we include period and area fixed effects to control for macroeconomic shocks and for all time-invariant area-specific features (e.g., climate, historical factors), respectively. In addition, we control for a number of local time variant demographic and labor market characteristics, as well as agricultural price shocks, and innovative activity at the (greater) regional level.
As the decision of where to establish an HEI is likely to be nonrandom, OLS estimates will be biased if other unobserved local characteristics correlate both with our HEI variables and with growth. We endeavor to control for these biases by focusing on two aspects that may affect our results.
First, we recognize the possibility of reverse causality between HEI presence and growth, that is, past performance of the area may lead to changes in HEI activity. To help control for this possibility, we include lagged growth as a control variable, estimating the relationship between the presence of an HEI in the area and future growth, conditional on local growth over the previous period:

To correct for dynamic panel bias (Nickell 1981), we use the difference GMM approach (Anderson and Hsiao 1981, 1982), instrumenting the (differenced) lagged dependent variable with its twice lagged level (Arellano 1989).
Second, we recognize that the decision to establish (or expand the activity of) an HEI may reflect the local area’s perceived growth potential. We control for this possibility by including within Xj ,t the official five-, ten-, and twenty-year medium population projections produced by Statistics New Zealand that were available publicly in each period. The Statistics New Zealand subnational medium population projections control for a range of demographic factors. They are based on demographic assumptions about future births (fertility), deaths, and migration. Initially, national projections are undertaken, with subnational medium projections being constrained to sum to the national medium projection. Known policy settings are taken into account in compiling the projections (for instance, international immigration policies), but no predictions of policy changes are made and hence projections are based on existing policies and demographic trends (Bascand 2012). Statistics New Zealand (2016b) shows that, at the subnational level, the five-year ahead projections meet reasonable tests of accuracy. For the five-year projections based on each of the 1991, 1996, 2001, and 2006 censuses, the median absolute relative errors were 3.1 percent, 2.6 percent, 2.3 percent, and 2.2 percent, respectively (Statistics New Zealand 2016b). 11
Importantly, for our use of these projections, the age structure of a local area and its interaction with local educational facilities are explicitly accounted for within the projections. Statistics New Zealand (2015b, Sheet: ‘Subnational graphs’) states: “University cities generally experience large net migration inflows in the 15–19 and 20–24 year age groups, while most other areas experience large net migration outflows in these age groups.” 12 The projected student inflows and outflows are therefore explicitly accounted for in the projections, although their indirect economic impacts (which would be in the nature of a prediction rather than a projection) are not included in the official projections. By including the population projection, we thereby account for the purely arithmetic effect on population of projected university student flows at local levels, while allowing their economic spillover effects to be captured through our estimated university EFTS coefficients. 13
Inclusion of these official projections accounts for growth-relevant factors that were used to construct the projections that are not included in our model. The projections also account for factors that may have shaped the expectations (and thus unobserved actions) of policy makers regarding the future performance of areas.
We explore heterogeneity in the relationship between HEIs and growth arising from differences in local characteristics (Fagerberg 1987). To examine such differences, we interact the HEI variables with other local characteristics:

The interaction term,
Sample
Our sample comprises six waves of census data between 1986 and 2013. Additionally, we use census population from 1981 to generate a lagged dependent variable in the first period (i.e., average annual growth rate between 1981 and 1986) in the difference GMM estimates. We do not have 1981 employment figures; thus, the estimation of employment growth (using difference GMM) is one period shorter and, for consistency, we present all employment results for the corresponding shorter period. We aggregate the data to fifty-seven TLAs; 14 a TLA is an administrative/political, rather than an economic boundary. Studies that use these boundaries may suffer from measurement errors and/or spatial autocorrelation (Glaeser, Scheinkman, and Shleifer 1995). To limit the potential for spatial spillovers, we amalgamate proximate urban TLAs. We do so where adjacent TLAs each contain sizable urban populations—forming a cohesive economic unit in which individuals commute within our amalgamated TLA boundaries. We test the (preferred) GMM equation residuals for spatial autocorrelation using the Moran’s I statistic.
Our amalgamation procedure results in six amalgamated TLAs: Auckland (amalgamation of all TLAs within the former Auckland Regional Council area), Greater Hamilton (amalgamation of Hamilton City with Waipa District), Napier-Hastings (amalgamation of Napier City and Hastings District), Greater Wellington (amalgamation of Kapiti Coast District, Porirua, Upper Hutt, Lower Hutt, and Wellington Cities), Nelson-Tasman (amalgamation of Nelson City and Tasman District), and Greater Christchurch (amalgamation of Christchurch City, Banks Peninsula, Waimakariri, and Selwyn Districts). 15 Figure 2 maps the various New Zealand TLAs, highlighting the amalgamated areas in dark gray. 16
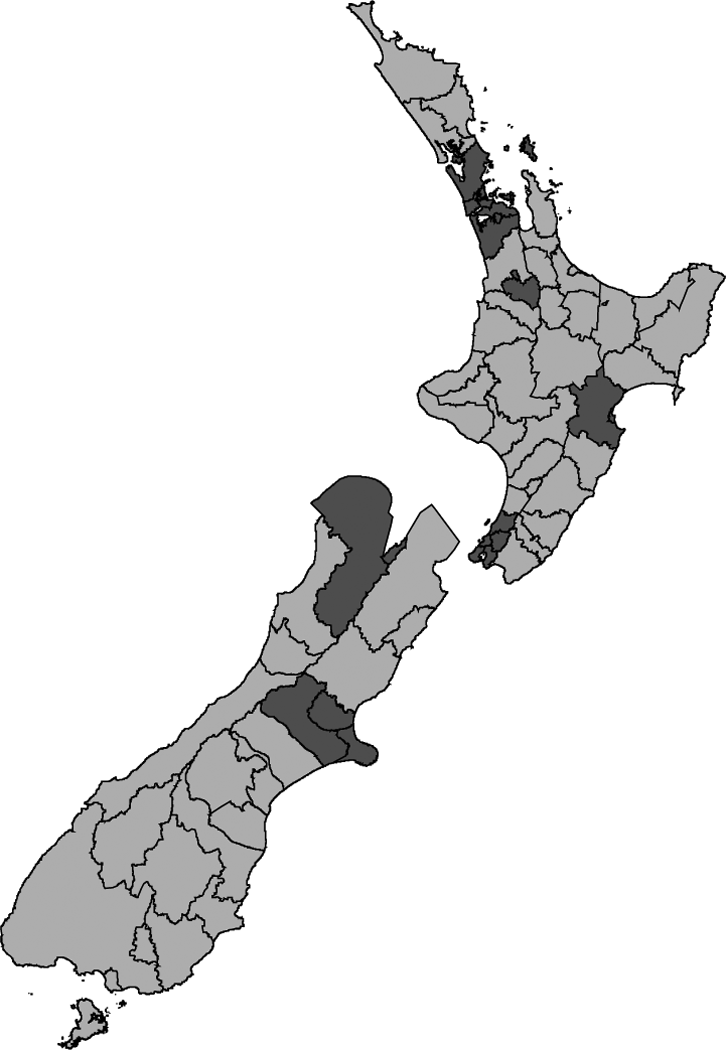
New Zealand’s territorial local authorities (TLAs). Amalgamated TLAs are in dark gray. From north to south, these are Auckland, Greater Hamilton, Napier-Hastings, Greater Wellington, Nelson-Tasman, and Greater Christchurch.
Because of limitations in the information available on EFTS counts in wānanga and private training establishments in earlier periods, we do not include data from these institutions in the sample. We do not expect this exclusion to significantly affect results, since the institutions that we include account for over three-quarters of the overall EFTS population over the sample. More importantly, they include almost the entire EFTS population enrolled toward qualifications at the bachelor degree level or above, and the vast majority of R&D produced by all HEIs.
We create the HEI variables by combining administrative data from the Ministry of Education (MoE), HEIs’ own annual reports, and census data from Statistics New Zealand. From these sources, we collect data on the number of EFTS enrolled in long-term courses in each TLA j, in each period t. 17 We then convert these counts into a share of the TLA working-age population (i.e., census usually resident population at age fifteen or above), sourced from the census. 18
Population projection data are sourced from the 1986, 1991, 1995, 2001, and 2006 demographic trends publications (Statistics New Zealand, various years). 19 Median house prices and land values are sourced from Quotable Value Ltd. Data for the commodity price indices are sourced from the ANZ Bank’s commodity price index, weighted by local commodity production. 20 Local innovation is proxied by the number of patent applications (per 10,000 inhabitants) submitted to the Patent Cooperation Treaty and the European Patent Office, sourced from the OECD patent database. 21 Data for all other controls are sourced from the 1981 to 2013 censuses.
Descriptive Statistics
Between 1986 and 2013, the unweighted average TLA population grew at an annual rate of 0.3 percent, 22 while the unweighted employment growth rate was approximately 0.6 percent (Figure 3). Spatially, growth in both population and employment tended to be centered in and near the three largest metropolitan centers (Auckland, Wellington, and Christchurch). One exception is the (tourist-oriented) Queenstown-Lakes District, which recorded the fastest growth overall (4.6 percent p.a.), as well as in each intercensal period. Growth in most other small and remote TLAs was negative.
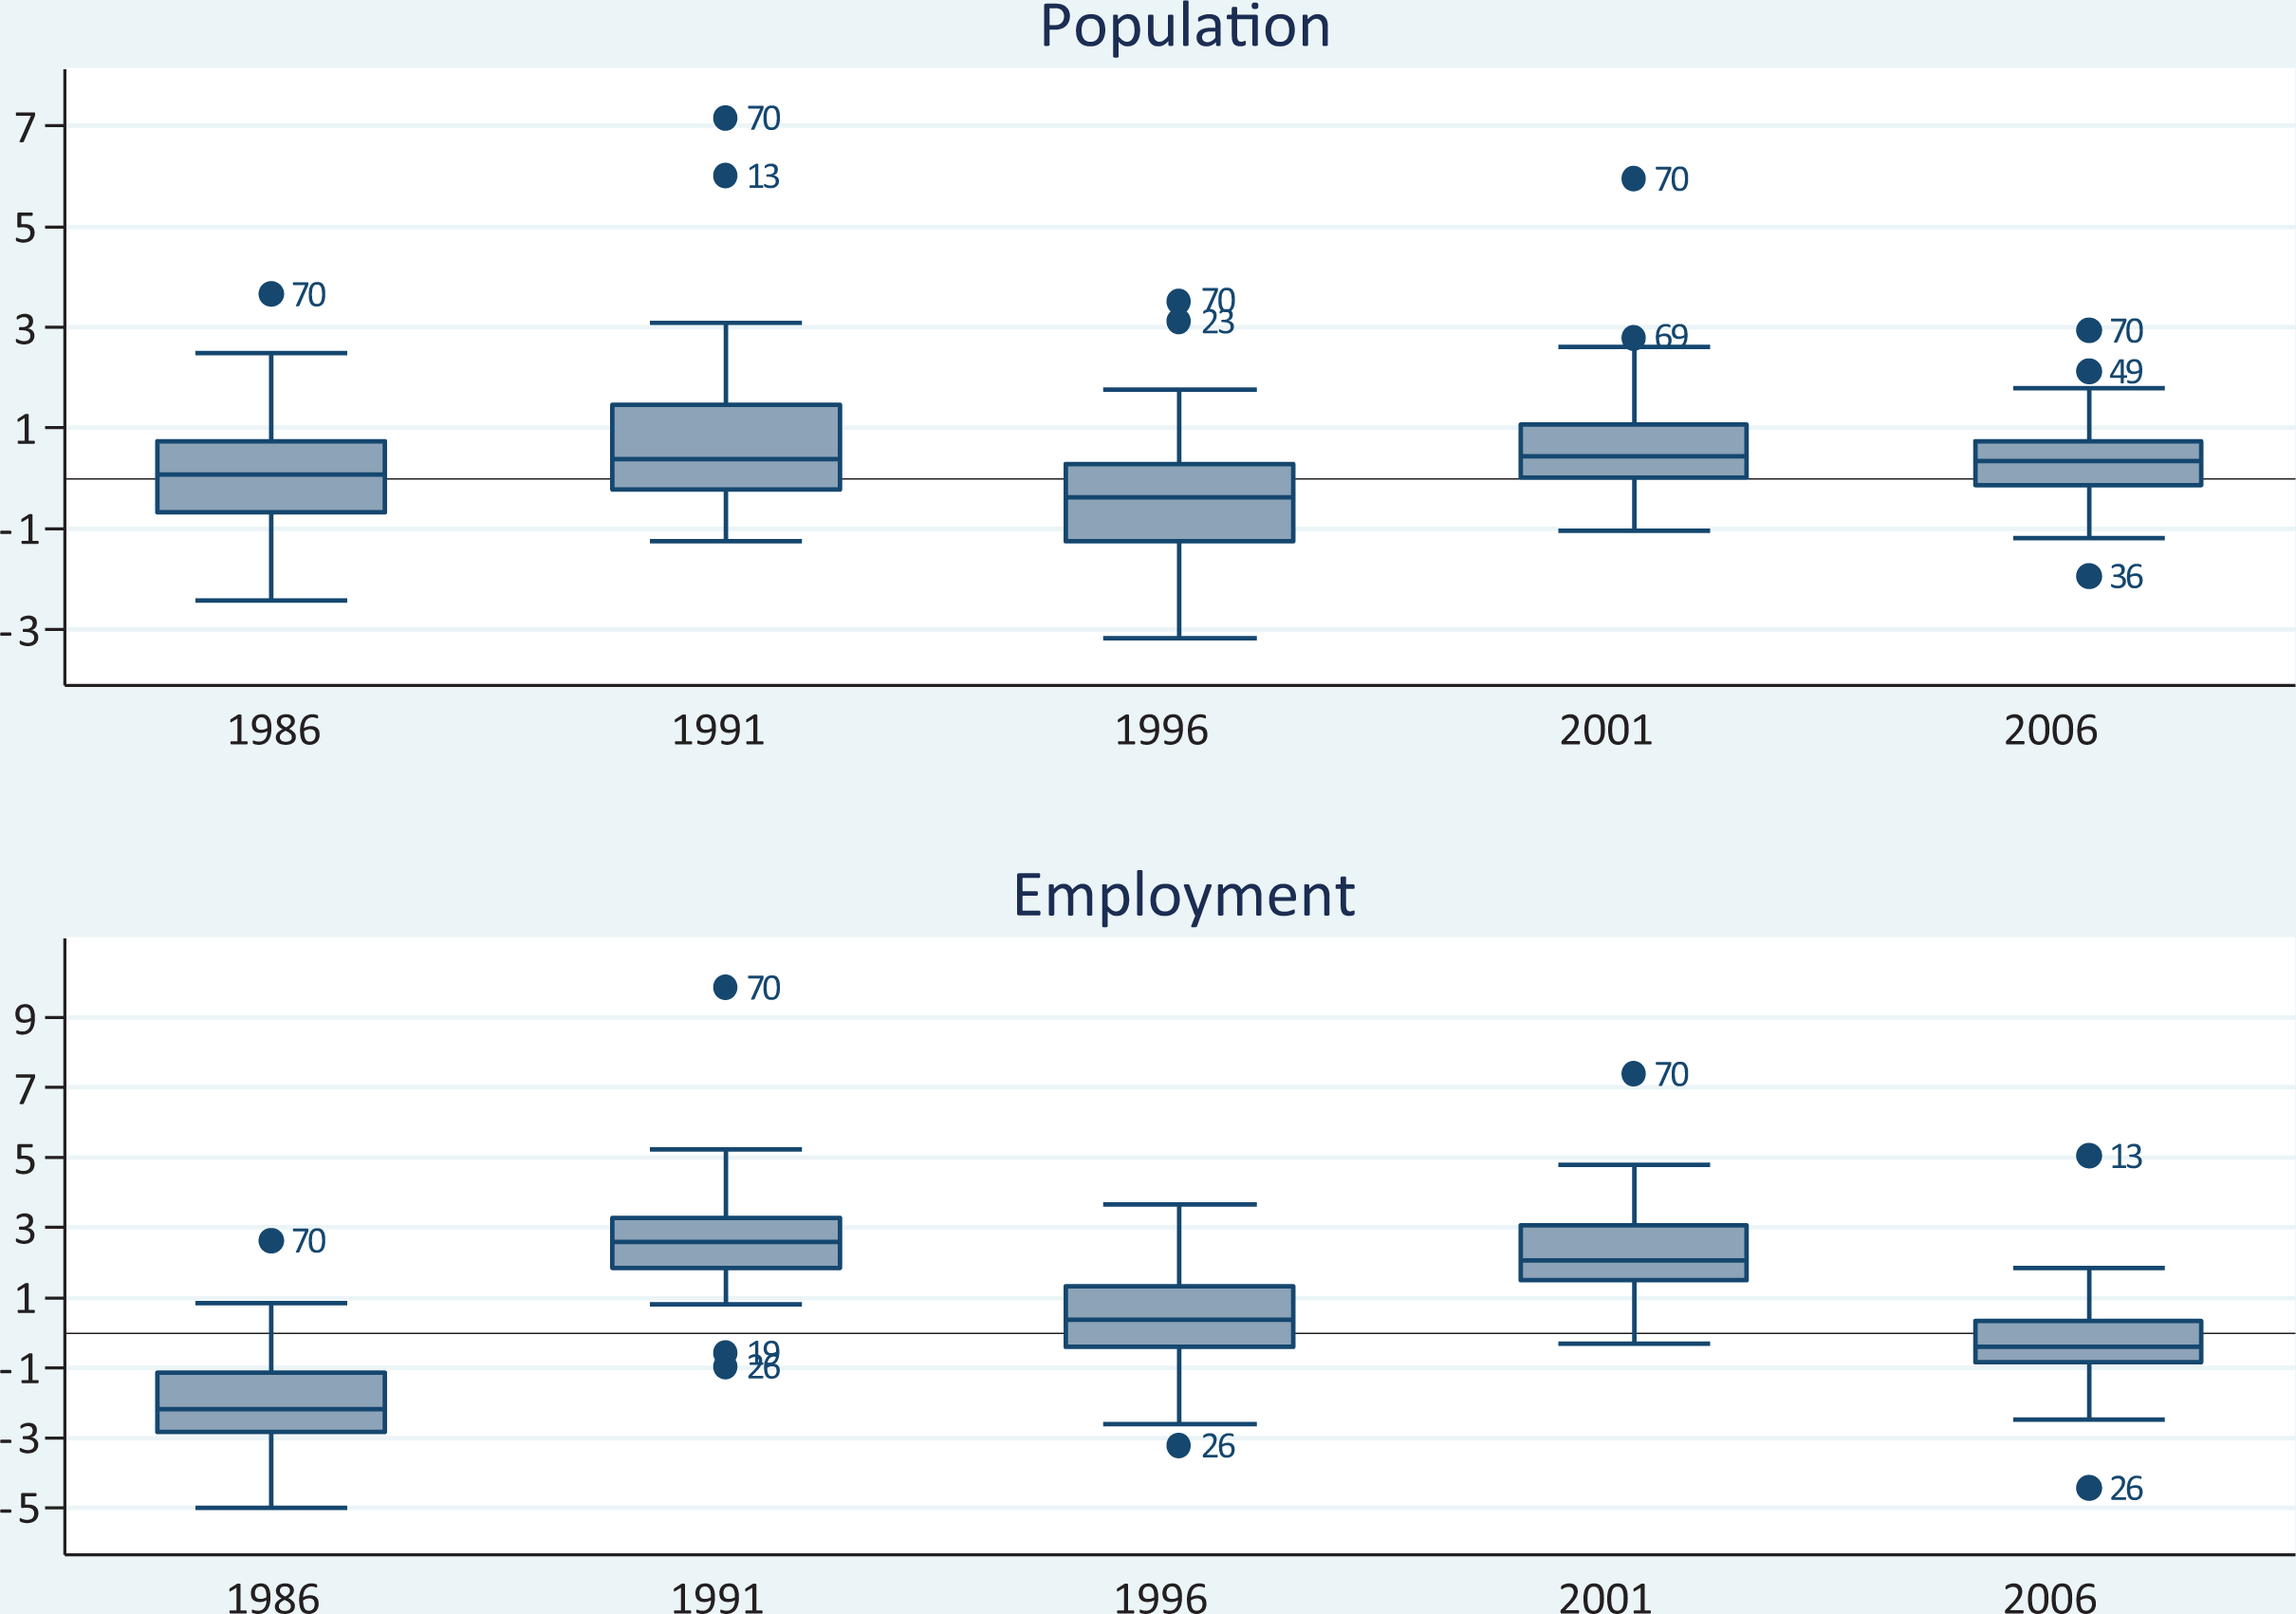
Intercensal average annual growth rates, 1986–2013. Annual growth in percentage is measured on the vertical axis. Growth is between the year shown in the horizontal axis and the following census period. Territorial local authorities with extreme growth rates are presented using the following code: Waikato District (13), South Waikato District (19), Tauranga City (23), Kawerau District (26), Ruapehu District (36), Carterton District (49), Central Otago District (69), and Queenstown-Lakes District (70).
The kernel density of EFTS shares for TLAs with a share greater than zero is presented in Figure 4. For polytechnics, the majority of observations depict shares under 10 percent. For universities, most TLAs record EFTS shares below 20 percent. A small peak appears at just over 30 percent, reflecting the shares of Palmerston North and Dunedin Cities—New Zealand’s only true “university towns” (hosting the main campus of Massey University and the University of Otago, respectively). These cities are relatively small compared with other areas hosting universities, jointly accounting for less than 5 percent of the national population. 23
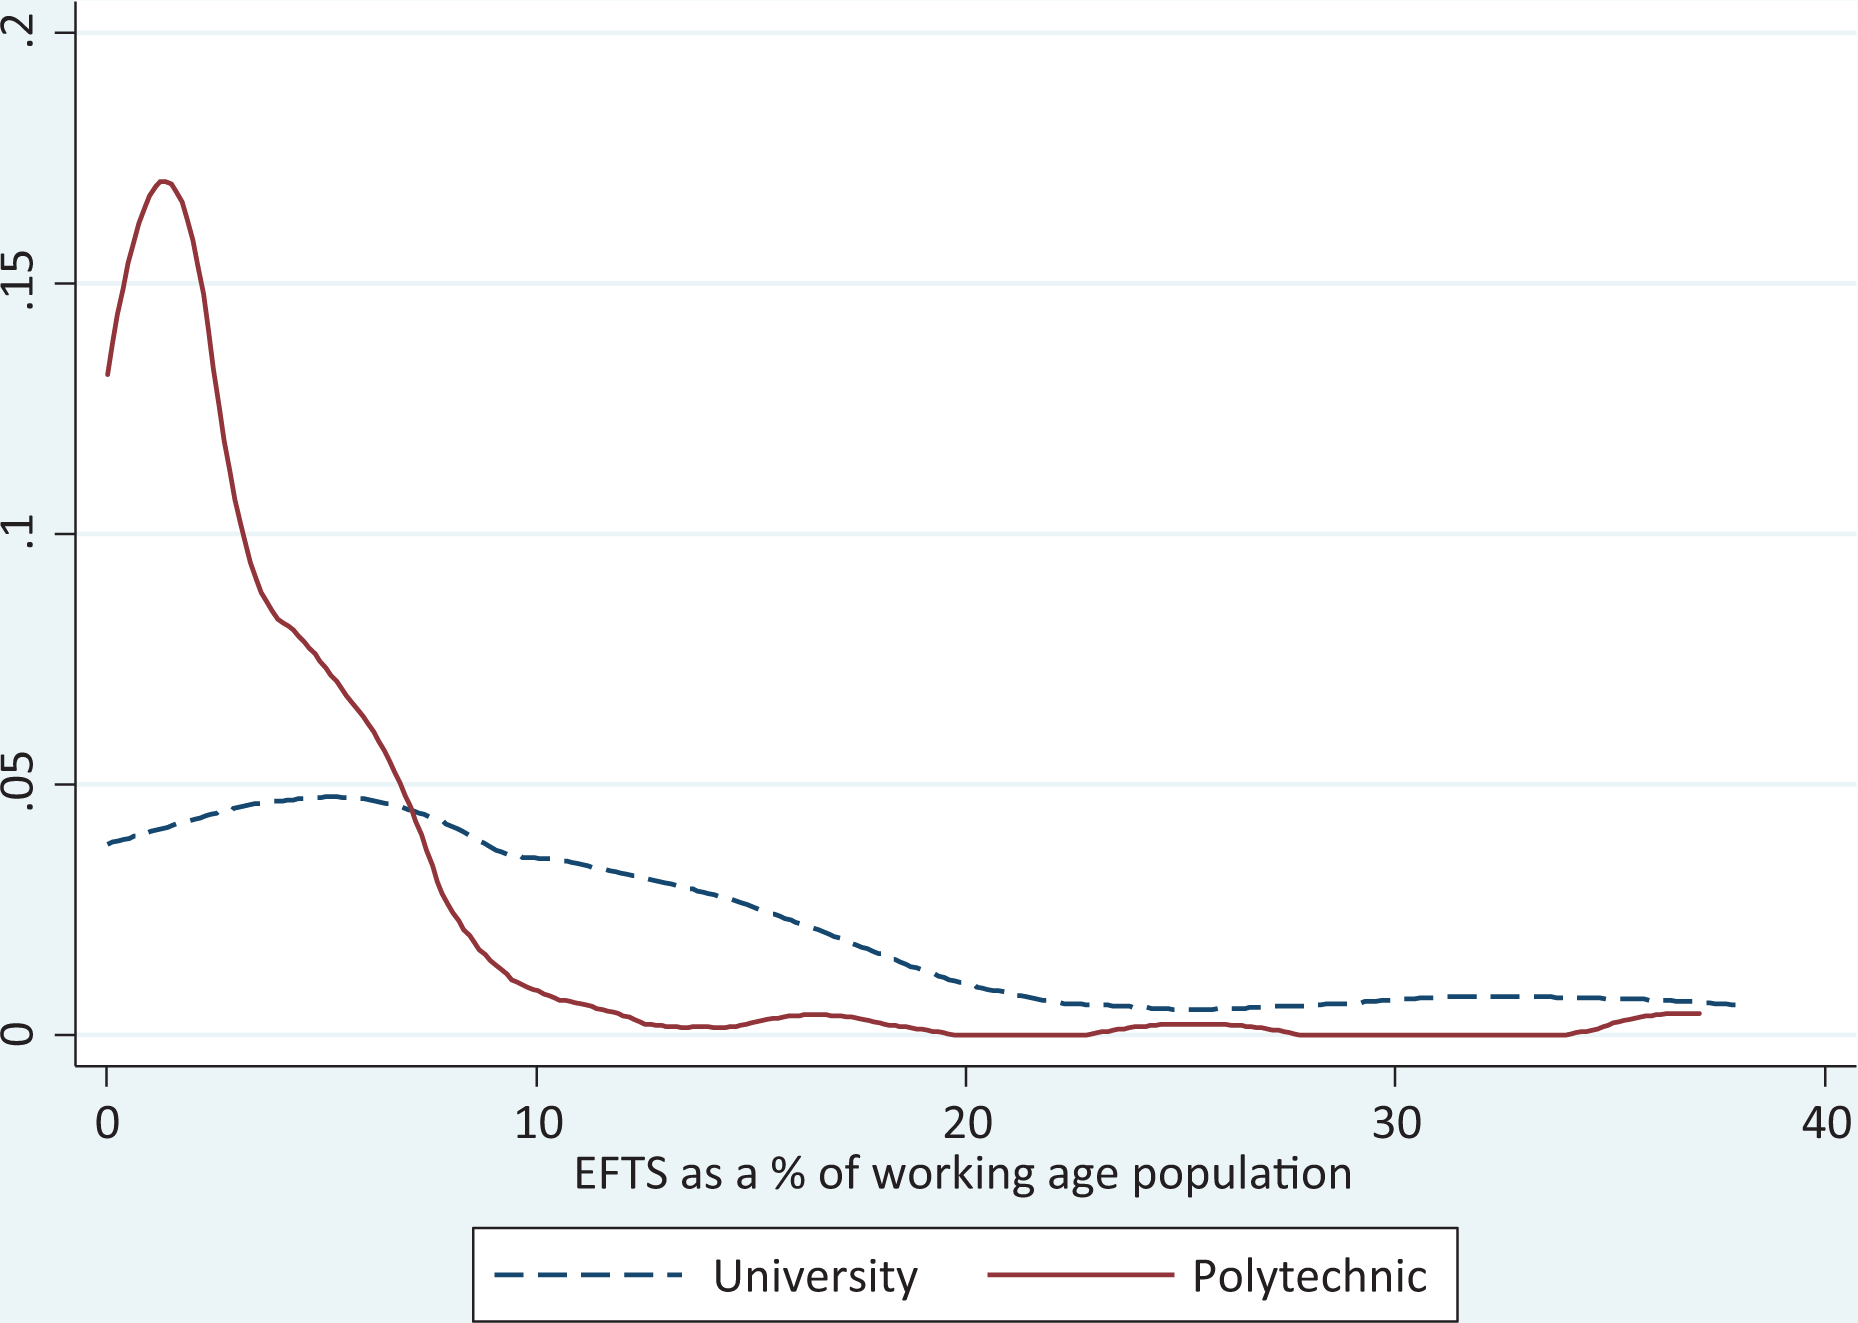
Density of equivalent full-time students (EFTS) shares for territorial local authorities (TLAs) with shares greater than zero. Vertical axis plots the density of observations. Horizontal axis shows the share of EFTS in each TLA as a share of the working-age population.
As some of our specifications include interactions between the EFTS shares and specific TLA characteristics, we plot the distribution of these characteristics’ variables in Figure 5. The figure shows that population density is low in most TLAs, with 94 percent of the observations having fewer than 200 inhabitants per square kilometer and 60 percent having fewer than 100. The distribution of employment share in the finance and insurance industry resembles more of a skewed bell curve, with a sample mean of about 2 percent. Patent applications are heavily right skewed, with most TLAs having fewer than 0.5 applications per 10,000 inhabitants. Finally, the share of working-age population with a bachelor degree or above as highest qualification is highly concentrated at around 5 percent of the local workforce.

Density plots for various controls. Vertical axis plots the density of observations. Horizontal axis plots the range in values of each variable. Population density is calculated as population (‘000) per square kilometer.
To better understand some differences between TLAs that host HEIs and those that do not, the mean and standard deviation of the variables used are summarized in Table 1. The first column summarizes the data across all TLAs hosting a university (which in all cases also host polytechnics). The second column summarizes the data of TLAs that host only a polytechnic, while the third column summarizes the data for the TLAs that do not host universities or polytechnics. The final columns present the p value of a t test for the difference in means between each pair of groups.
Summary Statistics by Higher Education Institution Grouping.

Note: In all t-tests, the equality of variance assumption was determined by an equality of variance test performed beforehand. WAP is working-age population (population at the age of fifteen and above). Industries are abbreviation for full-time employment in relevant industry, presented as a share of total full-time employment. Territorial local authorities hosting an institution are defined by whether they host a main campus within its boundaries, whether their EFTS population is equal or greater than 1 percent of the national EFTS population (for the relevant type of institution) or at least 2 percent of their local fifteen to thirty years old population. SD = standard deviation. EFTS = equivalent full-time students.
The table indicates that TLAs hosting a university record faster population growth rates on average (0.96 percent) than other TLAs and that their populations were also projected to grow faster (0.61–0.80 percent). In addition, they have more of an urban profile, with significantly greater representation of working-age population holding a bachelor degree or above as highest qualification, population between the ages of fifteen and sixty-four, foreign-born population, and employment in services. Furthermore, these areas tend to have a greater house price to income ratio, greater population density, and lower shares of agricultural (primary) employment and population from the Māori ethnic group. Their patent density is greater compared with TLAs not hosting HEIs. 24
TLAs that host only a polytechnic and those that do not host an HEI show similar rates of population, employment, and projected population growth. Both show similar shares of Māori population. Finally, TLAs not hosting HEIs have a larger (smaller) population share under (over) the age of fifteen (sixty-four), are more agricultural in terms of employment, are less densely populated, have a lower house price to income ratio, and have lower shares in secondary employment (compared with areas only hosting polytechnics) and tertiary employment.
The most notable data in Table 1 for our analysis relate to the distribution of qualifications across the three TLA groups. Similar shares of vocationally qualified working-age population are observed across all three TLA groups, suggesting that those trained at vocational level (mostly at polytechnics) do not tend to remain disproportionately in areas hosting polytechnics. This result contrasts with working-age population holding at least a bachelor degree qualification which tends to locate in TLAs that host universities. These differences suggest that gains in human capital from attending polytechnics tend to spread nationally, reducing localized benefits for TLAs hosting polytechnics, while gains in human capital from attending universities tend to remain concentrated in cities with universities. We return to the importance of this observation when interpreting our econometric results.
Results
Homogeneous Impact
Table 2 summarizes our estimates of the relationship between EFTS shares and TLA population and employment growth rates. The OLS and weighted OLS (WLS) population regressions include census years 1991, 1996, 2001, 2006, and 2013. The population GMM regressions which include differenced variables (including the lagged dependent variable) lose one period’s observation (i.e., the 1991 observation is included in the first period difference). The employment regressions lose one further observation owing to the lack of data for the initial period. Each regression includes all control variables listed in Table 1. 25 Estimates for population growth are presented in the first three columns. The first column shows the estimates from a two-way fixed effect unweighted OLS regression, including the full suite of controls except for lagged growth. For universities, the estimates suggest a significant, positive, and concave association between the EFTS share and population growth. By contrast, the magnitude of the polytechnic EFTS coefficients is much smaller and statistically insignificant.
Population and Employment Growth Estimates, OLS, WLS, and GMM Specifications.
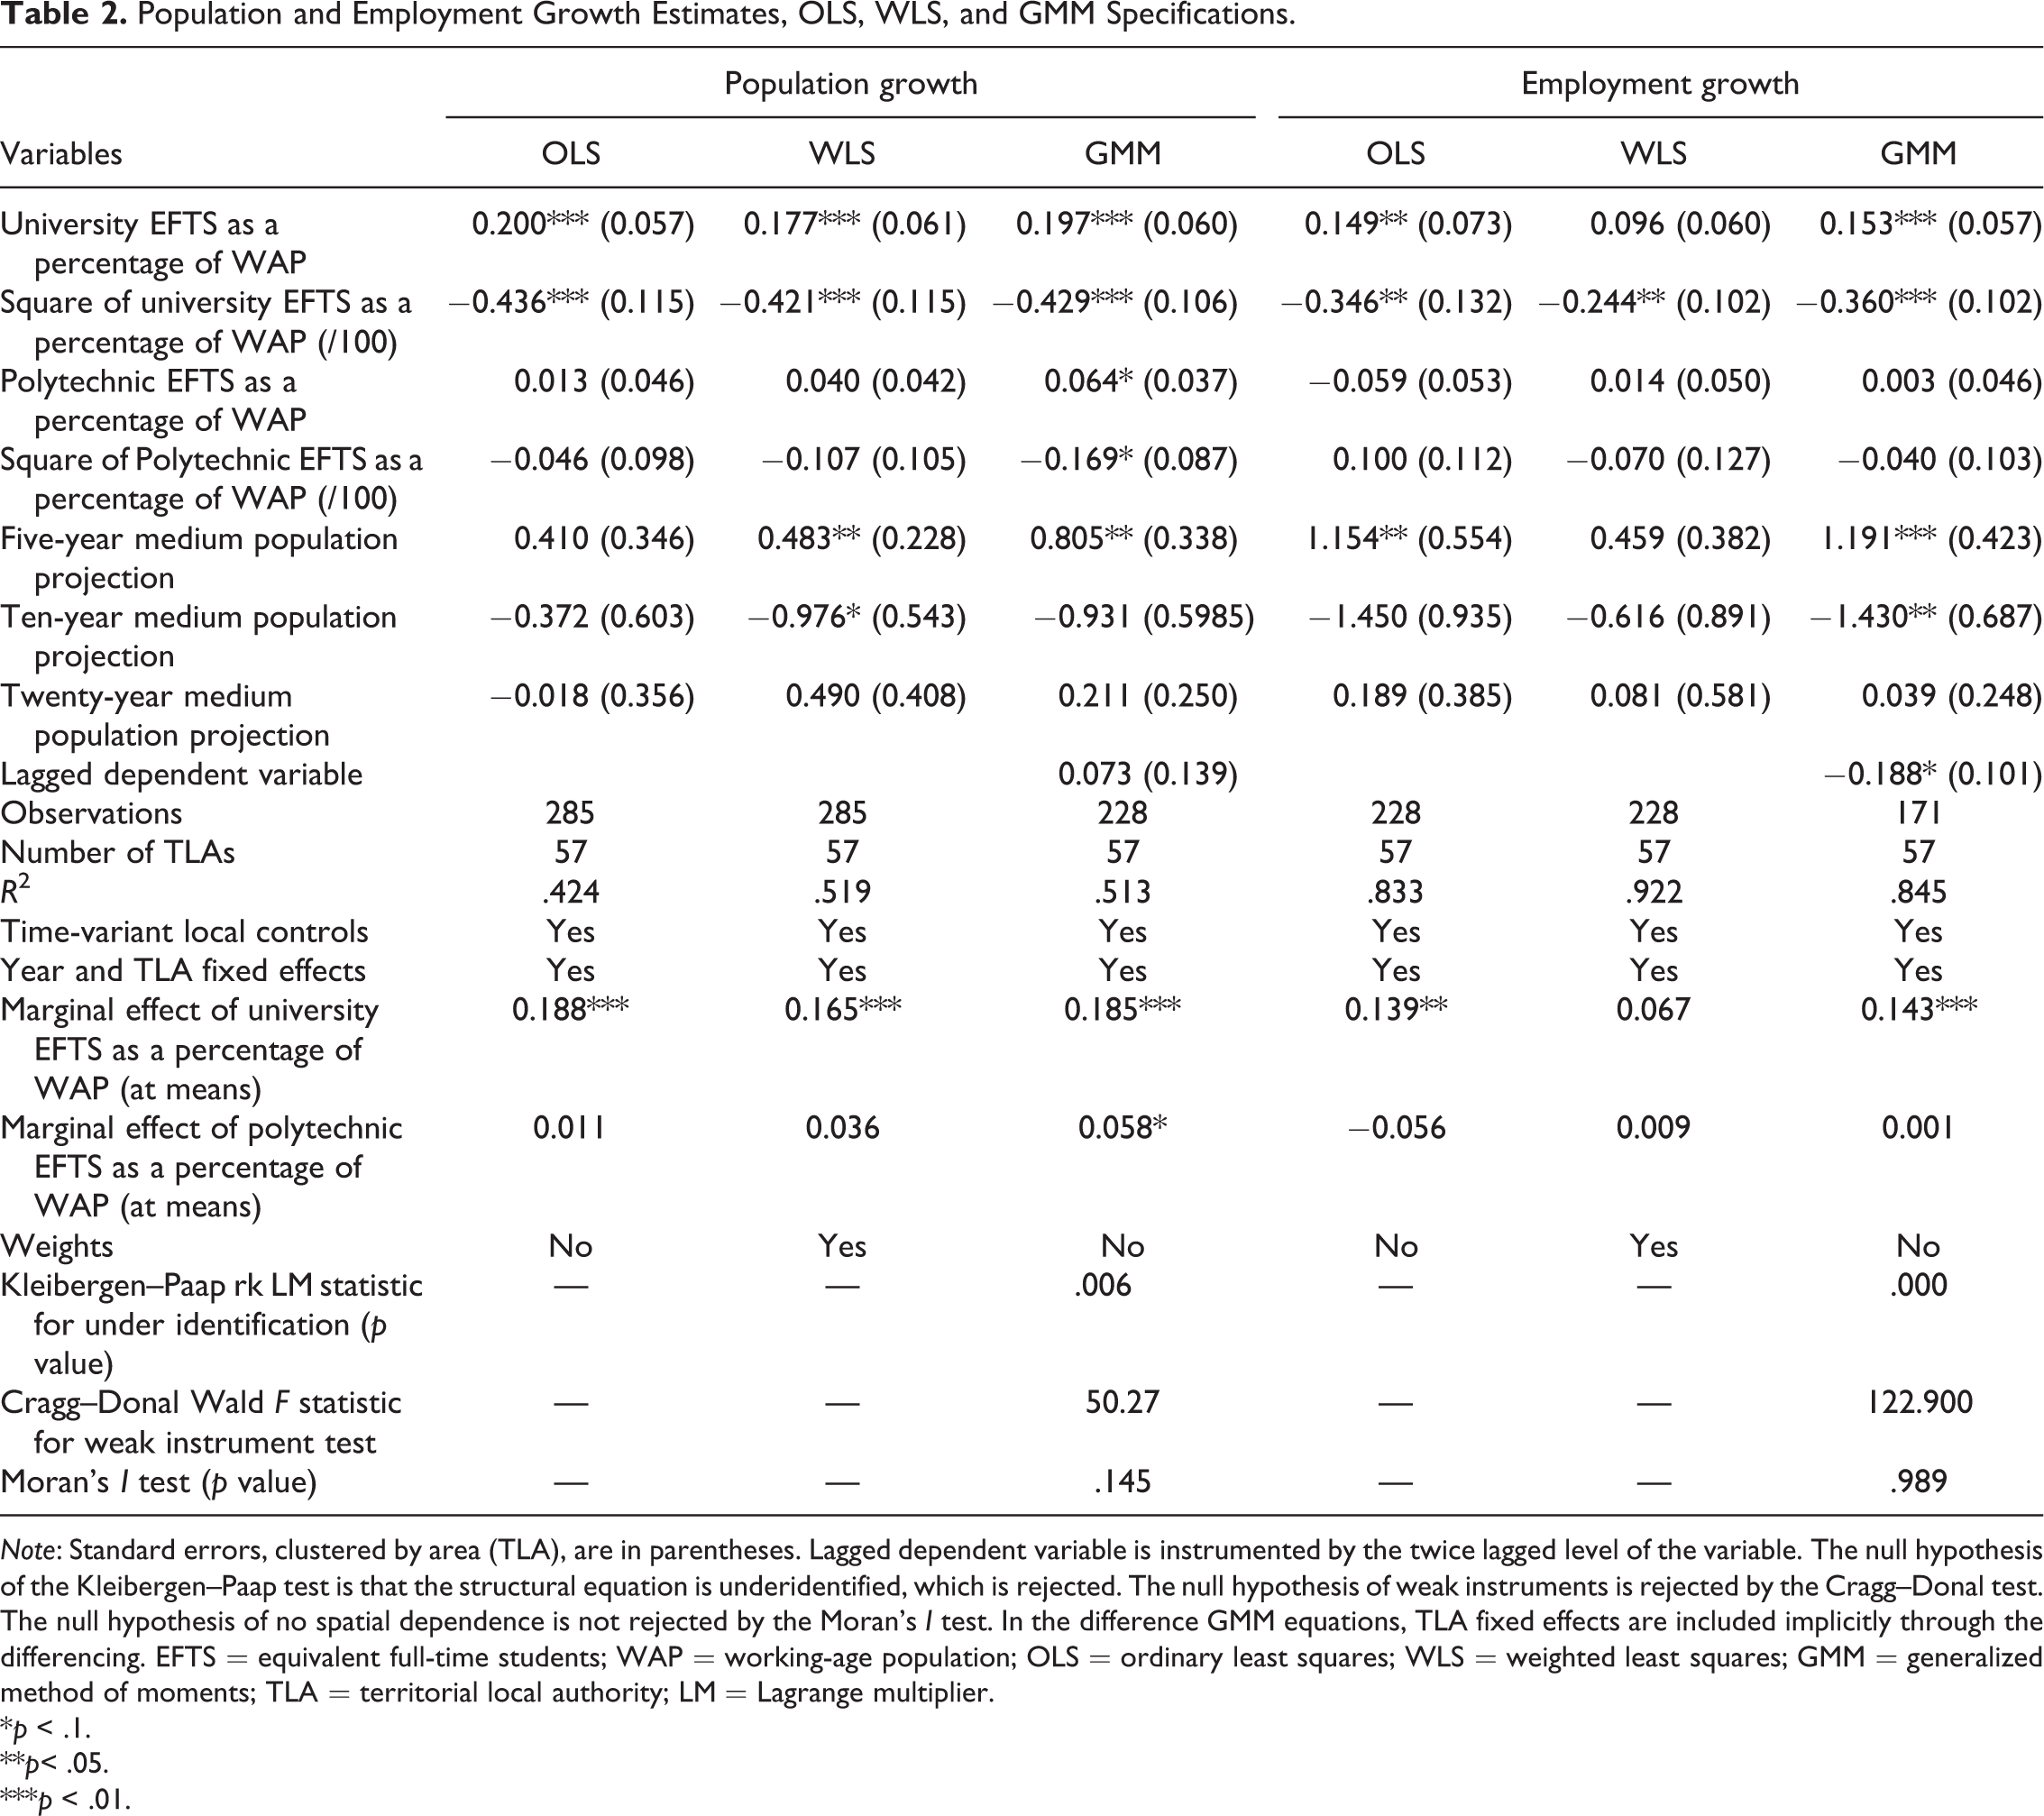
Note: Standard errors, clustered by area (TLA), are in parentheses. Lagged dependent variable is instrumented by the twice lagged level of the variable. The null hypothesis of the Kleibergen–Paap test is that the structural equation is underidentified, which is rejected. The null hypothesis of weak instruments is rejected by the Cragg–Donal test. The null hypothesis of no spatial dependence is not rejected by the Moran’s I test. In the difference GMM equations, TLA fixed effects are included implicitly through the differencing. EFTS = equivalent full-time students; WAP = working-age population; OLS = ordinary least squares; WLS = weighted least squares; GMM = generalized method of moments; TLA = territorial local authority; LM = Lagrange multiplier.
*p < .1.
**p< .05.
***p < .01.
For universities, the relationship continues to hold when we weight our sample by the 1986 population (second column), and also when we include the lagged dependent variable under the difference GMM specification (third column). For polytechnics, the coefficients are only significant in the GMM specification (at the 10 percent level), showing a positive concave association with population growth. Based on each variable’s means (and using the difference GMM coefficients), increasing the university and polytechnic EFTS shares by one percentage point is associated with an increase in the annual average population growth rate of 0.19 and 0.06 percentage points (pp), respectively.
For employment growth, results with (unweighted) OLS show a statistically significant relationship between employment growth and university EFTS but not between employment growth and the polytechnic EFTS share (fourth column). The WLS results (fifth column) also show no relationship for the polytechnic share, while the university EFTS impact is no longer significant, albeit remaining positive. 26
When we control for past employment growth (sixth column) and estimate using difference GMM, the university coefficients are again significant for employment growth, indicating a positive concave association. At the means, a one percentage point increase in the university EFTS share is associated with an increase of 0.14 pp in the average annual rate of employment growth. No significant relationship is found between employment growth and the polytechnic EFTS share.
One feature to note is that the lagged dependent variable is insignificant in the GMM regressions for both population and employment. In a naive regression of population (employment) growth on its own lag (plus a constant and year and TLA fixed effects), the coefficient on the lagged variable is −0.39 (−0.66), each significant at the 1 percent level. 27 The results from the GMM regressions and the naive regressions indicate that, beyond longer term regional trends reflected in the TLA fixed effects and/or differencing, there is no evidence of positive autocorrelation for these demographic variables over intercensal periods.
By contrast, the five-year ahead population projections are significantly different from zero at the 5 percent level, while neither estimate is significantly different from unity. Thus, inclusion of these official projections provides significant explanatory power for both population and employment growth. Since these projections include the effects of variables unobservable to the econometrician, their inclusion reduces the likelihood that our estimated EFTS effects are due to omitted variable bias. Furthermore, our finding of a significant impact of the university EFTS share on both population and employment is over and above the arithmetic effect of student numbers already accounted for in the population projections, implying a significant economic externality arising from this student presence.
An alternative arithmetic effect from rising student numbers is that university lecturer numbers are likely to rise as student numbers increase. We have reestimated the GMM regressions with the population and employment data redefined to omit all teachers from the sample; 28 in each case, the marginal effect of university EFTS rises relative to that in the full sample (and remains significant at 1 percent), while the effect of the polytechnic EFTS share is virtually zero. Thus, purely arithmetic student and/or teacher effects on population and employment growth do not explain the significant relationship between the university EFTS share and each of population and employment growth. Instead, a more likely explanation that is consistent with the data shown in Table 1 is that university trained graduates are more likely to remain in their HEI hosting area after graduation relative to polytechnic graduates. Thus, productivity gains through the human capital accumulation channel from universities remain in the hosting area while those for polytechnic graduates do not.
Using the estimates from the GMM specifications in Table 2, Figure 6 plots the predicted population and employment growth rates associated with different university and polytechnic EFTS shares. For polytechnics, the predicted population and employment growth rates are not statistically different from zero. The rates of population and employment growth associated with university EFTS shares peak at a little over 20 percent of the TLA working-age population.
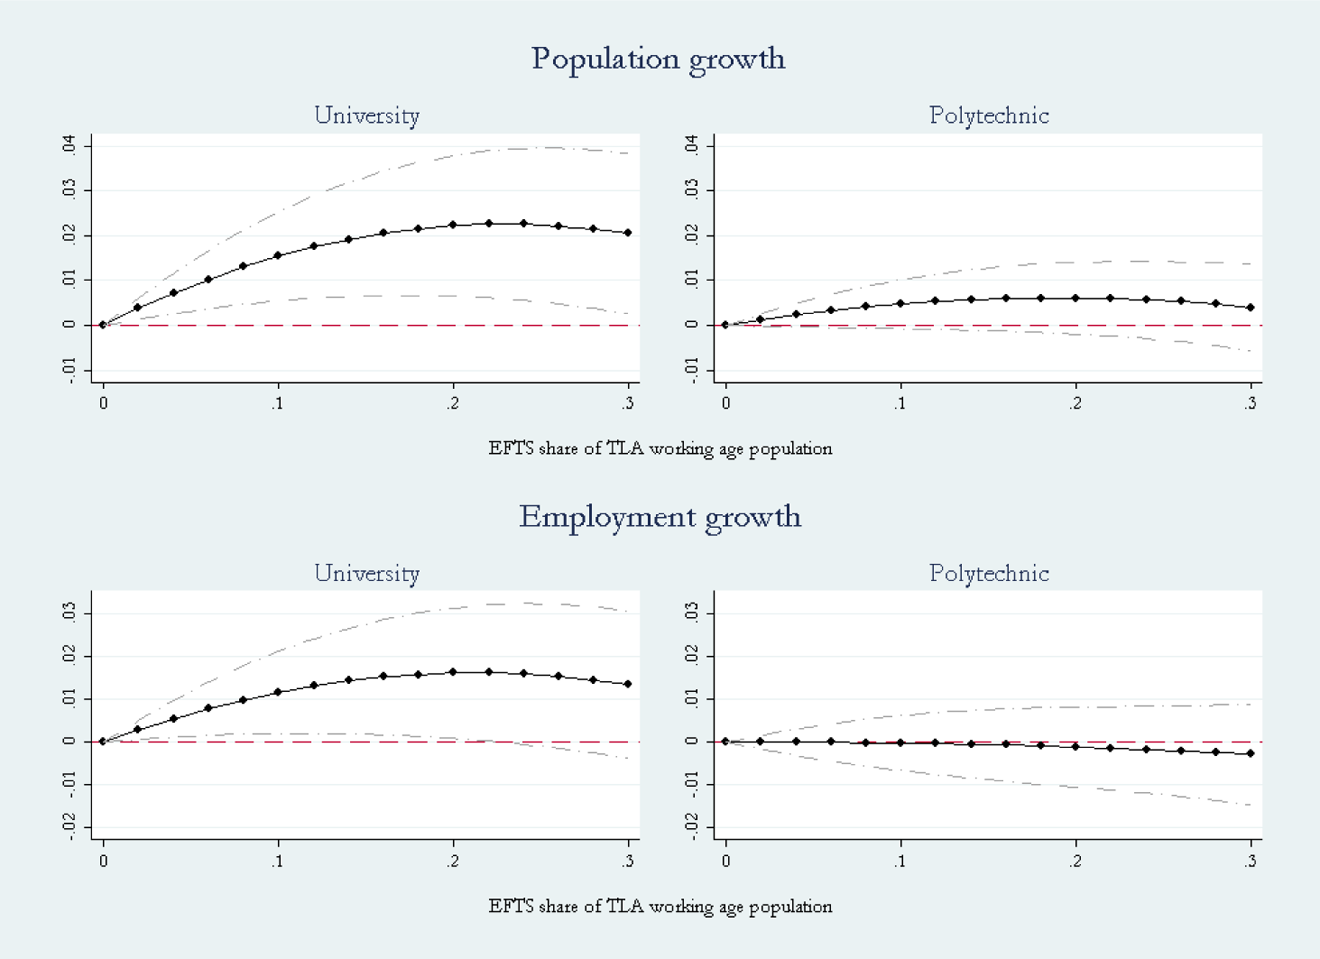
Predicted growth for varying levels of equivalent full-time student shares. Point estimates are in dark circles. 95 Percent confidence intervals for estimates are in light gray dashed line.
Only two TLAs (Palmerston North and Dunedin Cities) have university shares greater than 20 percent. We have reestimated the relationships excluding these two university towns, finding that a significant (linear) relationship continues to exist between university EFTS and each of population and employment growth. In these cases, the marginal effects for universities are slightly reduced (0.13 percent and 0.09 percent for population and employment growth, respectively), while polytechnic EFTS continue to have an insignificant relationship with the growth variables. 29
We have also reestimated the difference GMM regression using alternative data specifications, replacing the EFTS denominator (working-age population) variously with the local total population, population between the ages of fifteen and sixty-four, and population between the ages of fifteen and thirty. The patterns of relationship between university EFTS share and both population and employment growth continue to hold. For polytechnics, there is some evidence for a positive, but weak, relationship with population growth when using the entire population and when using the fifteen to sixty-four population as a denominator; however, there remains no evidence of a relationship between polytechnic EFTS and employment growth. 30
We have tested our GMM regressions for spatial dependence in the error term, where our measure of spatial dependence relates to the inverse distance between TLA centroids. The Moran’s I test for the population (employment) regression has p = .145 (p = .989), indicating that the null hypothesis of no spatial dependence cannot be rejected.
Finally, we have examined the residuals from both the population and employment GMM regressions to ascertain whether the zero fees experiment beginning in 2001 by the SIT in Invercargill affected the pattern of residuals for that city. Given that the census date is in March, we expect that any effect will be observed subsequent to 2001. For population growth, the residuals for 1996 for Invercargill were negative while the residuals for each of 2001 to 2013 were approximately zero; thus, any shift upward in the residual pattern occurred prior to the start of the zero fees policy. For employment growth, the 2001 residual was mildly negative while the 2006 and 2013 residuals were mildly positive, possibly indicating a small employment growth impact; however, each residual was well within the normal range of residuals across TLAs. 31 Thus, our controls for endogeneity appear to yield a robust result for the (lack of) impact of polytechnic student numbers.
Heterogeneity in Impacts
We examine whether the underlying characteristics of the hosting TLA affect the strength of relationships between the EFTS shares and population or employment growth. We do so by interacting the HEI variables with each of population (in ‘000) per square kilometer, employment shares in the finance and insurance industry, patent applications per 10,000 inhabitants, and share of working-age population with a bachelor degree or above as highest qualification. Each interaction is estimated in a separate (difference GMM) regression. 32
We find no (significant) evidence of heterogeneity in impact across any of these characteristics for either population or employment growth. New Zealand, which has a strong primary production base, does not rank highly within developed countries for either R&D expenditures (as a percentage of Gross Domestic Product) or patenting activities (Crawford et al. 2007). Hence, this lack of complementarity between HEI activity and innovation variables is not surprising. From a methodological perspective, the size and significance of the coefficients on the five-year population projection remain almost unaltered when including the interaction variables, confirming the reliability of these projections.
We have also examined whether HEI activity is associated with changes in sectoral employment shares in the following period. Specifically, we test whether employment shares in each of the primary, secondary, other tertiary services, and finance and insurance services industries are affected by the EFTS shares for either universities or polytechnics. 33 In each case, we find no significant sectoral effects. Thus, we find no evidence that the presence of universities or polytechnics is either enhanced by local complementarities or has any effect on changing the local industrial structure. These results are consistent with the finding that the WLS estimates for the impact of university EFTS on employment growth are weaker relative to the OLS estimates, given that Auckland is both the largest and (on most measures) most innovative TLA in the country. They suggest that urbanization externalities (Jacobs 1969) have been more important than localization externalities (Marshall 1890) for this case of a country that is more dependent on primary production than most other developed countries.
These results are also consistent with the findings of Liu (2015) for the impacts of the land-grant universities in the United States. Liu found that the establishment of those universities led to an increase in local population and an increase in local manufacturing productivity but did not lead to an increase in the relative size of the manufacturing sector in the local county (compared with control counties). To explain this set of outcomes, Liu conjectures that one possible explanation is that the land-grant universities generated positive spillovers for all sectors nearby rather than yielding sector-specific benefits.
Conclusions
We test the relationship between the presence of HEIs and local population and employment growth within New Zealand controlling, inter alia, for the official demographic projections of population growth of each area. Using a sample of fifty-seven TLAs between 1986 and 2013, we find, ceteris paribus, that TLAs with a greater share of university EFTS relative to their local working-age population grow faster in terms of both population and employment.
We consider an HEI as a form of infrastructure which has the potential to improve both the local level of productivity and/or the local stock of amenities, leading to an inflow of people and jobs. We test for this relationship while controlling for local time-invariant factors, national time-variant factors, and local observable and unobservable time-variant factors. The latter include the official five-, ten- and twenty-year (medium) population projections that were publicly available in each period. We include these projections for two reasons. First, they account for purely demographic characteristics that are projected to shape local growth; importantly, these demographic projections include the arithmetic impact of expected increases in university student numbers in cities with universities. Second, the projections may play a role in shaping strategies and actions taken by policy makers. The inclusion of the projections helps to control for variation in HEI activity driven by the perceived future potential of the area. The estimated (difference GMM) coefficients on the five-year population projections are significantly different from zero (and not significantly different from unity) in both the population and employment growth regressions. We also control for the possibility of reverse causality by including the lagged growth rate, and we estimate our relationships using difference GMM to account for endogeneity in student numbers.
In the absence of strong identification arising from differentiated policy experiments across space and time, these three avenues to account for endogeneity (GMM estimation, inclusion of the lagged dependent variable, and inclusion of the population projections) are important to enable a causal interpretation of our results. The one policy experiment (SIT’s zero fees scheme) is used to test further the robustness of our results with respect to polytechnic student effects; we find no evidence of additional population growth effects stemming from the increase in polytechnic student numbers in Invercargill following the introduction of zero fees.
We consistently find a positive relationship between the relative size of the university EFTS population and local population and employment growth. This remains the case across a number of robustness tests including use of alternative samples (both with and without teachers), alternative HEI variable definitions and three different estimation techniques. At the means, a one percentage point increase in the university EFTS share is associated with a 0.19 (0.14) percentage point increase in the annual average population (employment) growth rate. By contrast, the relationship of growth with polytechnic EFTS shares is weaker and is estimated far less precisely. This result is consistent with the raw descriptive data which shows that areas with universities tend to retain and/or attract a high proportion of degree-qualified residents, while areas with (only) polytechnics do not have a distinctively different share of vocationally trained residents relative either to areas with a university or areas with no tertiary institution.
We investigate whether the magnitudes of the relationships vary according to various local characteristics associated with innovative activity. We do so by estimating specifications that include interactions between HEI activities and proxies for innovative activity. We find no evidence of complementarities between these activities and the presence of an HEI. Similarly, we find no evidence that the presence of an HEI alters the industrial structure of local areas. These findings imply that impacts of university EFTS shares on population and employment growth are more likely to be related to urbanization externalities (including amenity effects) than to localization externalities. A natural extension would be to analyze whether differing courses of study within universities and polytechnics have differing effects on local population and/or employment growth (with or without innovation complementarities). However, data limitations preclude analysis along these lines.
In any study such as ours, it is possible that omission of factors that affect both university EFTS shares and population or employment growth could account for the positive relationships that we estimate. We have endeavored to minimize this possibility by (i) including a large set of control variables in all our regressions, (ii) including lagged growth to control for reverse causality, and (iii) including demographers’ official projections of population growth to account for unobservable time-variant factors that may have impacted on both EFTS shares and population and employment growth. Inclusion of these demographic projections is a novel element of our approach designed to control for the influence of time-variant factors that are otherwise unobservable to the econometrician. Where suitable projections data are available, this approach could be of use to control for similar unobservable factors in other regional studies.
Our results are relevant to local policy makers. Policy makers within university cities who wish to support local employment and population growth may usefully adopt policies that enable the expansion of their university institutions. For instance, this may include planning policies that facilitate construction of new buildings, including additional student accommodation. Central government policy makers may assist through facilitative immigration policies relating to student visas that enable universities to attract increased numbers of international students.
The task for policy makers in cities that do not already have a university is more substantial, especially given that establishing a university is very costly and is likely to require central government support. Our results indicate that places with a polytechnic have not generally been able to leverage that institution’s presence to enhance local growth.
Reference to the summary statistics in Table 1 instead offers another way forward. While areas that host neither form of HEI have a low mean growth rate for both population and employment, the associated standard deviation for each variable is much higher than for the other urban types. These data suggest that specialized local factors other than universities have also played a major role in disparate TLA fortunes. The ability to leverage specialized local factors may therefore be the relevant route to enhancing population and employment growth in areas that lack a university. For instance, Perkins, Mackay, and Espiner (2015) highlight the impact on local growth of leveraging off wine growing in one rural area within New Zealand that had previously relied primarily on sheep farming. Thus, hosting a university is far from the sole route to local success; other avenues that leverage local strengths are also available. Nevertheless, for a city that has a university, our results indicate that there are local population and employment growth benefits from enhancing that institution’s fortunes.
Footnotes
Appendix A
Appendix B
Authors’ Note
Any views expressed are the sole responsibility of the authors.
Acknowledgment
We thank all public agencies (especially Statistics New Zealand and the Ministry of Education) and private sources from whom we accessed data. We thank Auckland Council for funding for an earlier version of this study, and thank Adam Jaffe, Dave Maré, and Dean Hyslop for helpful comments and advice.
Declaration of Conflicting Interests
The author(s) declared no potential conflicts of interest with respect to the research, authorship, and/or publication of this article.
Funding
The author(s) disclosed receipt of the following financial support for the research, authorship, and/or publication of this article: This article has been prepared with Ministry of Business, Innovation and Employment funding for the Resilient Urban Futures programme. An earlier version formed a master’s dissertation by Eyal Apatov at the University of Auckland.