
Abstract
Innovative actors have been studied in both triple helix and quintuple helix framework. Their functions and interactions between each other have been demonstrated, but spatial agglomeration involving all kinds of innovative actors has rarely been deeply analyzed especially in a metropolitan area. Existing innovation theories and relevant research explain why innovative actors agglomerate and cooperate but provide few spatial evidence to support the importance of geographical proximity. Taking the Yangtze River Delta metropolitan area as an example, this study focuses on confirming the importance of geographical proximity between not only technology firms but also other different types of innovative actors on both data and spatial level. Following the triple helix model, namely, technology-, knowledge-, and service-based actors, this study traces the spatial agglomeration and growth of innovative actors since 2008. Primacy index, concentration, and spatial Gini index were used to examine the extent to which three kinds of innovative actors were concentrated in the metropolitan area and a highly centralized hierarchy system with a trend to become multicenter system was thus shown as the spatial distribution structure of innovative actors in the study area. The study also evaluates the innovative performance measured by patents before comparing the innovative capacity of different kinds of innovative actors. By assessing the innovative output structure and leading type of innovative actors, common features of innovatively well-performed cities were concluded as the simultaneous existence of high-output knowledge-based leading actors and a large number of technology-based actors.
Keywords
Introduction
Innovative activities in metropolitan areas have been studied and their positive role to promote economic development has been demonstrated as well. Innovative actors are main implementers of innovative activities and can be divided into several categories based on the different roles they play in the innovation system. Previous research has proposed triple helix (namely, firms, research institutes, and higher education institutes) and quintuple helix models (including government and intermediaries besides the three; Morgan 1997; Etzkowitz 2003; Leydesdorff and Meyer 2006; Zhao, Li, and Wu 2009; Carayannis and Campbell 2010) as innovative actors. Based on the above two models, this article adopts the modified triple helix of innovative actors as three following types considering the different ways they have been engaged in when producing, spreading, promoting, and applying knowledge: (1) technology-based actors like high-tech firms that get profits by selling or applying new technologies or products; (2) knowledge-based actors like universities and research institutes that focus on inventing new methodologies and generating new knowledge; and (3) service-based actors like high-tech incubators, intermediaries, and authorities that provide services associated with science and technology or making policies (Zhou 2016).
Metropolitan areas have always been the place where resources including capital, labor, and information are highly concentrated. They also tend to be the most innovative areas, as numerous innovative actors and a large number of innovative talents settled in the area. In Britain, for instance, there were thirty-two Tech Clusters by the end of 2014 among which those largest ones are all forming around big cities and metropolitan areas like London, Manchester, and Birmingham (Figure 1). Similarly, technical firms are highly concentrated in Tokyo metropolitan area (which also known as “One Metropolis, Three Prefectures”) in Japan (Liu 2014; Figure 2).
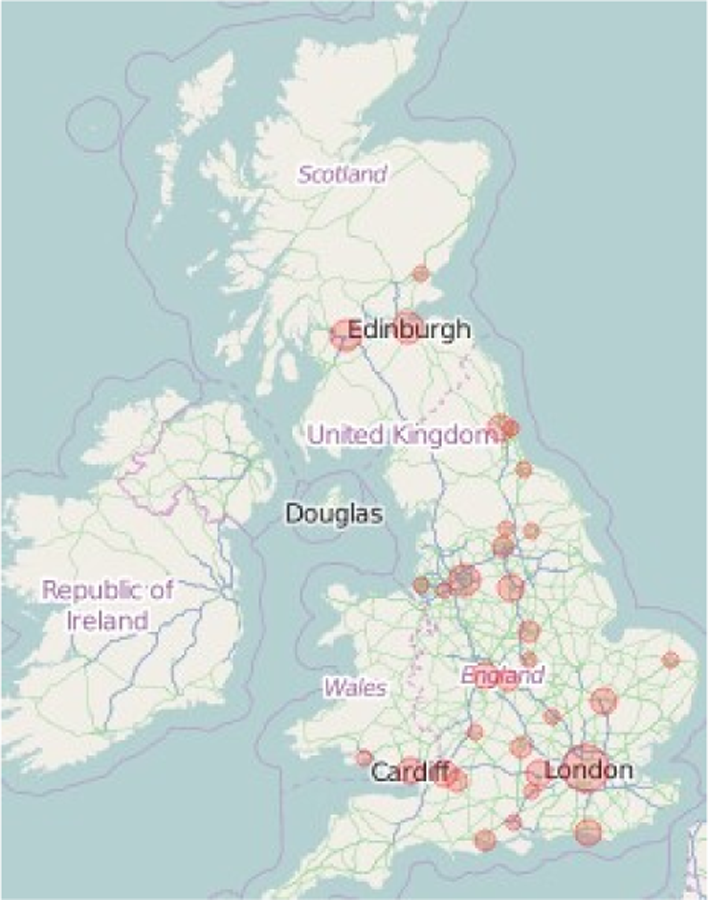
Distribution of UK Tech Clusters. Source: http://techbritain.com/.

Spatial distribution of corporate research and development institutes in Japan. Source: Liu (2014).
In China, by the end of 2014, 84 of the 107 national high-tech zones and 1986 of the 2,483 universities and colleges are located in the twenty metropolitan areas. 1 More than 20,000 economically active high-tech firms in high-tech zones are situated in metropolitan areas, which account for about 94 percent of the total ( China Torch Statistical Yearbook 2015). Spatial distribution of technology enterprises, the innovative effects of enterprises or universities and research institutes as well as the linkages and collaboration between them have been widely studied. However, very little research has been done on the spatial distribution of all three kinds of innovative actors in Chinese metropolitan areas. The importance of geographical proximity between different kinds of innovative actors has been theoretically explained but few data proof or detailed spatial evidence was provided. Taking Chinese Yangtze River metropolitan area (the Yangtze River Delta [YRD] Area), assembly of sixteen cities 2 including big cities like Shanghai, Nanjing, and Hangzhou, as an example, this article mainly focuses on the three following issues: (1) Which can better describe the agglomeration of innovative actors in the YRD area? A centralized hierarchical system or a decentralized network? Was it getting much more centralized or balanced in recent years? (2) How is the performance of the innovative actors and how did their outputs vary as they play different roles in innovation chain? (3) Why does geographical proximity between different innovative actors matter and how does this be supported by both data and spatial evidence? The second part briefly describes the theoretical framework that helps establish this research. The third section provides data source and methodologies that are used in this article. The fourth section describes the general distribution and recent growth of innovative actors in the YRD area. The fifth section examines the innovative vitality and capacity of the sixteen cities using the number of authorized and valid patents. Common features of innovatively well-performed cities are summarized based on both data and spatial evidence. The sixth section concludes with some limitation listed as well.
Innovation Theories Used to Explain Actors Agglomeration in a Metropolitan Area
Innovation theories started from Schumpeter’s innovation theory emphasizing entrepreneurs and enterprises are comprehensive theories involving various disciplines such as geography, economics, management science, and even philosophy. Early theories focused more on technology enterprises inspired by Schumpeter theory. As more studies are being carried on, universities, government, and various research institutes were studied as part of innovation system and relevant theories were greatly enriched. Based on these theories, spatial distribution and agglomeration of main innovative actors in a metropolitan area can be explained from the three following aspects.
Industry Cluster Theory Helps Explain Why Innovative Actors Tend to Agglomerate
The industry cluster theory illustrates how lots of interrelated companies agglomerate in a specific area and benefit from this agglomeration by sharing information and reducing communication and logistics cost due to geographical proximity. Based on this principle, innovation cluster is proposed, as hundreds and thousands of innovative actors agglomerate in a certain area and benefit from knowledge sharing and technology transfer. This explains why innovative actors tend to spatially agglomerate and geographical proximity is important for promoting innovation. Many studies confirm this theory by examining the growth of innovative actors in a specific region or a city. High-tech firms, the main technology-based innovative actors, were more often studied than the other two kinds of innovative actors especially in early research in China. High-tech firms tend to agglomerate to share the benefits of knowledge spillover and get easier access to potential customers and public platforms (Porter 1990; Frenken et al. 2004; Boschma 2005). Multiple metrics have been created to evaluate the degree and the spin-off process of high-tech clusters using spatial density, geographical concentration, or other indices (J. Wang, Song, and Li 1996; Deng and Tu 2014). However, researchers also found that geographical proximity of innovative actors can have both positive and negative impacts on innovation, that is, being too far or too close can undermine innovation (Li 2013).
Synergy and National Innovation System Attract Different Kinds of Innovative Actors Agglomerate
Synergy or to be more detailed collaborative innovation is a positive innovation organization model of large-span integration consisting of various institutes producing, using, or promoting knowledge, such as technology enterprises, universities, and research institutions. It is thought to be helpful for encouraging great scientific and technological innovation and was an extension of national innovation system which was first proposed by OECD (The Organisation for Economic Co-operation and Development) as a combination of actors like government, enterprises, universities, research institutes, intermediaries, and so on. It was a system set to promote the positive effect of interactions when producing, disseminating, and applying knowledge. The innovation capacity of this system depends largely on the ability of these actors to optimize sources in the large knowledge creation system. This theory helps explain why different kinds of innovative actors need to agglomerate as they play different roles in the innovation chain. Some research, though not that much as about high-tech firms, has emphasized the role of knowledge- and service-based actors for that they could promote regional innovation and accelerate knowledge and technology transfer (Kenney and von Burg 1999; Zhang and Li 2007; Shen and Zhou 2013). Research on university–industry linkages in the United States and Europe indicates that despite strong external linkages between firms and research institutions, linkages within a high-tech cluster between research institutions, universities, and firms are more significant and diversified, which could be partly illustrated by more knowledge flowing from producers (universities and research institutes) to developers (high-tech firms) due to geographical proximity (Arundel and Geuna 2001; Athreye 2003).
Regional Economics and Product Life Cycle Make the Metropolitan Area a Seedbed for Innovation Agglomeration
As a subdiscipline of economics, regional economics addresses the economic aspect of the regional problems that are spatially analyzable. Regarding the use of this theory in innovation studies, compound research has revealed that geographical proximity and knowledge spillover in a region have diversified effects on agglomerations of different actors at different scales. Geographical proximity and cultural similarity within a specific area are proved to be more helpful than national system when promoting innovation at a faster speed and lower cost. On the other hand, the spread and promotion of new products rely heavily on communication and external economies. As metropolitan area attracts a lot of resources, like capital, labor, and information source, the communication and exchange cost can thus be minimized while positive external economy can be maximized. These theories together explain why different innovative actors tend to agglomerate in the metropolitan area. Some research also shows that geographical proximity alone cannot assure knowledge transfer. The knowledge gap between different innovative actors, their capability to absorb innovation, and regional demand all matter much (Ye 2001; Z. Wang et al. 2003; Luo et al. 2014). Hierarchical structure, especially relatively lower cost and proximity to the central city in subcentral area of a metropolitan area, provides both geographical proximity and knowledge gap for the knowledge transfer and spin-off. Studies on the relationship between the regional innovation system and urban structure also pointed out that when a city cluster changes its size, its internal innovation connections can also either evolve to new forms or be strengthened (Basant and Pankaj 2007). This offers an applicable method to study spatial distribution model of innovative actors in a metropolitan area.
Focusing on knowledge transfer and positive external economy, innovation theories including industry cluster theory, synergy, and national innovation system explain why innovative actors agglomerate and cooperate while regional economics and product life-cycle theory reveal why all kinds of innovative actors tend to gather in metropolitan area. Based on these theories, the importance of geographical proximity between innovative actors can not only be confirmed by data and spatial analysis but also be further concentrated on innovative actors with specific characteristic agglomerating in a specific area.
Data and Method
From 2010 to 2015, data collection and field investigations on innovative actors and their innovation activities have been conducted in nine of sixteen cities in the YRD area. 3 A series of innovative actors were involved in our survey, and data and information were acquired during this process. In this article, high-tech firms are used to represent technology-based innovative actors, and universities and high-tech incubators are used to represent knowledge- and service-based ones considering the coherence of their statistical data. In order to assess the extent to which the innovative actors are concentrated in the YRD area and to evaluate what kind of spatial distribution tendency they have shown, numbers of each kind of innovative actor in each city are collected in several ways. For the number of high-tech firms, the list of newly authorized high-tech firms of each province from 2008 to 2014 4 was used for counting. The list was published on the official website of INNOVATION COMPANY 5 two to four times a year. All the high firms operating for more than one year are supposed to be verified every year to see if they are “high tech” enough to enjoy the tax-free (or reduction) and other preferential policies. However, due to the complicated audit approach and the fact that the number of unqualified high-tech firms was quite small compared to the total number, firms that failed to pass a second-year verification have not been removed from the statistic of this research. The number of universities was acquired from 2015 China City Statistical Yearbook (the data of the year 2014)—regular institutions of higher education. As for the number of high-tech incubators, the Annual Summary of Science and Technology Bureau or Statistical Bulletin of the National Economy and Social Development of each city were the main source. Here, we focus only on national and provincial high-tech incubators, that is, those pilot incubators selected and supported with specific funds and preferential policies by the national or provincial government. Although there are also many other incubators funded by the city government or even private institutes, neither standardized definition nor verifying or statistic system has been formulated for them. There is no convincing statistical data for these city or private incubators and they are thus beyond the scope of this research.
Previous research provides quite a few methods to evaluate geographic concentration. Here primacy index (P), concentration(CR), and spatial Gini index are used to demonstrate the spatial distribution of innovative actors and to examine the change of agglomeration to see if the innovative actors are more concentrated or vice versa. Primacy index indicates how innovative actors concentrated in the largest city. Here, we define “two-city primacy index” as the ratio of the number of innovative actors in a primary and a secondary city and “four-city primacy index” the similar, that is, P2 = C1/C2 and P4 = C1/(C2 + C3 + C4). CR is the ratio of the number of innovative actors in top cities and the number in the whole region, that is, CR1 = C1/all, CR2 = (C1 + C2)/all, and so on. It reveals how important those big cities are in the regional innovation system. Location Gini index is used to evaluate how centralized (or decentralized) the innovative actors are in the whole area. The index is calculated as follows:
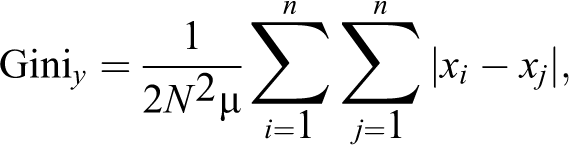
where x is the number of innovative actors in each city, μ is the average number of innovative actors of all the cities, and N is the number of cities in the metropolitan area (N values 16 here in the YRD area). In addition, ArcGIS is used to measure the movement of innovative center—the geographical gravity center of all the innovative actors—from 2008 to 2014 to spatially examine the growth of innovative actors in the whole area.
To better understand the effect of agglomeration and proximity of innovative actors, the innovative output can be used to assess the innovative capacity of a city and contribution that different innovative actors have made as part of the regional innovation system. Two types of regular statistic data can be used to measure the innovative output of a city in China: patents and high-tech industrial output. The number of the annual patent in the statistical yearbook of each city is used as a metric to evaluate the output of innovative actors since it is a standardized statistic and thus can be used to carry out the comparison between different actors and different cities. Data from the SIPO (State Intellectural Property Office of the P.R.C.) official patent-searching website 6 and a third-party public patent searching website PatExplorer 7 are used as supplements from which numbers, types, and details of patents can be acquired. Meanwhile, the latter website offers some simple but key analyses like applicants or publication time which help us get more information about those patents. The high-tech industrial output is another indicator to economically describe the output of innovative actors. However, these data have not been used in this article not only because these are not available for all the sixteen cities in the YRD area but the category for high-tech industry varies between different provinces, which might mislead our conclusion. All the other data used in this article, if have not been particularly pointed out, are collected from either China City Statistical Yearbook (2015) or Annual Statistical Yearbook of the year 2015 of each province or city.
Spatial Agglomeration of Innovative Actors in the YRD Metropolitan Area
In the last few decades, cities in the YRD area saw significant growth in both economic and demographic dimension. As of innovation, though not that eye-catching as Shenzhen, one of the core cities of Pearl River Delta metropolitan area, and Beijing, capital city of China and core city of Beijing–Tianjin–Hebei metropolitan area (known as Jingjinji in Chinese), cities in the YRD area have shown relatively monolithic innovative vitality and the YRD area has become one of the most innovative areas in China. From 2012 to 2014, the YRD area led in both quantity and growth rate of innovative actors (Figure 3). As of 2014, the number of high-tech firms in the YRD area is approximately 1.5 times those in Jingjinji and three times the Pearl River Delta. At the meantime, the number of higher education institutes and high-tech incubators also took big advantage (Figure 4).
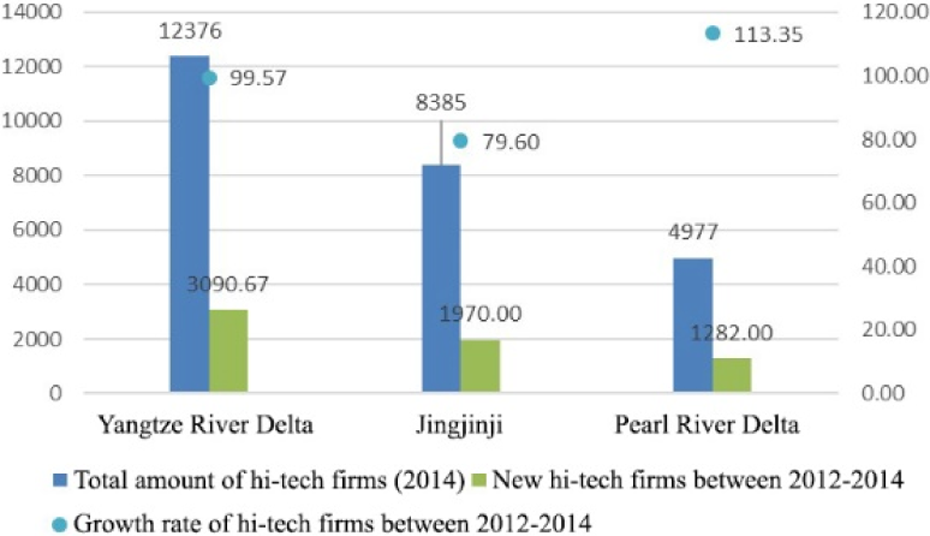
Numbers and growth rate of high-tech firms in three largest metropolitan areas in China. Source: https://innocom.gov.cn.

Numbers of three kinds of innovative actors in three metropolitan areas. Source: https://innocom.gov.cn and statistical yearbook of involved provinces.
Spatial Differential and Big Knowledge Gap Exist in the YRD Area
The YRD area involves three provinces (including a special one Shanghai). By the end of 2014, there were more than 20,000 national high-tech firms, 200 higher education institutes, and at least 550 high-tech incubators in the three provinces (Table 1). The number of three kinds of innovative actors in the three provinces account for 32 percent, 12 percent, and 34 percent, respectively, of the whole country. Meanwhile, the two provinces Jiangsu and Zhejiang show an obvious differential, especially in the number of national high-tech firms. By the end of 2014, Jiangsu has much more national high-tech firms than Zhejiang and the number of high-tech incubators in Jiangsu nearly nine times that in Zhejiang.
High-tech Firms and Incubators in Shanghai, Jiangsu, and Zhejiang (2014).
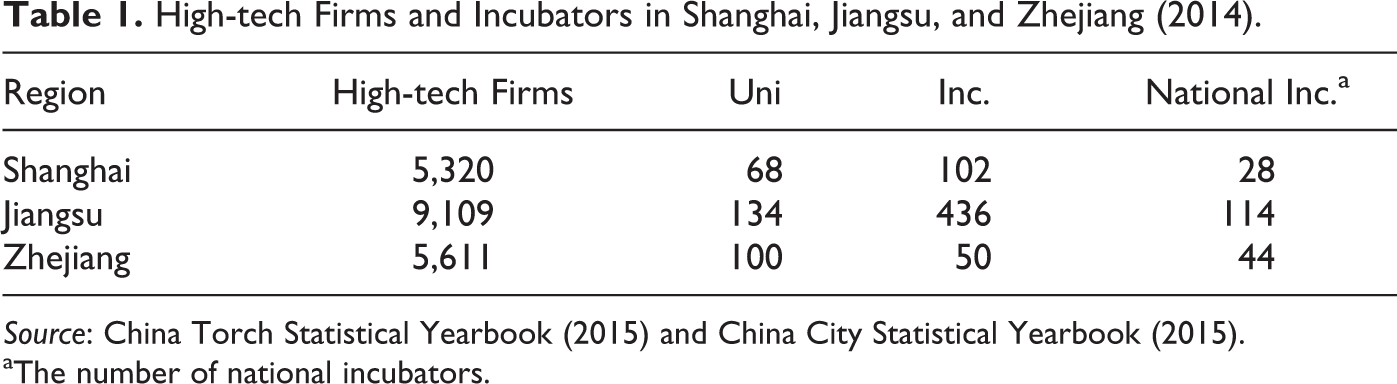
aThe number of national incubators.
Focusing on the sixteen cities of the YRD area, Shanghai–Suzhou, along with Nanjing and Hangzhou, became the innovative agglomeration center of the whole area. A big difference between Jiangsu and Zhejiang can be seen on two different levels. Regionally, the two corridor regions within the YRD area, Shanghai–Nanjing (Hu-Ning city cluster in Chinese) and Shanghai–Hangzhou corridors, show quite different innovative landscape: cities situated in the Hu-Ning corridor all have large amount of innovative actors, including Suzhou, Wuxi, and so on, while Huzhou and Jiaxing, sited between Shanghai and Hangzhou, have much less innovative actors than most other cities. On the city level, in the two cities adjacent to Shanghai, namely, Suzhou and Jiaxing, the situations are quite different. By the end of 2014, Suzhou has the second most high-tech firms and high-tech incubators. The number of its higher education institutes ranked the fourth in the YRD area. Meanwhile, the number of high-tech firms in Suzhou grew even faster than Shanghai in recent years. However, Jiaxing saw a much smaller increase in the same period and its number of high-tech firms and universities ranked the thirteen in all the sixteen cities (Figures 5–7). This differential can be partly explained by the big knowledge gap between Shanghai and its adjacent cities. As the knowledge transfer is more likely to be a process of hierarchy diffusion than contagious diffusion, Suzhou is more likely to be the destination of knowledge transfer and diffusion from Shanghai due to its smaller knowledge gap with Shanghai and better knowledge absorbing capacity as studies found before.

Numbers of high-tech firms in Yangtze River Delta cities.
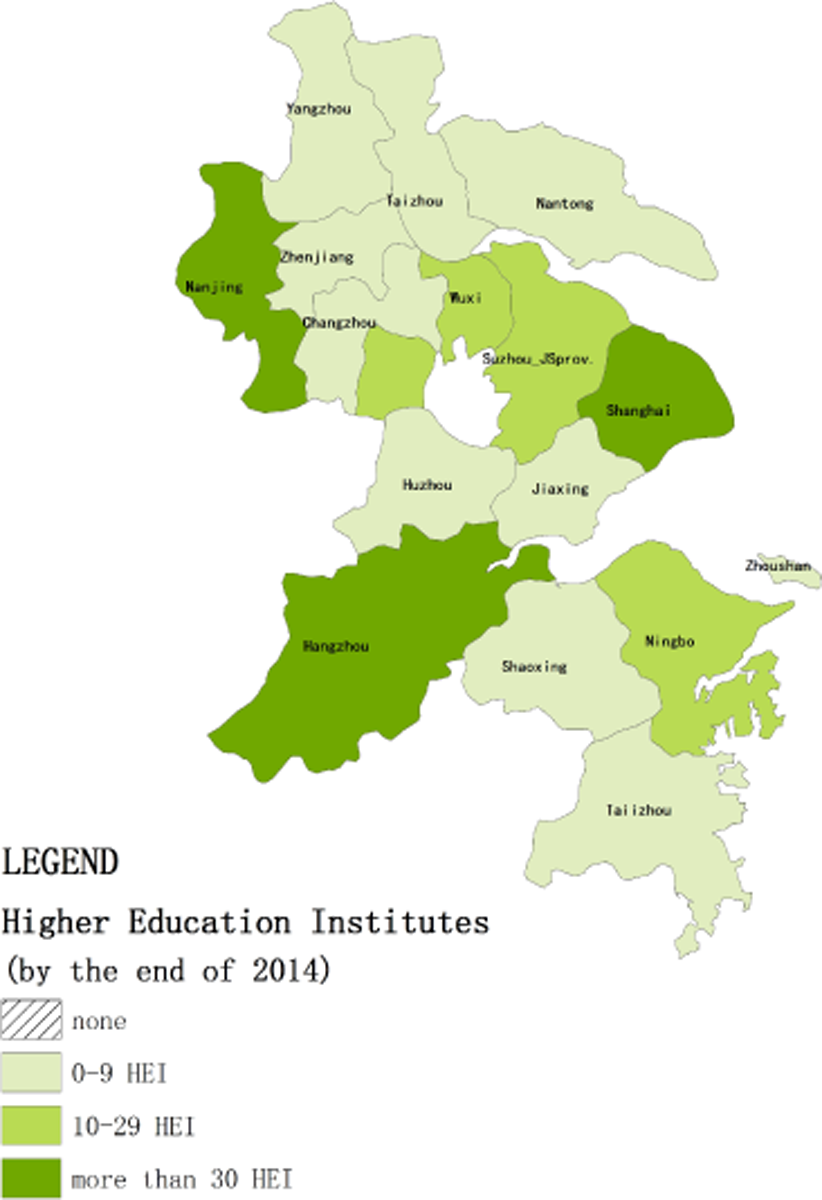
Numbers of higher education institutes in Yangtze River Delta cities.

Numbers of high-tech incubators in Yangtze River Delta cities.
Big Cities Keep Attracting More Innovative Actors
As one of the most important national or even global innovative cities, it is apparent that Shanghai leads quantitatively in all three categories of innovative actors compared with any other cities in the YRD area. Two- and four-city primacy indexes (P2 and P4) along with concentration (CR1, CR2 and CR4) are used here to evaluate how spatially unbalanced (or balanced) the innovative actors are. While CR index shows that high-tech firms and higher education institutes are highly concentrated in big cities, primacy index tells that this “concentration” is particularly seen in the top city Shanghai. However, the situations for the three kinds of innovative actors are not exactly the same. By the end of 2014, the number of high-tech firms in Shanghai more than two times that of the secondary city, Suzhou, with a two-city primacy index of 2.14 and a four-city primacy index of 0.96. The other two kinds of actors are less unbalanced with two-city indices reading 1.55 and 1.16, while four-city indices, respectively, reading 0.66 and 0.47. The actors in the top and second city together account for almost half in the region. As for high-tech incubators, though much more balanced, the two-city CR is still as high as 0.34 (Table 2).
Innovative Primacy Indices and Concentration Measured by the Number of Innovative Actors (2014).
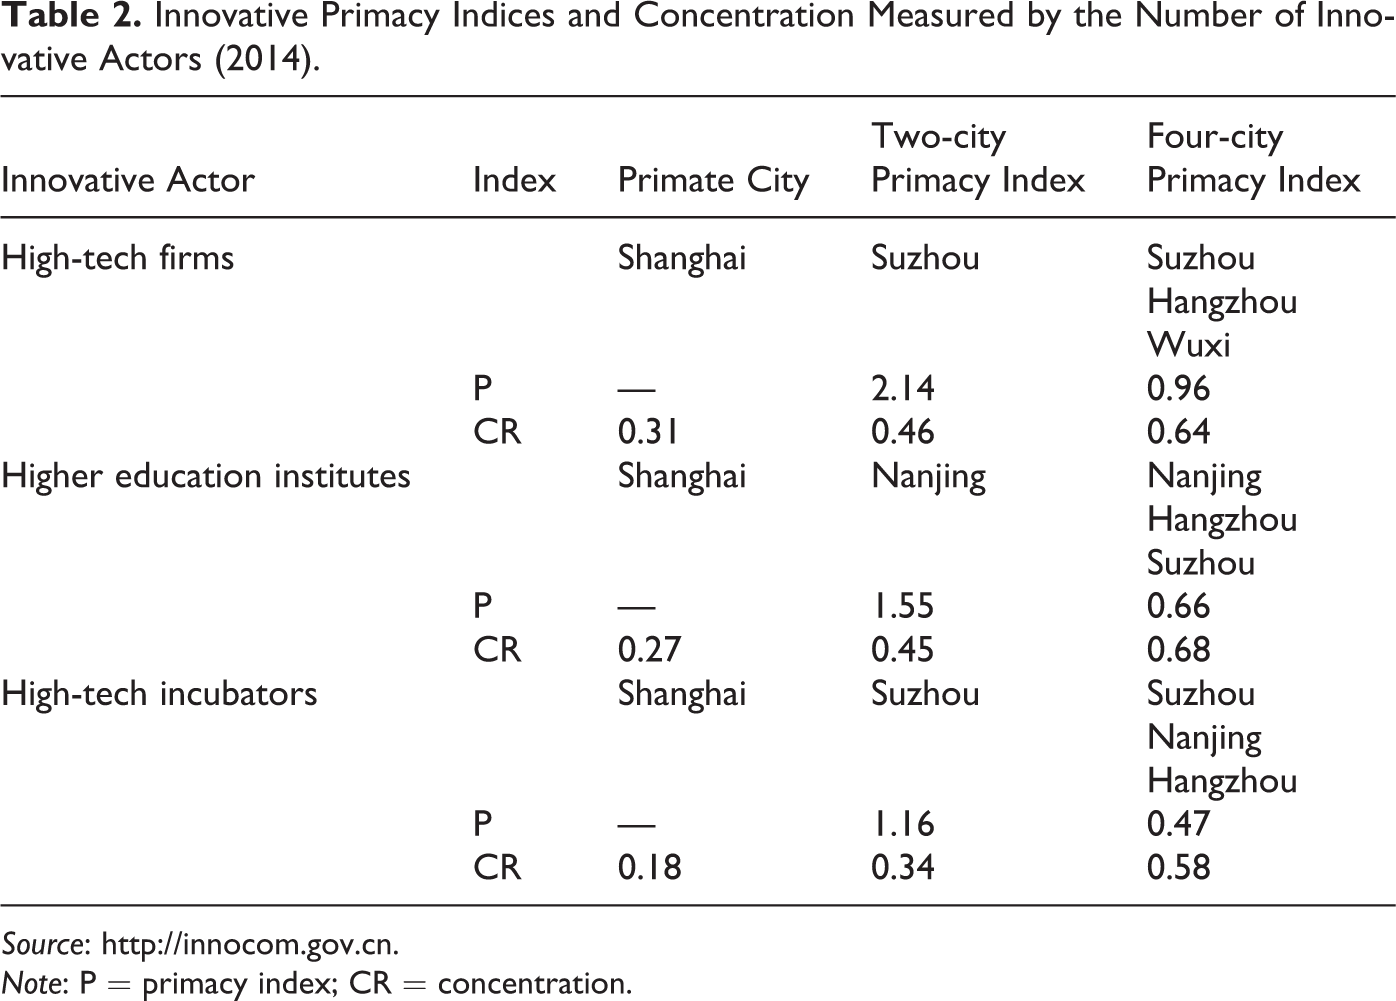
Source: http://innocom.gov.cn.
Note: P = primacy index; CR = concentration.
Spatial Distribution Structure of Innovative Actors in the YRD Area Is Tend to Be a Multicenter Innovation System
There is no doubt that innovative actors tend to agglomerate in big cities to share knowledge spillover according to the previous research. But is this “agglomeration” getting more centralized or more balanced as more innovative actors emerging every year? Annual growth of innovative actors from 2008 to 2014 was examined to answer this question. As the total number of higher education institutes and high-tech incubators were so small (compared to the high-tech firms) that it is hard to identify an explainable annual change without being confused by contingencies in a certain year, we use the number of newly authorized high-tech firms from 2008 to 2014 to examine how innovative actors emerge and agglomerate in the YRD area. Maps in Table 3 show more than 20,000 high-tech firms’ growth and distribution in the YRD area during the period. The point density represents high-tech firms’ increment while the color shows the total number of firms at the end of each year. It is apparent that Shanghai has the largest increment, while Suzhou, Yangzhou, and Wuxi saw the highest growth rate. Generally, all cities in the YRD area had a high growth rate of innovative actors at more than 25 percent. However, high-tech firms in cities in the northern part (mainly the part of Jiangsu province) of the YRD area grew faster than those in the southern part (mainly the part of Zhejiang province) in both absolute value and growth rate level.
Annual Growth and Distribution of High-tech Firms Along with Two- and Four-city Innovative Primacy Indices, Concentration, and Gini Index in the Yangtze River Delta Area.

Source: http://innocom.gov.cn.
Note: P = primacy index; CR = concentration.
Along with the rapid growth of innovative actors, decreasing primacy index and concentration show that spatial distribution of innovative actors in the whole region was getting more balanced. From 2008 to 2014, two- and four-city indexes decrease from 2.53 and 1.38 to 2.14 and 0.96, respectively, which means secondary central cities like Suzhou and Wuxi grew fast during that period. Continuously declining Gini index demonstrates how the hierarchy structure of the spatial distribution of innovative actors in the YRD area is becoming “flat”. However, fluctuating and slightly declining CR shows that the top four big cities have nearly 64 percent of all the high-tech firms and are still (and will be for a long period), playing a decisive role in the regional innovation system. Therefore, it can be considered that there is a trend that the spatial distribution of innovative actors in the YRD area tends to be decentralized although it is now still a highly centralized hierarchy system. However, this decentralization was the result of rapid growth of innovative actors in the secondary cities and the big gap between leading cities and lagged ones can only be slightly diminished but never be eliminated. Spatial agglomeration of innovative actors has a great inertia due to positive external economy like lower communication cost and easier access to knowledge sharing. Therefore, the result of this process of decentralization would be more likely a multicenter system with several leading cities than a homogeneous network.
Performance of Innovative Actors in the YRD Metropolitan Area
Geographical proximity between innovative actors was proved to be important by innovation theories and previous research. But the reason why it is important for different types of innovative actors and how it can be spatially confirmed have not been analyzed in detail. By assessing the innovative performance of cities using the number of patents, effect of spatial agglomeration of innovative actors can be evaluated and the roles of different types of innovative actors play can be compared. The YRD area is no doubt the most innovative area measured by patents. The number of the annual newly authorized patent in the YRD area, though decreased in 2013 and 2014, has increased by nearly 50 percent since 2010 (Figure 8). The authorized patents held by the sixteen cities in the YRD area account for about 30 percent of China in the year of 2014.
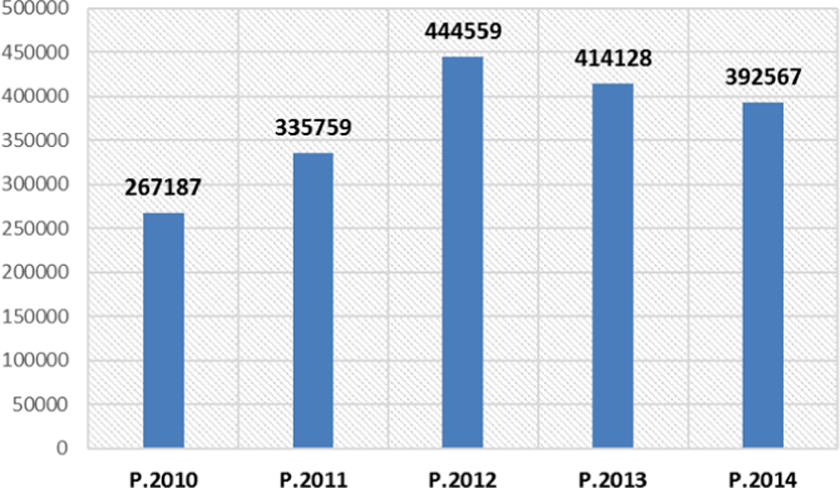
The number of newly authorized patent in the Yangtze River Delta area (2010–2014). Source: Statistical yearbook of each province.
Spatial Agglomeration of Innovative Actors Positively Contribute to Knowledge Produce
As innovative actors are main knowledge producers, cities with more actors will see more patents. High-tech firms and universities are main producers of patents according to the statistic data. In the three provinces involved in the YRD area, authorized patents held by technology- (high-tech firms) and knowledge-based actors (universities and research and development institutes), respectively, account about 87 percent and 12 percent on average (Table 4). Technology-based actors contribute more to knowledge produce according to this statistic.
Percentage of Authorized Patents in Three Provinces Held by Different Types of Actors (2014).
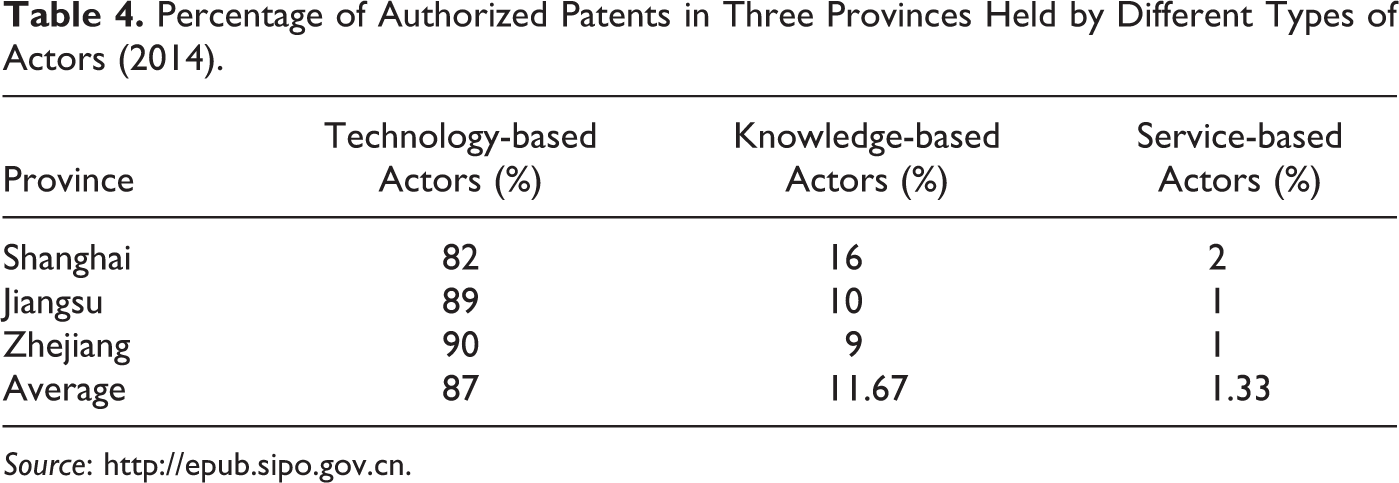
Source: http://epub.sipo.gov.cn.
Data from the patent searching website were used to evaluate the contribution of different innovative actors in detail. As the duration of validity of the patent itself is an important characteristic showing how innovative or irreplaceable the patent is, the number of valid patents can better describe the innovative capacity of the actor than authorized patents. Service-based actors are not taken into consideration, as there are so little data and information about them on city level that we can hardly evaluate their performance using the same method. Besides, they are set up to promote innovation not to produce any innovative output themselves. Generally, the number of patents in a city is highly correlated with the number of high-tech firms and universities while high-tech firms have a more obvious effect (Figure 9). This is quite understandable because, after all, about 87 percent of authorized patents were held by high-tech firms on average.
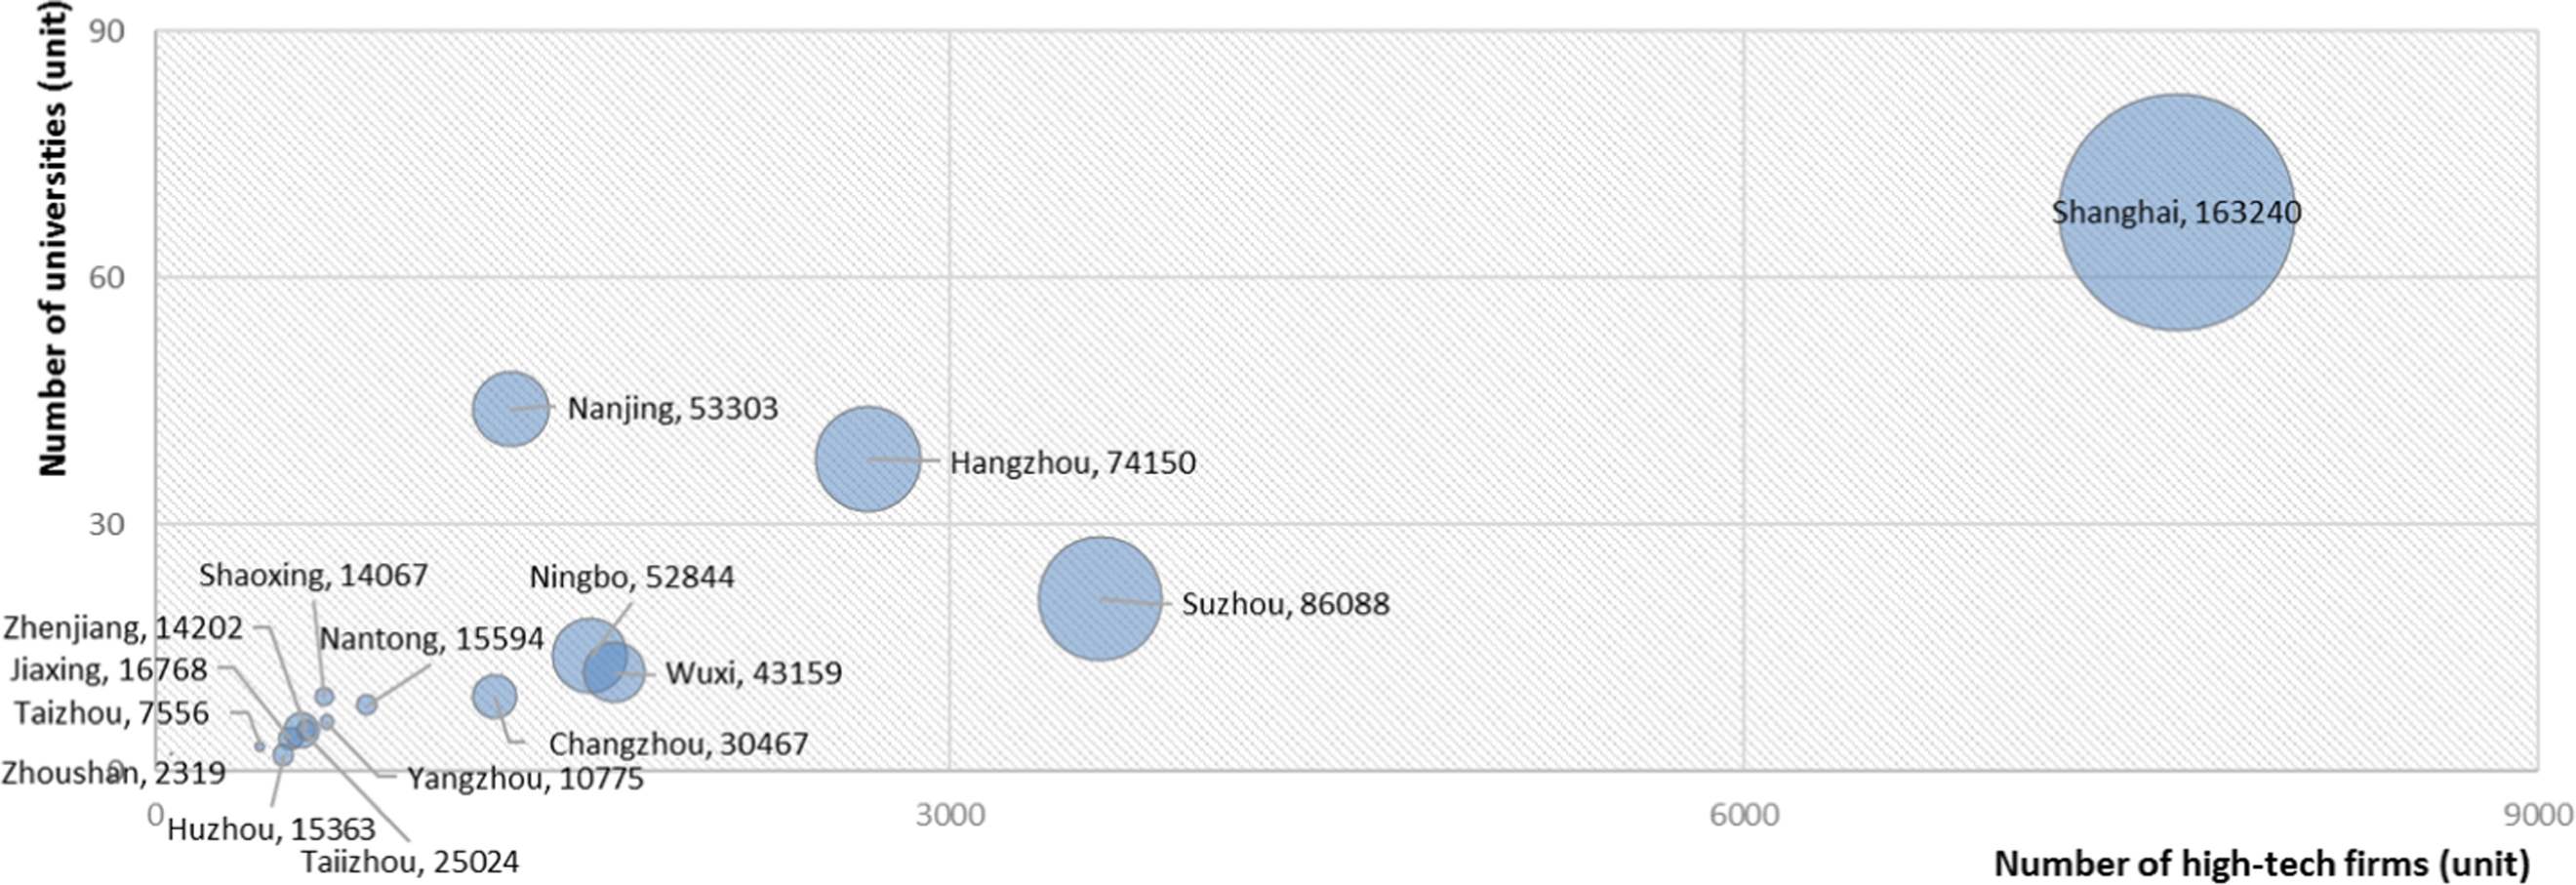
Number of universities, high-tech firms, and valid patents of each city (2010–2014).
Almost all the top ten innovative actors are high-tech firms, universities, or research institutes. Table 5 lists the information of valid patent of each city from 2010 to 2014 in the YRD area. Individuals and service departments were counted but not listed in the table even when their number of patents rank in the top ten because this can only be seen in cities with rather few patents.
Information of Valid Invention Patent in the 16 Cities (from 2010 to 2014).
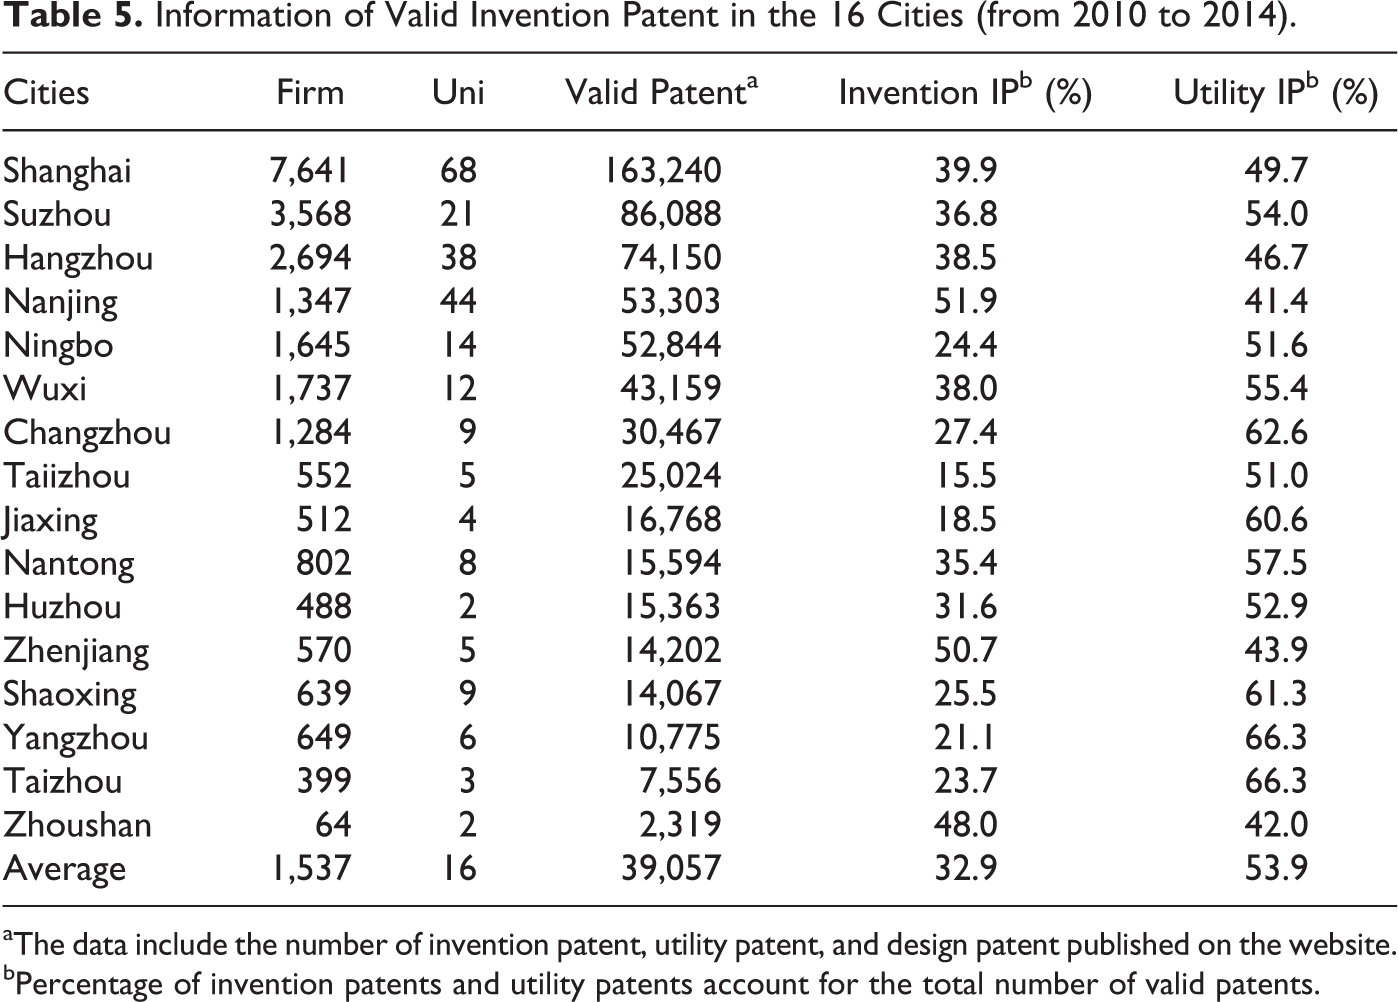
aThe data include the number of invention patent, utility patent, and design patent published on the website.
bPercentage of invention patents and utility patents account for the total number of valid patents.
Among the three kinds of patents, that is, invention patent, utility patent, and design patent, invention patents are considered to be the most innovative because they are closest to original innovation. By the end of 2014, there were more than 4.5 million valid patents in China, of which 17.6 percent were invention patents and 56.2 percent were utility ones (SIPO 2015). From 2010 to 2014, about 625,000 valid patent were patented in the YRD area and the average percentage of invention patent was 32.9 percent, much higher than the national average. Some cities, like Nanjing and Zhenjiang, saw more than 50 percent of invention patents. Shanghai alone has more than 160,000 valid patents, nearly two times the number in Suzhou, the second most city. Generally, the number of valid patents is highly correlated with innovative actors especially high-tech firms. However, if we further classify the patents and focus on the top ten innovative actors, that is, actors holding the largest number of valid patent, technology-, and knowledge-based ones will make different contributions.
Technology- and Knowledge-based Actors Make Different Contribution to Knowledge Produce
Cities saw huge gaps between their innovative capacities in terms of invention patents. The number of invention patents in the most innovative city Shanghai is nearly sixty times that in Zhoushan and more than two times that in Suzhou. Regarding the holders of these patents, ten top actors among the hundreds and thousands of innovative actors (except those in Zhoushan, to be precise, since there are too few actors in total) hold a large proportion. The proportion, with a maximum of 79.8 percent and a minimum of 10.5 percent, has an average of 30.6 percent. This means for most cities, the innovation level measured by invention patents highly depends on several key innovative actors. And these key innovative actors are more likely to be knowledge-based ones because fewer knowledge-based actors (an average of four) among the top ten actors hold more invention patents (an average of 57.6 percent; Table 6). We can thus say despite the small amount compared to high-tech firms, universities, and research institutes are actually the main force of innovation and creation of a city.
Information of Valid Invention Patents in the 16 Cities (from 2010 to 2014).a
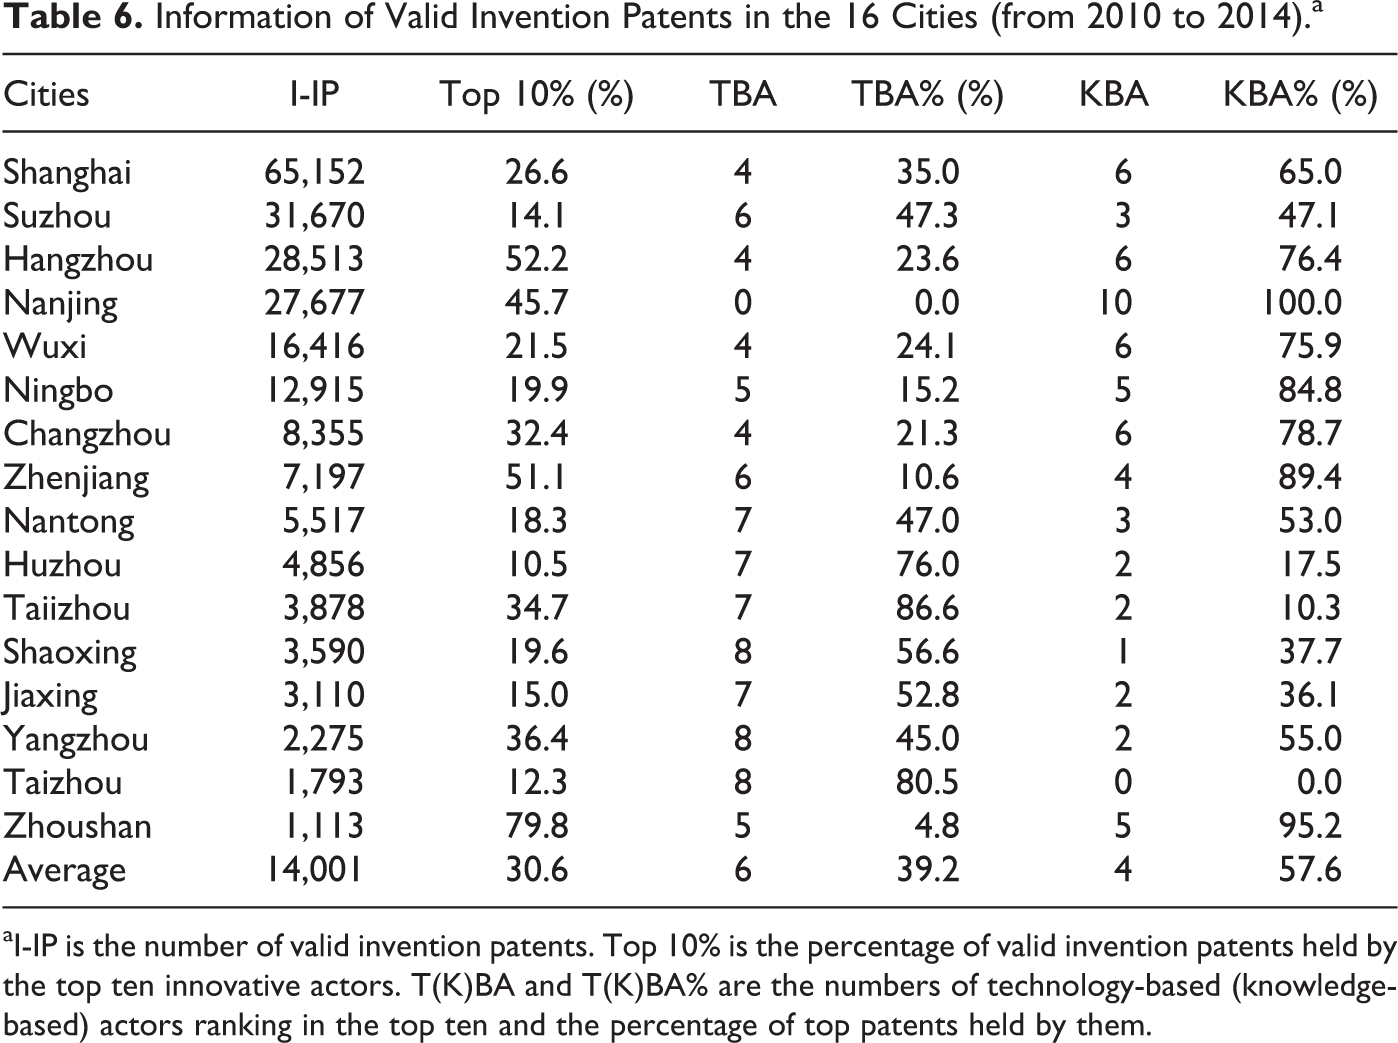
aI-IP is the number of valid invention patents. Top 10% is the percentage of valid invention patents held by the top ten innovative actors. T(K)BA and T(K)BA% are the numbers of technology-based (knowledge-based) actors ranking in the top ten and the percentage of top patents held by them.
Gaps between the number of utility patents are more remarkable, as the number of patents in Shanghai is more than eighty times that in Zhoushan. However, utility patents are not that monopolized compared to invention patents, as the average proportion of utility patents held by the top ten actors is only 13.1 percent. Technology-based actors dominate in the top ten actors holding the most utility patents. On average, eight technology-based actors hold 83.1 percent of top patents compared to one knowledge-based actor with 13.5 percent of the top patents (Table 7).
Information of Valid Utility Patents in the 16 Cities (from 2010 to 2014).a
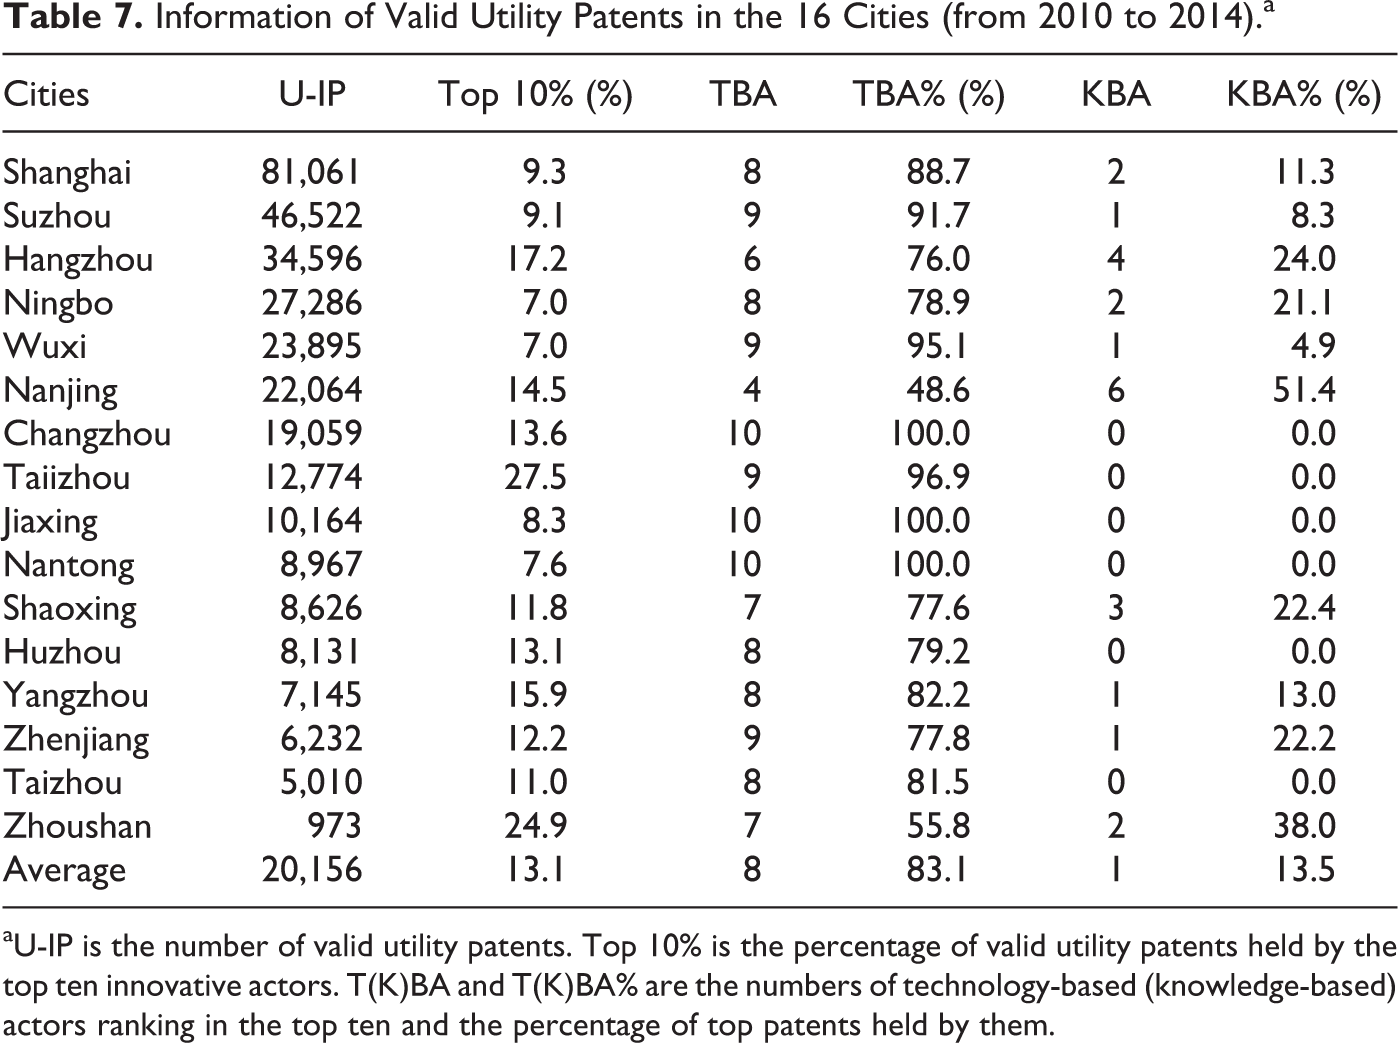
aU-IP is the number of valid utility patents. Top 10% is the percentage of valid utility patents held by the top ten innovative actors. T(K)BA and T(K)BA% are the numbers of technology-based (knowledge-based) actors ranking in the top ten and the percentage of top patents held by them.
Technology- and knowledge-based actors play quite different roles in the innovative system in accordance with the definitions of invention patents and utility patents. Knowledge-based actors dominate in invention patents and thus can be considered as actors taking advantage of original innovation while technology-based actors play a more important role in application innovation, as they saw more top actors regarding utility patents. In other words, more knowledge-based actors are likely to stand at the upper end of the innovation chain than technology-based actors in the YRD area. In the meantime, as the top ten actors hold 30.6 percent of invention patents among which fewer knowledge-based actors (four on average) take a larger percent of top patents (57.6 percent on average), every single actor matters a lot. On the other hand, top actors, most of which are technology-based actors, hold only 13.1 percent of utility patents. Technology-based actors, due to their large amount, play an important role in the innovative system, but each single actor as an individual is replaceable. Till now, there are few high-tech firms that can be comparable to a university whether in invention innovation or utility innovation in the YRD area. However, this is not to say, technology-based actors are not important. Innovatively well-performed cities have both remarkable universities and a large number of high-tech firms.
Features of Innovatively Well-performed Cities
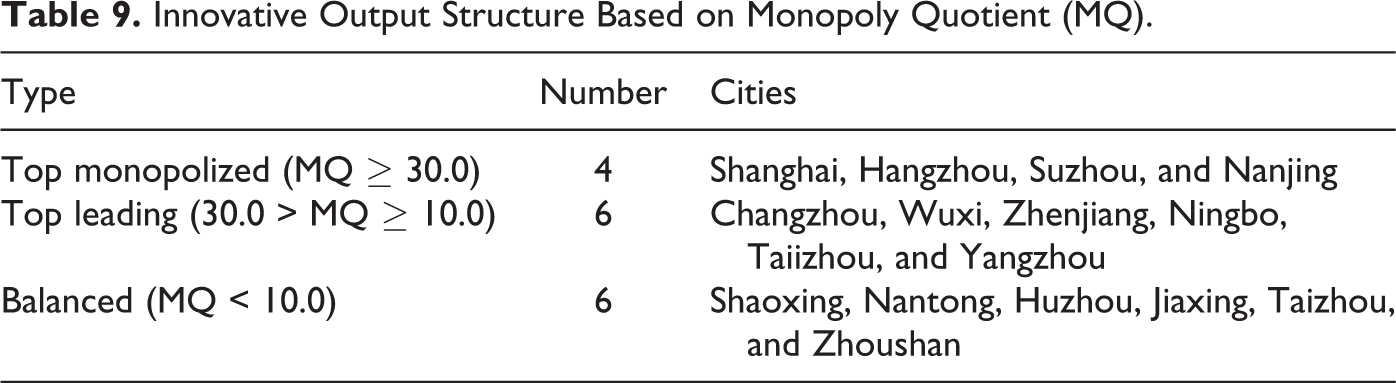
Cities see more valid patents can be considered as innovatively well-performed cities and we can thus try to find out what common features those well-performed cities share. These features are demonstrated from two aspects: innovative output structure and types of leading actors. The innovative output of a city measured by valid patents can be defined as top monopolized, top leading, and balanced based on the monopoly quotient (MQ) which is calculated as follows:

where P Top10 is the number of valid patents held by the top ten actors, PT is the number of total valid patents of the city, while AT and AK are numbers of technology- and knowledge-based actors, respectively. The highly monopolized city Shanghai saw the maximum of MQ at 103.1, while Zhoushan was the most balanced one with an MQ of 3.0 (Table 8). Cities are then divided into three categories as described above and the result, though highly correlated with the number of total innovative actors, tells the differences of innovative output structure of cities in the YRD area especially between those with a similar number of innovative actors (Table 9).
Monopoly Quotient (MQ) in the Yangtze River Delta Area.

Innovative Output Structure Based on Monopoly Quotient (MQ).
On the other hand, leading type of innovative actors depends on the total proportion of valid patents (PR) as well as the differential between the average proportion of patents (DR) held by technology- and knowledge-based innovative actors:
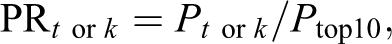

where Pt or k is the number of top ten patents held by technology- or knowledge-based actors, P top10 is the total number of top ten patents, t and k are, respectively, the number of technology- and knowledge-based actors. The ratio is 0 when t or k is 0. Cities will be described as technology leading or knowledge leading when PR index is more than 80 percent, which means more than 80 percent of the top ten patents were held by one certain kind of innovative actors, or DR index is more than average (10.7 percent), which means each single top technology-based actor holds much more valid patents than knowledge-based one (or vice versa; Table 10). Based on this rule, sixteen cities in the YRD area are divided into three groups as four technology-leading cities, six knowledge-leading cities, and six hybrid cities.
Types of Leading Innovative Actors.
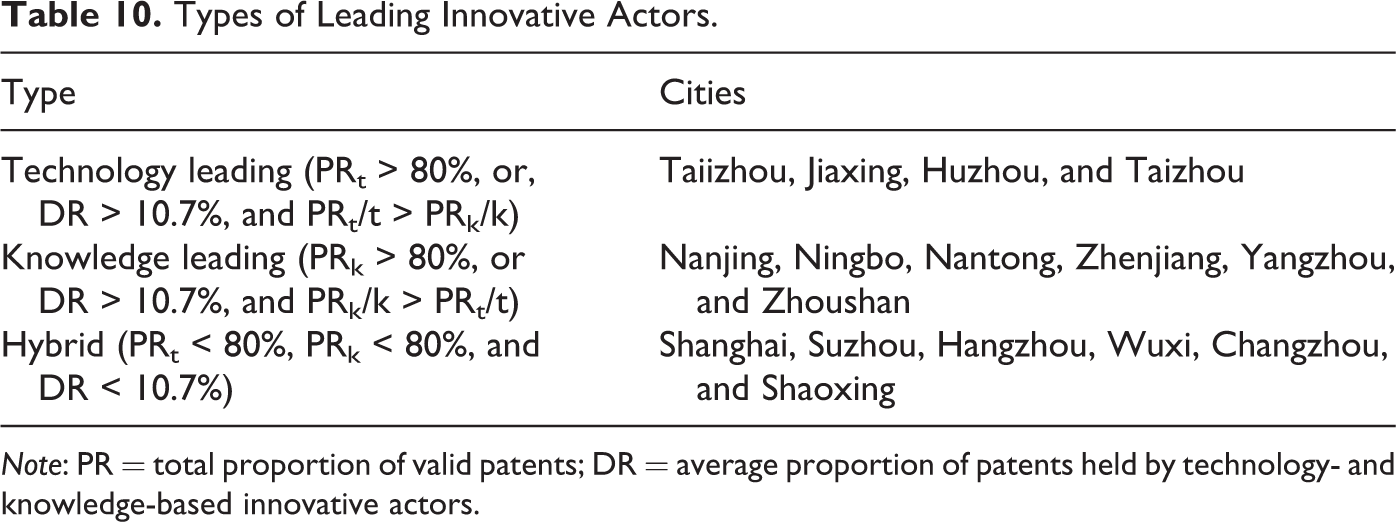
Note: PR = total proportion of valid patents; DR = average proportion of patents held by technology- and knowledge-based innovative actors.
Considering all the above elements, we can summarize several features of those innovatively well-performed cities. Cities in Table 11 are listed in the order of the number of the total valid patents, as Shanghai with most valid patents was listed at the first. Generally, top-monopolized cities are most well-performed ones and top-leading cities see more patents than balanced cities. As for types of leading actors, hybrid cities and knowledge-leading cities are more likely to be well-performed cities than technology-leading cities. The results of output features and leading actor type tell two things. The first thing is that leading actors play a decisive role in promoting the innovative capacity of a city. Besides the fact that the top ten alone hold about 17.8 percent of valid patents on average (30.6 percent of valid invention patents on average), top-monopolized cities are much more innovatively well performed that balanced cities. Another evidence to support this is that cities like Shanghai, Suzhou, and Hangzhou which rank in the top place have more 1,000-patent actors, while poor-performed cities usually have no such leading actors, let alone their first actor holding only hundreds of valid patents. Among these leading actors, knowledge-based actors are more impressive not only because they generally hold more valid patents (and much more valid invention patents) as individuals but also because in most cities, innovative actors holding the most patents (first actor) are knowledge-based ones. The second thing is the higher innovative output of hybrid cities corroborates the importance of geographical proximity between technology- and knowledge-based actors. Although knowledge-based actors hold more valid patents on average and lay the groundwork of the innovative capacity (especially of original innovation), hundreds and thousands of technology-based actors provide sustainable innovative growth of a city by playing a different role and collaborating with knowledge-based actors on innovation value chain.
Valid Patents and Innovative Actors from 2010 to 2014 in the Yangtze River Delta Area.
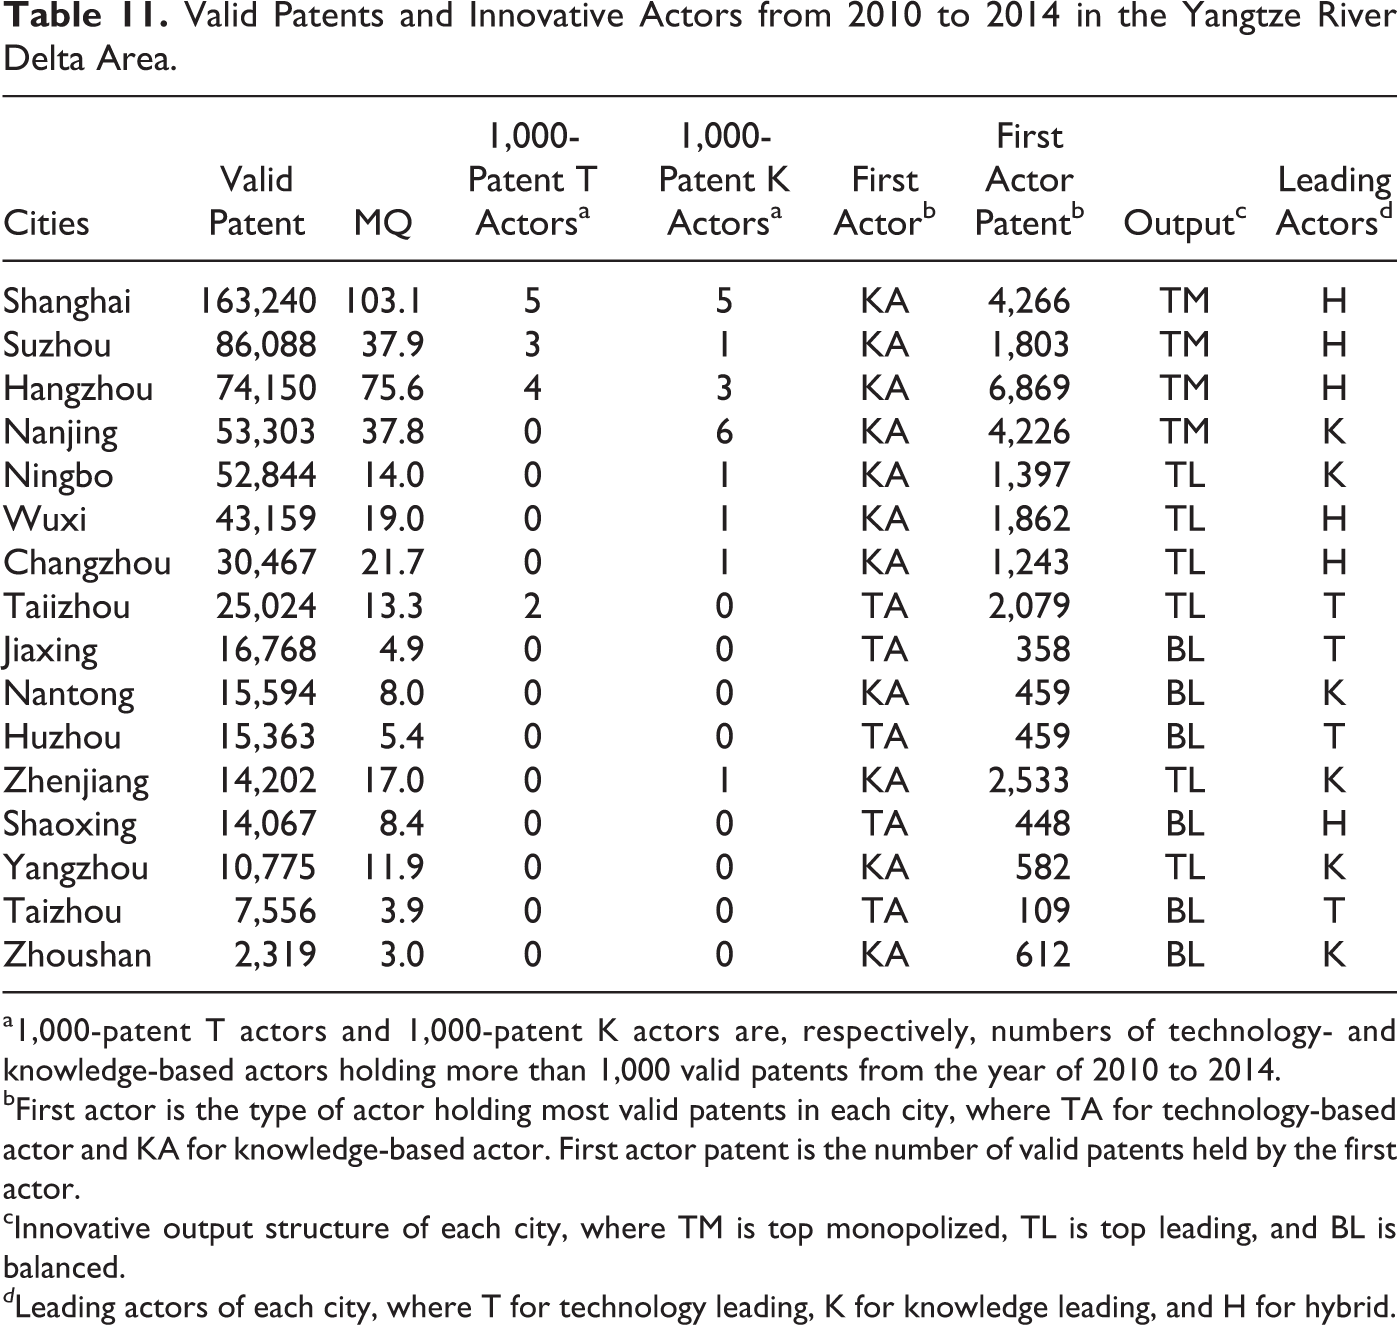
a1,000-patent T actors and 1,000-patent K actors are, respectively, numbers of technology- and knowledge-based actors holding more than 1,000 valid patents from the year of 2010 to 2014.
bFirst actor is the type of actor holding most valid patents in each city, where TA for technology-based actor and KA for knowledge-based actor. First actor patent is the number of valid patents held by the first actor.
cInnovative output structure of each city, where TM is top monopolized, TL is top leading, and BL is balanced.
d Leading actors of each city, where T for technology leading, K for knowledge leading, and H for hybrid.
The two features above are also supported by spatial evidence. By tracing the movement of the spatial center of different types of innovative actors and innovation output (the number of valid patents was used here), whether different types of innovative actors are more concentrated and which kind of innovative actors are more spatially correlated can be examined. Since the total number of universities in each city is quite small and does not obviously grow each year, we just use the data in the year of 2014 to calculate the gravity center in ArcGIS. Movement of centers of high-tech firms from 2008 to 2014 and centers of valid patents from 2010 to 2014 are portrayed in the same way. From 2010 to 2014, the centers of valid patents located near the center of universities and were getting closer to it each year. This spatially shows the importance of knowledge-based actors. During the 2008–2014 period, the center of total high-tech firms had a stable northern shift due to the rapid growth of high-tech firms in Jiangsu cities. Although no stable closing movement was observed, the center of high-tech firms did move closer to the center of universities in 2014 compared to that in 2008 (Figure 10).
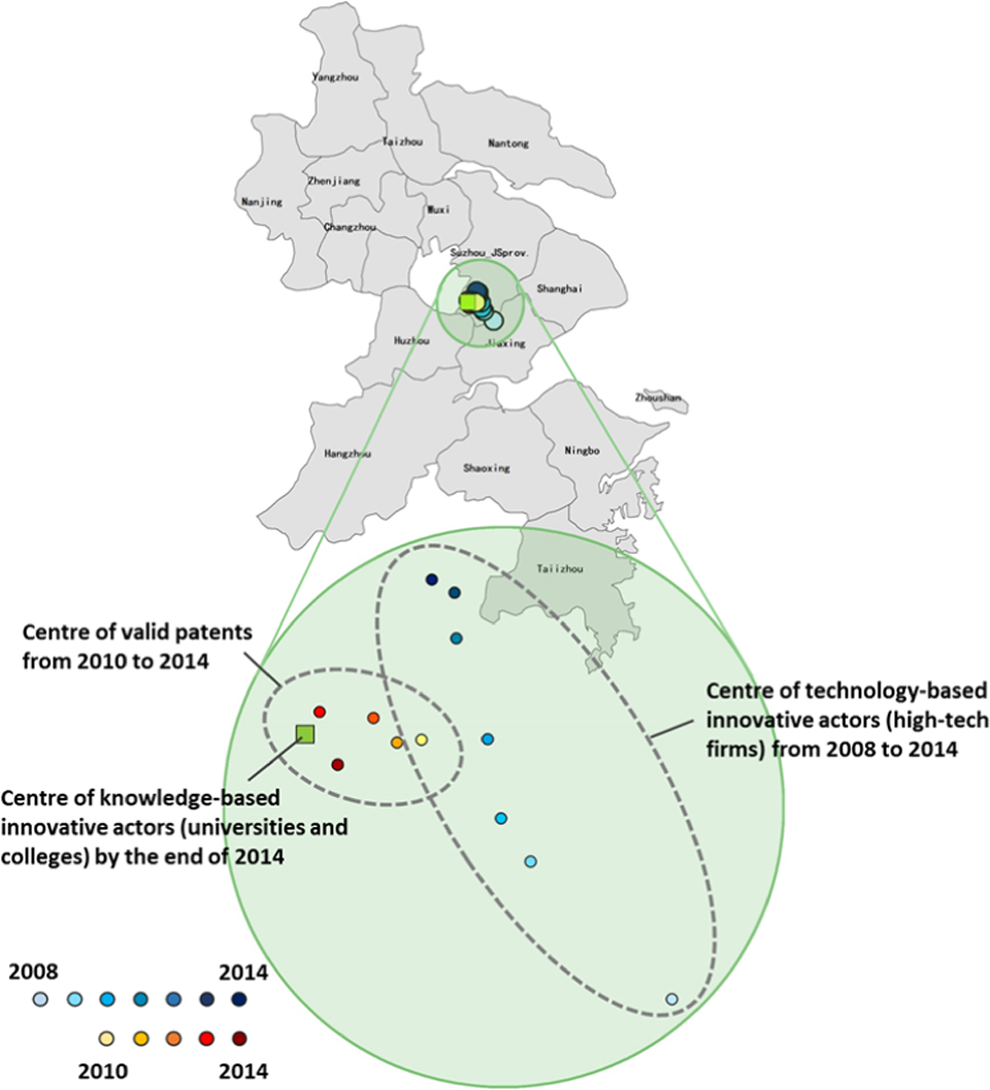
Center of technology-based (from 2008 to 2014) and knowledge-based (2014) innovative actors and valid patents (from 2010 to 2014).
Conclusions
Over the last decade, innovation has been one of the most frequently mentioned words in China, and innovation-driven development has been one of the national strategies. Facing the tremendous pressure of structural reform and cutting capacity, innovative cities and innovative metropolitan areas are put forward as not only a new hat for a city or a region but a new developing strategy and new policies. Chinese cities, especially those in big metropolitan areas, like Suzhou and Shenzhen, have seen a boom of innovative actors and innovative spaces. Knowing how these innovative actors and spaces emerge and agglomerate would be helpful when making innovation-encouraging policies.
Based on theories and research listed in this article, spatial agglomeration and performance of innovative actors have been examined and analyzed confirming the importance of geographical proximity and further substantiating and refining this proximity as spatial dependence between specific innovative actors in specific area—a metropolitan area. Technology-, knowledge-, and service-based innovative actors show similar features of spatial distribution except that technology-based actors are more concentrated. This could be partly demonstrated, as technology-based innovative actors (mainly high-tech firms) are more market-driven while knowledge- and service-based actors like universities and high-tech incubators are more policy-driven. Shanghai is no doubt the core city of the innovative system in the YRD area with about 30 percent of high-tech firms and universities and nearly 20 percent of high-tech incubators situated there. Some other cities like Suzhou and Wuxi also did well in attracting innovative actors, and Suzhou has replaced Shanghai as the fastest growing city measured by the number of high-tech firms from 2008 to 2014. Although these fast-growing cities and stably decreasing primacy index, Gini index, and CR show that the spatial distribution of innovative actors in the YRD area has a decentralizing trend, it is more possible that a multicenter system instead of a homogenous network would replace the current highly centralized hierarchy system and it would be a long period to achieve this.
Due to different roles innovative actors play in the process of innovation, innovative performance varies as the innovative actors of a city are mainly technology- or knowledge based. Generally, technology-based actors contribute more to the innovative output of a city since about 87 percent of patents are held by high-tech firms. However, the patents held by top ten innovative actors tell a different story. Our data show that leading actors are the main contributor to the innovative output of a city and for most cities in the YRD area, knowledge-based top actors contributed more. Meanwhile, hybrid and knowledge-leading cities in our category, defined by the average percentage of valid patents held by each kind of innovative actors and by a single actor, do perform better.
Geographical proximity between technology- and knowledge-based actors is important. Although knowledge-based actors hold more valid patents on average and contribute more to original innovation, technology-based actors provide sustainable innovative growth of a city by playing a different role and collaborating with knowledge-based actors on innovation value chain. In the long term, it is an effective way to invest in the top actors (especially those knowledge-based ones) to promote the original innovative capacity of a city, while the sustainable and stable growth in innovation depends on attracting more different kinds of innovative actors spatially agglomerate so that more innovative actors can promote their innovative capacity by sharing knowledge and cooperating with each other.
Research institutes and service-based actors are also important innovative actors that have not been analyzed in detail due to data deficiency. Geographical proximity is important not only in metropolitan level but also in city level. It can also be better observed within a city, as high-tech firms tend to agglomerate in or near university town in many countries, especially those central cities in a metropolitan area with various universities, colleges, and research institutes. Unfortunately, because of the lack of comprehensive data, research at this level has not been processed in this article.
Footnotes
Declaration of Conflicting Interests
The author(s) declared no potential conflicts of interest with respect to the research, authorship, and/or publication of this article.
Funding
The author(s) disclosed receipt of the following financial support for the research, authorship, and/or publication of this article: This project is funded by the National Key Funding for Social Science (No. 12AZD100, Research on Path Design and Planning Control for the Development of Innovative Metropolitan Area in China) and Fiscal 2013 Southeast University Basic Researching Funding (Social Sciences) Key Research Program (No. SKYD20130016).