
Abstract
Eco-efficiency measures if economic growth and environmental protection are effectively balanced. To understand the path of green urban growth in China, this article examines the converging patterns of eco-efficiency for 191 Chinese cities within 2003 and 2013. Two types of modified Data Envelopment Analysis (DEA) methods and spatial modeling approach are adopted in empirical analyses, with cities grouped based on three types of heterogeneities that facilitate the formation of potential convergence clubs. We find that major Chinese cities are β-converging in their eco-efficiency scores and are forming place-based convergence clubs in terms of geographical location, environmental policy, and resource endowments. Less efficient clubs are converging at a faster speed toward low-level steady states, while more efficient clubs are reaching separate high-level equilibria with relatively slow rates and longer half-life. We further raise corresponding policy implications that aim at retarding or reversing the ongoing trend of eco-efficiency deterioration.
Introduction
Pathway toward sustainable urban development necessitates economic growth and environmental preservation to be effectively balanced. With thirty years of rapid industrialization and urbanization, contemporary Chinese cities are being haunted by ecological and environmental degradation. The average number of harmful smoggy days in Chinese cities reached thirty-seven in 2013, which was the highest recorded value since 1961. 1 Meanwhile, over 90 percent of the urban aquatic system has been contaminated and 50 percent of the urban potable water fails to meet the national safety standard. Recognizing that over fifty-three percent of China’s population resides in urban areas, and modern cities are to make economic activities more efficient while improving the quality of life, the Chinese central government set the construction of “green and sustainable cities” as a key objective in the national “New-Type Urbanization Plan (2014–2020)”.
As the constituent parts of the general nationwide plan, specific regional policies on green urban growth should be established on the understanding of interregional and intercity differences, particularly for a large and geographically heterogeneous economy like China. Whether the observed socioeconomic gaps converge, perpetuate, or diverge over time can profoundly affect the intensity of government intervention and the enactment of related public policies (Sala-i-Martin 1996). In this study, we focus our investigation on the indicator of eco-efficiency that links economic output with environmental impacts. With the concept dating back to Schaltegger and Sturm (1990) and being formalized by the 1992 World Business Council for Sustainable Development (WBCSD) report, eco-efficiency is achieved by optimizing economic outputs while minimizing the environmental and ecological impact of associated economic activities. Conventional approach using single pollutant or pollution intensity (with output treated as a measure of scale) tends to ignore the fact that pollution is a by-product of manufacturing activities (Zaim 2004), we hence recognize eco-efficiency to be a more appropriate indicator when the underlying production process should be given full consideration, especially in a heavily growth-oriented developing country like China.
To formally address the interregional and interurban dynamics of eco-efficiency gap in China, we build our analyses in this study on a convergence perspective that delineates the distributional change of eco-efficiency and examines whether environmental degradation can be maintained at a steady state level while the economy grows consistently. More specifically, we test whether China’s city-level eco-efficiency is β-converging in both absolute and conditional sense, to uncover how likely low-efficiency cities and regions are catching up with high-efficiency ones. 2 Our study further investigates whether some convergence clubs exist based on group-level heterogeneities and how fast are the identified converging processes. Unraveling the β-converging patterns of eco-efficiency and why a desirable steady state remains unrealized in a developing country like China can generate useful implications that contribute to the policy design of sustainable urban growth strategy, both on the industrial-production side and on the environmental-protection side.
The bulk of existing environmental and ecological studies on β-convergence examines single pollutant at country level. Aldy (2006) and Van (2005) confirm the existence of a negative growth-level relationship of CO2 emissions across different US regions. Romero-Avila (2008) and Jobert, Karanfil, and Tykhonenko (2010) report evidence of conditional β-convergence in CO2 emissions among the Organisation for Economic Co-operation and Development (OECD) countries during the last four decades. Instead of reaching a unique steady point, economies are constantly observed converging to multiple local stable equilibria that form clusters. This type of “club convergence,” which suggests that economic entities approach to each other only when both their structural and initial conditions are similar, appears to be more empirically appropriate, when interpreting the multiple steady-state phenomena such as polarization and clustering (Galor 1992, 1996; Quah 1997). Panopoulou and Pantelidis (2009) find that the CO2 emissions of 128 countries were converging separately to a high-emission club and a low-emission one between 1960 and 2003. Camarero, Picazo-Tadeo, and Tamarit (2013) report OECD countries that are heterogeneous in their initial economic conditions formed five eco-efficiency convergence clubs within 1980 and 2008. 3 Several region-level and province-level studies on China’s energy and operational efficiency emerge in recent years (Pan, Liu, and Peng 2015; Jaunky and Zhang 2016). Some recent studies provide further evidence specifically on the convergence facts on eco-efficiency. Nežinský (2015) reports convergence of eco-efficiency in European Union countries within the time period of 2000 to 2010, while Long, Zhao, and Cheng (2015) find eco-efficiency in China’s cement manufacturers converged in the East, Middle, and West region for the past two decades.
Regarding studies on Data Envelopment Analysis (DEA)-generated eco-efficiency per se, Korhonen and Luptacik (2004) and Kuosmanen and Kortelainen (2005) produce some the first research on measuring eco-efficiency of industrial production based on DEA approach. A variety of subsequent studies apply the DEA method in generating eco-efficiency in different sectors, electric and electronic appliances (Barbagutiérrez, Adensodíaz, and Lozano 2009) and agriculture (Picazo-Tadeo, Gómez-Limón, and Reig-Martínez 2011). Hua, Bian, and Liang (2007) conduct one of the first DEA-generated eco-efficiency analyses in China, focusing on paper mills along the Huai River. Zhang et al. (2008) does a relative widespread provincial-level eco-efficiency study among China’s industrial system, while research quantifying eco-efficiency on specific industries also emerge in recent years, with studies on pesticides (Zhu, Wang, and Zhang 2014) and coal-fired power plants (Liu et al. 2017) being two examples. Wu et al. (2016) provide some updated improvements on evaluating eco-efficiency based on a “two-subsystem” DEA approach that accounts for short-term and long-term interests.
This study contributes to the literature by first discussing the city-level convergence patterns of eco-efficiency that reflect if less efficient cities are catching up with more efficient ones, if more efficient cities are regressing to mediocrity, and how fast are these convergences taking place. A concomitant contribution is the introduction of city-level eco-efficiency scores in China using two modified DEA models that incorporate meta-frontier technique, super efficiency, undesirable outputs, and slack-based measure. The article further adds to the literature by investigating convergence clubs divided by geographical location, initial resource endowments, and environmental policy shocks, which directly leads to place-based policy implications. Findings suggest the existence of nontrivial absolute and conditional β-convergences toward heterogeneous steady points, characterized by different levels and convergence speeds of eco-efficiency in urban China. Policy implications are raised for the three identified low-efficiency city clubs under the classic analytical framework proposed by Barro and Sala-i-Martin (1992) and Sala-i-Martin (1996). While candidate policy instruments can aim at alleviating diminishing returns to capital, facilitating capital and labor mobility, improving diffusion of clean technology, and rearranging government subsidy, we argue that the actual policy implementation should be region-specific or even city-specific, taking socioeconomic conditions into full consideration.
The next section demonstrates the construction of DEA-based eco-efficiency scores and presents the empirical convergence models. We then arrange a section to introduce the adopted data set, variables, and estimation strategy. Detailed empirical findings are presented in the “Empirical Results” section, followed by a section that discusses the underlying mechanisms of identified convergence patterns. Concluding remarks are given in the last section.
Measuring Eco-efficiency and Modeling Convergence
Derivation of DEA Measurements
The method of DEA has been pervasively accepted as a nonparametric approach to measure input–output efficiency of comparable decision-making units (DMUs) since the pioneer work by Charnes, Cooper, and Rhodes (1978). Inchoate DEA models use radial efficiency measures that adjust the improvements of inputs and outputs proportionately for the evaluated DMUs to reach the efficiency frontier. By acknowledging that slack-ignorant radial models tend to overestimate energy efficiency, Tone (2001, 2004) introduces the nonradial slacks-based measure (SBM) model to treat the relevant improvements nonproportionally with slacks. An important variant of SBM, the U-SBM, further allows undesirable outputs (such as pollutants) to be differentiated from desirable outputs in linear programming, raising the discriminating power of DEA methods (Zhou, Ang, and Poh 2008). Another issue is that DMUs on the frontier have the same efficiency of 100 percent in basic DEA models, making them identically ranked and indistinguishable from each other. This problem can be amplified when panel data are used, by masking the fact that the efficiency level of a frontier DMU is capped at 100 percent in each time period, while the true efficiency growth of that DMU remains serially unidentified. Andersen and Petersen (1993) proposed the super efficiency model to effectively differentiate the DMUs located on the frontier, a method that is further developed into the super SBM (S-SBM) by Tone (2002) through combination of the super efficiency model and the SBM. Huang et al. (2014) proposed a comprehensive eco-efficiency measure that combines global benchmark technology, undesirable output, super efficiency, and slacks-based measure.
Traditional DEA models are constructed under the assumption that all studied DMUs adopt homogenous production technology. Production function, however, can differ significantly by DMU, leading to biased estimates of eco-efficiency score if such idiosyncrasy is omitted. To overcome this problem, the meta-frontier approach is introduced by explicitly incorporating technological heterogeneities (Battese, Rao, and O’Donnell 2004; Zhang, Kong, and Yu 2015). DMUs are divided into groups according to the sources of technological heterogeneity such as regional endowments, market barriers, and policy interventions. Groupwise frontiers are subsequently computed and the meta-frontier is obtained through enveloping each frontier (Wang et al. 2013).
Built on the merits of these well-established improvements, we propose a novel DEA model labeled Meta-US-SBM (meta-frontier super SBM model considering undesirable outputs) that comprehensively combines S-SBM, U-SBM, and meta-frontier models. The new model yields a measurement of eco-efficiency that explicitly treats industrial pollutants as undesirable outputs and is inter-entity comparable and serially identifiable for all DMUs. One concern is that the Meta-US-SBM chooses a projection for the assessed DMU that is at the maximum distance to the frontier, which may lead to underestimation of the eco-efficiency. We hence adopt an alternative method known as the minimum distance to the weak efficiency frontier (Meta-US-MinDW) to remeasure the eco-efficiency of the DMUs (Chen 2014). In contrast to the SBM model, the MinDW model assesses the DMUs with minimum distance to the frontier. These two measurements can be regarded as bracketing the true efficiency score for a certain DMU (see Appendices A and B for mathematical derivation).
Empirical Models
Stemming from the seminal works by Barro (1991) and Mankiw, Romer, and Weil (1992), the notion of β-convergence has been categorized into absolute (or unconditional) β-convergence and conditional β-convergence. The former suggests economies are reaching an identical long-run equilibrium independent of their demographical, technological, governmental, and environmental characteristics, while the later captures the inter-entity heterogeneities by controlling for the aforementioned set of structural conditions that differ by country, region, or city (Barro 2015). We first setup the following univariate model to test for absolute β-convergence of eco-efficiency, in line with Barro and Sala-i-Martin (1992) and Borozan (2017):

where EE it denotes the DEA-generated eco-efficiency score of city i at year t, and EEit−1 stands for the initial level of eco-efficiency. Absolute β-convergence for eco-efficiency exists by definition, if 0 < βu < 1. 4
To test for conditional β-convergence, the model is modified by holding constant a set of additional variables:

where X is a vector that encompasses control variables that are both time-varying and entity-varying. δ
i
represents city fixed effects that hold unobserved time-invariant confounders constant. We also include province-specific year fixed effects ω
k
τ
t
to account for potential region-wide trends in the dynamics of eco-efficiency change or the varying awareness of environmental protection at provincial level. Analogous to absolute convergence, an estimate of βc that lies between 0 and 1 reveals the existence of conditional β-convergence for eco-efficiency. The speed λ at which the eco-efficiency of a city approaches the steady state is defined by
Given the nature of spatial spillover associated with air and water pollutants, and the possibility that population, income, industrial structure, and environmental regulation can be locationally dependent, we rely on spatial econometric modeling to capture the potential endogenous and exogenous interaction effects. 5 Model 2 is thus extended to incorporate a spatial lag of eco-efficiency scores to form a dynamic spatial autoregressive (SAR) model:
With spatial lags of the control variables added, we further estimate a dynamic spatial Durbin model (SDM), which is the least restrictive dynamic spatial panel model suggested by Elhorst (2015): 6
βSAR and βSDM remain to be the coefficients of interest that reveal conditional convergence. In the spatial models, terms

where the weights are set to be increasing with population of the neighbors (denoted by Pop jt ) and decreasing with geographical distance between two cities (denoted by Dij). We set a cutoff as 300 kilometers to ignore the “remote neighbors” with feeble influences, as suggested by Lesage (2014). Border-based weight matrices are not considered given the nonadjacent nature of locational distribution of cities.
Variables, Data, and Estimation Strategy
Inputs, Outputs, and Controls
Input and output indicators should be determined before conducting DEA analysis. We consider the conventional production function by inserting labor input (measured by total urban employment), land input (measured by urban land area), capital input (measured by capital stock), and energy input (measured by primary energy consumption). We select Consumer Price Index–deflated gross domestic product (GDP) to represent desirable output and the emission of CO2, SO2, industrial soot, and waste water as indicators of undesirable outputs. These pollutants, generated by both stationary and mobile sources, contaminate modern Chinese cities and create major health issues.
Control variables in the conditional convergence models are determined based on a broadly employed analytic framework when studying the impact of anthropogenic activities on environment, named IPAT (Stern, Young, and Druckman 1992). This identity specifies that environmental quality (I) are impacted by population (P), affluence (A), and technology (T). Since the IPAT formula does not permit hypothesis testing per se, its stochastic version STIRPAT (stochastic impacts by regression on population, influence, and technology) proposed by Dietz and Rosa (1994) is used to empirically obtain the estimates of associated parameters. The STIRPAT model takes the form:

where I, P, A, and T stands for environmental quality, population, affluence, and technology, respectively. e is the error term while a scales the model. The STIRPAT model can be slightly modified to suit the different needs (Dietz and Rosa 1997; York, Rosa, and Dietz 2003). In this study, we incorporate registered urban population (people with urban hukou) as a demographic measurement. We use average annual wage to represent the affluence of urban residents. The percentage of GDP generated by the (manufacturing) industry is adopted as a major indicator of urban economic structure. We also include the removal rate of SO2 as a proxy for the intensity of urban-level environmental regulation and pollution alleviating technology.
Data and Estimation Strategy
Data used in this study come from China City Statistical Yearbook, China Energy Statistical Yearbook, and China Environment Yearbook, except for two variables associated with DEA input. Data for city-level capital stock are contributed by Ke and Xiang (2012) based on a perpetual inventory approach. 7 Data for energy consumption are calculated based on energy intensity statistics achieved from government reports or provincial statistic yearbooks. The energy intensity statistics are multiplied by city-level GDP at corresponding current prices to derive total primary energy consumption. A panel of 191 Chinese prefecture-level cities within the period of 2003 to 2013 forms our sample. 8
Alongside a full sample analysis, we build some place-based subsample analyses on three types of heterogeneities, that is, geographical location, governmental intervention, and resource endowments. 9 The coastal cities in China were the first beneficiaries of the “Reform and Opening-up” strategy initiated in 1978 and have been developing disproportionately relative to the inland area ever since. Economic and sociological gap between coastal and inland China remains huge with certain covariates uncontrolled for by our models, such as infrastructure, social capital, creativeness, entrepreneurship, institutional environment, and migration patterns. The sample is thus divided geographically into coastal region and inland region to draw empirical inference separately for these two regions. Specifically, we categorize northeastern China (Liaoning Province, Jilin Province and Heilongjiang Province) into inland area instead of coastal (eastern) area, given the fact that the northeast region is observationally a low-efficiency area that highly resembles the inland area in terms of the aforementioned factors.
Starting in the mid-1990s, China’s Ministry of Environmental Protection designated forty-six cities to be “Key Environmental Protection (KEP)” cities, and this number has increased to 113 by 2013. These KEP cities are subject to more restrictive environmental and ecological regimes than nonKEP cities in terms of pollution abatement, ecoreserve construction, and environmental quality disclosure. The sample is hence divided based on whether a city currently belongs to or was once specified as a KEP city, to account more explicitly for institution-specific policies and regulations associated with environmental protection.
The last categorization pertains to the notion of resource-based (RB) city that has been widely recognized by local authorities at municipal level well before the official confirmation by the central government. 10 RB cities are those with their dominating industries rely intensively on the exploitation or processing of local natural resources (forests, coal mine, gas, oil, ferrous, and nonferrous metals). For the purpose of distinguishing between cities that differ significantly by their initial natural endowments, the sample is classified into 78 RB cities and 113 nonRB cities.
To estimate the dynamic panel models, we adopt the system generalized method of moment (GMM) proposed by Arellano and Bover (1995) and Blundell and Bond (1998). Specifically for the spatial models (SAR and SDM), Kukenova and Monteiro (2009) and Jacobs et al (2009) validated that estimators produced by spatial MLE, spatial dynamic MLE, spatial dynamic quasi-MLE, and the Arellano–Bond difference GMM are all outperformed by the system GMM estimator, which corrects for potential endogeneity of spatial lagged terms and other regressors through instrumenting the endogenous variables. 11 System GMM is also proved to be more computationally efficient, more resilient to the notorious weak instrument problem, and produces heteroskedasticity and autocorrelation-consistent standard errors.
Empirical Results
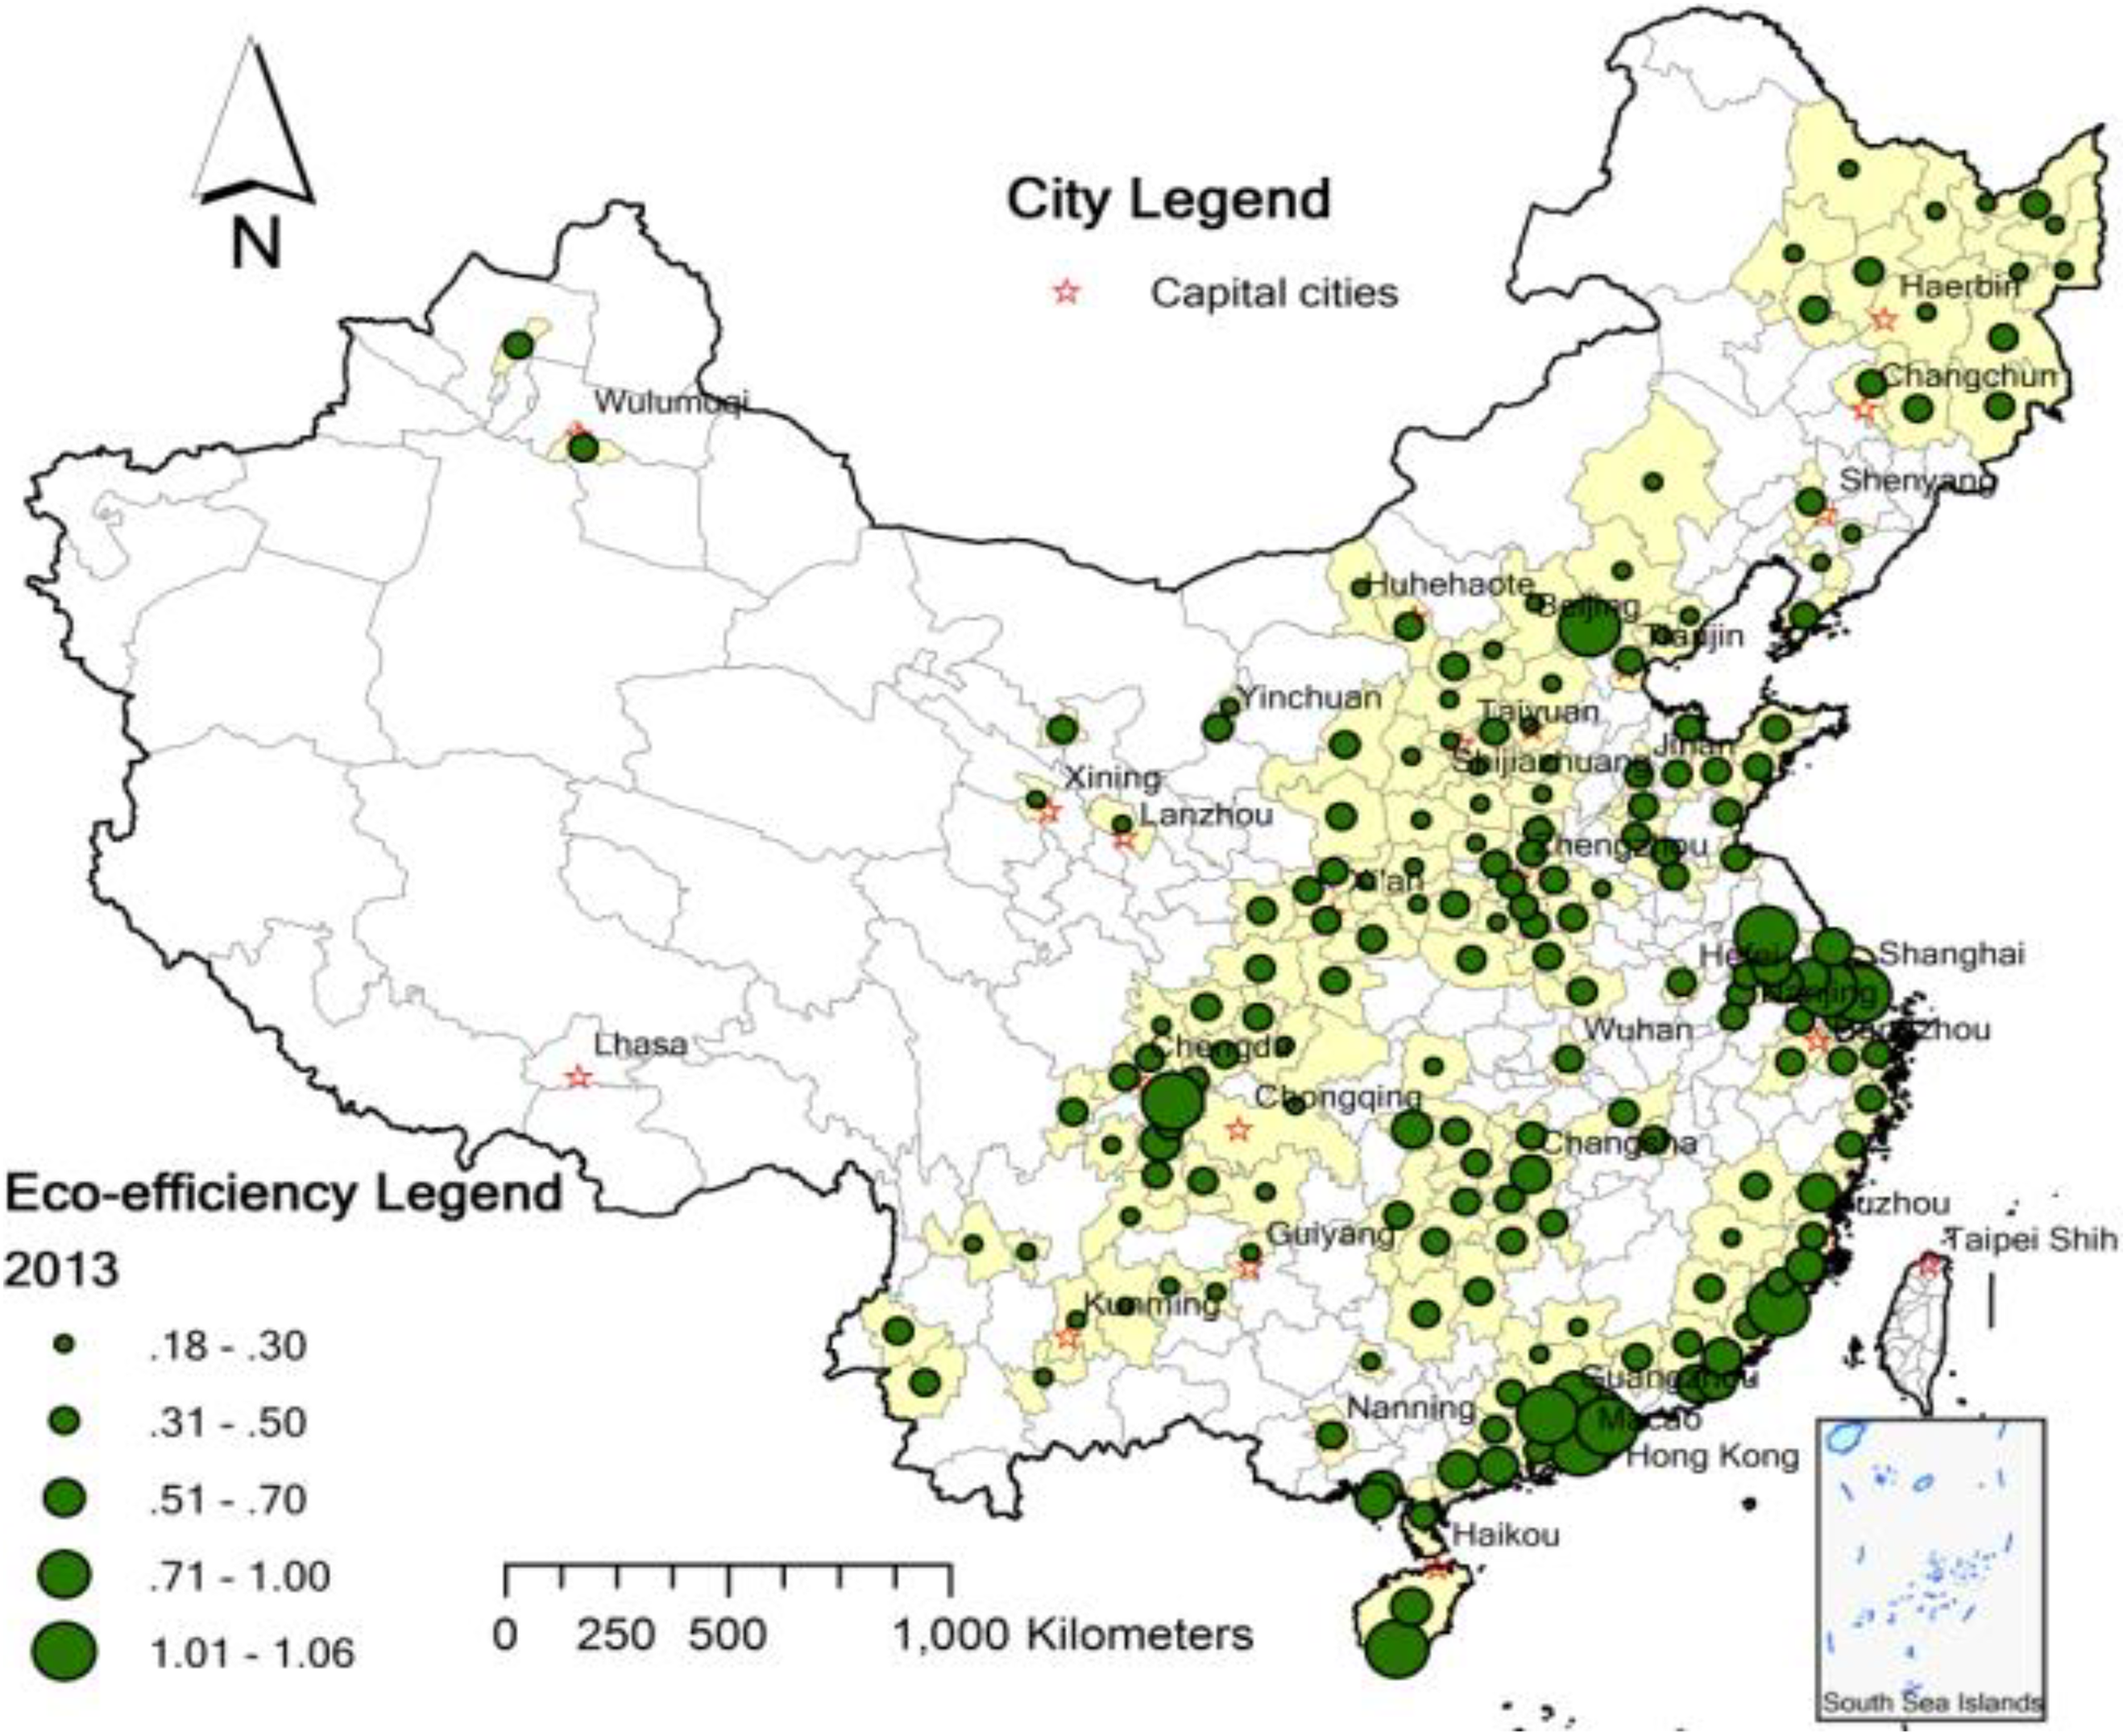
Descriptive Statistics
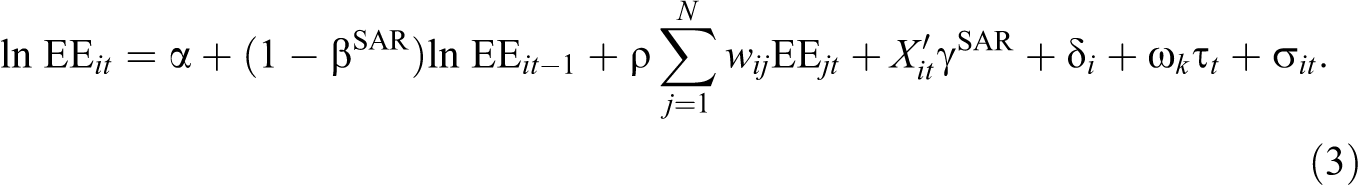
We plot the locational distribution of the city-level eco-efficiency scores for 2003 and 2013, respectively, on Figures and 2, generated by Meta-US-SBM technique. A joint examination of the two figures displays that eastern cities including Shanghai, Hefei, Nanjing, and Hangzhou are forming a high-efficiency cluster at the Yangtze River Delta while Guangzhou, Shenzhen, Hongkong, and Macao are emerging as another cluster at the Pearl River Delta. The consecutive pattern of the distribution of high-efficiency cities along the coastline in 2003 vanished over this period, with a deterioration of eco-efficiency in cities like Fuzhou, Wenzhou, and Shantou. Overall, eastern China remains to be a high-efficiency area while circumstance of the inland China appears to be frustrating. At least three high-efficiency clusters can be identified in 2003, namely, the northeastern region (Heilongjiang and Jilin), the north-central region (Henan and Shanxi), and the southwestern region (Sichuan). By 2013, however, high-efficiency cities almost died out and these clusters disappeared. While these two maps reveal the geographical redistribution of eco-efficiency scores among major Chinese cities within the studied period, the underlying dynamics of the converging process are yet to be quantitatively tested. Table 1 presents the descriptive statistics of the two DEA-based eco-efficiency scores and variables that enter the subsequent convergence analyses.
Descriptive Statistics.
Note: For certain cities like Ma-anshan (Anhui), Changzhi (Shanxi), and Shijiazhuang (Hebei), the wage data of certain years deviate significantly from reality. We replace these erroneous wage data with the average yearly wage of the city’s three nearest within-province neighbors. SE = standard error; EE = eco-efficiency; Meta-US-SBM = meta-frontier super SBM model considering undesirable outputs; Meta-US-MinDW = minimum distance to the weak-efficiency frontier; GDP = gross domestic product; KEP = Key Environmental Protection; RB = resource based.
It is illustrated that the average eco-efficiency score obtained by Meta-US-SBM (0.399) is 17.5 percent lower than the average eco-efficiency score generated by Meta-US-MinDW (0.485) with a positive correlation of 0.88, which is consistent with the predicted “bracketing” proposition. Registered urban population averaged at 4.7 million, equivalent of the population size of a large city in China that monotonically expands. Annual personal wage for urban residents is 27,000 Chinese Yuan (US$4,264 in 2013). In terms of sample division, we end up with 22percent eastern cities and 78 percent inland (including northeastern) cities. Fifty-nine percent of the sample currently belongs to or has once been designated as a KEP city. Forty-one percent of the studied cities are RB cities.
Full Sample Results
In accordance with the empirical specifications, we present estimation results for both the absolute and conditional convergence of eco-efficiency scores. Table 2 reports estimates associated with eco-efficiency scores generated by Meta-US-SBM. Column 1 shows the existence of absolute β-convergence in eco-efficiency with the presence of a statistical significant estimate of the lagged dependent variable, indicating low-efficiency cities and high-efficiency cities might be converging to a single steady state regardless of their initial conditions. Nevertheless, as demonstrated in Figures 1 and 2, city-level eco-efficiency in China was by no means converging to a unique equilibrium over the time interval of 2003 to 2013. It could also be improper to defend that an unconditional steady level is to be reached for all agents in any foreseeable future, given the systematic and substantial differences among the studied cities. While absolute β-convergence portrays an empirically unrealistic picture for the case of China, it sheds some lights on the general trend of convergence instead of divergence or a persistent gap.
Full Sample Results based on Meta-US-SBM.

Note: Spatial models 3, 4, and 5 pass the Wald test for overall fit, the AR 2 test for serial correlation, and the Sargan test for overidentification. Robust t values and z values are in parentheses with standard errors clustered at city level. FE = fixed effects; GDP = gross domestic product; Meta-US-SBM = meta-frontier super SBM model considering undesirable outputs.
*p < .1.
**p < .05.
***p < .01.

Eco-efficiency of the studied cities in 2003, based on Meta-US-SBM.
Eco-efficiency of the studied cities in 2013, based on Meta-US-SBM.
Column 2 presents the plain-ordinary least squares (OLS) results for conditional convergence with STIRPAT-type controls. Eco-efficiency scores are identified to be β-converging with the coefficient of interest being 0.768 and statistically significant at 1 percent level. Column 3 reestimates model 2 using system GMM and finds a slightly higher convergence coefficient of 0.808. Column 4 shows the virtually unchanged result of direct effects for the SAR setting. The trivial and insignificant spatial lag estimate suggests that endogenous spatial interaction of eco-efficiency is unlikely to be operating, given the locational dispersion of the prefectures and idiosyncrasies between certain types of cities. The SDM direct-effect estimates in column 5 confirm the nonexistence of the endogenous interaction effect, but revealed some exogenous interaction effects associated with economic structure and environmental regulation. Personal affluence measured by salary is found to be positively associated with eco-efficiency, possibly reflecting a sorting process that wealthier households tend to reside in cleaner cities where industries pay more to high-skilled workers.
Table 3 presents the results using eco-efficiency scores generated by the Meta-US-MinDW process. Relative to the results in Table 2, we obtain increased estimates from a set of larger eco-efficiency scores, especially under two specifications with spatial lags. The absolute and conditional β-convergences are robustly identified, albeit with lower convergence rates. 12 Under both DEA methods, our results coincide with the statement in Sala-i-Martin (1996) that for regional data sets, the estimates of β-convergence do not differ substantially across absolute and conditional specifications. Analogous to the absolute convergence results, it should be noted that the overall conditional convergence coefficients might not be representing the existence of a catching-up process toward one single equilibrium, given the descriptive evidence in Figures 1 and 2. We hence attempt to disentangle the more interpretable group-wise trends of conditional convergence through the following subsample analysis based on exogenous heterogeneities. 13
Full Sample Results based on Meta-US-MinDW.
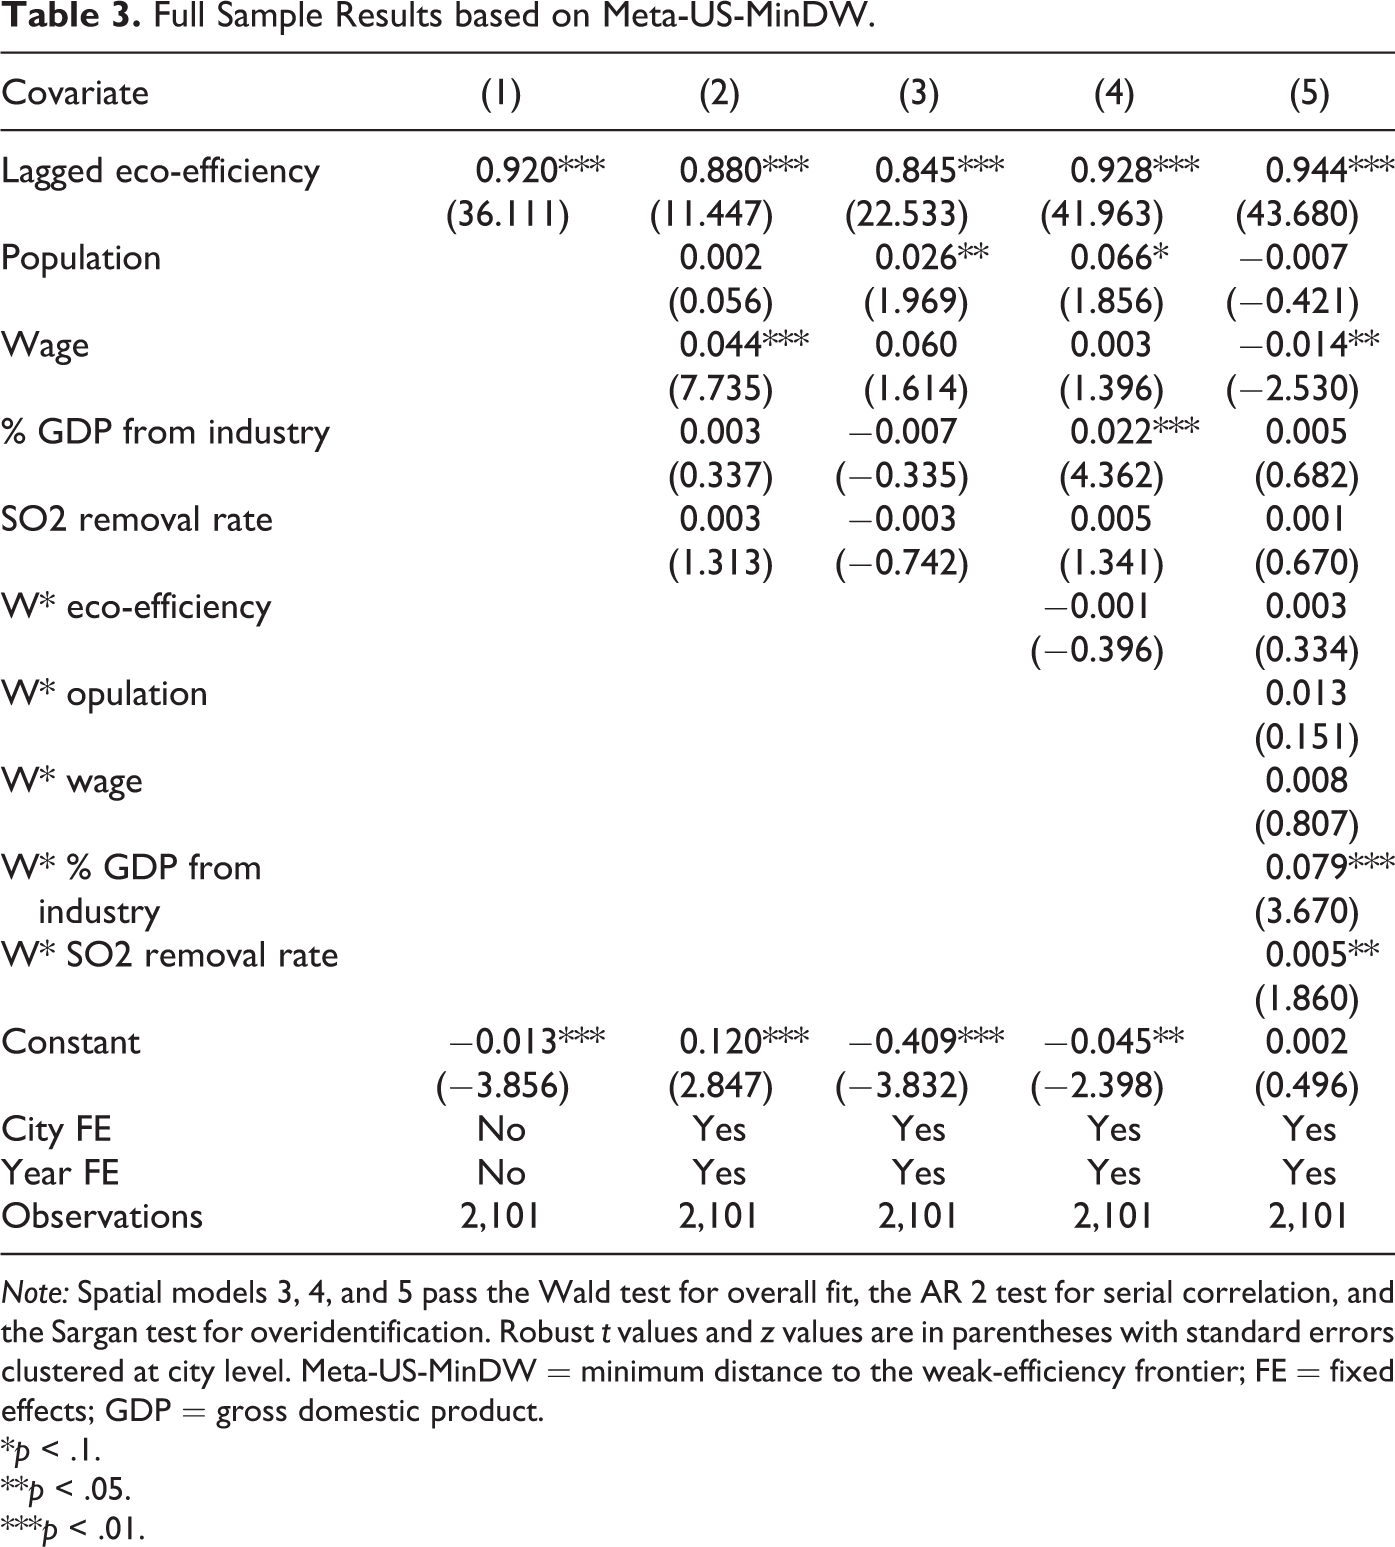
Note: Spatial models 3, 4, and 5 pass the Wald test for overall fit, the AR 2 test for serial correlation, and the Sargan test for overidentification. Robust t values and z values are in parentheses with standard errors clustered at city level. Meta-US-MinDW = minimum distance to the weak-efficiency frontier; FE = fixed effects; GDP = gross domestic product.
*p < .1.
**p < .05.
***p < .01.
Subsample Results
We report our group-specific conditional results in Tables 4 and 5 using Meta-US-SBM-generated scores and Meta-US-MinDW-generated scores, respectively. Columns 1 2 in both tables show that the forty-one coastal cities are indeed β-converging. The 150 inland cities are simultaneously converging, but to a relatively low-efficiency level as revealed by Figures 1 and 2. Columns 3 and 4 show the β-converging process of eco-efficiency for both KEP cities and nonKEP ones. Once again we observe dichotomous equilibrium states, with the average eco-efficiency score of KEP cities and nonKEP cities being 0.41 and 0.32 in 2013, respectively. As presented in columns 5 and 6 of both tables, RB cities and non-RB ones are likewise experiencing conditional β-convergence toward their own steady states. Noting that the average eco-efficiency score of RB cities is 0.31 in 2013, much lower than the reported level of 0.46 for nonRB cities, it should be concluded that the RB cities are forming another less efficient club.
Subsample Results based on Meta-US-SBM.
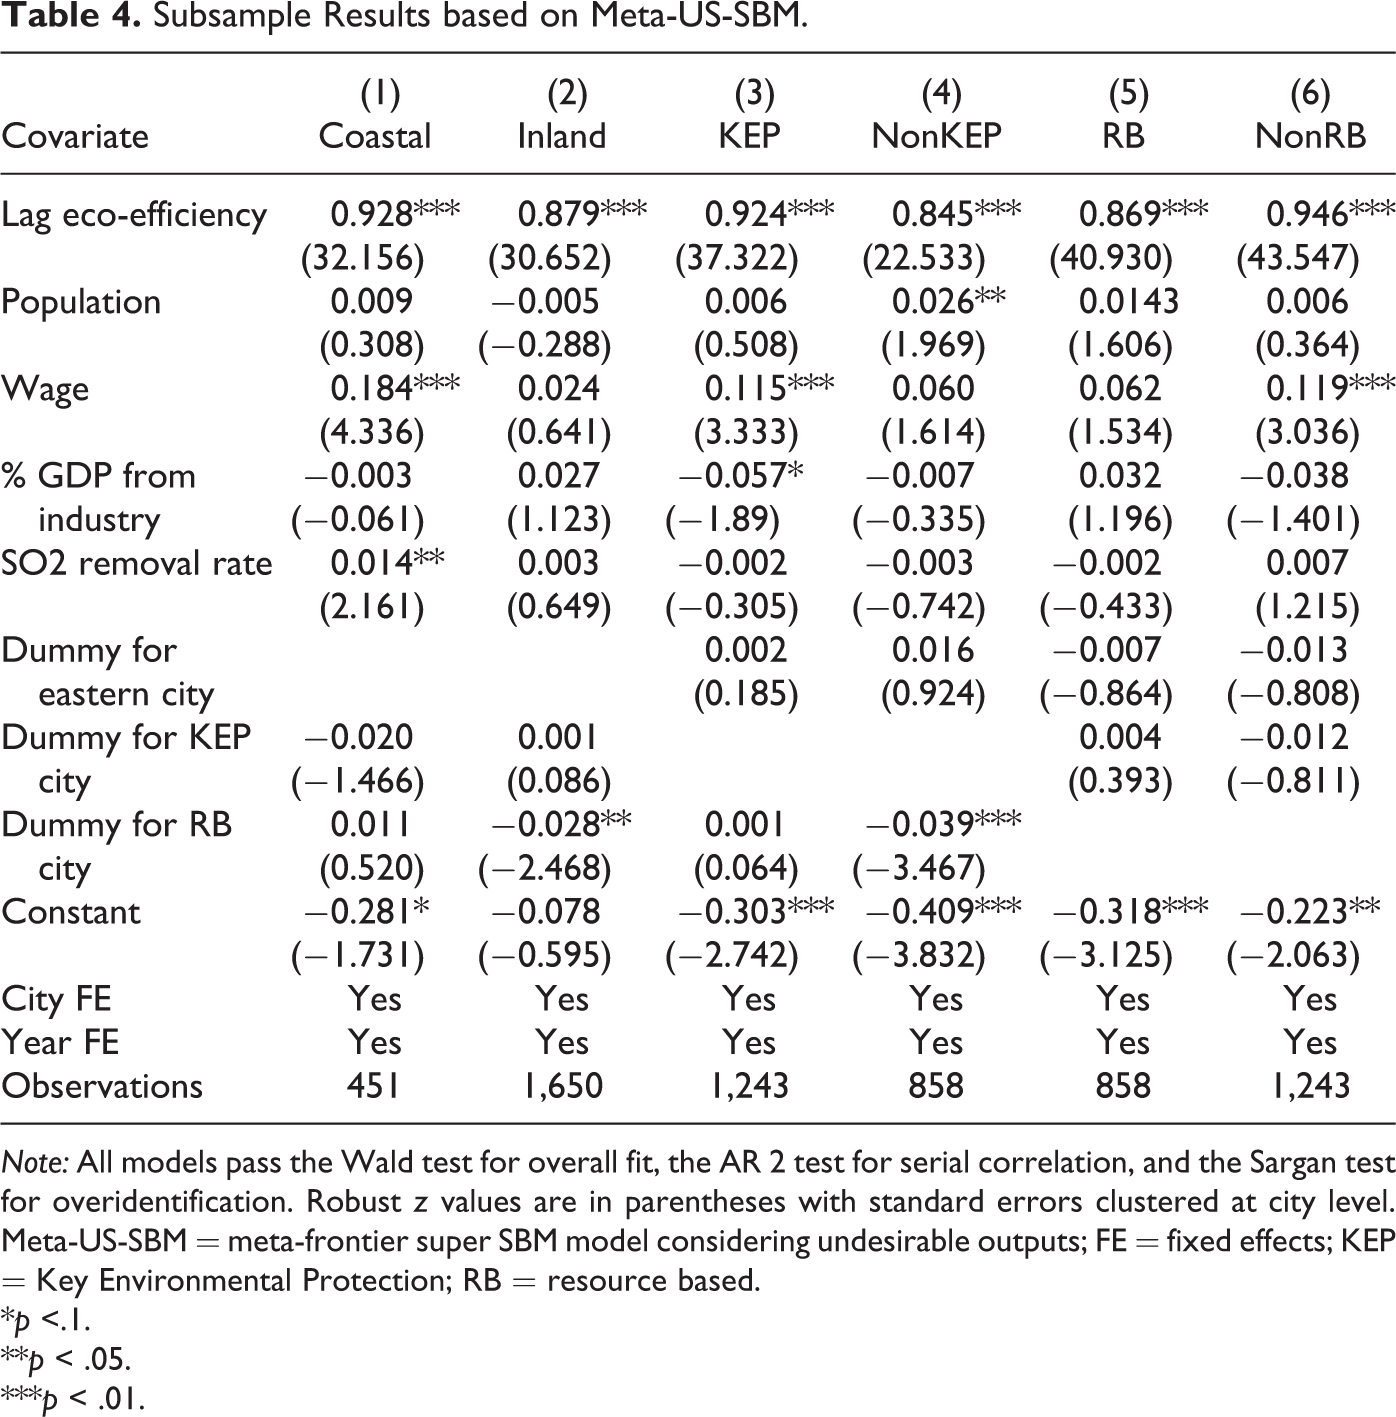
Note: All models pass the Wald test for overall fit, the AR 2 test for serial correlation, and the Sargan test for overidentification. Robust z values are in parentheses with standard errors clustered at city level. Meta-US-SBM = meta-frontier super SBM model considering undesirable outputs; FE = fixed effects; KEP = Key Environmental Protection; RB = resource based.
*p <.1.
**p < .05.
***p < .01.
Subsample Results based on Meta-US-MinDW.
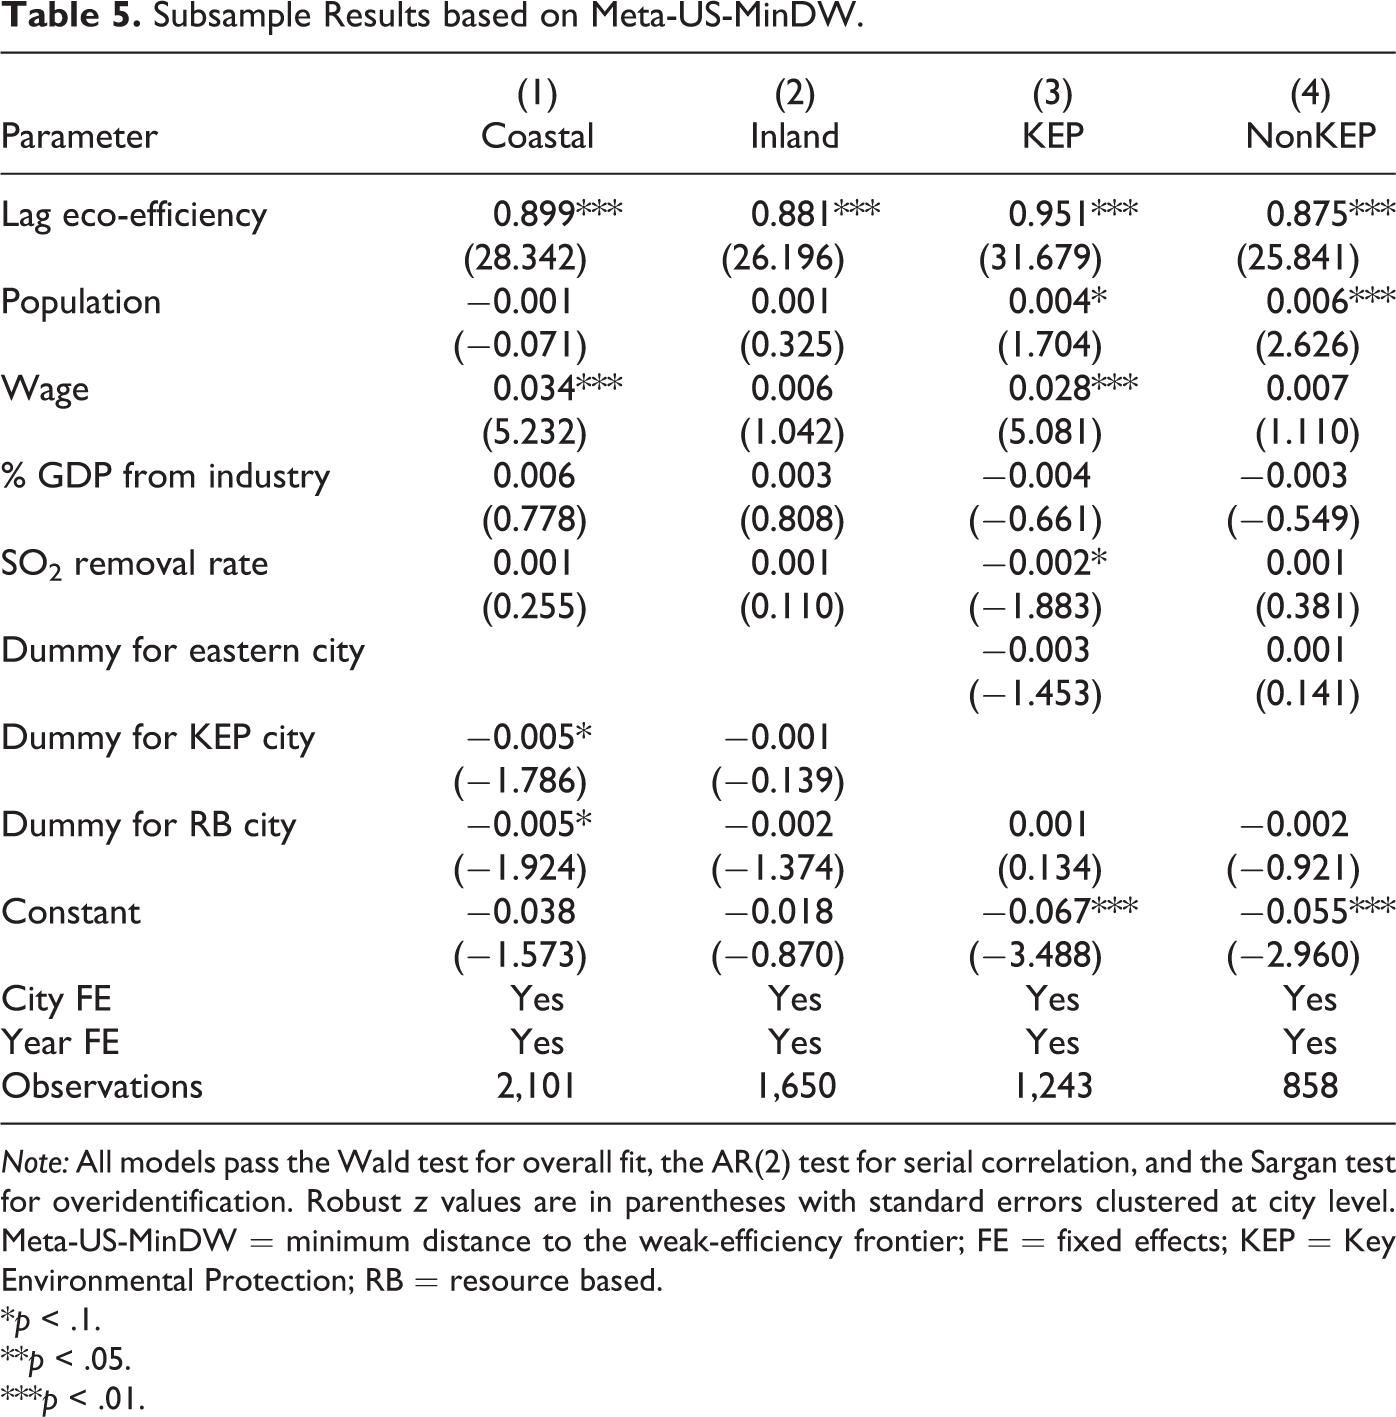
Note: All models pass the Wald test for overall fit, the AR(2) test for serial correlation, and the Sargan test for overidentification. Robust z values are in parentheses with standard errors clustered at city level. Meta-US-MinDW = minimum distance to the weak-efficiency frontier; FE = fixed effects; KEP = Key Environmental Protection; RB = resource based.
*p < .1.
**p < .05.
***p < .01.
Analogous to the full sample analyses, we extend our subsample results by further incorporating spatial lags and reestimating the eco-efficiency equations. The estimates, which are subtracted here for brevity, are not substantially different from those generated by nonspatial models. Identified endogenous interaction effects provide an alternative “performance competition” explanation for the converging process. A performance-maximizing municipal government determines the level of eco-efficiency not only according to local socioeconomic conditions but also based on the eco-efficiency status of its neighbors, especially those within the same province. Governmental officials could be demoted or even dismissed if they receive a low ranking in the annual evaluation of the local environmental quality and ecological condition. The endogenous spatial dependence appears to be the strongest among KEP cities, given the fact that environmental quality has been explicitly stated as a critical indicator of governmental performance for these cities. We hence expect KEP cities to be exceptionally influenced by this “eco-performance appraisal effect” compare to their nonKEP counterparts.
Convergence Speed and Half-life
To further understand the dynamics of identified convergence process, we compute the speed of convergence and half-life for the paired convergence clubs in Tables 6 and 7. Results are quite robust across two measurements. For the SBM results, the eastern area is converging to its steady state at an average annual rate of 7.5 percent, with a half-life of 9.3 years. The central-western region, by comparison, is experiencing a faster convergence rate with shorter half-life. Non-KEP cities are converging to a relative low-efficiency point twice the speed of KEP cities, while non-RB cities are moving toward the steady state much slower than RB cities with a substantial longer half-life. The most noteworthy and alarming observation is that lower-level clubs are converging to their relative inferior states at a significant faster rate than higher-level clubs, a pattern that is further confirmed by Figure 3 that plots the relative average eco-efficiency within each of the three convergence pairs for the eleven consecutive years (high-efficiency clubs against low-efficiency clubs). It is shown that the efficiency gap between eastern cities and central-western cities was persisting and enlarging since 2003. Specifically, the eco-efficiency of the eastern city club was 50 percent higher than the inland city club in 2013. The trend of the KEP-non-KEP line and RB–non-RB line resembles that of coastal–Inland line. Particularly, KEP cities are less efficient than non-KEP cities before 2007, after which the situation reversed.
Speed and Half-life of Conditional Convergence based on Meta-US-SBM.

Note: KEP = Key Environmental protection; RB = resource based; Meta-US-SBM = meta-frontier super SBM model considering undesirable outputs.
*p < .1 (H0: speed = 0).
**p < .05.
***p < .01.
Speed and Half-life of Conditional Convergence based on Meta-US-MinDW.
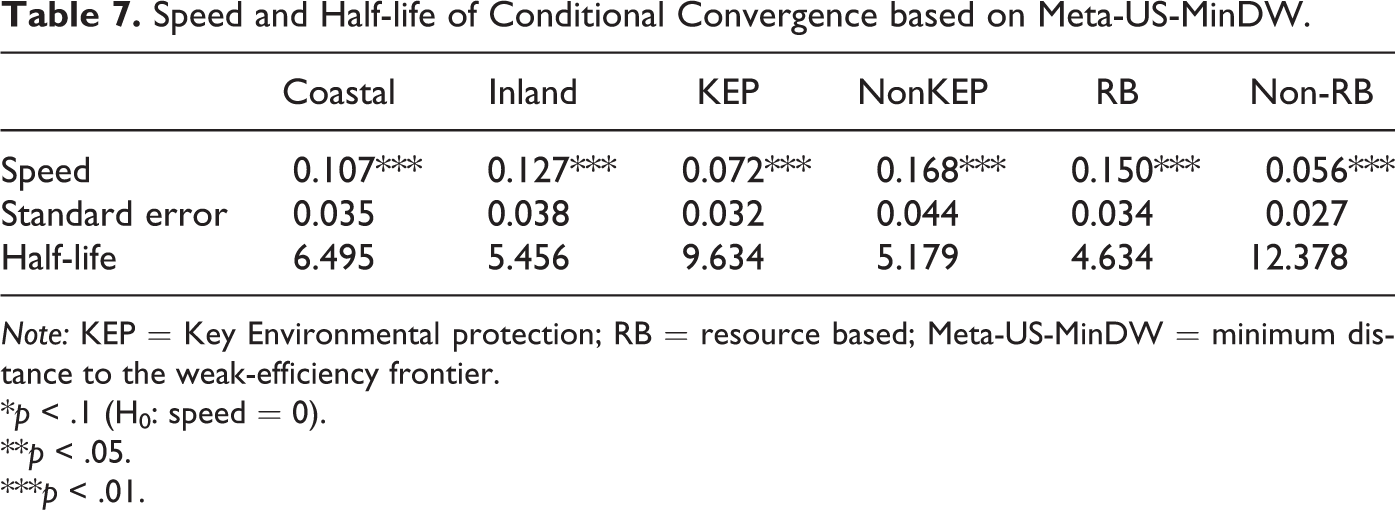
Note: KEP = Key Environmental protection; RB = resource based; Meta-US-MinDW = minimum distance to the weak-efficiency frontier.
*p < .1 (H0: speed = 0).
**p < .05.
***p < .01.

Relative eco-efficiency of convergence clubs.
Mechanisms
Recognizing the evident existence of group-wise idiosyncrasy, we focus our discussion on the formation and evolvement of eco-efficiency convergence clubs among Chinese cities. We build our analysis on the seminal decomposition framework proposed by Barro and Sala-i-Martin (1992) and Sala-i-Martin (1996) that explains the convergence of state income by diminishing returns to capital, mobility of capital and labor, diffusion of technology, and governmental redistribution policy. To account for the converging patterns of undesirable output (pollution), we supplement the analytical framework by considering the impacts of government intervention, public environmental awareness, and clean technology adoption.
It has been pervasively documented that China’s GDP growth rely heavily on government investment in fixed assets, especially within the studied period. Both coastal and inland northeastern area are experiencing diminishing returns to capital since the controversial “Four-Thousand-Billion Investment Plan” initiated in 2008. For the inland area, persistent extensive investment in traditional manufacturing sectors and infrastructure drastically lowers the marginal productivity of capital, with a set of provinces reporting increasingly high-investment GDP ratio relative to their coastal counterparts. 14 In terms of labor mobility, the perpetual migration of high-skilled workers toward coastal area weakens local productivity, while relative inferior business and institutional environment constantly drives out high-tech enterprises and high-educated laborers. The clustering of remaining low-efficiency firms and industries exacerbates pollution emission, which further lowers the economic attractiveness of this region. The coastal cities, on the other side, succeeded in sustaining relative high levels of eco-efficiency through better economic and pollution abatement performance. While the classic Marshallian agglomerative forces are much stronger in this area, residents possess higher average willingness-to-pay in terms of air pollution abatement (X. Zhang, Zhang, and Chen 2017). Polluting industries facing administrative barriers and restrictive regulations tend to relocate to the inland area where local municipal governments place more emphasis on GDP growth rather than environment protection. At current stage, it seems implausible for the inland area to achieve substantial eco-efficiency improvement, but the central government could make efforts on retarding the rapid efficiency deterioration through certain interventions such as assigning more “green subsidies” on pollution abatement and fostering high-tech-based urban industrial parks.
KEP cities were once heavily polluted with notably lower eco-efficiency relative to non-KEP cities. The designation of these KEP cities results in strict environmental regulation and proenvironmental evaluation on government performance. The earliest relevant policy we can locate turns out to be the “Announcement on Issuing the Working Plan on Proper Industrial Pollution Emission and Proper Construction of Environmental Functional Zones in Key Environmental Protection Cities in Year 2000” released by the Ministry of Environmental Protection in 1998. 15 In this policy, we notice that KEP cities were explicitly regulated with higher environmental standards based on their city-specific “environmental functions.” Each KEP city was required to submit a detailed annual working plan on environmental zoning, technological upgrading, government supervision, and fiscal budgeting associated with pollution reduction. Albeit the fact that KEP cities are not substantially more efficient than non-KEP cities by the ending year of our study, we can affirmatively expect that eco-efficiency can be consistently improved in KEP cities through actions on the environmental side (rather than the GDP side), such as the adoption of cleaner technologies, the construction of pollution abatement facilities, and the establishment of enforceable monitoring systems. KEP cities might also act as regional “green centers” that attract high-skilled workers and knowledge-based firms while creating environmental backwash effects on adjacent non-KEP cities through population and capital redistribution (Lee et al. 2016).
Lastly for the eco-efficiency degradation in RB cities, we need to recognize that their economic growth depends strongly on the extensive utilization of local natural resources, while this dependency is constantly associated with disadvantageous production mode and ineffective resource management. Coal mine exploitation creates numerous environmental problems including acid rain, contamination of underground water, and destruction of vegetation. Cities with clustered papermaking and furniture manufacturing industry overcut forests without sufficient fostering and replanting. Moreover, resource path dependence generates numerous types of crowding out effect that drives clean firms and technology out of the area. Local governments of RB cities are also found to be more corrupted and inactive in encouraging innovative activities. It seems that the ongoing “supply-side reform” with emphasis on industrial restructuring and endogenous technical upgrading might be a cure for this “curse of natural resources”.
Concluding Remarks
Creating more economic values with less adverse impact on environment has always been a goal worth pursuing in contemporary urban development. In this study, we propose two modified DEA methods to gauge eco-efficiency in China at city level. These two mutually complementing measurements are superior to their predecessors by fully considering undesirable outputs, heterogeneous technology, and ranking on the frontier. Results show static locational differences in eco-efficiency while providing evidence of both absolute and conditional β-convergence. We further explore the dynamic pattern within three paired convergence clubs divided by geographical region, natural resource endowment, and exogenous policy shock.
Overall, the national eco-efficiency level is found to be improved for a limited amount from 2003 to 2013, with three less efficient eco-efficiency clubs (inland cities, non-KEP cities, and RB cities) converging rapidly to low-level steady states. These results raise some policy implications for both the central and local government who try to improve urban eco-efficiency under the conceived “green growth” strategy. We rely on the Barro-Sala-i-Martin framework and argue that place-based policies should be aimed at mitigating diminishing returns to capital, facilitating mobility of capital and labor, improving diffusion of proenvironmental technology, and optimizing government redistribution policy. Under the China context, it should be noted that excessive amount of fixed investment is definitively associated with the “GDP tournament” among local governments, which remains pervasive in lagged regions, non-KEP cities and RB cities. It would hence be crucial for the central government to vertically adjust the governmental investment behavior by controlling the city-level debt ratio and setting up minimum environmental protection standards. We further purport that instead of implementing a uniform policy scheme, candidate policy instruments should be used according to the socioeconomic endowments and conditions of specific cities. For instance, a low-efficiency inland city in Yunan Province might be endowed with splendid natural sceneries and attractions, but not with satisfactory transportation conditions and human capital. It would thus be unwise to work on the production side of eco-efficiency such as establishing industrial parks, while preserving the existing natural amenity and supporting local tourism industry through fiscal spending seems to be more appropriate in this case. On the contrary, a low-efficiency RB city on the Loess Plateau haunted by water and soil erosion is not likely to achieve improved ecoefficient by restraining or restructuring local industrial production. Introducing proenvironmental technologies into the traditional resource exploitation industry, such as the reduction of coal gangue emission and the purification of waste water in coal mining, appears to be more realistic treatments on the production side to boost eco-efficiency.
One limitation associated with the current work is that data availability prevents us from identifying and evaluating specific factors that drive the low-efficiency cities toward undesirable equilibria, hence impeding us from knowing if it is truly possible for degenerating cities to regain ecoefficient status. Future research can be conducted on how eco-efficiency is causally related to traffic accessibility and locational choice of high-skilled laborers. Would it be wise to make more investment in urban culture and knowledge-based amenities, or simply lure educated workers with wage premium and additional benefits? Is it possible for cities to devote more in capital deepening and widening that might ultimately alter the economic structure, or the best strategy is to enact more stringent environmental regulations? We note that these concerns and candidate policy instruments are by no means mutually exclusive, since they tend to interact with each other. While one particular city can be categorized into two or more convergence clubs, how exactly should a city in contemporary China be treated to achieve eco-efficiency improvements remains to be scrutinized based on feasible datasets and proper identification strategies.
Footnotes
Appendix A
Appendix B
Appendix C
Acknowledgments
We thank Mark D. Partridge for detailed suggestions. We also thank attendees at the 2016 Asia-Pacific Productivity Conference for useful comments. The usual disclaimer applies.
Funding
The author(s) disclosed receipt of the following financial support for the research, authorship, and/or publication of this article: This work is supported by the National Natural Science Foundation of China (Grant No.41571524) and the National Social Science Foundation of China (Grant No.14ZDB144).