




Abstract
The economic and financial crisis of 2008–2013 caused most universities to revisit their traditional funding allocations. In a time of budget constraints, some universities have been able to enjoy an increasing level of research expenditure, while other aspects of their budgets have been cut. This article analyzes changes in research funding and output at three research universities in Atlanta, Georgia, between 2002 and 2015, covering periods both before and after the crisis. Although the amount of research expenditure has continued to increase in the three universities after the crisis, the efficiency of research funding has declined. The results argue that the approach undertaken by governments and universities after the crisis has been partial and too narrowly focused on the financial terms of research to take into consideration many relevant factors constraining research performance of academics.
Keywords
It is widely accepted that the economic and financial crisis, which started in mid-2007 and intensified in late 2008, was the most severe recession since the Great Depression, causing a substantial decline in investment, employment, and output (International Monetary Fund 2009; Organisation for Economic Co-operation and Development 2009; The Economist 2013). There is a bulk of studies examining the causes and consequences of the crisis at the global, national, and regional levels (Cerra and Saxena 2008; Crotty 2009; Foster and Magdoff 2009; Dufour and Orhangazi 2016). Confronted with high levels of government debt, national governments around the world implemented austerity measures that exacted large cuts on the public sector.
Two seemingly opposite arguments emerged to explain the situation that the higher education sector found itself in postcrisis. On the one hand, it has been argued that since higher education institutions (HEIs) still derive a large proportion of income from government bodies, they are not immune to austerity measures (Zhang, Larkin, and Lucey 2017). Indeed, many reports demonstrate the negative impact of the crisis on university funding in the United States, the United Kingdom, and other countries (State Higher Education Executive Officers 2011; Universities UK 2013). On the other hand, however, as HEIs are recognized by governments as key drivers for economic development, it has been suggested that governments instead will protect HEIs during economic downturn (Douglass 2010, 14).
The crisis clearly affected higher education systems across countries very differently, with some governments cutting investments and others providing additional funding. It is important to note that even for those countries who cut funding, the crisis seems to have had differing effects on different parts of university funding and budgets. A 2011 European University Association (2011) report analyzed how the crisis affected funding allocations across universities in Europe and uncovered a complex picture, demonstrating that teaching and research are often impacted unevenly. Particularly, it was suggested that teaching has been more negatively impacted than research.
In the United States, most states tightened their belts after the crisis, with state appropriations for higher education lowered considerably. 1 Between 2008 and 2013, state appropriations fell on average 17.5 percent across the country (Grapevine 2014; Mitchell, Palacios, and Leachman 2014). The federal government attempted to offset the effect of the recession with larger budgets and the American Recovery and Reinvestment Act of 2009 (Douglass 2010). While state appropriations fell significantly, the amount of higher education expenditure on research and development (R&D) continued to increase in the United States after the crisis. Data from the United Nations Educational, Scientific and Cultural Organization (UNESCO) Institute for Statistics show that the amount of higher education R&D expenditures in the United States increased 10.1 percent between 2008 and 2013, while the amount financed by government increased 5.3 percent. The universities themselves also increased their investment in R&D.
That research funding in HEIs has not been significantly impacted by the crisis reflects the recognition of universities as an important agent of economic growth, particularly because of their role in research, innovation, and entrepreneurship (Aoyama, Murphy, and Hanson 2011). Assessing the effects of academic research, Jaffe’s (1989) seminal study shows that corporate patent activity at the US state level is influenced by the R&D performed by local universities. Studies have proven that universities generate positive outcomes for the economies of their constitutent regions due to localized knowledge spillovers from academic research to industry (Jaffe, Trajtenberg, and Henderson 1993; Stephan 2012). Although faced with a challenging budget environment after the crisis, policy makers across most countries seemed to maintain strong faith in the role of university research in economic recovery. As Martin Rees, President of the Royal Society, said in 2009, “In difficult economic times, science and innovation is not a luxury but a necessity for the recovery.”
Given the significant amount of stimulus funding for research committed by both governments and universities after the crisis, it is crucial to analyze the performance, here defined as the input–output efficiency, of university research expenditures. In this article, we measure research input as the amount of higher education R&D expenditures, while research output is measured as the number of publications, invention disclosures, and patent applications. From a productivity theory perspective, the efficiency of research expenditure is defined as a ratio between research outputs and inputs (Hopkins and Massy 1981; Hopkins 1990; Johnes 1996).
To understand the impact of the recession on the input–output efficiency of university research, we focus the analysis on three geographically colocated, yet operatively distinct research universities. Specifically, the article asks first, whether the amount of research expenditure changed at universities before and after the crisis, and second, how research performance, that is, the efficiency of research expenditure, changed at universities before and after the crisis. This article aims to provide answers to these empirical questions as well as to investigate the specific mechanisms that explain changes in R&D expenditures and performance at universities pre- and postcrisis. Answers to these questions are key to evaluating the effectiveness of the funding allocation made by universities between research and other activities.
The three universities analyzed in this article are located in the metropolitan region of Atlanta, Georgia, and include Emory University (Emory), a private institution, as well as Georgia State University (Georgia State) and Georgia Institute of Technology (Georgia Tech), two public universities. Focusing the analysis on institutions within the same state allays concerns of cross-state comparisons that are made difficult by the fact that each state funds higher education through different processes and institutions and operates within different political climates (Weerts and Ronca 2012). These three universities are leading research universities in the Atlanta region and State of Georgia, yet have significant differences that allow us to look deeper into how different types of universities were influenced by the recession. Therefore, while a focus on the Atlanta, Georgia, case means our results cannot be generalized to all US universities, we are able to take a deeper look at how the institutional context of one state and region influences the impact of economic recessions on research output. Our results provide clear implications to policy makers and university administrators in Georgia, other states, and other regions around the world interested in promoting economic development by supporting continued research performance during times of economic decline.
The remainder of the article is structured as follows. The next section presents literature and theory on institutions in order to motivate institutional change at universities as an appropriate framework for understanding the growing significance of research and the potential influences of economic recession. The third section reviews the higher education context of the State of Georgia and provides information on the three universities analyzed, while the fourth section explains the methodology and data, which are obtained from a survey and secondary sources. The fifth section presents our results. We find that although the level of research funding continued to grow during the 2008–2013 period, research performance in the three universities declined in most cases. Survey results help identify possible explanations for the observed paradox. The sixth section provides a discussion of the results. The final section concludes.
Institutional Change, Universities, and Research Performance
Institutional theory is a useful framework for understanding changes in universities’ activities and governance over time as a result of external forces. Since the 1970s, institutional theory has been widely used to study structures, processes, and activities in organizations (Meyer and Rowan 1977; DiMaggio and Powell 1983; Dacin, Goodstein, and Scott 2002). From an institutional perspective, organizations, such as universities, exist in an environment of institutions, which can be considered the “rules and requirements to which individual organizations must conform if they are to receive support and legitimacy” (Scott 1995, 132). In other words, a main focus of institutional theory is on how the institutal rules, norms, and expectations impact organizations. For example, as universities have increasingly been recognized as an agent of economic growth, US policy makers have instituted policies to require economic outcomes from universities. Furthermore, new norms suggest universities should engage in activities like technology commercialization that were once considered outside the realm of the ivory tower (Breznitz and Feldman 2012).
Institutional change may occur as organizations respond to external environmental expectations and incorporate institutional rules and practices, that is, the norms of the field (DiMaggio and Powell 1983). In some cases, the organization’s desire for environmental acceptance and legitimacy may prompt change which would ensure continued support from external stakeholders (Suchman 1995). Scott (1995) suggested three levels of institutional forces are at play: societal and global institutions (e.g., formal models of the institutional context), organizational fields (e.g., norms of acceptability, morality, and ethics), and actors in institutional settings (e.g., individuals or groups). Simultaneously, these forces may drive institutional change in organizations. In theory, the social rules, expectations, norms, and values within the environment are experienced similarly by organizations in the same institutional field, for example, institutes of higher education (Pfeffer and Salancik 1978). As other organizations in the institutional field conform to these pressures, organizations homogenize in an isomorphic process.
As institutional theory emphasizes relationships between organizations and their environment, it is especially useful in analyzing open systems, as “the more open a system, the more permeable its boundary, and the more it is influence by the external environment” (Austin and Jones 2016, 29). During the past few decades, universities have become increasingly open, becoming more actively engaged outside their own boundaries, suggesting institutional theory is a useful framework to explain changes in universities’ activities and governance. In particular, two revolutions shifted the mission of HEIs and defined the new roles they play in socioeconomic development (Lehrer, Nell, and Garber 2009). While the first revolution is associated with the integration of research into the academic mission, the second revolution adds knowledge transfer to the university agenda (Etzkowitz and Leydesdorff 1997; Goddard and Chatterton 1999). Universities are now expected to actively engage with the environment and provide a wide range of services such as technology commercialization, policy research, and community involvement (Breznitz and Feldman 2012).
Of the environmental forces influencing how universities operate, the most important one might be that policy makers now recognize universities as a key contributor to national and regional competitiveness, mainly through research and technology transfer (Zhang et al. 2016). The government has long acted entrepreneurially in the support of new high-risk sectors which the private sector typically avoids until the degree of risk is lower (Mazzucato 2013). Acs, Audretsch, and Feldman (1992) demonstrate that university R&D has a direct impact on local economic growth. The regional impact of universities is based in part on its research output, which is often a product of national, state, and local government R&D funding (Tahvanainen 2004). Likewise, the commercial output of universities is led by funding availability, academic prestige (often measured by publications), and research collaborations (Roberts 1991; Clark 1998; Zucker, Darby, and Peng 1998; Kenny and Goe 2004; Shane 2004; Lockett and Wright 2005). There is a positive correlation between the number of of university research grants, publications, and patents (Link and Siegel 2007; Godin 2012).
Responding to pressure from external stakeholders, in the 1980s, universities began to undergo a shift toward marketization or “academic capitalism” (Slaughter and Rhoades 2004). Notable examples of marketization include the commercialization of academic discoveries (Bok 2009). Studies of university scientific commercialization find three main factors affect commercialization: policies, culture, and organization (Clark 1998; O’Shea et al. 2005; Breznitz 2014). Studies point to funding as an important contributor to the success of technology transfer offices, which are distinguished by their ability to evaluate technologies, patents, and negotiate with industry. Income from licenses and funding from university administration for the creation of entrepreneurship programs also have a direct impact on university commercialization. Lastly, because inventions are based on research outcomes, the ability to fund university research directly impacts commercialization.
As a result of institutional change, universities are now complex organizations with multiple goals and activities including teaching, research, and public service (Breznitz and Feldman 2012). Many universities consider the source when deciding how to allocate funding in their budgets. In line with this institutional theory, Cai and Mehari (2015) find that university funding from grants and contracts is generally spent on research, while funding from tuition or state appropriations is spent on teaching. Still, administrators at research-intensive universities tend to prioritize research (Ehrenberg, Rizzo, and Jakubson 2007). Even the less intensive research universities have now made research more of a priority, conforming to environmental pressures and mimicking research-intensive institutions in terms of mandate and mission statement. For instance, Brint, Riddle, and Hanneman (2006) found that less prestigious universities emulate their more prestigious counterparts by increasing research intensiveness. Thus, if research support is reduced, which is likely during a crisis, universities may compensate by tapping other revenue sources including those normally allocated for teaching and support services.
However, institutions operate with different constraints and pressures even in a geo-localized context. Different institutions are subject to different stakeholders with different missions. Institutional diversity means institutions may react differently to the same external shocks, that is, the financial crisis. A National Research Council (2012) panel report on measuring higher education productivity argued the same performance criteria for educational outputs should not be used to evaluate universities with different missions. Furthermore, external forces of institutional change can be met with resistance and even inertia. Therefore, we expect to see some variation in the ways universities respond to the crisis based on their missions, ownership, and other characteristics.
Setting the Context
Local history and the environment in which universities operate are considered important in influencing universities’ ability to make an economic impact (Breznitz 2011; Lawton Smith and Bagchi-Sen 2011). In this section, we provide the background information on the institutional setting of the State of Georgia and on the three universities. Georgia Tech, a public university of engineering, has strong ties to industry and the State. Emory is a private university that ranks highly in medicine and health-care policy and has strong ties to federal laboratories. Georgia State is the youngest university in our analysis. It was accredited later than Emory and Georgia Tech, and although it is considered research-intensive, it ranks lowest in research funding out of all three.
State of Georgia
In Georgia, most colleges and universities are located in the Atlanta metropolitan statistical area. Composed of twenty-eight HEIs, the University System of Georgia (USG) enrolled 321,551 students for Fall 2016 and has an annual budget of more than US$8.8 billion for fiscal year 2018 (USG 2017). A milestone event in Georgia in terms of promoting business, government, and university partnership was the creation of the Georgia Research Alliance (GRA) in 1990, a collaborative partnership among the State’s eight research universities. These universities, including Georgia Tech, Emory, and Georgia State, came together to foster economic development through their research capacity. In its first twenty years, GRA attracted over US$2.6 billion in public and private investment and led to the launch of more than 175 companies (GRA 2013). The organization’s funding was threatened due to the 2008–2013 recession when the annual appropriation was reduced from around US$20 million to under US$5 million (Stuart 2011; Conaway and Scott 2016). At the state level, appropriations for higher education were reduced by 24.8 percent in Georgia between 2008 and 2013. USG also consolidated after 2011, shrinking the system from thirty-five to twenty-nine institutions. Even with consolidations Georgia saved only about 0.1 percent of its US$7.4 billion operating budget (Rivard 2013). Moreover, from 2008 to 2013, tuition for higher education in Georgia grew on average 66.5 percent—the second highest increase in the country (Mitchell, Palacios, and Leachman 2014).
Georgia Institute of Technology
From its inception, Georgia Tech was expected to make social and economic contributions to the State. Georgia Tech was established in 1885 as part of an attempt to reconstruct and create the “New (Industrial) South” (McMath 1985; O’Mara 2005). Although Georgia Tech is not a land grant university, its early years were dedicated to workforce development and training. Furthermore, the university implements many State science and technology programs (Youtie and Shapira 2008). Georgia Tech’s economic contribution is seen through its university–industry relationships, patents, and spinouts (Oldach 2009). When compared to other top research universities, Georgia Tech has established exceptionally strong connections with industry (Youtie and Shapira 2008). This is evident in the amount of funding the university receives from private industry and the number of patents it holds. The university receives US$45 million on average from private industry annually and its patented innovations are more likely to be built upon by industry than those of other institutions (Oldach 2009). An example of the strong connection between Georgia Tech and the State is the university’s Enterprise Innovation Institute (EI 2 ), created to focus on economic development concerns in the State. The Advanced Technology Development Center (ATDC) was created within EI 2 to help launch technology start-ups. Fully funded by the State of Georgia, ATDC has graduated more than 170 companies since 1980.
Emory University
The Georgia Methodist Conference was granted a charter to establish Emory College in 1836 (Emory University 2017). In 1914, Emory College moved to Decatur, Georgia, and soon after became Emory University. Emory has historical connections to the Atlanta business community. The Atlanta Chamber supported its 1914 relocation with US$500,000 in aid, has promoted Emory’s financial campaign, and uses the university to promote Atlanta as an educationally rich city (English 1966; Garofalo 1976). Research is an important aspect of Emory’s mission. As of 2017, Emory’s total research expenditure was US$628 million. The majority of its research and technology transfer is in health sciences (Emory University 2017). In 2016, Emory was the second largest employer in Atlanta, largely due to its numerous health-care facilities around the city (Metro Atlanta Chamber 2017). Emory sponsors programs supporting innovation and entrepreneurship. According to the Emory University Office of Technology Transfer (2017), it has supported seventy-two start-ups over thirty years, of which fifty-three were still active in 2017 and forty-four based in Georgia. In 2005, an Investor Challenge Fund was created to match up to US$500,000 of the funding of qualified investors investing in eligible Emory technologies. Proponents argued the fund would strengthen university–industry partnerships and bolster Georgia’s biotechnology industry (Moriarty 2005). These programs illustrate that Emory’s commercialization culture increasingly acknowledges the importance of supporting local industry.
Georgia State University
Georgia State, officially accredited as a university in 1969, was founded in 1913 as Georgia Tech’s Evening School of Commerce in response to pressure from industry partners who believed local business training would enhance both the education of Georgia Tech students and the level of human capital in Atlanta (Flanders 1955). The university’s ownership shifted between Georgia Tech and the University of Georgia in Athens, Georgia, for several years. The university received no State funding until 1936 (Reed 2009). Its research capability was also late to develop. Georgia State’s founding highlights it was not created with the goal of being a leading research institution. Although it is considered a “very high research activity” university, the university lags behind its local peers in research, slowing commercialization opportunities (Center for Postsecondary Research 2017). It was not until the 1980s that research funding at the university began to increase (Reed 2009). CollabTech, Georgia State’s biotechnology incubator, is the university’s most direct attempt to participate in Atlanta’s high-tech industry. It was created in 2001 to keep biotechnology start-ups in Atlanta. By 2012, it gained GRA support and tenants were provided access to GRA funding (Georgia State University 2017). Despite being a research-intensive university, Georgia State is new to the level of research and commercialization that take place at Georgia Tech and Emory. However, as a public university, it made a contribution during the financial crisis as it responded to State business needs and enrolled the most students.
Table 1 illustrates differences between the three universities. The number of faculty members in Emory is more than double that of Georgia Tech and Georgia State. As a private university, Emory enrolled just above 15,000 students in the 2016–2017 academic year, much less than student enrollment in the two public universities. Thus, the student-to-faculty ratio for Emory is less than 5, while the ratios for Georgia Tech and Georgia State are much higher (23 and 24, respectively). Over 40 percent of Georgia Tech and Emory students are enrolled at the graduate level, but less than 20 percent are graduate level at Georgia State, which makes sense given it is less research-intensive. In terms of total income, Emory is slightly ahead of Georgia Tech, while Georgia State falls last. As each university ranking considers different factors and assigns different weights to similar factors, we provide placements in three global rankings. Georgia Tech is consistently ranked in the top 100, Emory in the top 150, and Georgia State outside the top 350.
Profiles of the Three Universities.
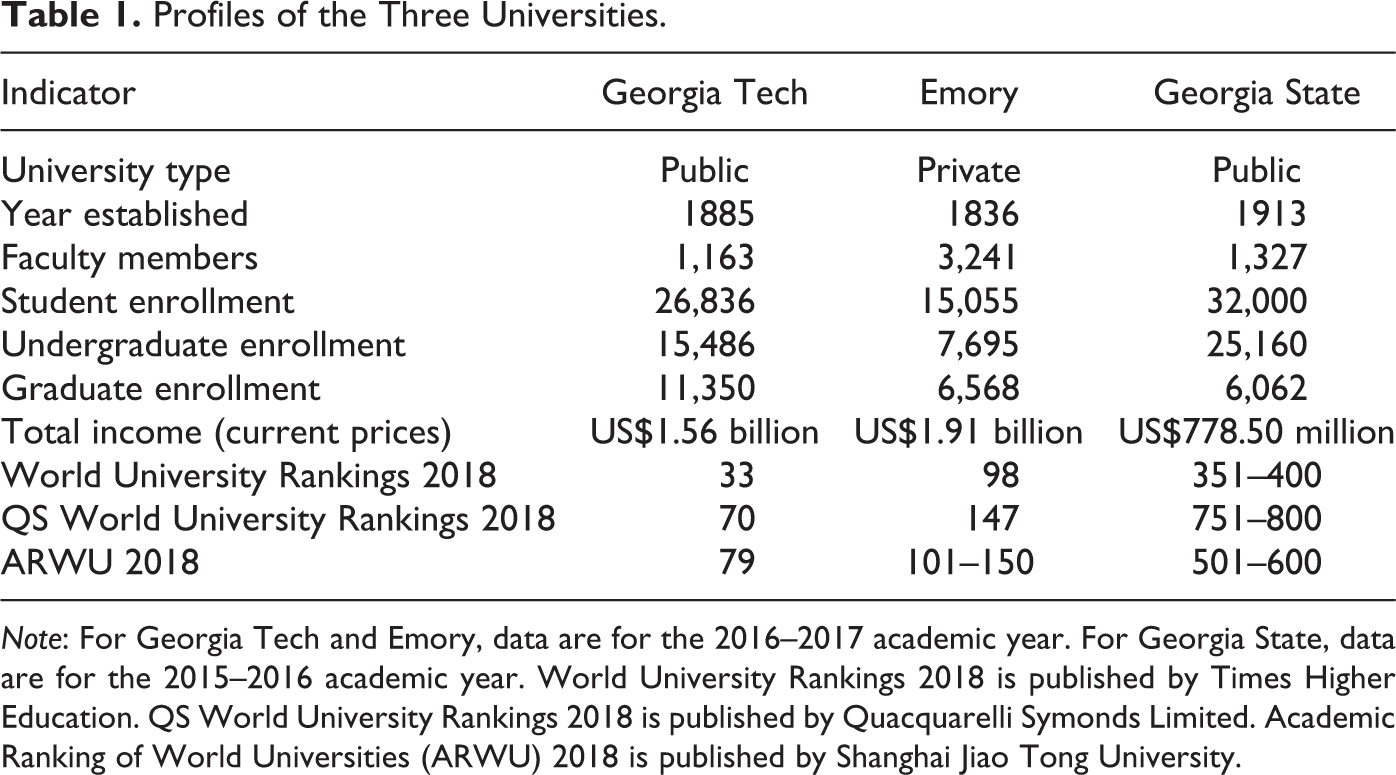
Note: For Georgia Tech and Emory, data are for the 2016–2017 academic year. For Georgia State, data are for the 2015–2016 academic year. World University Rankings 2018 is published by Times Higher Education. QS World University Rankings 2018 is published by Quacquarelli Symonds Limited. Academic Ranking of World Universities (ARWU) 2018 is published by Shanghai Jiao Tong University.
Methodology and Data
This article analyzes the influence of the recession using a mixed-methods approach, using both quantitative and qualitative data to provide an in-depth analysis of three universities in one region. The key indicator of the analysis is research performance, which we define as the efficiency of research expenditure. Governments frequently measure research performance, or link research outputs to funding, “to encourage institutions to respond to external expectations” (Austin and Jones 2016, 29). Since the 1980s, a large literature has focused on university-level efficiency analysis, but its objective has mainly been to compare the efficiency scores of a large number of universities within the same country in order to identify the most efficient (Tomkins and Green 1988; Johnes and Johnes 1993; Coelli 1996; Madden, Savage, and Kemp 1997; McMillan and Debasish 1997; Caldera and Debande 2010; Curi, Daraio, and Llerena 2012). As the focus of this article is not a comparison between universities rather an evaluation of efficiency changes in each of the three universities over time, this article adopts a similar measurement of research performance. Particularly, we operationalize research performance as the effectiveness of universities in transforming research input into research output. Our measure of research performance, or efficiency, is computed as a ratio between output and input (Hu, Liang, and Tang 2017). The input indicator is the amount of university R&D expenditures at the university level, while the output indicator contains three dimensions also calculated at the university level: the number of publications, the number of invention disclosures, and the number of patent applications. Researchers increasingly work in the so-called Pasteur’s Quadrant, generating both “fundamental insights and solutions to problems” (Stephan 2012, 57). Therefore, using these three types of research outputs reflects the types of outputs that can be expected from both fundamental and applied science. The dual nature of research helps explain why academics choose to disseminate their work in a wide range of ways.
Data
This study makes uses of both qualitative and quantitative data derived from both primary and secondary sources. First, we used secondary sources, three interviews with university administrators, and a review of statements made on the universities’ websites regarding their research, commercialization, and economic development policies in order to compile historical narratives of the three universities and the State of Georgia. These data provide evidence of the policy environment surrounding higher education, research, and knowledge commercialization in Georgia, by which the impact of the economic crisis might be better understood.
Second, to understand changes in research expenditure and output at the three universities over time and how these changes correlate with economic fluctuations, longitudinal data were analyzed for three periods: precrisis (2002–2007), in-crisis (2008–2013), and postcrisis (2014–2015). As indicated, research output was operationalized as the annual number of publications, invention disclosures, and patent applications. Information on university research expenditure and output was found from universities’ annual fact books or reports to the president, the National Science Foundation’s (NSF) annual higher education surveys, the Association of University Technology Managers (AUTM), and direct information from university administrators via e-mail or interview. Research expenditure in the 2002–2015 period was adjusted for inflation and presented in real terms at constant 2009 prices. The number of publications per university was retrieved from the Web of Science. 2
Finally, we administered an online survey to academic researchers in July and August 2014 to provide a richer understanding of the 2008 recession’s impact from the perspective of the researchers themselves. It was mailed to 249 researchers and faculty in the physical and engineering sciences at the three universities. Specifically, the survey was sent to ten faculty members in each of ten departments at Georgia Tech and Emory and six departments at Georgia State. These departments were chosen as they were most likely to have faculty involved in R&D that could lead to invention disclosures and commercialization (see Online Appendix 1 for the list of departments and Online Appendix 2 for the key survey questions). The sample has a proportional mix of assistant, associate, and full professors as well as research associates where possible. When the survey was closed, we had a 27 percent response rate (sixty-six responses received with six opting out).
Results
Figure 1 provides R&D expenditure growth paths for the three universities and the US total between 2002 and 2015. 3 Although there were some fluctuations, research expenditures in all three universities continued to grow both during and after the crisis. Research expenditures at Georgia Tech and Emory actually grew faster during the crisis period than in the precrisis and postcrisis years. The case of Georgia State is even more dramatic. Its research expenditures did not grow at all between 2002 and 2007, with all increases taking place after the crisis. After the end of the crisis, Georgia Tech managed to increase its research expenditures by 3 percent, whereas Emory saw a small decline. Georgia State was slightly different than its two counterparts. Although it suffered a decrease in R&D expenditures in 2009, it successfully bounced back in subsequent years with continued growth. It is clear from Figure 1 that the 2008–2013 financial crisis did not have much negative impact on research expenditures in all three universities. The US total also shows an increase over the time period analyzed, though the three Atlanta universities appear to have experienced more growth in expenditures than the aggregate of US universities.
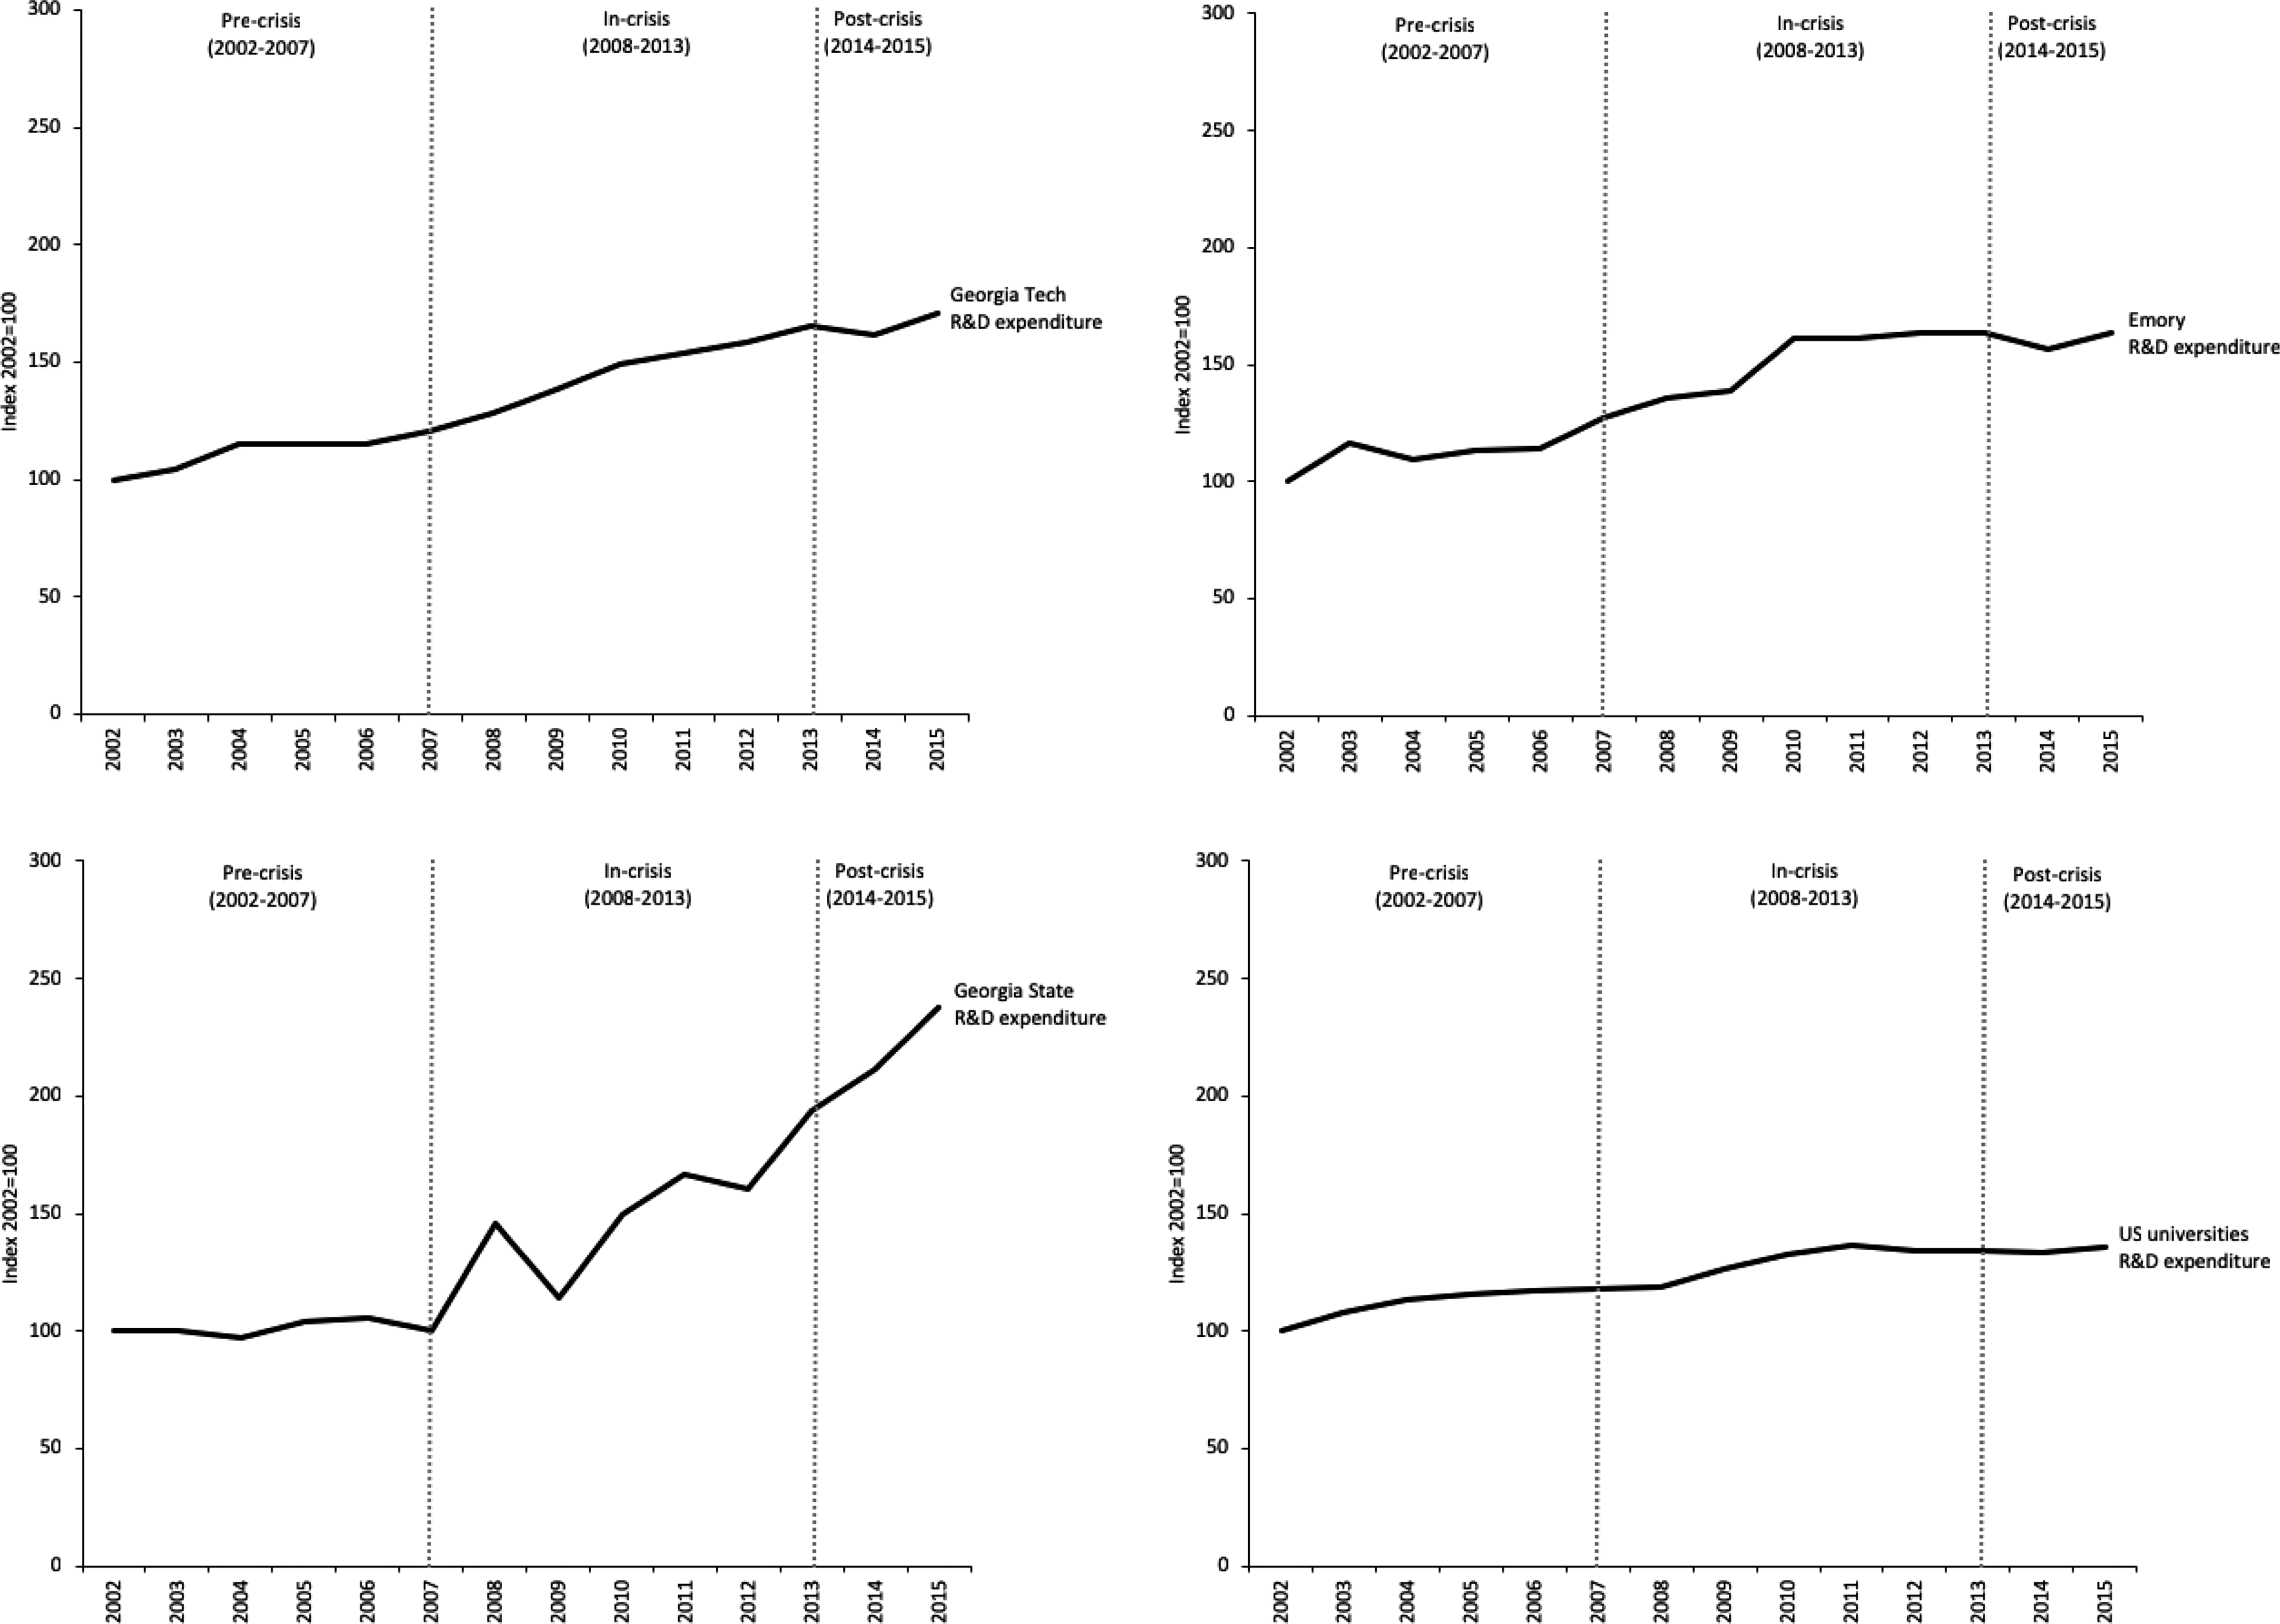
Growth paths of research and development expenditure in Georgia Tech, Emory, Georgia State, and US universities, 2002–2015.
R&D expenditures in US universities are funded by many sources, generally grouped by the type of institution. Most funding is provided by federal, institutional, and industry sources. 4 In 2015, these three sources accounted for at least 85 percent of total research expenditures at Emory, Georgia State, and Georgia Tech, while state and local government funds and other sources made up less than 15 percent. For Georgia Tech and Georgia State, the combined share of the three main sources of total research expenditures remained similar in 2015 compared to 2007, while at Emory the total share of funding from the three main sources increased from 82 percent in 2007 to 93 percent in 2015. Foundations, usually nonprofits or philanthropies, are another source of research funding. Figure 2 depicts growth paths of R&D expenditures funded by federal, institutional, and industry sources at the three universities and for all US universities. While the lines are closely clustered in the 2002–2007 period, they begin to diverge significantly at the start of the crisis. While Georgia Tech’s federal funding continued to grow after 2008, its institutional support first increased through 2010 but later decreased. The amount of Emory’s R&D expenditures funded by industry continued to shrink after 2008; in 2015, it was half the 2002 level. Starting in 2008, both Emory and Georgia State sharply increased institutional funding for research. The two universities are different in that, while Emory benefited more from the industry funding, Georgia State received more support from federal sources. These findings provide support for the relationship posited between reduced state appropriations and increased institutional R&D expenditure, which also seem to be moderated by the level of federal R&D funding. The US totals show us all sources continued to increase over time, though during the recession institutional and industry funding decreased. During this time, federal funding increased at a higher rate, however. After the crisis by 2015, both industry and institutional growth surpassed federal. Emory resembles the US trend most closely, though it experienced higher growth rates in institutional and industry funds than the United States overall. Georgia State institutional growth resembles the US trend, but its industry funding has not experienced the same growth as the overall United States. Georgia Tech relies much more on federal research funding than the national trend. Like the national trend, it saw a decrease in industry and institutional funding during the crisis, but its levels have not risen with the national trend.
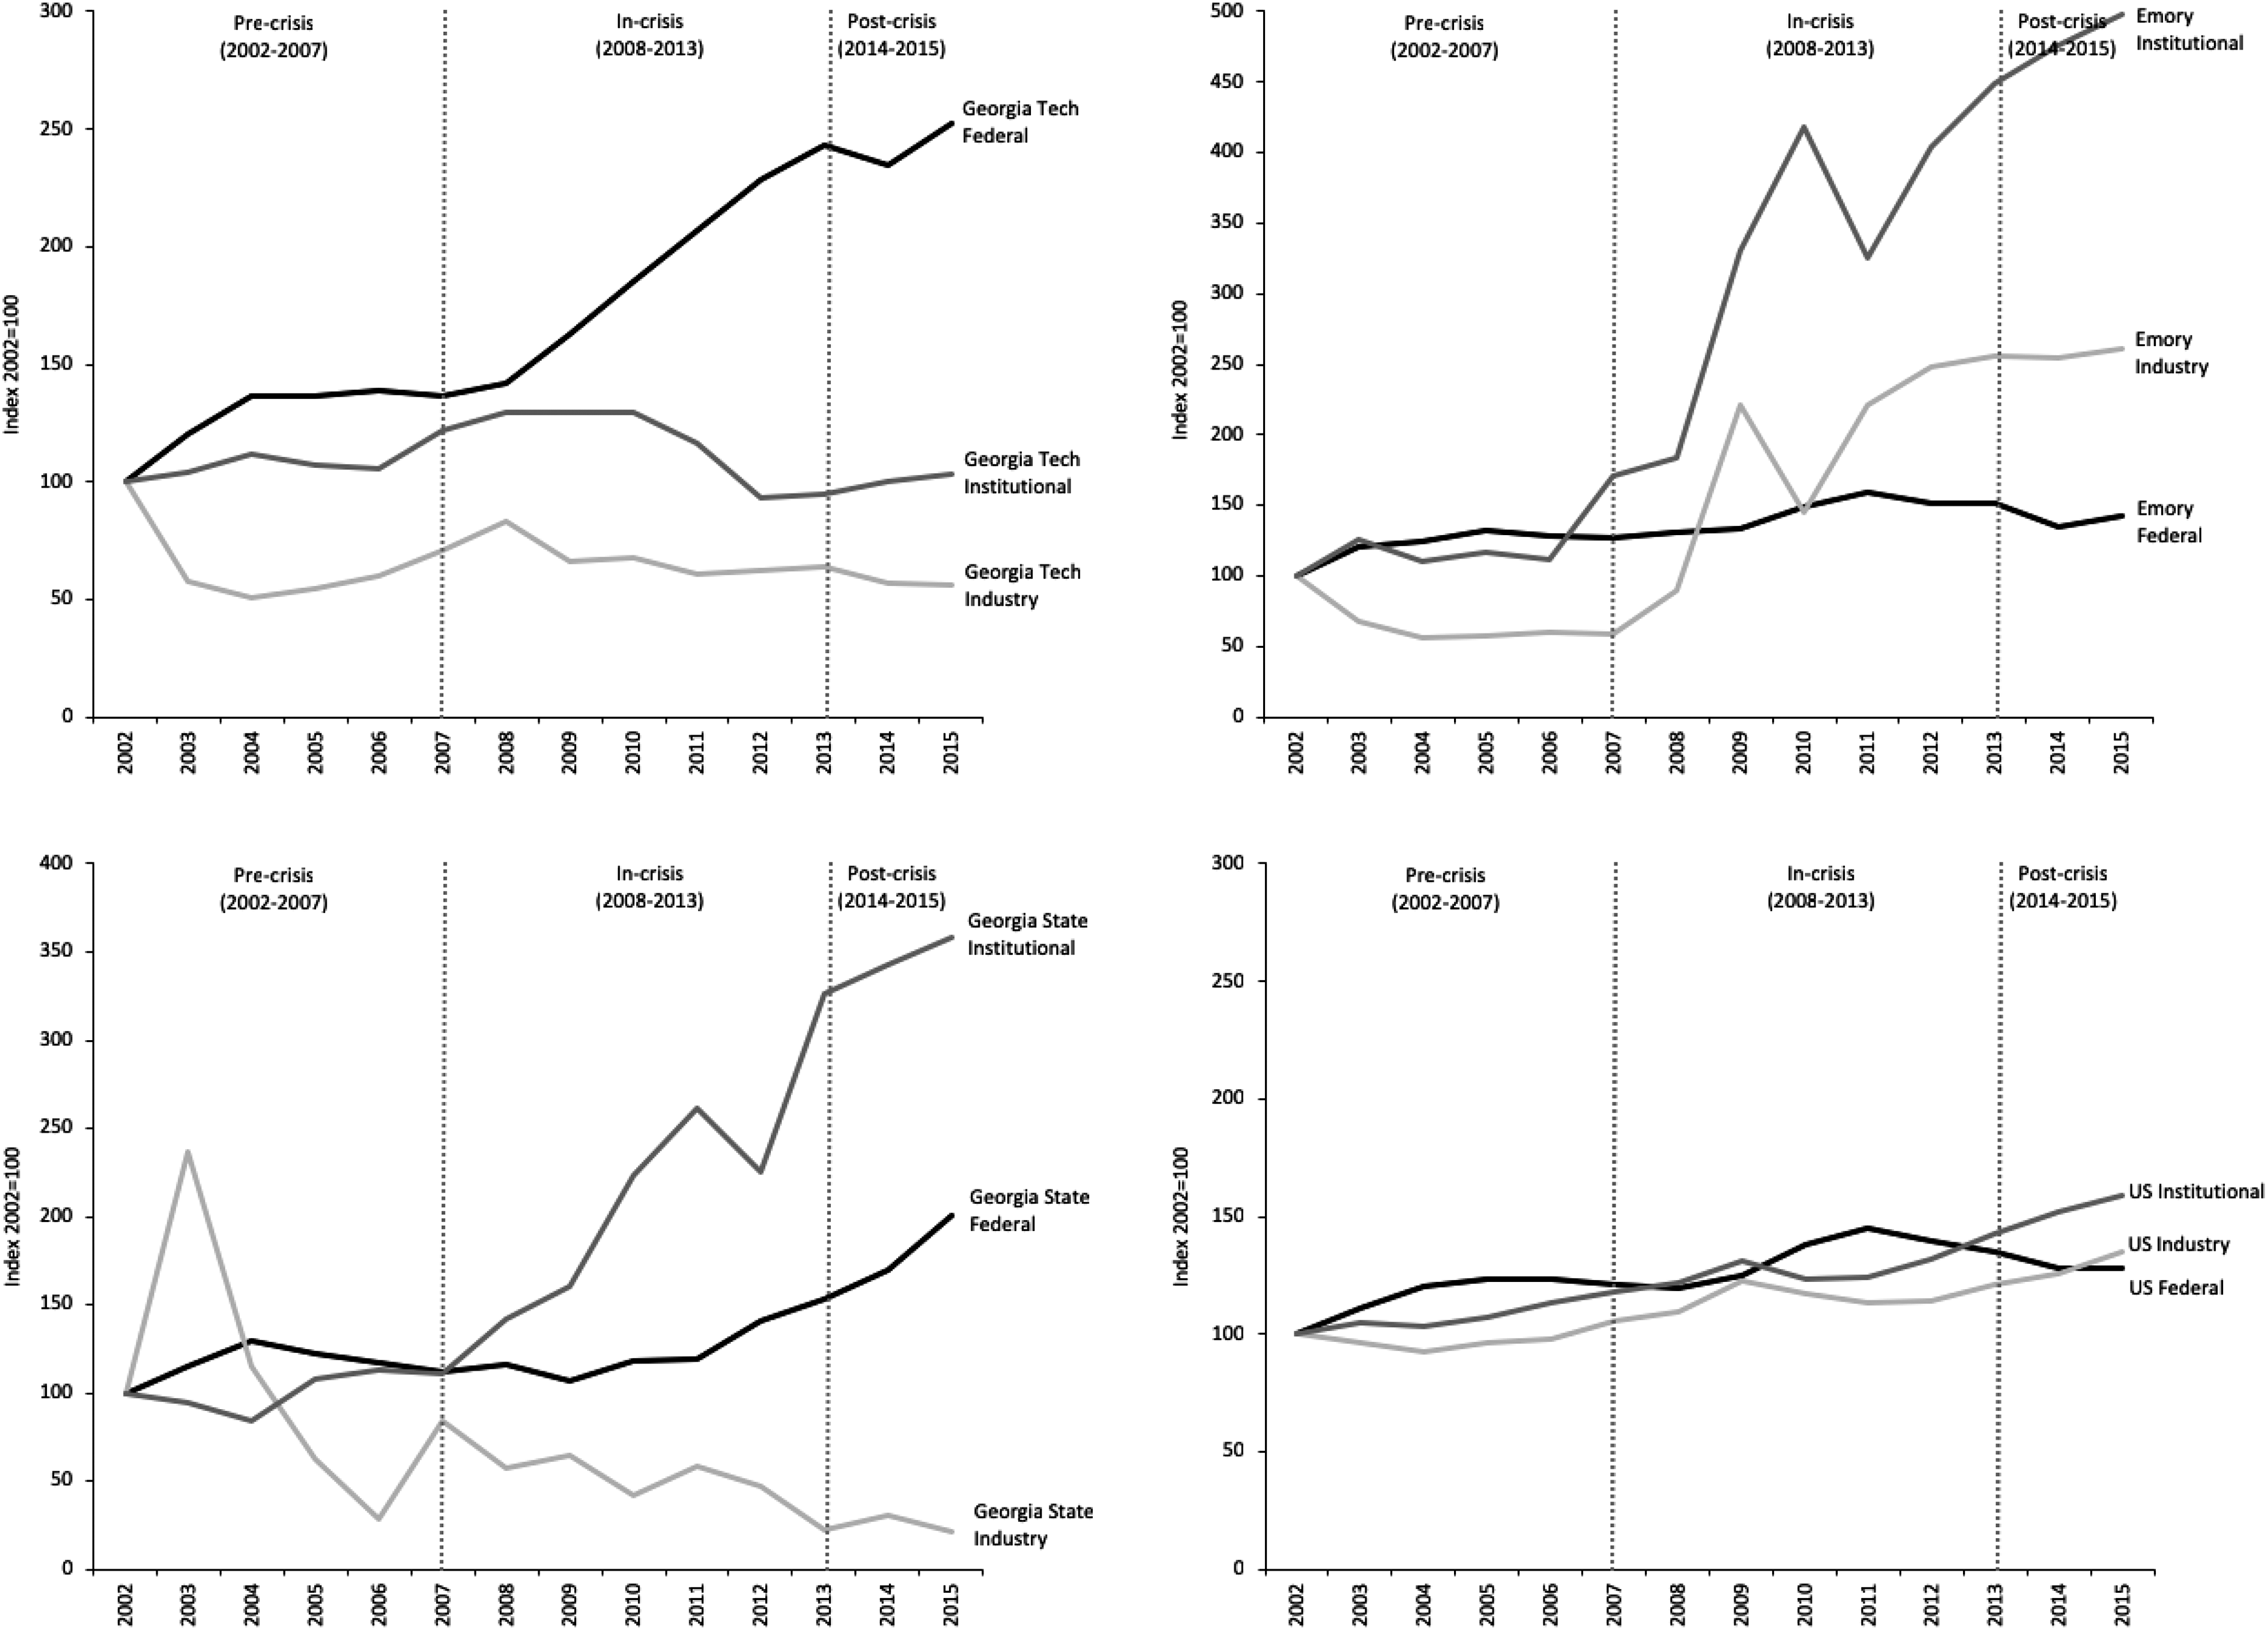
Growth paths of research and development expenditure funded by federal, institutional, and industry sources in Georgia Tech, Emory, Georgia State, and US universities, 2002–2015.
Figure 3 presents growth paths of research performance in terms of publications, invention disclosures, and patent application output efficiency at each university. 5 Publication productivity at Georgia State decreased immediately after the crisis and had not recovered to precrisis levels by 2015. Publication productivity at Georgia Tech remained relatively unchanged between 2006 and 2015. In contrast, Emory’s productivity decreased through 2011 then began to increase. 6 In terms of invention disclosures and patent applications, the situation in the two public universities improved significantly before 2007 but generally worsened during the crisis. An exception is Georgia State’s patent application productivity, which grew after 2010 but had not reached its 2007 level again by 2012. At Emory, the patent application rate fluctuated while the invention disclosure rate continued its earlier, increasing trajectory. It should be noted that the actual changes in the number of invention disclosures and patent applications at the three universities were small. For instance, the average annual number of invention disclosures and patent applications in Georgia State between 2002 and 2012 was only 17.9 and 12.4, respectively.
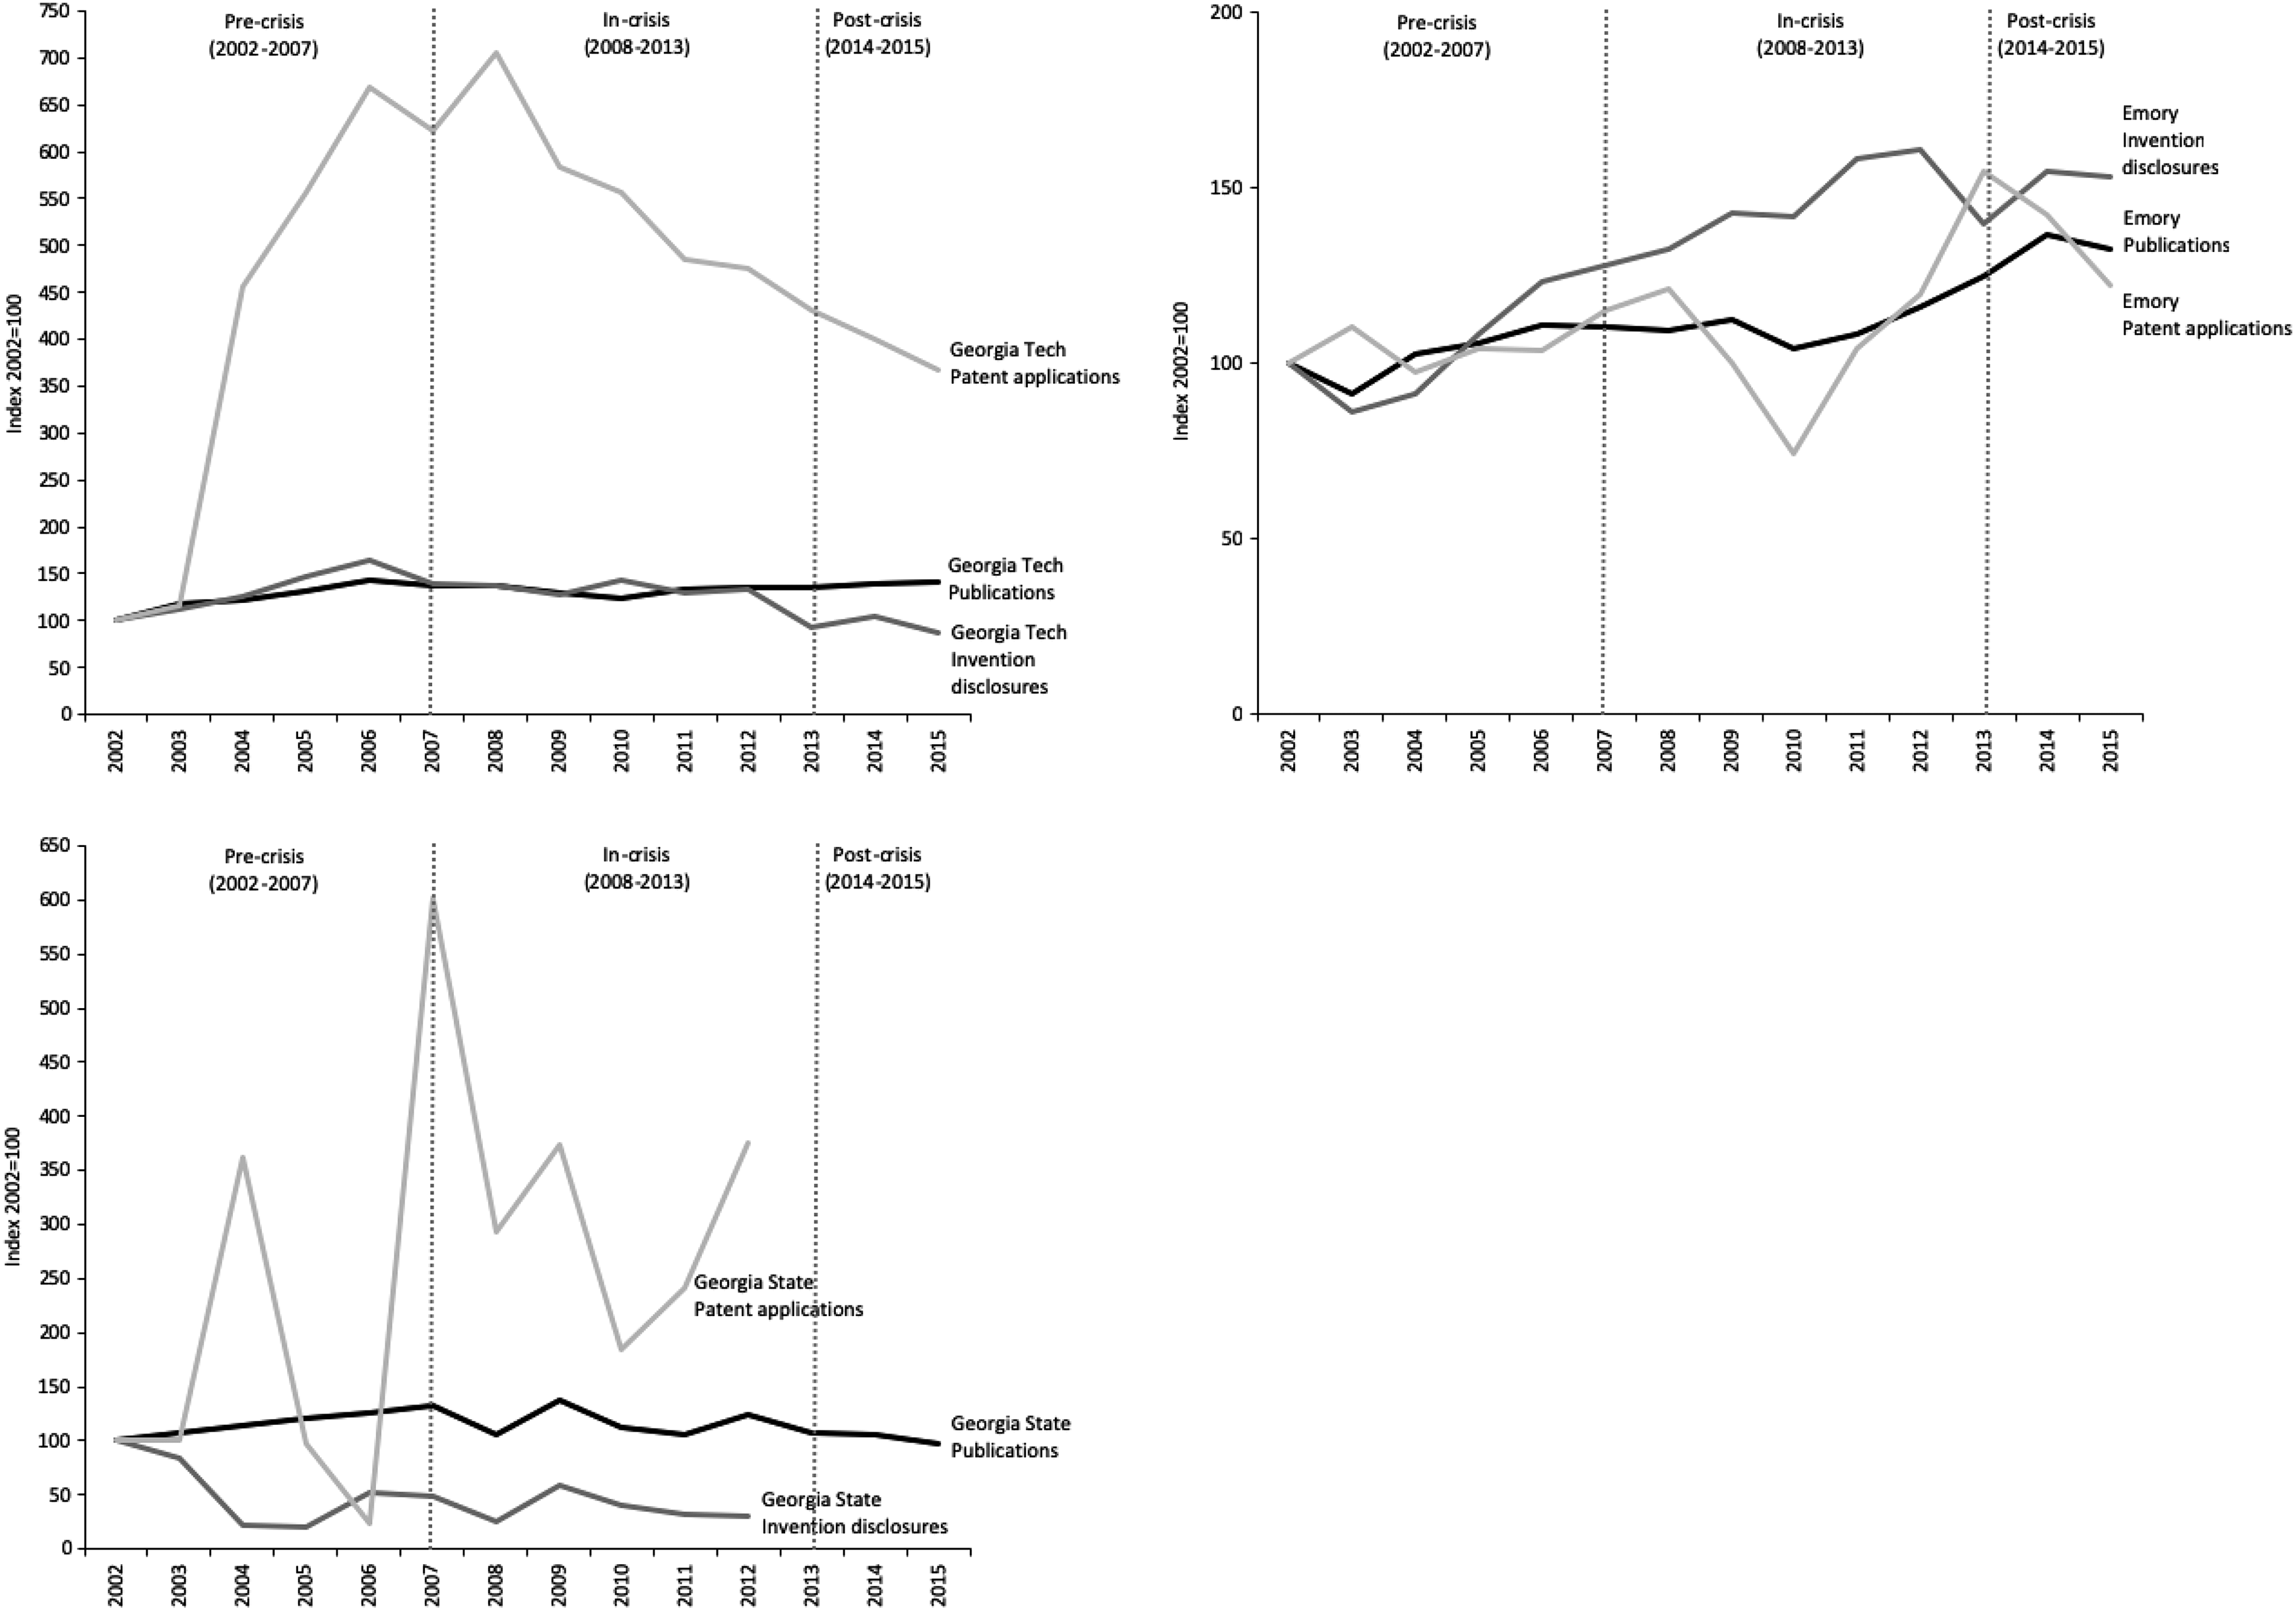
Growth paths of research performance in Georgia Tech, Emory, and Georgia State, 2002–2015.
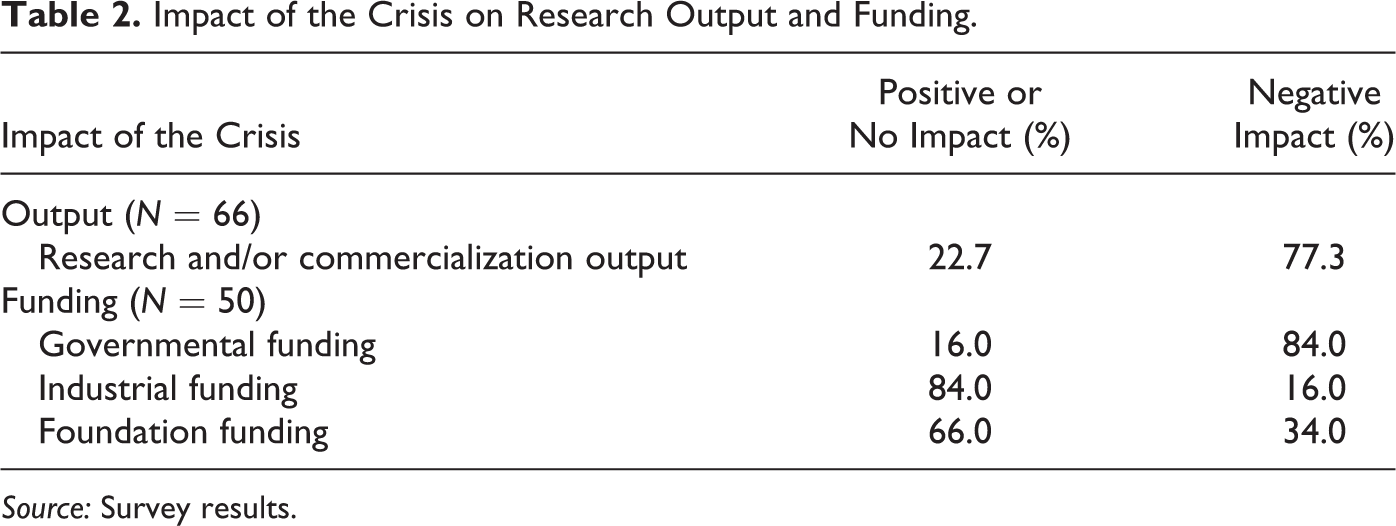
To explain our findings, we shift our focus to the online survey. In the survey, we first asked the respondents to indicate in what way—negatively or not—did the crisis impact their research output. Table 2 shows over three-quarters (77.3 percent) of the respondents believed their output was negatively affected by the financial crisis, with remaining respondents (22.7 percent) indicating no negative impact. The survey also asked the respondents: how did the crisis impact their research funding by sources. Results show a clear divide between governmental funding and funding from other sources. While 84 percent of the respondents experienced a reduction in government funds, only 34 percent and 16 percent reported a decline in foundation funding and industrial funding, respectively. Furthermore, 74 percent of the respondents indicated increased competition for funds, especially from federal sources. These responses lend support to the earlier finding of a paradox between increased research funding and decreased research output.
Impact of the Crisis on Research Output and Funding.
Source: Survey results.
When considering the impact of the crisis on publications, 45 percent of respondents stated they experienced a negative impact on their publication rate. 7 Of these academics, 61 percent indicated that they had “less time to work on publications.” Respondents were asked to provide additional details on this subject. While some claimed their publication rate was lower because they had to write more grant proposals than usual and spend more time writing those proposals, others mentioned reduced administrative support for grant proposals and reduced travel funds for research and conferences. The increased competition for federal funds after the crisis previously described could explain these comments. An examination of the NSF proposals and awards during the crisis years found that though the number of proposals grew 11 percent, the number of awards fell 1 percent between 2008 and 2010 (NSF 2012).
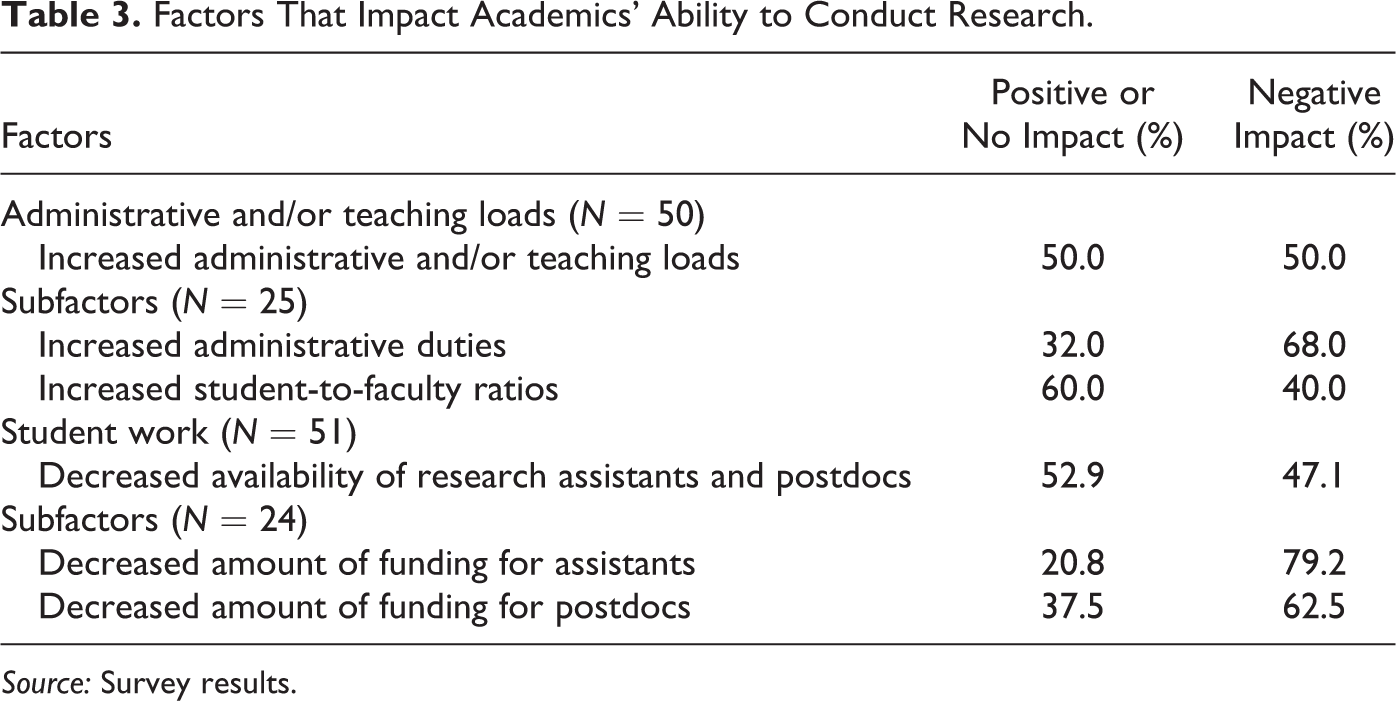
Table 3 displays survey results for two important areas that impacted researchers productivity: administrative and/or teaching loads and student work. Half of the respondents indicated that administrative and/or teaching loads had a negative effect on their research during the recession. Of those academics negatively impacted, 68 percent referred to increased administrative duties due to staff reduction as an important factor, while 40 percent believed the reason to be an increased student-to-faculty ratio. The survey revealed another important factor that should be considered: student work. Of the respondents who experienced a negative impact from the crisis, 47 percent had a reduction in the availability of research assistants and postdoctoral students. In addition, our respondents described a decrease in the amount of funding for research assistants and postdoctoral students as key constraints on their productivity during this time.
Factors That Impact Academics’ Ability to Conduct Research.
Source: Survey results.
Discussion
The results show that both policy makers and research-intensive universities in Georgia continued to place strong emphasis on academic research during the crisis, while the overall funding situation of the higher education sector faced significant challenges. Figures 1 and 2 lend support to the first hypothesis that the amount of research expenditures in universities was maintained before and after the crisis. In fact, all three universities saw an increase in research expenditures during the crisis at a higher growth rate than in the years before the crisis. There were, however, several differences between the universities in terms of the source of research expenditures. Georgia Tech benefited greatly from federal support, while Emory and Georgia State tapped their own institutional resources to fund research activities. These findings cohere with the institutional theory, which suggests that though organizations generally conform to external environmental expectations, their responses may differ based on their own context and mission. A key expectation of policy makers for universities is that their research benefits local economic development, which helps to explain why research expenditures in the three universities studied here continued to grow despite the economic crisis.
With stimulus funding in place, policy makers hoped academics could continue to produce research output at precrisis levels. Previous studies find that the amount of research expenditure is positively correlated with the amount of research output such as publications and patents. Nevertheless, the empirical results in this article have clearly indicated that the approach undertaken by government and universities during the economic crisis was only partial and unable to fully meet desired ends. Figure 3 illustrates a negative impact of the crisis on research performance despite the increase in research expenditures and suggests our second hypothesis is not supported. In the two public universities, research performance in publications, invention disclosures, and patent applications declined continuously after the crisis. That said, Emory was less affected by the crisis than Georgia Tech and Georgia State. While Emory’s research performance in publications and patent applications suffered slightly in the first few years following the crisis, it returned to precrisis level in 2012. Although we only examine three universities in one region, the results clearly demonstrate their was considerable hetereogeniety among universities in terms of research performance during the crisis.
Survey results highlighted several factors that impaired academic researchers’ ability to publish research and disclose inventions, despite an increasing level of research funding. Particularly, academics were faced with heavier administrative and/or teaching loads, mainly as a result of increased student enrollment. By accepting more students, universities increased their income from tuition fees, which allowed them to transfer funds allocated to teaching to supplement the research budget. Barr and Turner (2013) found US universities increased enrollment during the 2008–2013 recession by a larger amount than during the prior 2000–2002 economic downturn. The ways in which the crisis affected this sample of universities is evident in their mandate: Georgia State, a teaching university that always had more students than Emory and Georgia Tech, increased the number of student by 13 percent between 2008 and 2011. Georgia Tech, a public institution but with strong support from privately funded research, increased the number of student by 8 percent. Emory, a private university that relies on offering small classes and on its endowment, increased its enrollment by 9 percent. The enrollment of additional students increased the ratio of student per faculty in all three universities after 2008, but it should be noted that the change in the ratio was different among the universities.
As reported by the majority of survey respondents, there was also a lack of research support in the form of fewer research assistants and postdoctoral students, which constrained researchers. Research assistants and postdoctoral students are integral to research labs and publications. One possible explanation for the inability of researchers to hire the same number of research assistants is related to universities’ overheads. The three universities attempted to fill the financial gap by increasing overhead or indirect costs, which include much of the infrastructure and administrative side of research. According to Stephan (2012), funding agencies in the United States started to cap how much they would pay for overhead in the 1980s. This cap limited overhead to about 55 percent in the late 1990s, but after 2008, the rates returned to 1980s levels. At Georgia Tech, for example, overhead was capped at 51 percent in 2009, 52.7 percent in 2011, and 55.9 percent in 2014. Hence, the new reality for researchers is that no matter how big their research grant, after payment for overheads, they are left with less funds for research assistants, postdoctoral students, and administrative support.
To a large extent, the factors outlined by the survey respondents can also explain why Emory’s research performance was less impacted by the economic crisis than its two public counterparts. First, as a private university, Emory receives less support from state appropriations than other public universities. In Georgia, state appropriations fell 6.8 percent between 2008 and 2013, which had a stronger impact on Georgia Tech and Georgia State than on Emory (Grapevine 2014). In absolute terms, the decline of state appropriations was significant. For example, Georgia Tech received more than US$274 million from state appropriations in 2008, while the amount dropped to just above US$190 million in 2013, leaving a funding gap of US$84 million. Second, the number of students enrolled at Emory is significantly lower than that at the other two public universities, while it has many more faculty members. As Table 1 shows, Emory’s student–faculty ratio is 4.64, in comparison to 23.08 in Georgia Tech and 24.11 in Georgia State. It appears from the data that academics in Emory are better positioned to manage the challenges brought by increased student enrollment than their counterparts at the other two universities, although other institutional differences, such as research intensity and mandate, likely also influence this relationship.
Although data are not available nationally for each US university’s research output, we made use of AUTM data on a sample of universities that report to AUTM for the entire 2002–2015 time period in order to calculate growth paths of their aggregate research output and provide some national context for our results. These data include 119 universities (25 private and 94 public), including 4 entire university systems. Georgia Tech and Emory are included in the 119, while Georgia State is not, however, several universities that rank closely to Georgia State in the global rankings are in the 119 sample. Growth paths are provided in Online Appendix 3. Because these are aggregations we lose some detail, however, it is clear that though R&D expenditures continued to increase nationally (see Figure 1), there was a clear drop in research performance during the financial crisis. The drop appeared to be more acute for public universities, a relationship which appears to hold for our two public universities as well, especially in terms of patent applications and invention disclosures. Emory seems to mirror most closely the overall US and private university US trends, with Georgia Tech and Georgia State showing more variation. 8 The national sample also shows research performance did increase again even toward the second half of the recession, but postcrisis growth rates appear lower than precrisis rates.
A final consideration in the discussion of our results is that while there are different definitions and measurements of research performance, this article examines only one: the input–output efficiency of research funding. Another common indicator of research performance is research output per capita (the number of research outputs per faculty). Instead of analyzing the efficiency of research funding, this definition aims to examine how productive academics are in producing outputs. For the three universities examined here, the number of faculty is only available for Georgia Tech over the whole period, while for Emory and Georgia State, we can only access the information for the past five years (nearly the end of the crisis). In 2002, Georgia Tech had 848 faculty, and this number increased by 13.3 percent to 961 in 2007. After the crisis, the number of faculty continued to grow, although at a lower rate (8.7 percent between 2008 and 2013). Adopting this research performance measurement, we present Georgia Tech’s research performance per capita growth paths between 2002 and 2015 in Figure 4. Georgia Tech’s performance in publications was stable in the first three years after the crisis and then started to improve. In the case of inventions disclosures and patent applications, Georgia Tech’s research performance continued to decline after the crisis. These findings are consistent with those using the input–output ratio (Figure 3), lending further support to our findings.
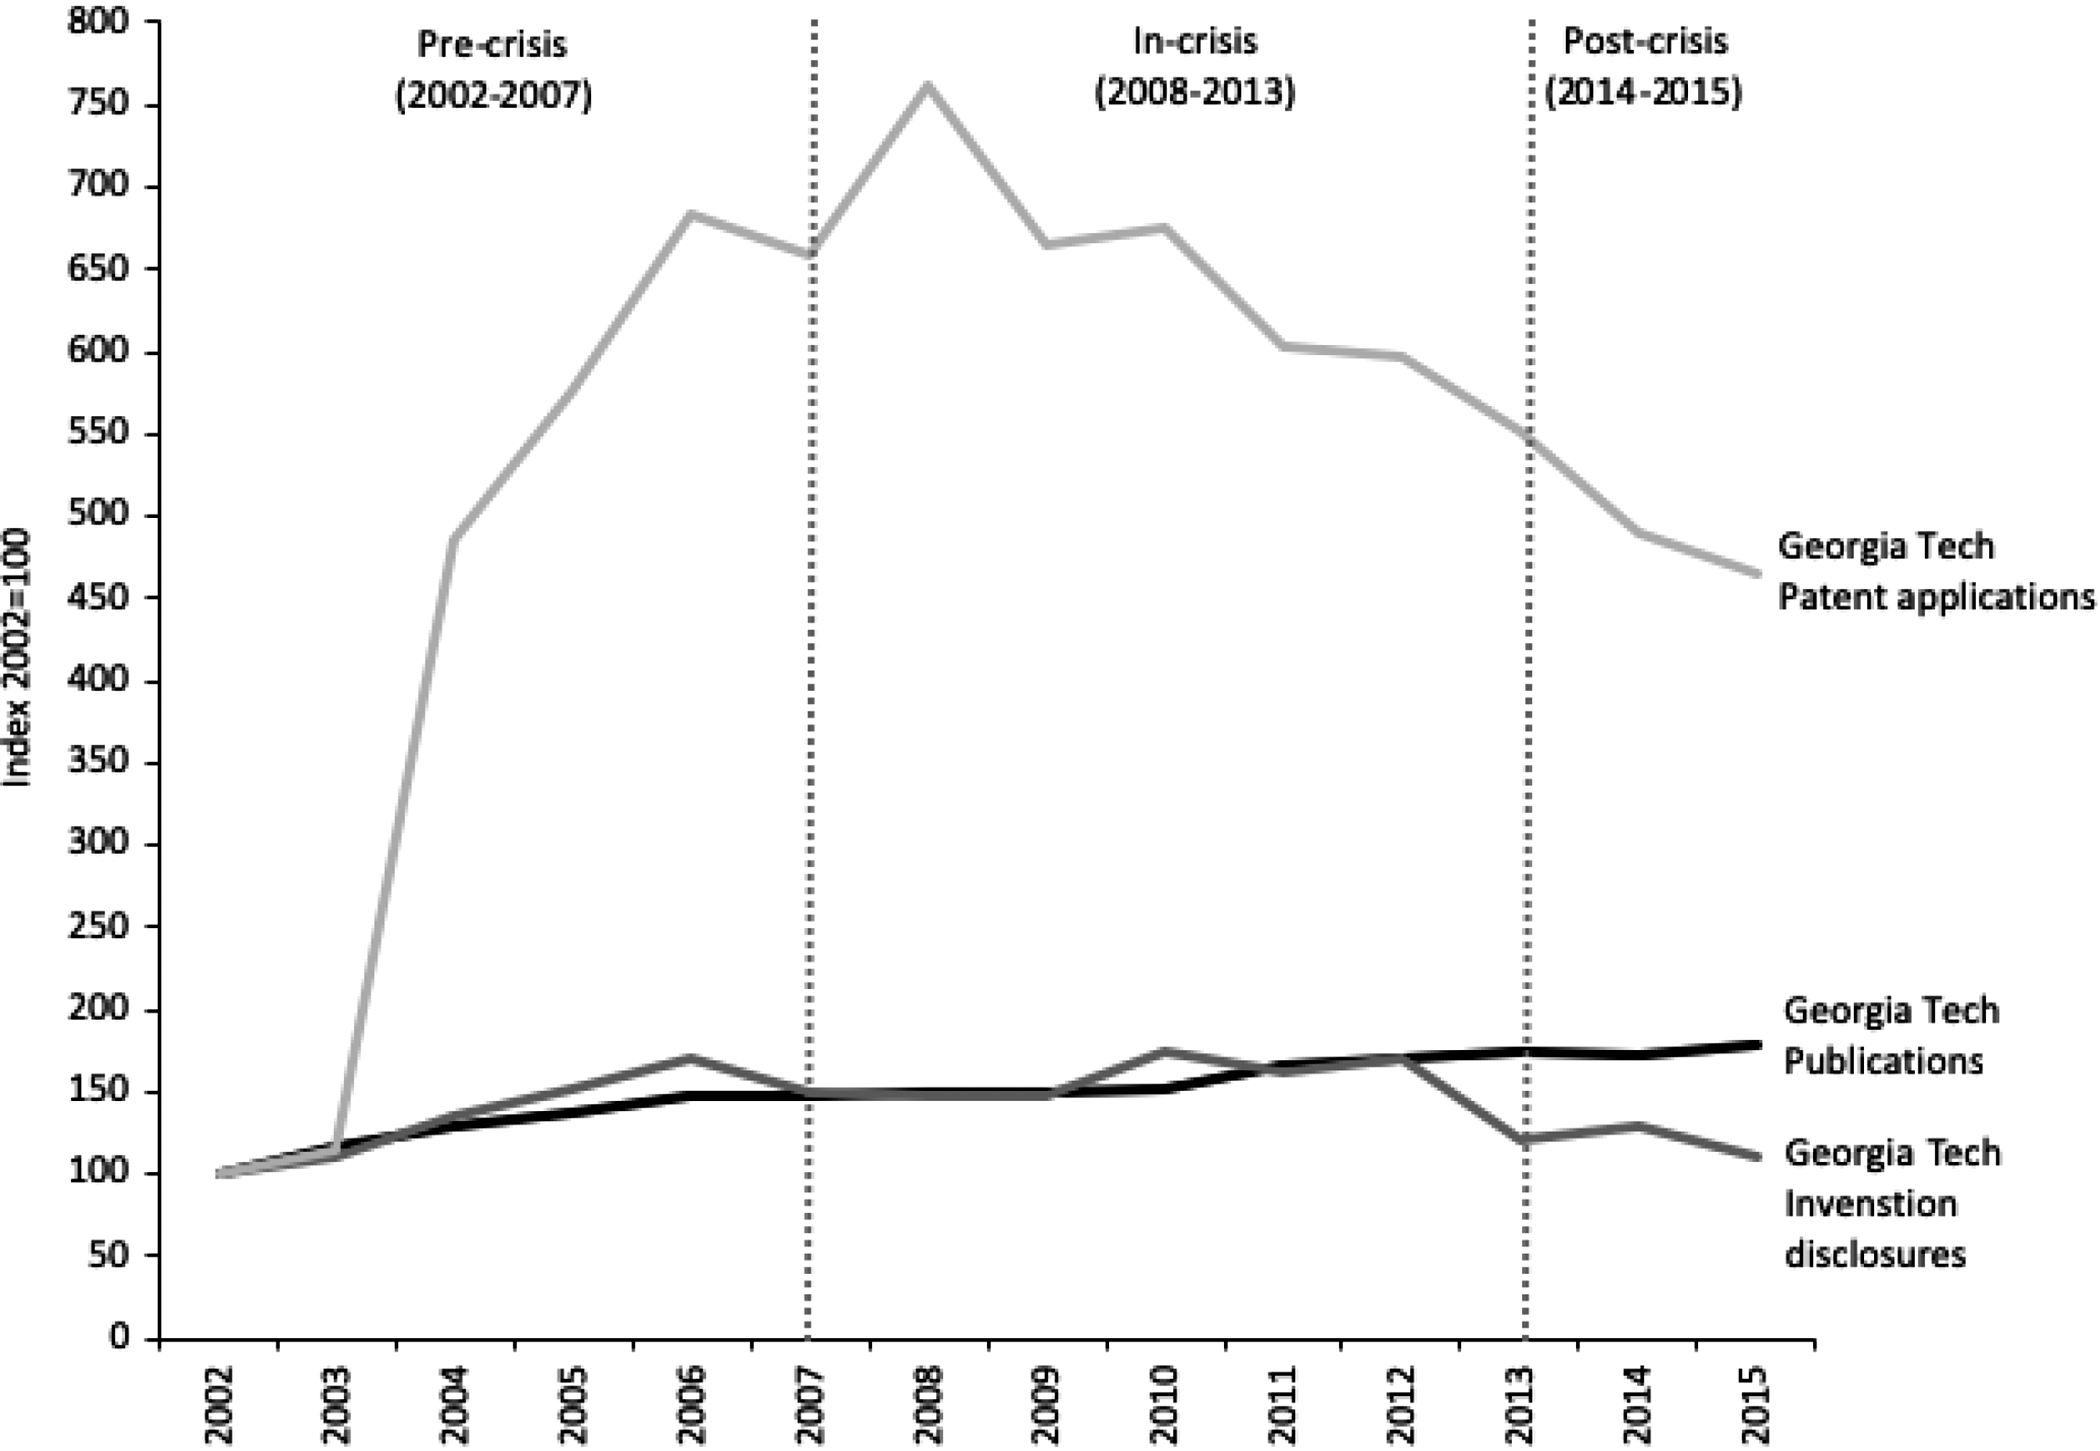
Growth paths of research performance on a per researcher basis in Georgia Tech, 2002–2015.
In sum, the analysis presented here finds that research performance at three research-intensive, Atlanta-area universities was negatively influenced by the 2008 financial crisis. The need to write more grants and spend more time on each grant due to the higher level of competition for funding provides an explanation for the reduction in publication rate. Other explanations are drawn from the fact that universities, mostly because of reductions in state funding, were less capable of funding research assistants and postdoctoral students, had less administrative support, and had to deal with a higher student–faculty ratio. Reduced state funding and endowment returns forced universities to allocate more institution funding for research, some of which was supposed to be used for teaching and administration. Although both policy makers and universities had a clear focus on supporting research, it is evident that academics could not produce research output at a similar level as they did prior to these changes. An urgent task for policy makers is to reevaluate the approach and consider the diversity of direct and indirect constraints on research performance. This research highlights a disconnect between how research funding is allocated to, and within, universities and how research actually takes place on the ground.
Conclusion
The article set out to analyze the impact of economic crisis on research funding and output in three research-intensive universities in one region that each responded to the crisis in different ways based on their institutional setting. The role of universities is an important topic in debates on local economic development, but the 2008–2013 crisis made this investigation even more critical. While the amount of research expenditures continued to increase in the three universities after the crisis, research productivity declined. Although existing studies indicate a strong correlation between research funding and publication and commercialization, the analysis here shows that the correlation decreased in the crisis period. In other words, university researchers suffered in their ability to transform research funding into publications and inventions. This finding is contrary to the hope of federal policy makers who increased R&D funding levels in an effort to dissuade the effects of the crisis on university research. Our survey results indicate that both increased administrative and/or teaching loads and decreased availability of research assistants and postdoctoral students might have reduced the time available for faculty to conduct research.
An alternative explanation of these findings is that research performance may have changed because of other institutional changes going on in the three universities. Our study is at the university level, but practices inside the university vary across schools and departments. For example, the life sciences generally bring in more research funding in terms of total dollar amount than social sciences and humanities. The change in composition of research expenditure across departments in a university might also impact on its research performance, due to the fact that the output norms across disciplines vary substantially. Therefore, to examine whether there were any significant changes in the composition of research expenditure across fields that might confound our results, we analyzed the NSF research expenditure data across major academic fields over the period of 2002 to 2015 in each of our three universities.
As expected, we found that Georgia Tech’s research expenditures are dominated by two fields (engineering and computer sciences), which account for around 80 percent of total research expenditures throughout the entire time period. Over 90 percent of Emory’s funding is for life sciences, and this amount is consistent throughout the 2002–2015 time period. In contrast, Georgia State’s research expenditures are more diversified. Here, the life sciences, physical sciences, social sciences, and education fields receive the most funding. Since the beginning of the crisis, Georgia State experienced changes in the share of research expenditures in science, technology, engineering, and mathematics (STEM) fields and non-STEM fields. In 2008, STEM fields accounted for more than 60 percent of Georgia State’s total research expenditures, while this share declined to less than 50 percent in 2015 as the university increased its investment in non-STEM fields.
Overall, these findings indicate that the composition of research expenditures at Georgia Tech and Emory did not change in ways that would confound our results. Although Georgia State’s overall funding of STEM fields, which generally produce the most patents and invention disclosures, continued to increase, the decreased ratio of STEM to non-STEM funding at the university makes it difficult to be certain that some of these institutional changes were not driving growth path changes. Publication rates would be less influenced by these changes, however, and we do see a slight decrease despite this change. As shown in Figure 3, patent application rates even saw a significant increase during this time at Georgia State. Therefore, we argue any changes were not severe enough to drive our results for Georgia State.
As mentioned previously, this study is focused on three research universities in Atlanta, Georgia, which limits generalizability. Nevertheless, since we focus on three very different universities that operate distinctively along a number of criteria including private/public status, economic development mandate, orientation toward technology commercialization, faculty–student ratio, endowment and state appropriations levels, and amount of total research expenditures, we provide important insight on how economic crises can differentially influence research performance of universities situated in the same city and state. Furthermore, results provide useful information for any policy maker or university leader considering improvements that could be made in response to future recessions. Our brief national comparison indicates Emory likely mirrors the national trend of research performance for private universities, while Atlanta’s two public research universities may have had a more difficult time recovering from the crisis than other research-intensive unversities in the United States who report to AUTM. Importantly, the survey results show that the relationship between economic recession and university research output is not straightforward. The impact was often felt by faculty in terms of having to spend more time writing grants at a time when grants became even more competitive to acquire. It is well established that many people go back to school during economic downturns, and one survey respondent noted the difficulty of supporting the increased number of students with the decreased number of resources available to faculty.
Future Research
While this article mainly focuses on the quantity of research outputs, future research could examine the quality of research outputs. For example, it would be interesing to examine whether the crisis decreased the overall quality of academic research by examining the long-term citation patterns of publications and patents by other local academics and industry researchers. Considering both aspects of research outputs would improve our understanding of the role of the university in regional economic development. Examination of collaborative and contract research trends between university and industry, government, or other institutions during the recession would also be an interesting area for future research. Such work may require the use of large-scale surveys on academics and businesses to reveal the breadth and depth of university–industry interactions and if they were impacted by the crisis.
It is critical that future research continues to explicate the outcomes of this crisis for higher education and their subsequent indirect impacts on local economic development. After the crisis, many news and media articles focused on the impact on students (The Economist 2015). We know that when tuition increases, accessibility to higher education decreases, creating a social and economic divide and leaving graduates with huge debts. What has been lacking in this discussion is the impact on researchers and research output, both of which confronted a new reality after the crisis began. Increases in student enrollment and overhead will likely continue. Although state appropriations have risen somewhat, they have not yet returned to their pre-2008 levels. Even if those levels recover, however, it seems unlikely that universities will reduce tuition and overhead costs. As shown in the analysis, these trends impacted the private institution studied as well, even though by 2013 endowment returns were rising back to normal levels (Barr and Turner 2013). For policy makers who have consistently pushed for universities to supplement industrial R&D, the data suggest that changes in funding for universities in times of austerity might need to be put in place.
Supplemental Material
sj-pdf-1-irx-10.1177_0160017619869788 - The Hope Fulfilled? Measuring Research Performance of Universities in the Economic Crisis
sj-pdf-1-irx-10.1177_0160017619869788 for The Hope Fulfilled? Measuring Research Performance of Universities in the Economic Crisis by Qiantao Zhang, Paige A. Clayton and Shiri M. Breznitz in International Regional Science Review
Supplemental Material
sj-pdf-2-irx-10.1177_0160017619869788 - The Hope Fulfilled? Measuring Research Performance of Universities in the Economic Crisis
sj-pdf-2-irx-10.1177_0160017619869788 for The Hope Fulfilled? Measuring Research Performance of Universities in the Economic Crisis by Qiantao Zhang, Paige A. Clayton and Shiri M. Breznitz in International Regional Science Review
Supplemental Material
sj-pdf-3-irx-10.1177_0160017619869788 - The Hope Fulfilled? Measuring Research Performance of Universities in the Economic Crisis
sj-pdf-3-irx-10.1177_0160017619869788 for The Hope Fulfilled? Measuring Research Performance of Universities in the Economic Crisis by Qiantao Zhang, Paige A. Clayton and Shiri M. Breznitz in International Regional Science Review
Footnotes
Declaration of Conflicting Interests
The author(s) declared no potential conflicts of interest with respect to the research, authorship, and/or publication of this article.
Funding
The author(s) received no financial support for the research, authorship, and/or publication of this article.

Supplemental Material
Supplemental material for this article is available online.
Notes
References
Supplementary Material
Please find the following supplemental material available below.
For Open Access articles published under a Creative Commons License, all supplemental material carries the same license as the article it is associated with.
For non-Open Access articles published, all supplemental material carries a non-exclusive license, and permission requests for re-use of supplemental material or any part of supplemental material shall be sent directly to the copyright owner as specified in the copyright notice associated with the article.
