
Abstract
The food industry is the most important industrial activity in Spain in terms of production and employment; its spatial concentration is considerable. However, there is a lack of quantitative research on its agglomerations, especially at high levels of spatial and sectorial disaggregation. With the study presented, this deficit is addressed, using systematic and quantitative methods to examine the spatial agglomeration in the subsectors that the food industry is specialized. Spanish food industry clusters have been identified by applying a top-down quantitative methodological approach—the cluster index—and following a high level of territorial and sectorial disaggregation. Clusters were identified at the three- and four-digit sectorial disaggregation. The number of four-digit-level relevant clusters was higher than three-digit disaggregation. This evidence was verified using nonparametric statistical tests (Wilcoxon signed-rank test). Furthermore, the analysis of four significant three-digit subsectors allows us to advance two alternative explanations for the divergent results at the different levels of the analysis (three digits vs. four digits). This partly explains the potential competitiveness of Spain in the food industry and shows the possibility of establishing policies for the development of clusters.
Introduction
The scholarship generally recognizes that firms tend to agglomerate geographically. Since Alfred Marshall’s (1920) initial reflections on localized industries, it has been argued that firms in the same sector tend to concentrate geographically due to the benefits derived from external economies. Industrial organization models, such as industrial districts (Becattini 1979, 1989, 1992; Bellandi 1986; Sforzi 1987, 1990; Brusco 1992; Signorini 1994; Dei Ottati 1995) or clusters (Porter 1990, 1998, 2003; Delgado, Porter, and Stern 2010), explain how spatial concentrations emerge, forming a system that conditions the operating modes, efficiencies, and results of the companies that are part of them. These models emphasize the idea that locating with other related companies allows the firm to enjoy external economies such as those derived from access to qualified human resources, specialized suppliers, and technological spillovers (Krugman 1991) with benefits of lower costs and productivity improvements. These positive agglomeration externalities are locally limited and only nearby firms can enjoy them (McCann and Folta 2008).
The territorial agglomeration concept has permeated existing theoretical and applied economic analysis. Renewed interest in considerations of the spatial dimension of the economy has generated a broad and diversified body of literature, which had an extraordinary boom in the 1990s (Porter 1990; Krugman 1991; Fujita and Mori 2005). The ever-increasing number of publications worldwide on clusters and industrial districts (see literature reviews by Ketels 2003; Cruz and Teixeira 2010; Martínez-Fernández, Capó-Vicedo, and Vallet-Bellmunt 2012; Capo-Vicedo et al. 2011; Lazzeretti, Sedita, and Caloffi 2014; Hervás-Oliver et al. 2015) reflects the popularity and relevance of these models.
Most studies have emphasized the influence of location on firm performance. Production costs can be lower in agglomerated spaces, due to local access to specialized labor and inputs such as suppliers or manufacturing facilities (Krugman 1991). However, the greatest impact derives from the generation and diffusion of innovation and knowledge caused by the proximity among space members (Signorini 1994; Fabiani et al. 2000; Camisón and Molina-Morales 1998; Spencer et al. 2010; Li and Geng 2012; Feldman 2014). In bounded geographical contexts, proximity to similar organizations favors formal and informal networks, providing a dense structure and strong ties that improve the quality of mutual exchanges of knowledge (Tsai and Ghoshal 1998; Zahra, Ireland, and Hitt 2000; Yli-Renko, Autio, and Sapienza 2001; Boschma and Ter Wal 2007; Molina-Morales and Martínez-Fernández 2010). In fact, many authors have considered that firms in geographical clusters with an abundance of social interactions improve their position to access new information, ideas, and opportunities, which explains the potential advantages of clustered firms (McEvily and Zaheer 1999; Trigilia 2001; Cooke 2002; Wolfe 2002). Factors that boost knowledge exchange and innovation processes are linked to the intensity of interactions between cluster members, face-to-face interactions, short cognitive distances, common language, trustful relations between various actors, easy observations, and immediate comparisons (Malmberg and Maskell 2002).
From this approach, the idea that has been strengthened is that specialized agglomerations can improve industrial and regional competitiveness. Therefore, in many cases, clusters have become a very attractive model to foster regional development, and governments strive to create an environment that supports them (Preissl and Solimene 2003; Commission of the European Communities 2008). In the last two decades, cluster policies have been widely promoted by international organizations, such as the Organization for Economic Cooperation and Development (OECD) and the European Union, and have been proliferated worldwide both regionally and nationally (Benneworth et al. 2003; Sölvell, Lindqvist, and Ketels 2003; Ketels, Lindqvist, and Sölvell 2006; Europe Innova 2008). By supporting the development of clusters, policymakers hope to boost innovation, increase job creation, and increase regional competitiveness (Feser 2008; Huggins and Williams 2011). Policymaker action must be directed predominantly toward areas of existing strength: that is, areas where clusters or emerging clusters already exist (Sölvell, Lindqvist, and Ketels 2003; Ketels 2013). Therefore, prior to the implementation of actions, information about the geographical area and the sector of activity in which the cluster operates is required. A useful tool is a cluster map that provides a geographic footprint of specific clusters and the specialization profile of a given region (Ketels 2017). A cluster map could confirm the existence of known phenomena, but it can also point to new emerging clusters.
A literature review on clusters and industrial districts shows that different methodologies have been used to identify these agglomerations (Bergman and Feser 2020). Two approaches have emerged: top-down analysis, which generally relies on quantitative data to deduce the industrial structure of a regional economy; and bottom-up analysis, or qualitative-type case studies in a given region, which examine the inner workings and interfirm connections of a particular cluster in a particular location.
In the context of the second approach—qualitative-type case studies in a specific sector/location—numerous studies have focused on specialized food-related industries. The first studies in this field emerged in the early 1990s (Iacoponi 1990; Fanfani 1994). Since then, several empirical studies have shown the presence of agrifood districts in Italy for specialized products (Bertolini 1998; Brasili and Ricci Maccarini 2003; Bertolini and Giovannetti 2006). Following this approach, other studies have focused on different European countries (Lagnevik et al. 2003). Agrifood clusters in Spain have also been analyzed, such as olive oil in Andalusia (Sanz Cañada and Macías Vázquez 2005), the case of Valencian citrus (Gallego Bono 2007), the Iberian ham cluster (Diez-Vial 2011), and the foodstuffs (nougat) cluster in the Valencia region (Molina-Morales et al. 2015). Numerous documented examples of clustering activity in the food sector focus on wine clusters (Porter 1998; Giuliani and Bell 2005; Morrison and Rabelloti 2009; Beebe et al. 2013; Hira and Swartz 2014; Aldecua et al. 2017). Studies have also considered Latin American countries (Dirven 2001; Boucher and Requier-Desjardins 2005; Mancini 2013; Crespo, Réquier-Desjardins, and Vicente 2014).
On the other hand, the literature review shows that very few studies have sought to identify agrifood clusters in a territory using systematized methods and based on quantitative data. Quantitative techniques have been used to identify clusters (Porter 2003; Delgado, Porter, and Stern 2016) and industrial districts, such as, notably, the methodology used in Italy by Sforzi (1987, 1990) and ISTAT (1996, 2006) and applied to the case of Spain by Boix and Galletto (2006, 2008), Ybarra et al. (2008), and Boix et al. (2015). There are also some studies with quantitative methodologies that have added a qualitative analysis to refine their results (Hernández, Fontrodona, and Pezzi 2005; Aranguren et al. 2008, 2011). The analyses that they offer of the food processing industry are mainly based on aggregate sectorial classification—usually with a sectoral disaggregation at two digits—or are limited to specific regions. However, the food-related industry has specific characteristics that make it difficult for studies carried out at a high level of sectoral aggregation to detect specialized areas. We highlight two facts that are characteristic of this industry that can hinder cluster identification. On the one hand, the sector presents heterogeneity because it is made up of very different subsectors. The spatial distribution is very complex, with different spatial patterns observed based on different conditions: proximity to natural resources, proximity to demand, and so on. Furthermore, this heterogeneity means that there are subsectors that include very different activities within each. In many cases, these activities have a very different participation in the complete subsector (e.g., number of companies, employment), and they present diverse location patterns. Secondly, there is a wide dissemination of these types of activities throughout the territory (dispersed location). The agrifood industry is characterized by a predominance of small-sized companies that are diffusely distributed at a spatial level. All these localization patterns may hide specialized food-related industry agglomeration processes in which external economies have a relevant role.
The Spanish food industry is a major industry sector. However, it is not known in detail whether there are agrifood industry spatial agglomerations and, specifically, whether there are spatial agglomerations of its subsectors and where the different specializations are located. This article tries to identify agglomerations that specialize in agrifood industry subsectors throughout the Spanish territory. The heterogeneity of the Spanish agrifood industry, with over 360,000 employees belonging to thirty-five different subsectors, means that aggregate-level analyses are inadequate (Cluster Competitiveness Group 2007). The present research sought to overcome this gap in the literature and evaluate whether food industry spatial agglomerations exist at the three- to four-digit level of disaggregation throughout the Spanish territory, based on Statistical Classification of Economic Activities in the European Community (NACE-Rev.2). Some analyses have applied a high degree of sectorial disaggregation (Unioncamere 2009; Giner and Santa-María 2017, 2018b; Hoffmann, Hirsch, and Simons 2017), but in the case of Spain, no study has been carried out at a four-digit sectorial disaggregation level.
Therefore, our research can contribute to enriching the mapping of industrial agglomerations using quantitative methods by the advantages of the applied methodology because of both the high sectoral (four-digit level) and territorial (local labor systems) disaggregation and the applied index. The cluster index (CI) used in this research corresponds to that suggested by Sternberg and Litzenberger (2004) to identify industrial clusters and has as its main advantage that a value for each analyzed area/sector can be derived. Other advantages of this index are based on its multidimensional nature, incorporating the information and dimensions of three relevant location aspects: relative industrial stock (IS), relative industrial density (ID), and relative plant size (PS). Another advantage is its continuous character. The outstanding advantages outweigh the possible limitations of the Italian methodology used in the mapping of industrial districts applied to Spain (Boix and Galletto 2006, 2008; Boix et al. 2015).
Regarding other similar studies, our methodological contributions and results are based on two fundamental features. Differential results according to sectorial disaggregation (three-digit vs. four-digit level) are verified through nonparametric statistical hypothesis testing. This mean that we can identify clusters that do not appear in another research. Furthermore, the analysis of spatial location of some significant three-digit subsectors in the Spanish food industry with quantitative measures allows us to explain the divergent results at different levels of the analysis (three digits vs. four digits).
This article is in line with the research on statistical methods and technical tools that tries to provide more objective ways to identify clustering processes using quantitative techniques with top-down approaches. The results of our research, along with our empirical analysis, provide an analytical identification framework applicable in the case of the identification of clusters in industries with a complex structure of subsectors with heterogeneous spatial patterns. This analytical framework can be implemented in the future to other industries with these features. In addition, this new analytical framework can promote the development of new qualitative research and assist in supporting the decisions of cluster policymakers.
This study is structured in five further sections: the second section presents a literature review—spatial agglomeration theories, social network approaches, and agrifood industry agglomerations—and a preliminary analysis of the Spanish agrifood industry. Following a theoretical review, the third section describes the methodology used in this study to identify and analyze agrifood clusters. Analytical data are presented in the fourth section, and the results are described in the fifth section. The final section presents our conclusions. The results may be of interest to researchers in this field and can assist policymakers in formulating policy measures aimed at supporting the development of clusters.
Theoretical Background
Spatial Agglomeration Theories: A Review
Theories on spatial agglomeration have existed in the academic literature for many years and have recently aroused greater interest in the domain of economic geography analysis. These studies are rooted in the pioneering ideas of Alfred Marshall (1920) on the advantages of territorial firm agglomerations and the notion of industrial districts, which the author put forward at the beginning of the twentieth century. Since then, various theories have been proposed to explain the formation of spatial agglomerations. Thus, during the 1970s and 1980s, three theoretical approaches arose that share both a geographic perspective, based on proximity, and a sociological one, based on social networks (Martin and Sunley 2003). One of these theoretical streams comes from the Italian school that focuses on the conceptualization of the industrial district (Becattini 1979, 1989, 1992; Bellandi 1986; Sforzi 1987, 1990; Brusco 1992). This way of organizing the production activity and the cooperative and competitive relationships are the origin of some competitive advantages that can only be enjoyed by companies located within the district. In particular, the solid bonds of trust generated foster the dissemination of formal and informal knowledge (Sengenberger and Pyke 1992; Bellandi 1996).
A second approach comes from the Groupe de Recherche Européen sur les Milieux Innovateurs with the notion of “innovative milieu” (Aydalot 1986; Aydalot and Keeble 1988; Camagni 1995). The innovative milieu literature highlights the territorial nature of innovation, often at a local or subregional level. It is not territory as a medium that is important, but the bringing together of economic players and nonmaterial resources (training, research), which, through their interactions, leads to the development of specific skills, know-how, and rules, among others (Maillat 1998). In addition, the history of an area, its collective behavior and its internal structure of unanimity, becomes especially relevant in the innovation process (Aydalot 1986). The concept of innovative milieu highlights that the quality of relational capital within a milieu determines its success.
Other related territorial innovation models are regional innovation systems (Iammarino 2005; Lundvall 1992; Braczyck, Cooke, and Heidenreich 1998; Cooke, Gómez Uranga, and Etxebarría 1997; Capello and Lenzi 2018), smart regions, learning regions, or learning territories (Asheim 1996; Florida 1995; Morgan 1997; Antonelli and Ferrão 2001; Jambes 2001). These models share the notion that relationships among companies themselves and with other agents in the environment are decisive to build knowledge and to improve companies’ learning mechanisms and capacity to innovate.
The third approach derives from the Californian school (Storper and Scott 1989) with the concept of “new industrial spaces” (Scott 1988) that try to explain how territorial enterprise systems emerge and function after the crisis of Fordism. Their research highlights how the agglomeration of activities allows for the flexible organization of production that, in turn, leads to decreasing costs and greater efficiency and competitiveness of companies. The agglomeration not only contributes to lower production costs but also to a reduction in transaction costs, since proximity translates into lower costs and greater opportunities to combine needs and capabilities (Scott and Storper 1992).
Subsequently, the analysis of the spatial dimension of the economy and industrial agglomerations will be widely disseminated with the emergence of the cluster concept (Porter 1990). Porter’s cluster theory stems from his research, in the late 1980s and early 1990s, on international competitiveness and national competitive advantage (Martin and Sunley 2003). He focused mainly in his early study on industrial phenomena, emphasizing that competitive sectorial clusters are determined, within a nation, by strong vertical and horizontal relationships. Porter (1998) turned toward the territorial dimension, regarding geographical concentration as inherent to the cluster concept. The clusters are, in most cases, trans-sectorial (vertical and lateral) networks that include complementary companies that are specialized in a specific link in the value chain. An important factor is the relationship between companies and partner institutions such as universities, consultancies, research associations or institutes, and knowledge-intensive service companies (Porter 1998, 2000). On the other hand, with regard to the relationships that take place between the companies, Porter points out how clusters intensify both competition and cooperation relations. Cooperation agreements allow for the exploiting of complementarities and economies of scale and scope as well as increasing companies’ flexibility and speed of reaction to environmental changes (Porter 1998). In addition, competitive pressure and constant comparison with other companies promote research and development (R&D) strategies and the introduction of new technologies.
The study of firms’ agglomerations has been revitalized in the framework of the “new economic geography” (NGE; Krugman 1991). Since the 1990s, the NGE has tried to explain the broad range of forms of economic concentration in geographical areas (Fujita, Krugman, and Venables 2001). The theoretical arguments of these contributions to explain the concentration is that the initial location decisions—which may come from the initial advantages of a geographical area, for example, due to the presence of natural resources or transport facilities—can cause effects positive diffusers generating an inertia that, in turn, guarantees greater efficiency and, therefore, maintains the activity in that area although the initial conditions are modified or may even disappear. The NGE shows the renewed interest of conventional economists in spatial analysis through the development of a new generation of spatial agglomeration models.
All the theories and studies cited have tried to explain the reasons that led to the formation of a firm’s agglomeration in the territory and how these agglomerations can catalyze regional competitiveness. As key elements present in all of them, spatial proximity, the interrelatedness of capabilities and activities, interactions between agents and institutional endowment stand out. However, although the literature highlights the benefits of firm agglomeration, there are also studies that have shown possible disadvantages of being in an area of agglomeration (Folta, Cooper, and Baik 2006; Shaver and Flyer 2000). A higher number of companies in the same location can generate congestion costs within the region, with negative implications for company performance (Prevezer 1997). In addition, competition for workers, land, and public services increases, leading to scarcity and higher costs. There is also a greater risk that knowledge will be expropriated by geographically close rivals (Shaver and Flyer 2000). Such congestion costs increase the possibility of the appearance of diseconomies of agglomeration. These agglomeration diseconomies play an increasingly important role in the way the cluster evolves (Folta, Cooper, and Baik 2006) by creating a deterrent effect for the location of companies in that area. Finally, recent studies have shown how companies do not benefit equally from being in an agglomeration, since knowledge flows may be contingent upon firm characteristics such as firm size, the strategic orientation of the firm, or alliance activity (McCann and Folta 2011).
Agglomeration of Firms: Social Network Approaches
Most of the literature on firms’ agglomerations emphasize that proximity facilitates the exchange of knowledge, especially tacit knowledge, between companies and among their own employees. This idea is what sustains the so-called relational turn within economic geography. The relational approach highlights the role of socioinstitutional networks in the economic success of certain territories, especially in the exchange of knowledge and in the improvement of the innovation process. In this relational approach, the concept of social capital and network analysis stands out. In fact, many authors have considered the idea of social or relational capital to be inherently spatial (Martin 1994; Staber 2001). In bounded geographical contexts, proximity among similar organizations favors diverse forms of social capital (McEvily and Zaheer 1999) and has been considered a factor explaining the potential advantages of clustered firms (Trigilia 2001; Cooke 2002; Wolfe 2002).
Existing literature already supports the connection between the concepts of clusters and networks. A cluster can be defined as a network within a production context in a geographically defined area (Boschma and Ter Wal 2007; Parrilli and Sacchetti 2008). Contexts of geographical proximity, such as those defined as industrial clusters (Porter 1998; Tallman et al. 2004; Inkpen and Tsang 2005), can be viewed as networks, since many different actors, including final product firms, suppliers, customers, service providers, local institutions, and policy agents, interact, evolve, and contribute to a specific geographical context performance. Firms in clusters are connected through a variety of formal and informal networks, providing greater strength to local relations. These networks have a decisive role in building trust and disseminating tacit knowledge, which favors competitiveness and innovation (Scott 1988). Clusters and industrial districts represent local configurations that are high in social capital and are characterized by mutual trust, cooperation, and an entrepreneurial spirit, as well as by a multitude of small local firms with complementary specialized competencies (Trigilia 2001; McEvily and Zaheer 1999).
There is evidence that intensive social interactions in these areas foster knowledge exchanges and enable actors to gain access to other actors’ resources (Zahra, Ireland, and Hitt 2000; Yli-Renko, Autio, and Sapienza 2001; Boschma and Ter Wal 2007). Proximity facilitates the redundancy of relationships and face-to-face contacts as well as the building of common norms and values. Information and trust are referred to in terms of qualities that would restrict opportunism as a resource that prevents cheating or fraud in business (Trigilia 2001; Staber 2001). On the other hand, a shared vision allows for more fluent transmission. A shared vision is identified as a shared code or paradigm, which facilitates a common understanding of the collective objectives and the proper ways to act within a social system (Nahapiet and Ghoshal 1998). In addition, as intermediaries, local institutions facilitate the acquisition of competitive capabilities by compiling and disseminating knowledge and by reducing search costs (Baum and Oliver 1992; McEvily and Zaheer 1999; Molina-Morales and Martínez-Fernández 2010; Belso-Martínez 2015; Belso-Martínez et al. 2018). Consequently, a firm with an abundance of social interactions is likely to have a greater capability to combine and exchange resources with other actors and so enhance its innovation capacity (Tsai and Ghoshal 1998).
However, as Yli-Renko, Autio, and Sapienza (2001) have argued, the degree to which companies use their external networks to acquire and exploit knowledge is regulated by the amount of social capital they possess. Firm-level characteristics, such as basic knowledge, determine how the firms are joined in local networks, benefiting from external resources (Boschma and Ter Wal 2007). These attributes will determine the differences between companies in the cluster when it comes to exploiting the advantages of the location.
On the other hand, an extensive body of literature exists that directs its attention in the spillovers of knowledge. It is a popular idea that firms located in clusters benefit from local knowledge spillovers. Spillovers are the unintentional transmission of knowledge to others beyond the intended boundary. Knowledge created by a local agent can be accessed and used by other agents without market interaction and financial compensation for the producer of the knowledge (Asheim 1996; Morgan 1997; Malmberg and Maskell 2002; Bathelt, Malmberg, and Maskell 2004). Taking up the idea of Marshall’s “industrial atmosphere,” current debates often involve similar ideas on local knowledge flows such as the neologism’s local “buzz” (Bathelt, Malmberg, and Maskell 2004; Storper and Venables 2004) and “noise” (Grabher 2002).
Knowledge spillovers are highly localized, and physical proximity matters since it increases the actors’ probability of contacts and, hence, the flow of information exchange among them (Audretsch and Feldman 1996; Jaffe, Trajtenberg, and Henderson 1993). This is especially important in the case of tacit knowledge exchange, which is highly contextualized and impossible to codify, and it therefore requires face-to-face interactions, regular copresence, and a shared local social context (Morgan 2004; Storper and Venables 2004). It has been argued that the colocation of economic actors leads to greater face-to-face interaction (Bathelt, Malmberg, and Maskell 2004; Depner and Bathelt 2005; Gertler 2003; Rekers and Hansen 2015) and that much of this interaction is not planned, but mostly the result of happenstance and chance meetings associated with living and working in high-density and diverse environments. Density generates opportunities for repeated contacts and the serendipity of casual exchange in a known local milieu (Amin and Cohendet 2005). In this way, frequent chance, casual, and/or serendipitous interactions between economic actors in clusters lead to greater innovation (Lee and Rodrıguez-Pose 2013).
However, a few recent empirical contributions have suggested that the knowledge advantages of clusters might not be so clear-cut (Giuliani 2007; Moodysson 2008). Even in cases in which interaction leads to economically viable knowledge being exchanged, the knowledge in circulation may be not new or even redundant. In addition, in relatively closed systems, the knowledge exchange may be at risk of lock-in, effectively limiting the potential for implementation of new technologies or the identification of new market possibilities (Boschma 2005). In the same way, it is not clear that companies in clusters collaborate more or that this collaboration is the result of face-to-face interactions (Grillitsch and Nilsson 2015). Recent studies have shown that most relationships tend to be purpose-built, and firms that rely on partnerships based on casual encounters do not innovate significantly more than firms without any self-declared important partners (Fitjar and Rodriguez Pose 2017).
Agrifood Industry Agglomerations: Literature Review
Industrial district and cluster theories have been the starting point for numerous studies focused on specialized food-related industries. In these cases, food processing firms, farmers, suppliers of inputs (such as fertilizers and chemicals, packaging, plastics, and machinery), service companies, and public and private institutions are located within a well-defined area. The first studies in this field arose in the early 1990s. Iacoponi (1990) was the first to introduce the concept of industrial districts into agricultural research. In his work, he pointed out how in the distretto agro-industriale, all enterprises are bound together in a sort of collective production process, in which semi-finished products are exchanged at very low transaction costs in a quasi-market. Fanfani (1994) analyzed certain areas of Northern Italy and showed the main characteristics of the agrifood districts not only in terms of their origin but also in terms of their structural organization and dynamic transformation. Since then, several empirical studies have shown the presence of agrifood districts in Italy for specialized products. One example is the research into parmigiano reggiano, in which a synergistic combination between a local agricultural tradition, technological innovation, and entrepreneurial modernity was verified (Bertolini 1998). The meat processing industry has also been analyzed, confirming the economic role of small producers and highlighting the dense network of relationships between the players as well as their capability for creating institutions that coordinate and defend the local dimension of their work (Bertolini and Giovannetti 2006).There are also specific studies on Italian agrifood districts that highlight the better results of firms inside the agrifood districts, like the research into the meat and fruit and vegetable processing sectors (Brasili and Ricci Maccarini 2003).
Following this approach, other studies have focused on different European countries. Lagnevik et al. (2003) analyze the highly successful food cluster in the Öresund region (across the borders of Denmark and Sweden), proposing the notion of dynamic food innovation clusters, where nonfirm actors play a key role in the evolution and success of such clusters. Agrifood clusters in Spain have also been analyzed, such as olive oil in Andalusia (Sanz Cañada and Macías Vázquez 2005). This analysis find that collective organization, institutional framework, and territorial identity can enhance local competitiveness. In the case of Valencian citrus, it has been shown that the regional interaction between suppliers and citrus growers favors the innovation and competitiveness of the cluster, increasing international interactions, which over time become more creative by feeding back into the original internal relations (Gallego Bono 2007). The Iberian ham cluster has also been studied (Diez-Vial 2011), and the positive effect that geographical concentration has on performance has been demonstrated. This effect is explained by access to valuable natural resources, workers, higher demand, knowledge spillovers, and lower transaction costs. In the case of the foodstuffs (nougat) cluster in the Valencian region, research has shown that social proximity and geographical proximity favor the formation of interfirm relationships and reinforce the organizational dimension (Molina-Morales et al. 2015). In the case of Spain, there are other studies with a more descriptive methodological approach for specialized clusters: olive oil in Andalusia (García Brenes and Sanz Cañada 2012; Rodríguez-Cohard and Parras 2011); horticultural production located in Murcia (Martínez-Carrasco and Martínez Paz 2011); the horticultural cluster in Vega Baja—Alicante (Giner and Santa-María 2018a); the agroindustrial cluster that emerged around the intensive horticulture of Almería (Aznar Sánchez 2011); and the agrifood production systems of Castilla and León (Juste Carrión 2011).
Numerous documented examples of clustering activity in the food sector focus on wine clusters. Perhaps the reason for this is that Porter (1998) had chosen the California wine industry as an example illustrating the application and use of his cluster approach. In the 1998 study, Porter describes the wine cluster as a group of interconnected wineries, grape growers, suppliers, service providers, and wine-related institutions located in California.
One such study in this sector was carried out by Beebe et al. (2013) on the wine production cluster in Paso Robles, California. This research emphasizes how identity in wine clusters has economic value, and there is therefore a strong interest for all actors to build a common strategy to outline a positive cluster identity. On the other hand, social networks and the knowledge exchange are important factors for cluster innovation, and many authors evidence this in the context of wine clusters. Thus, the research focusing on the wine cluster in the region of El Priorat, Spain, verified the importance of creating and strengthening intraregional links based on trust and solidarity, links that enable the efficient diffusion of this innovative information, in such a way that the knowledge can be shared (Aldecua et al. 2017). Similarly, Hira and Swartz (2014) analyzed the Napa wine cluster and found that social capital and the efforts of entrepreneurs to work together to develop the technological breakthroughs give them a comparative advantage. Another example is the research on the Chilean wine cluster by Giuliani and Bell (2005), focusing on the intracluster knowledge system and its interconnection with extracluster knowledge. This work highlights a wide range of different communication and learning behaviors in the cluster, showing that it was the capacities of individual firms to absorb, spread, and creatively exploit knowledge that shaped the learning dynamics of the cluster. A work in a similar vein is the study conducted by Morrison and Rabelloti (2009), which focused on the nature and extent of knowledge and information networks in an Italian wine cluster. The empirical findings show that knowledge flows are restricted to a tightly connected community of local producers, differing in terms of knowledge assets, innovation behavior, and overall economic performance with respect to the rest of the firms in the cluster. Other, more descriptive studies have been carried out in Spain for the wine clusters in Rioja (Larreina, Gómez-Bezares, and Aguado 2011), Castilla and León (Sánchez-Hernández 2011), and Jerez (Soler Montiel 2011), as well as the analysis of the Galician wine system (Macías Vázquez 2011).
There are also numerous works on the specific concentrations of small firms specialized in a particular food processing industry and how these systems appear as catalysts for rural development, agriculture modernization, and a better market reachability for farmers. Research has also considered Latin American countries, contemplating the dairy clusters (Dirven 2001), the local cheese production system in Nicaragua (Mancini 2013), rural cheese factories in Peru (Boucher and Requier-Desjardins 2005), and the cheese production community in Mexico (Crespo, Réquier-Desjardins, and Vicente 2014). It should be point that in many cases, these agrifood systems are in possession of tangible and intangible cultural and institutional resources that confer differential attributes to the food products linked to these territories. In addition, there is certainly a role played by social capital as a crucial local resource for successful collective actions, since it is a source of trust and collective commitment within a community. In sum, this territorial framework is usually adopted by small enterprises as the best way to generate innovation and economic growth through an embeddedness of social and knowledge links (Molina-Morales and Martínez-Fernández 2010; García Alvarez-Coque, Mas Verdú, and Sánchez García 2015).
The Spanish Agrifood Industry
The agrifood industry is the top industrial branch in Spain. According to the Structural Business Statistics of Spain’s National Institute of Statistics (2017), the food and beverage industry accounted for 28,212 companies, that is, 14.7 percent of the manufacturing industry. These companies employ 404,338 workers (18.8 percent of the industrial sector). Overall, the sector generated €118,833 million net turnover (19.2 percent of the industrial sector). After France, Germany, and Italy, Spain is the country with the highest turnover in the EU. In addition, it is the fourth export economy of agrifood products of the EU-27. However, the investment effort (R&D/GDP) of the agrifood sector in Spain (0.5 percent) is 28 percent lower than the value registered at the community level (0.7 percent).
The Spanish food industry by subsector (see Table 1) shows as the processing of meat subsector, followed by the manufacture of bakery products and pastries, are the ones with the highest percentages of employed, with 23.9 percent and 21.5 percent, respectively. The subsectors with the largest number of companies are bakery products and pastry, with 36.4 percent of the firms’ total, beverage manufacturing with 17.9 percent, and meat processing with 12.9 percent. The subsector with the highest turnover percentages of this industry in 2017 was meat processing (22.1 percent), followed by beverage manufacturing (14.5 percent). Fruits and vegetables are the main agrifood products exported and accounted for 17.7 percent of the total sector in 2018.
Spanish Food Industry by Subsector, 2017.
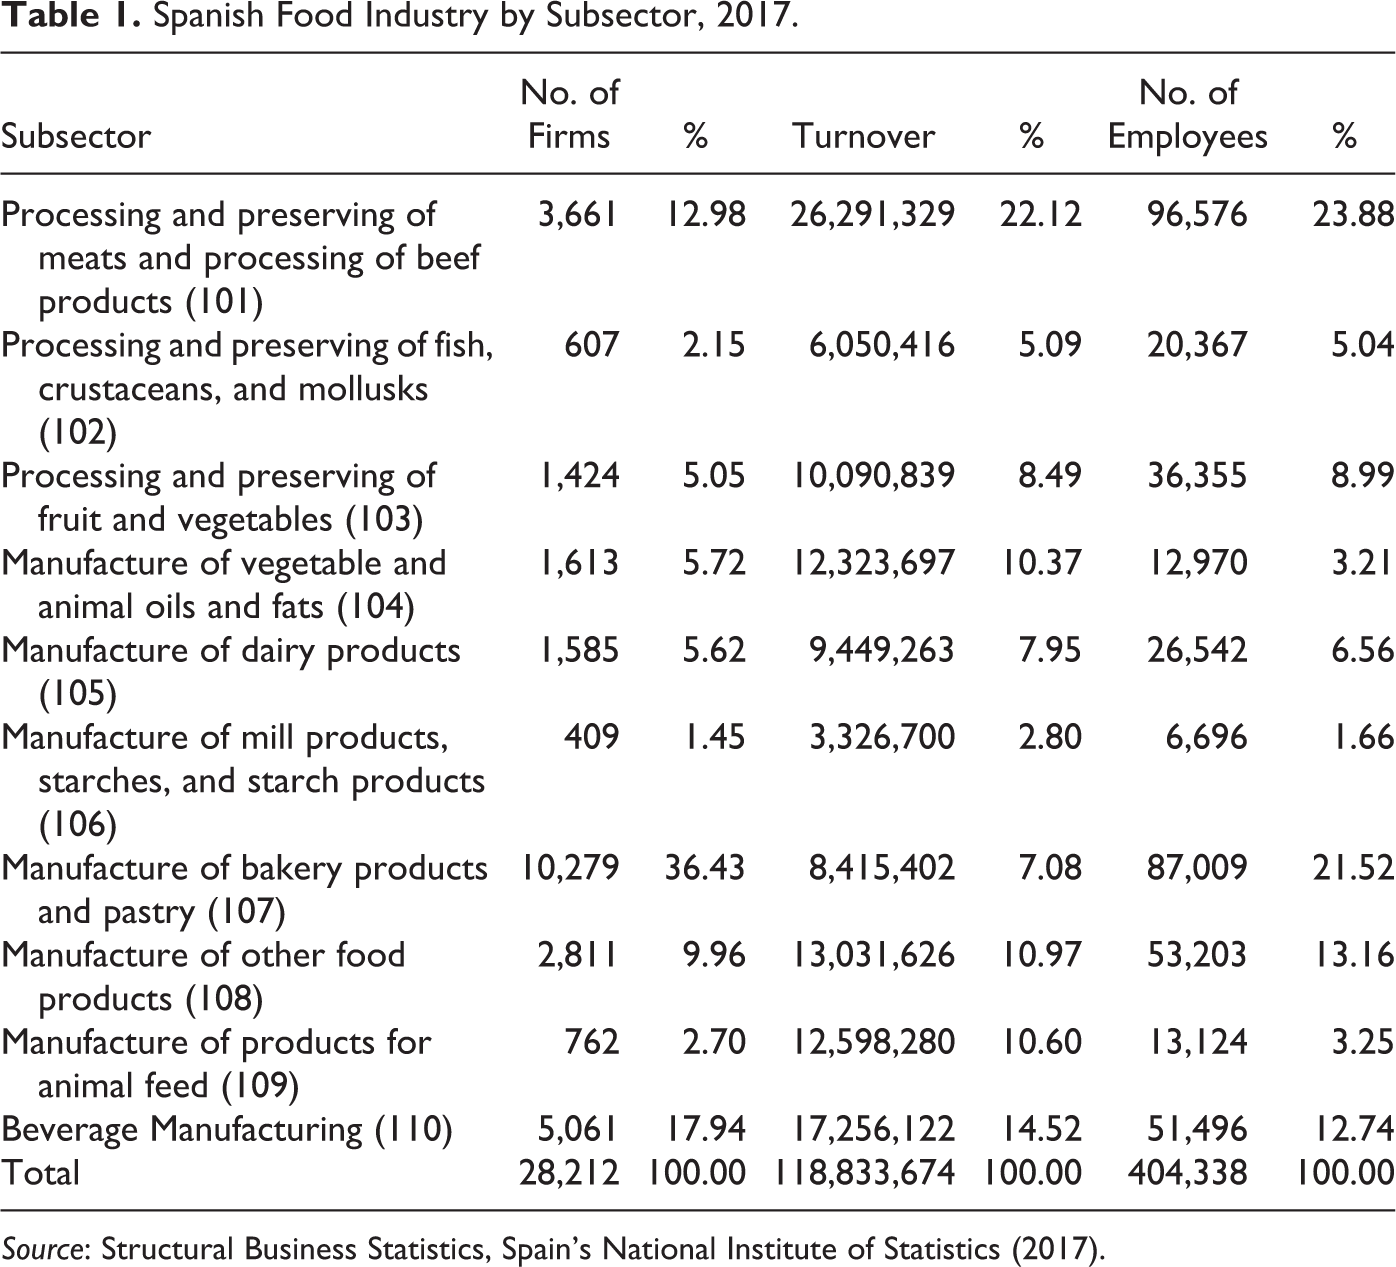
Source: Structural Business Statistics, Spain’s National Institute of Statistics (2017).
With regard to the spatial distribution of the agrifood industry (see Table 2), the regions with the greatest weight in this industry are Catalonia, Andalusia, and the Valencian region and Castilla and León. Catalonia concentrates 21.8 percent of total employment in the sector and 12.4 percent of total companies. Despite the fact that certain regions register a higher percentage of companies and employment in the food industry, this industry is diffusely located in the national territory, with 3,400 municipalities that have registered an establishment in this sector (out of a total of 8,126 municipalities).
Spanish Food Industry by Region, 2017.
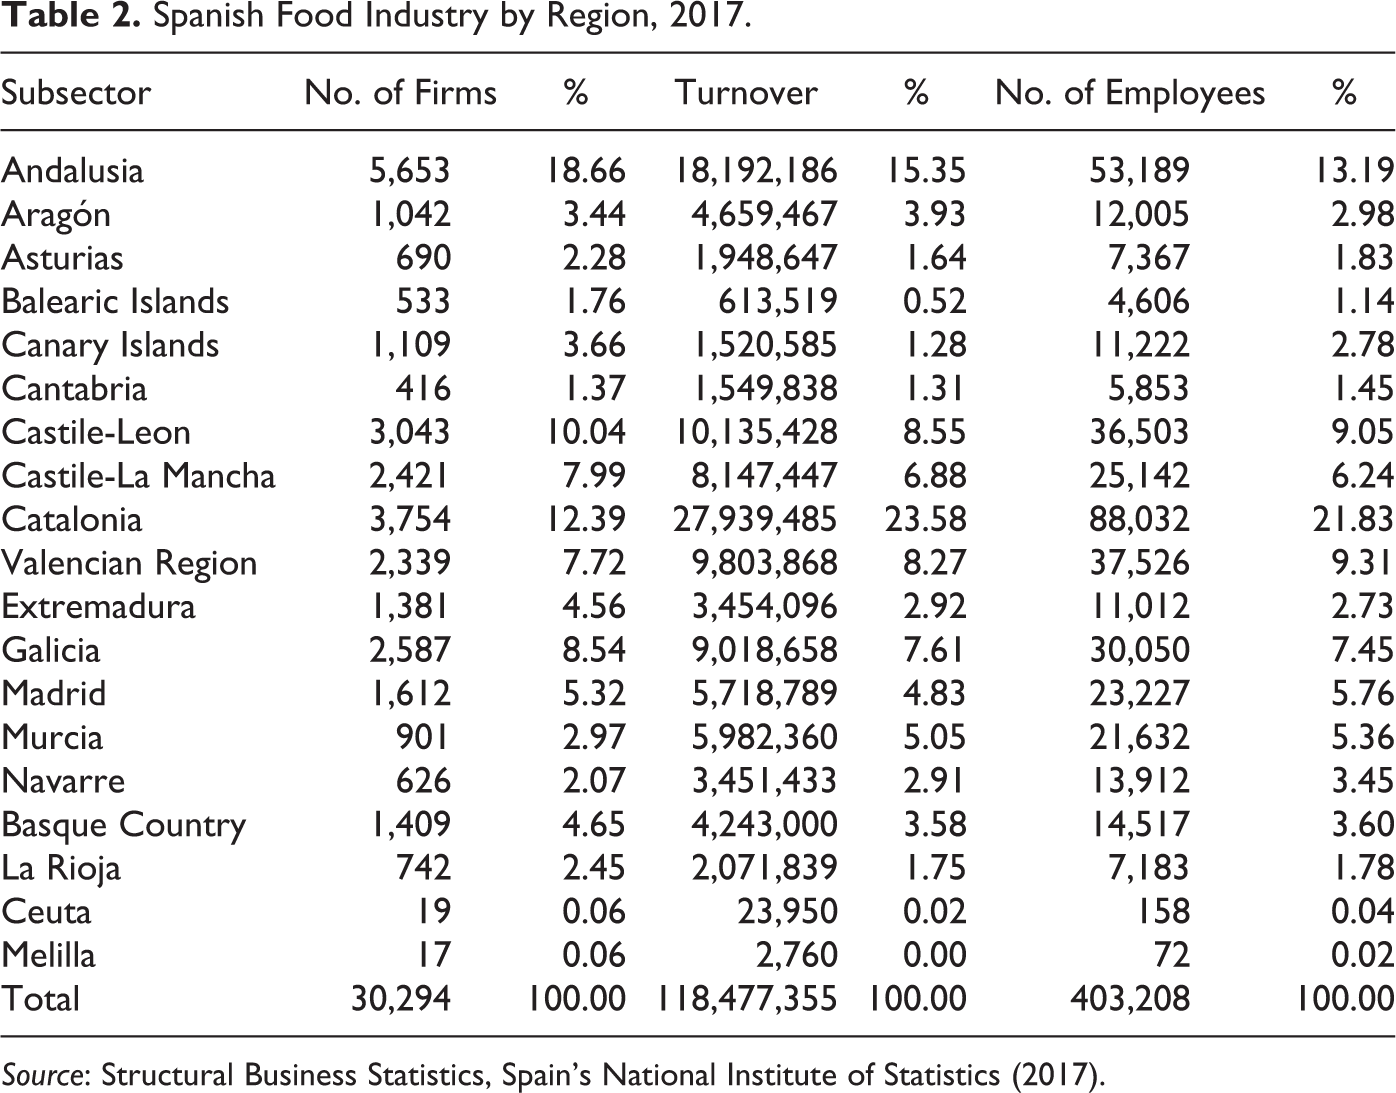
Source: Structural Business Statistics, Spain’s National Institute of Statistics (2017).
It is noteworthy that the sector is characterized by business atomization: 95.6 percent of businesses have fewer than fifty employees, and 77.8 percent have fewer than ten employees, a fact that hinders innovation and internationalization. Thus, the Spanish agrifood industry has a small number of large companies that concentrate on a substantial market share in certain subsectors. In parallel, it is common that a large number of small agroindustrial enterprises, generally more closely linked to the rural environment, undertake first-stage processing activities, thus encouraging the tertiarization of the rural economy whose services are often exploited by the agrarian activity itself (Pereira-Sánchez and Vence-Deza 2017).
Furthermore, substantial structural changes have been detected in recent years in the Spanish agrifood industry. Since the end of the 1980s, distribution activities have progressively concentrated, and the joint market share of the sector’s five main distributors has increased from 27 percent to 56 percent (Asensio 2015). This has led the traditional distribution structure to shrink, as it used to be constituted by very small stores that protected the agrifood sector against increased competition from other countries. This significant concentration of the distribution sector puts competitive pressure on food processing companies. In addition, the industry is characterized by market saturation and high competition, making it necessary to approach innovation processes that allow for consolidation of national and international market presence (Barciela 2017). The challenges facing the agrifood industry may make the agrifood clusters significant, as they provide greater competitiveness to the companies included within them. Spanish agrifood clusters can play a major role by fostering the food industry and supporting the development of rural areas.
Method
The literature review on clusters and industrial districts shows that different methodologies have been used to identify these agglomerations. Bergman and Feser (2020) examine a set of methods for identifying and analyzing industry clusters. There are a variety of tools available for the task, from simple measures of specialization (location quotients [LQs]) to input–output-based techniques. They begin by making a distinction between highly stylized studies of predetermined sectors (often in the Porterian tradition) and studies that attempt to infer the identity of clusters embedded within a very diverse and reasonably comprehensive set of regional industries. The first kind, which they label “microlevel cluster applications,” are typically driven by specific regional interests or policy concerns. For the second kind, techniques that permit a comprehensive investigation of virtually all sectors in the regional economy are needed. They label analysis based on such techniques “mesolevel cluster applications” following terminology adopted by the OECD. Bergman and Feser (2020) identify several ways of identifying industry clusters, with most of the detailed focus placed on input–output-based methodologies. They list six basic analytical approaches, with certain advantages and pitfalls, ordered roughly in terms of how commonly they have been used: expert opinion, LQs, trade-based input–output analysis, innovation-based input–output analysis, network analysis, and surveys.
Broadly speaking, two approaches have emerged: top-down analysis, which generally relies on quantitative data to deduce the industrial structure of a regional economy; and bottom-up analysis, or qualitative-type case studies in a given region, which examine the inner workings and interfirm connections of a particular cluster in a particular location. Each approach is illuminating, but neither is complete (Cortright 2006). Indeed, it probably makes most sense to conceive of regional cluster analysis as a two-stage process: (1) an initial scan of the regional economy, using detailed quantitative sources; and (2) then a detailed, perhaps painstaking, investigation of specific industrial features/clusters identified in the scan (Bergman and Feser 2020). A large part of the methods used in the first-stage process have used analytical–statistical tools, attempting to systematically and objectively identify clusters and uncover their precise location in the territory. Our research is framed within this context. Algorithms or methods can be found in the literature allowing us to apply some of these techniques in a quasi-automated way, making it easier to compare results (Porter 2003; Delgado, Porter, and Stern 2016). Quantitative techniques have also been used to identify industrial districts, such as, notably, the methodology conducted in Italy by Sforzi (1987, 1990) and ISTAT (1996, 2006), and applied to the case of Spain by Boix and Galletto (2006, 2008), Ybarra et al. (2008), and Boix et al. (2015).
Concerning the agrifood industry, the literature review showed that very few studies have sought to identify agrifood clusters in a given territory using systematized methods and based on quantitative data. However, some analyses have applied a high degree of sectorial disaggregation, such as the identification in Italy of agrifood districts and quality agrifood districts by Unioncamere (2009). Following this methodology, Giner and Santa-María (2017, 2018b) identified agrifood districts in Spain. The study by Hoffmann, Hirsch, and Simons (2017), identifying food industry clusters in Germany, is also relevant.
In the case of Spain, no study has been carried out that reveals the agrifood industry’s agglomeration level at a four-digit sectorial disaggregation level. The present study attempts to address this gap and identifies agrifood clusters at a high level of spatial and sectorial disaggregation, following the methodology used by Hoffmann, Hirsch, and Simons (2017). In a study on cluster identification in Germany’s food industry, the authors used the CI put forward by Sternberg and Litzenberger (2004). Sternberg and Litzenberger (2004) proposed the CI as a measure to identify industrial clusters. The CI is composed of the following three components: relative IS, relative ID, and relative PS. To identify industrial clusters at a spatial level, these components are related through multiplication, with the CI corresponding to territorial unit i (area i) and sector j:

where: eij is the number of employees in area i and sector j; bi is the number of inhabitants in area i; ai is the area’s surface size in km2; pij is the number of companies in area i and sector j;
The main advantage of the CI is that a value for each analyzed area/sector can be derived. Therefore, comparison between areas/sectors is easier than with other measures such as the Gini coefficient, which does not consider the size of the statistical units (i.e., the areas). This makes comparisons of values for areas of different size unreliable (Litzenberger and Sternberg 2006).
One advantage of this index is based in its multidimensional nature, incorporating the information and dimension of three relevant location aspects. The IS is calculated on the basis of the LQ, with the difference that the IS is based on the number of inhabitants as the reference value instead of total employment. The ID is included as otherwise scarcely populated regions, in which most of the inhabitants work in the same sector and are considered to be a cluster without being spatially concentrated in relation to the overall region, while the PS is included to eliminate an overestimation of the IS or the ID caused by one large company.
Another advantage is based on its continuous character. All three components of the CI (ID, IS, and PS) are defined between zero and infinity, implying that the whole index also has the potential range from zero to infinity. Values below one indicates below average economic activity of sector j in area i, while values in excess of one point toward an overrepresentation. The multiplicative connection of the CI components implies that extreme values of single components have a higher influence than, for example, in additive connections (Gallus 2006). An underrepresentation of a component could possibly be compensated by higher positive values of the other two elements. Hence, even in cities with a high number of inhabitants (and therefore possibly a lower IS), a cluster can be detected due to a higher ID. In contrast, also in a very specialized and scarcely populated huge rural area, clusters will be identified through a possibly high IS although the ID can be below one (Sternberg and Litzenberger 2004).
The outstanding advantages outweigh the possible limitations of the Italian methodology used in the mapping of industrial districts applied for Spain (Boix and Galletto 2006, 2008; Boix et al. 2015): the taxonomy is rigorously dichotomous (a local system is a district or not a district, i.e., intermediate situations are not contemplated), and there is restrictive multicriteria methodology (if one of the criteria is not verified, the local labor system (LLS) can no longer be considered a district).
In any case, using the CI to identify potential clusters implies setting a minimum value threshold. Since no specific value threshold exists to define a cluster, the threshold should be determined individually in each cluster study (Koschatzky and Lo 2007; Titze, Brachert, and Kubis 2011). Therefore, one of the possible limitations of the index is the subjectivity when setting the minimum threshold to identify relevant or potential clusters. On the other hand, several authors (Hoffmann 2014) have shown that sectors with a small number of establishments and dispersed distribution lead to overestimating the CI.
Also, the following drawbacks of the CI need to be pointed out (Hoffmann, Hirsch, and Simons 2017): the inclusion of the ID in the calculation can lead to a greater difficulty to detect clusters in larger territorial units than in smaller ones. However, without this element, biases with unidentified clusters in highly populated areas (e.g., cities) might occur. Additionally, correcting with the PS could obscure clusters mainly consisting of large firms. More significant is the fact that functional relations between firms and industries cannot be identified with the CI (Koschatzky and Lo 2007; Titze, Brachert, and Kubis 2011), and information about the sectoral or spatial interdependence of industrial clusters cannot be derived (Brachert, Titze, and Kubis 2011).
On the other hand, as Martin and Sunley (2003) point out, the importance of the type of industry/area classification is highlighted when implementing top-down approaches such as the CI. The use of these code-based classifications—as the Statistical Classification of Economic Activities in the European Community (NACE)—faces to potential difficulties and errors that can produce distorting results (Kile and Phillip 2009). In fact, these classifications present levels of inconsistency and unreliability within the same category and in the comparison analyses (Jacobs and O’Neill 2003). Bean (2016) has summarized three main limitations of these classifications: first, businesses currently classify themselves as other, which means that we have little understanding about an important part of the activities of the economy; second, some businesses are engaged in types of economic activity which do not sit well within code classification. In fact, it fails to capture the new sectors, resulting in a lack of evidence that hinders observer. And third, as businesses become increasingly more dynamic, innovative, and technology-driven, they also perform cross-sector activities then classifications fail to accurately capture the variety of business activities.
The top-down methodological approach of quantitative type can identify as clusters some areas of agglomeration that are not functionally clusters. Therefore, our methodological approach used to identify clusters are not meant to be necessarily conclusive, and it should be completed with more qualitative analyses. An evaluation of these initial findings can be done by analyzing the structure and nature of interfirm relationships and the presence and role of the local and regional institutional framework, enabling a better understanding of the cluster (Porter 1998; Tallman et al. 2004; Inkpen and Tsang 2005).
In this study, to identify Spain’s food industry clusters, the thresholds used by Hoffmann, Hirsch, and Simons (2017), based on the classification established by Litzenberger (2007), were used. To determine the index interpretation categories, the authors distinguished between the values of one, double, quadruple, and eightfold for each component, fixing the CI quadruple value of 64 as the threshold for relevant clusters, and a CI of 512 for highly relevant clusters.
Once the food clusters have been identified, a descriptive analysis will be carried out at a territorial and sectorial level. In the sectorial domain, we tried to uncover any differential results—especially regarding relevant clusters—existing between three-digit and four-digit sectorial classifications. Evidence from other research (Hoffmann, Hirsch, and Simons 2017) has shown a greater presence of relevant clusters when a higher disaggregation (four digits) of sectorial classification was used. That is, at a more aggregate level of sectorial classification (three digits), cluster-type spatial agglomerations were underestimated.
This aspect will be addressed using a statistical analysis of nonparametric tests of hypothesis testing. Specifically, we tested the hypothesis of significant CI value differences at a given three-digit-level sector with its different four-digit subsectors.
Nonparametric tests compare the distributions of two related variables. The appropriate test depends on the type of data. If the data are continuous—as in our case, CI—the sign test or the Wilcoxon signed-rank test can be applied. The sign test calculates the differences between the two variables for all cases and classifies the differences as positive, negative, or null. If both variables have a similar distribution, the number of positive and negative differences does not significantly differ. Wilcoxon’s (1945) signed-rank test considers the information of the sign of the differences and the magnitude of the differences between the pairs. Since the Wilcoxon signed-rank test incorporates more information about the data, it is more powerful than the sign test and therefore was applied in our analysis using the statistical program SPSS©. This test is normally applied in the field of experimental sciences although there have also been applications in economics (e.g., Salvati, Ferrara, and Chelli 2018).
To complete this analysis, we studied the spatial location of some significant three-digit subsectors of the Spanish food industry (both in terms of number of companies and employment)—(101) processing and preserving of meats and processing of beef products; (105) manufacture of dairy products; (107) manufacture of bakery products and pastries; and (108) manufacture of other food products—to try to explain the divergent results at different levels of sectorial disaggregation (three digits vs. four digits). At the methodological level, we have analyzed different quantitative measures of the spatial distribution of these sectors (employment, number of relevant clusters) and several sectorial indicators.
Data
The territorial unit of analysis was the market or LLS, constructed based on residence-labor mobility data. Specifically, the 806 LLSs identified by Boix and Galleto (2006) were used for the whole of Spain. The territorial units ultimately analyzed were the 768 LLSs with activity in the agrifood industry.
The classification system used was Statistical Classification of Economic Activities in the European Community (NACE-Rev.2). Although most analyses were conducted at a three-digit level, studies on clusters have argued that functional relationships can be better detected at the four-digit or even five-digit level. The four-digit level of the NACE-Rev.2 comprises thirty-five classes or subsectors for division 10 “food industry” and division 11 “beverage manufacturing,” which represent the sectorial scope of our analysis.
The data on the number of companies and their use in each food industry subsector, as well as the population data and the size of the LLS, were needed at a disaggregated level to calculate the CI. Thus, the main data were obtained from the Iberian Balances Analysis System (SABI) managed by Bureau van Dijk, which provides information on 1.25 million companies in Spain. Starting from a database with the individualized records of existing industrial companies in the available time period, secondary variables were generated on the number of companies and industrial employment at the indicated territorial level. Data were available at the 4-digit industry disaggregation level for any of the LLSs. The data used in this analysis were from 2016, which was the latest period available with complete available data at the required sectorial and territorial levels.
In addition to food industry data, the number of inhabitants per LLS and the size of the LLS (surface area) were needed to calculate the CI. These data were obtained from the Spanish Ministry of Transportation (Atlas of Urban Areas), and they provided the measures of surface size (km2) as well as the number of inhabitants for each of the 768 LLSs with activity in the food and beverage industry.
Some aspects of the sectorial and territorial dimension of the analysis have been noted in a previous subsection. Table 3 shows the descriptive statistics (average, median, standard deviation). LLSs with activity in the food industry account for an average surface area of 648.5 km2 and an average population of 50,185 inhabitants. The high values of the standard deviation statistics show that the LLSs vary significantly in size (both in area and in population). Average firms’ number and employee in each LLS were 18.5 and 362.8, respectively. Average employment in the industry’s 14,203 companies was 19.6.
Descriptive Statistics (2016).
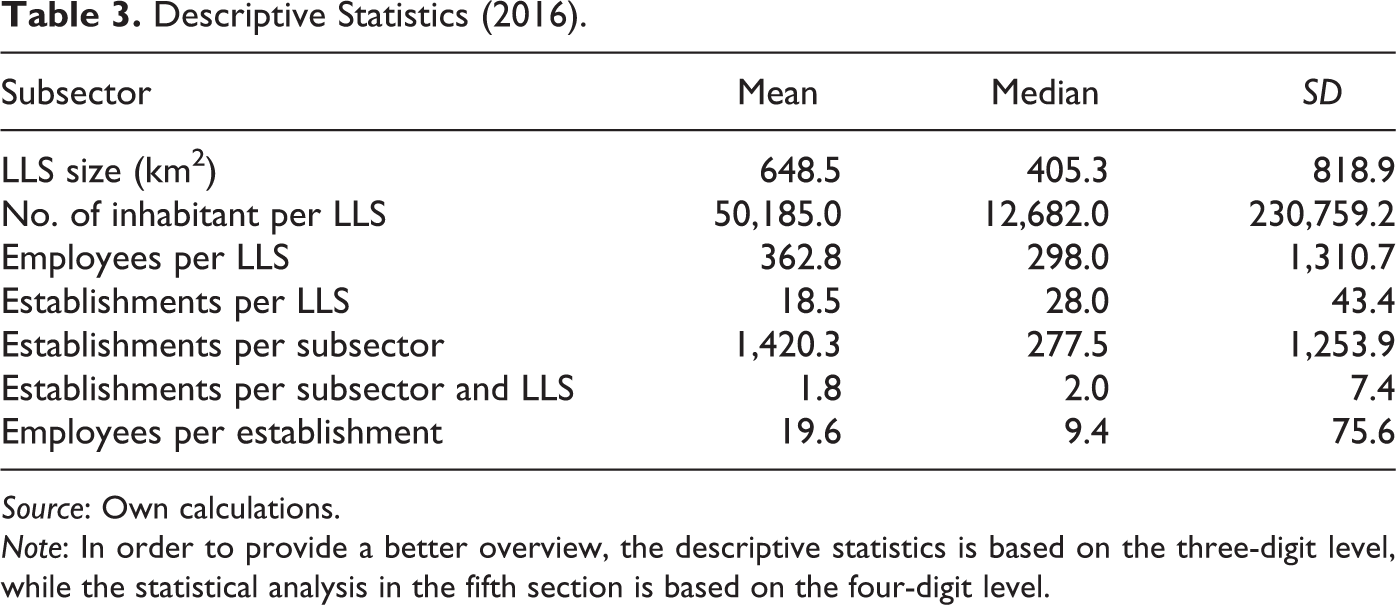
Source: Own calculations.
Note: In order to provide a better overview, the descriptive statistics is based on the three-digit level, while the statistical analysis in the fifth section is based on the four-digit level.
As mentioned above, several authors (Hoffmann 2014) have shown that sectors with a small number of establishments and dispersed distribution lead to overestimating the CI. To avoid this bias, only subsectors at the four-digit level with at least 100 companies were considered. This meant that we had to exclude ten of the thirty-five subsectors at the four-digit level from the analysis. However, these subsectors only represented 334 companies, which means that only 2.4 percent of food and beverage industry companies were excluded from the cluster identification and analysis.
Results
The first subsection is a preliminary analysis of the results of the identification of agrifood clusters in Spain. The differential results according to sectorial disaggregation (three-digit vs. four-digit level) and the sensitivity of results according to sectoral disaggregation will be verified using nonparametric statistical tests (Wilcoxon signed-rank test) in the second subsection. In addition, the analysis of four significant three-digit subsectors in the Spanish food industry in the third subsection will allow us to advance alternative explanations for the divergent results at the different levels of the analysis (three digits vs. four digits).
Identification and Preliminary Analysis
We analyze the twenty-five subsectors of the Spanish food and beverage industry (four-digit level) with at least one hundred active companies, together with the ten 3-digit sectorial categories. Since smaller sectors may introduce a bias in the analysis by oversizing index values, we verified the reliability of the results by conducting an exploratory analysis. We checked whether subsectors with a small number of companies or employees frequently showed a higher number of relevant clusters (CI > 64). The results of the corresponding regressions did not show a significant impact of the size of the sector on the CI. The correlation coefficient between the size of the territorial unit and the CI value average was shown to be close to zero (.0206). 1 In addition, despite its high level of disaggregation, the four-digit NACE-REV.2 is characterized by a high degree of heterogeneity, such as in the meat processing and preserving subsector (1011) and in the other processing and preserving of fruit and vegetables subsector (1039). 2 Therefore, the CI seems adequately and reliably to identify the existence of clusters as well as their geographical location (Martin and Sunley 2003).
The results show that 540 relevant clusters (with CI > 64) are identified in the twenty-five analyzed subsectors of the food and beverage industry at the four-digit level. Table 4 shows the distribution of relevant clusters based on territorial units’ types: rural areas in rural environments (65.7 percent), densely populated areas (18.3 percent), and 8 percent in rural areas around urban agglomerations and city areas. In the case of Germany (Hoffmann, Hirsch, and Simons 2017), most clusters were in densely populated areas and in large urban areas (approximately 80 percent). Other empirical studies (Boix and Vaillant 2010; Llorente-Pinto et al. 2014; Sánchez-Hernández et al. 2015) have shown the relevance of rural areas compared to urban areas in Spain’s agrifood industry. Figure 1 shows the spatial distribution of relevant clusters identified in our analysis for Spain (at a four-digit level).
Distribution of Relevant Clusters on Territorial Units Types.

Source: Own calculations.
Note: Classification of LLS/regions: rural LLS in rural environment: <100 inhabitants/km2; rural LLS around urban agglomerations: <150 inhabitants/km2; densely populated LLS: >150 inhabitants/ km2; city LLS: city LLS with >100,000 inhabitants.
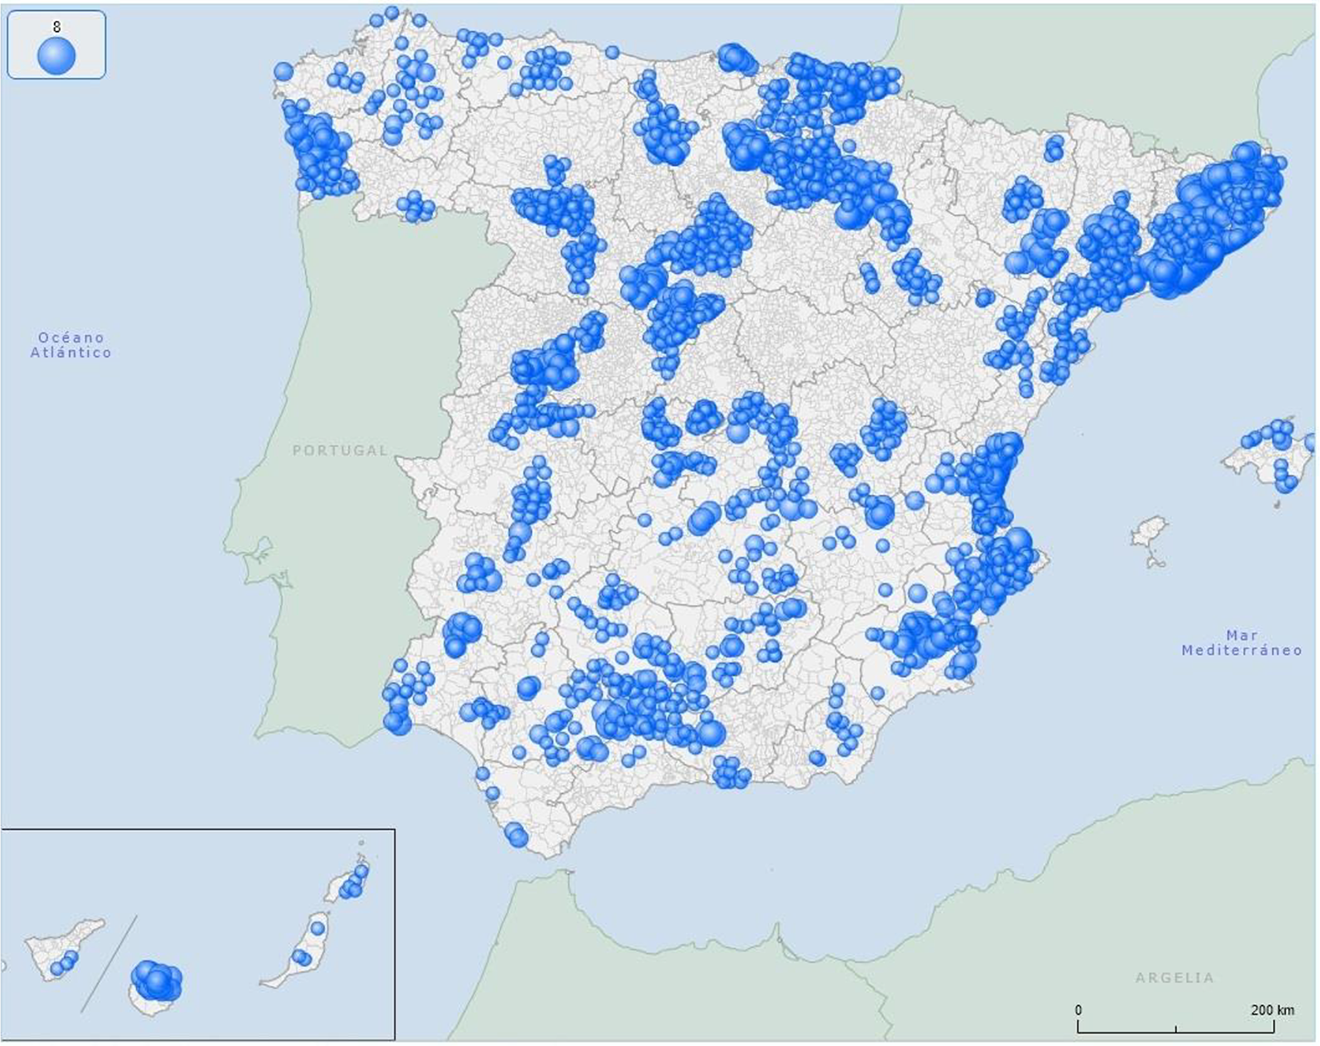
Number of relevant food industry clusters in Spain (all four-digit sectors). Map elaborated through the Geographical Information System platform of the Ministry of Development of Spain.
A relevant aspect is the existence of many LLSs identified as relevant clusters in several subsectors at the four-digit level; specifically, 44 LLSs were identified as relevant clusters in three or more four-digit subsectors. Exceptional cases include the LLSs centered on Lorquí (Murcia), which appears as a relevant cluster in eight subsectors; Cambados (Galicia), in six subsectors; and Barcelona, in five subsectors. Therefore, the 540 clusters identified are associated with 343 LLS (44.7 percent of LLS with agrifood activity) observing 214 single-specialized LLS (only appear in a single sector) and 129 multispecialized LLS (appearing in two or more sectors). The spatial distribution of the relevant clusters at Autonomous Community-Autonomous Region levels (NUTS-2 Regions) shows a greater spatial concentration of clusters in the following autonomous communities (see Figure 1): Andalusia (20.7 percent), Catalonia (14.6 percent), Valencian Community (12.8 percent), Castilla-La Mancha (8.7 percent), Galicia (6.9 percent), Castilla and León (6.3 percent), Murcia (5.9 percent), and Extremadura (5.2 percent). These eight regions concentrate 81.1 percent of the relevant clusters identified.
Differential Results according to Sectorial Disaggregation (Three-digit vs. Four-digit Level)
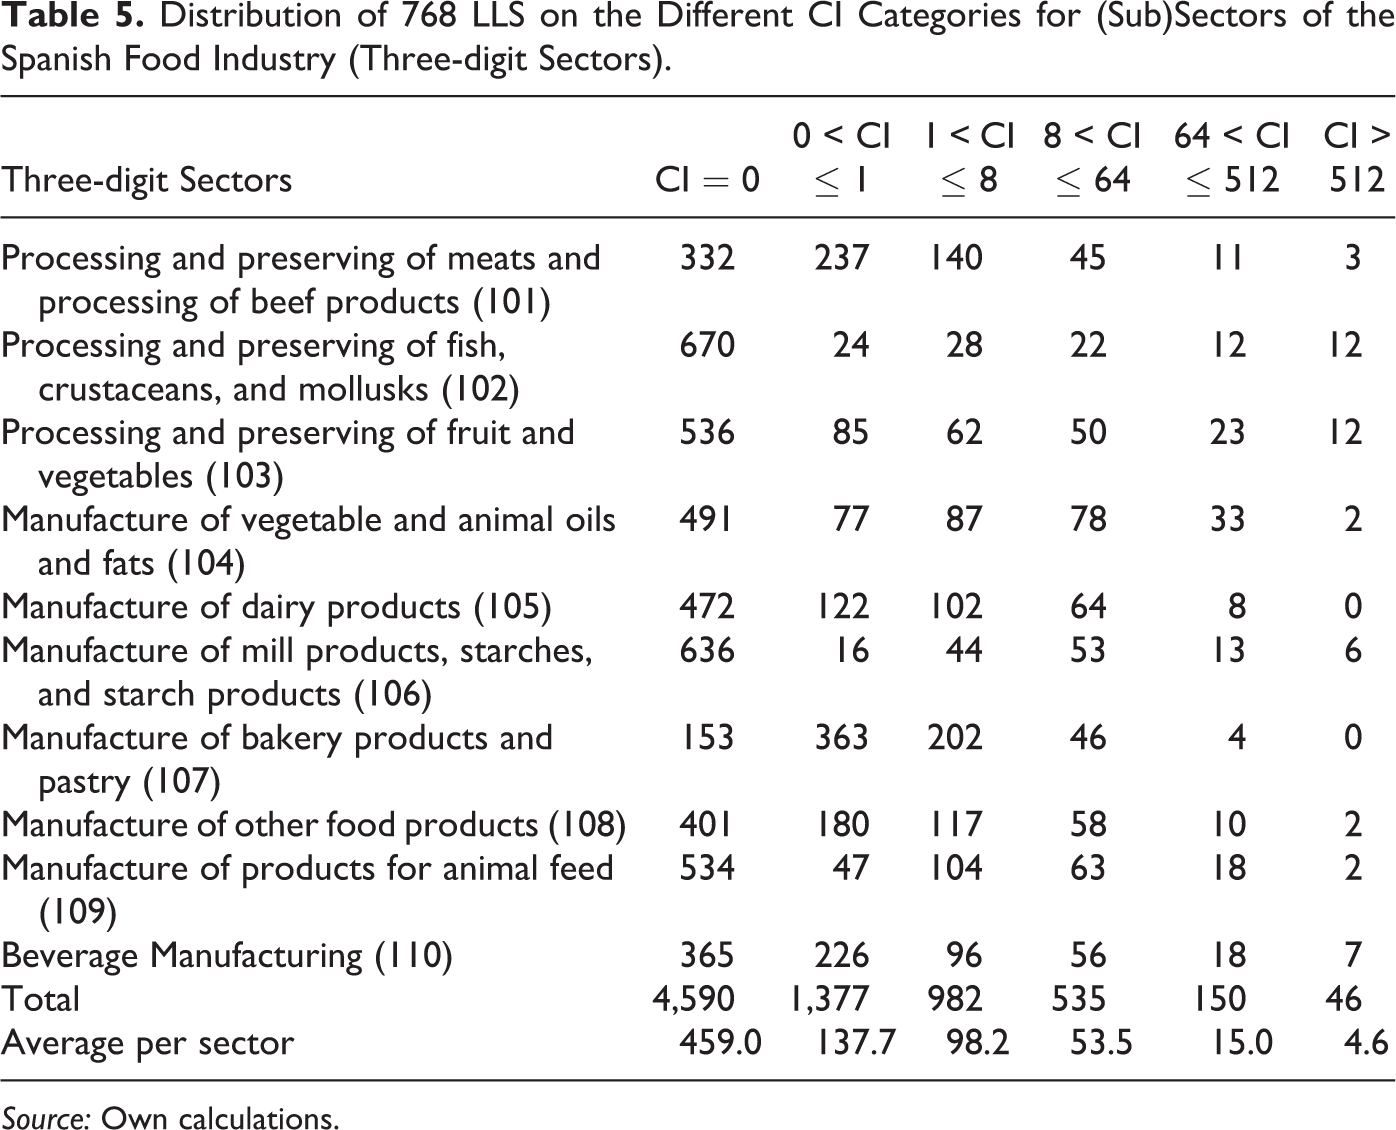
To obtain a more detailed analysis, Tables 5 and 6 show the number of clusters in each CI category for the different subsectors at the NACE-Rev.2 three-digit and four-digit level, respectively.
Distribution of 768 LLS on the Different CI Categories for (Sub)Sectors of the Spanish Food Industry (Three-digit Sectors).
Source: Own calculations.
Distribution of 768 LLS on the Different CI Categories for (Sub)Sectors of the Spanish Food Industry (Four-digit Sectors).

Source: Own calculations.
The results indicate that relevant clusters can be identified for almost all subsectors of the food and beverage industry at the three-digit level (see the last two columns of Table 5). Of these, 196 relevant clusters are identified in the ten analyzed sectors (three-digit), with an average of 19.6 relevant clusters per sector. Five subsectors show a higher value than average number of clusters.
The following subsectors presented a large number of relevant clusters in absolute terms (there were at least twenty relevant clusters in each of them): (102) processing and preserving of fish, crustaceans, and mollusks; (103) processing and preserving of fruits and vegetables; (104) manufacture of vegetable and animal oils and fats; (109) manufacture of products for animal feed; and (110) manufacture of beverages. However, regarding the number of LLS with activity in each subsector, a bigger presence of relevant clusters was observed in the following subsectors: (102) processing and preserving of fish, crustaceans, and mollusks; (103) processing and preserving of fruits and vegetables; (104) manufacture of vegetable and animal oils and fats; and (106) manufacture of mill products, starches, and starchy products.
By moving the analysis down to the four-digit level (Table 6), the results again indicated that relevant clusters could be identified in almost all four-digit-level food and beverages industry subsectors (see the last two columns of Table 6). Of these, 540 clusters are identified in the twenty-five subsectors analyzed, with an average of 21.6 relevant clusters per sector. Eleven subsectors show a higher value than average number of clusters. The subsectors with the smallest presence of relevant clusters were: (1071) manufacture of bread, fresh bakery, and pastry products; (1105) manufacture of beer. The four-digit subsectors with the largest number of relevant clusters (25 relevant clusters were identified in each of them) were: (1022) manufacture of canned fish; (1032) manufacture of fruit and vegetable juices; (1039) other processing and preserving of fruits and vegetables; (1043) manufacture of olive oil; (1044) manufacture of other oils and fats; (1053) manufacture of cheese; (1082) manufacture of cocoa, chocolate, and confectionery products; (1084) preparation of spices, sauces, and condiments; and (1102) winemaking.
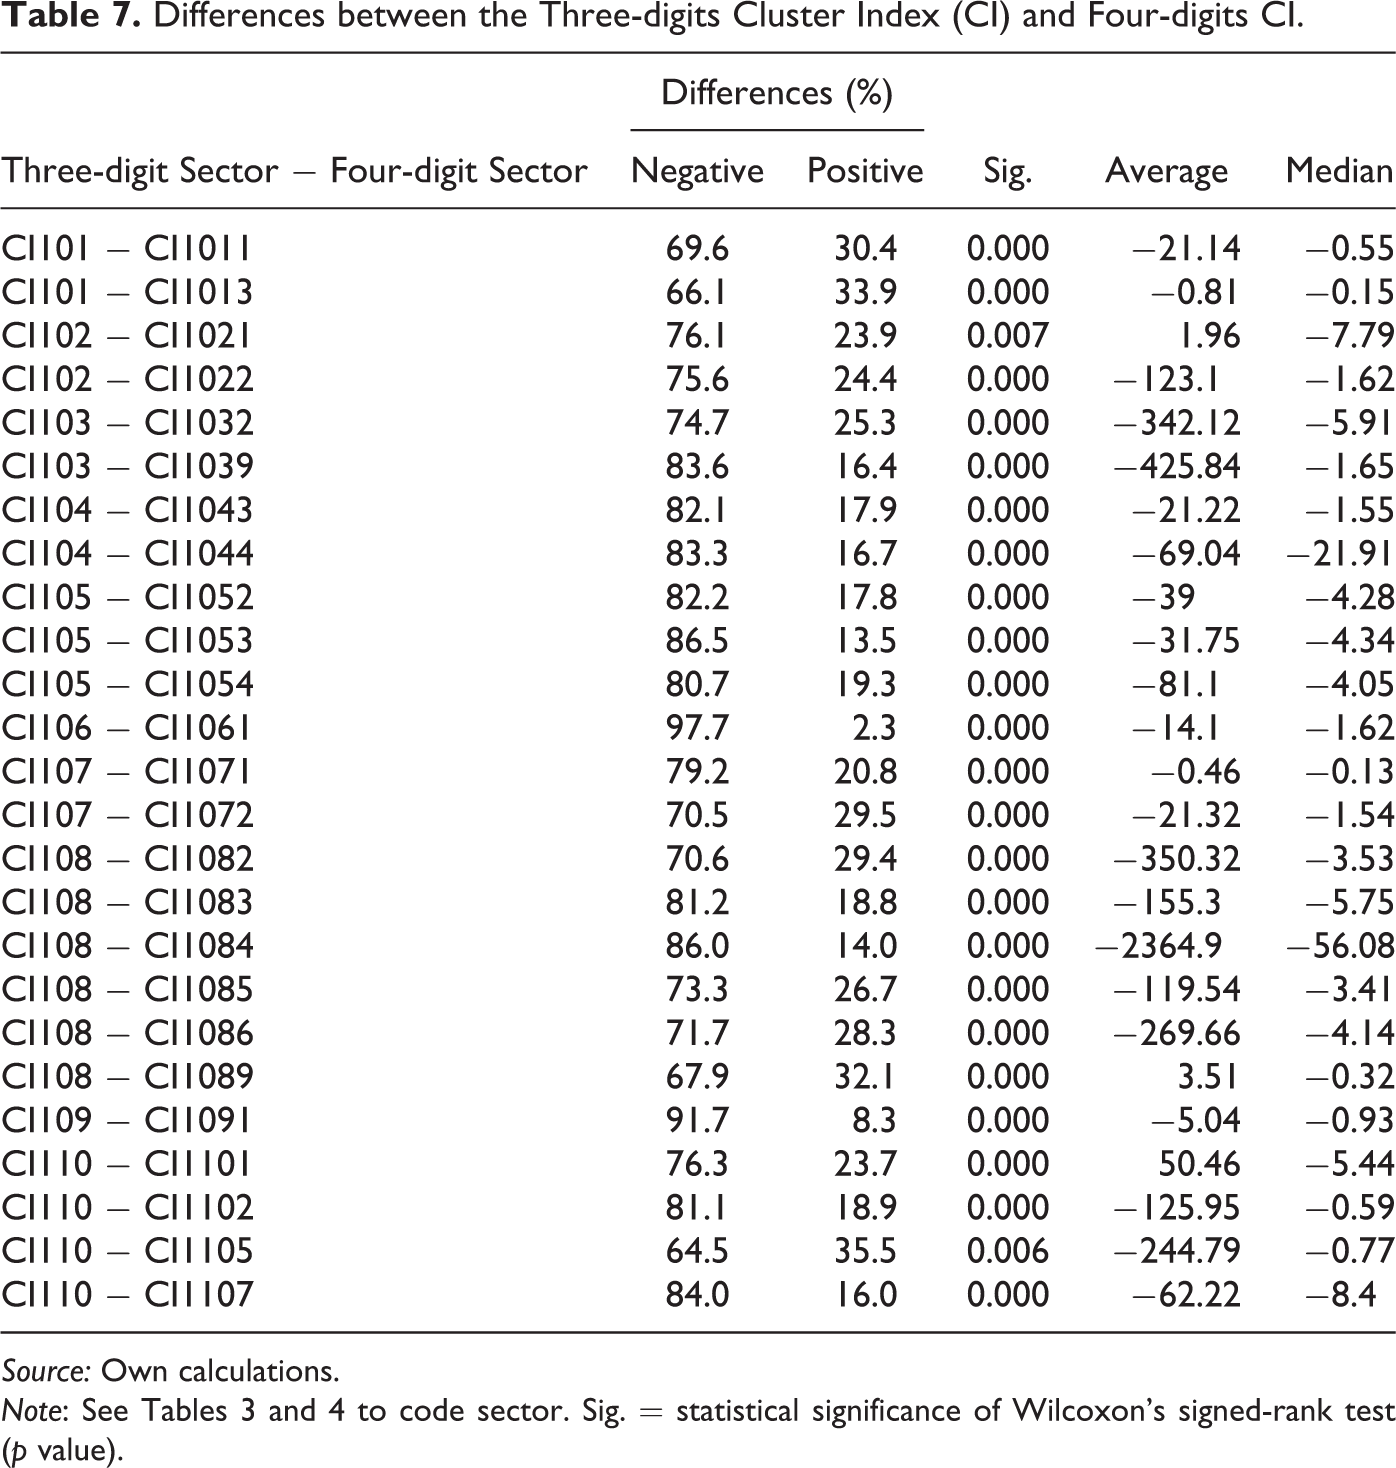
If we compare the four-digit-level findings (Table 6) with respective three-digit findings, the number of relevant clusters at the three-digit level was generally much lower (Table 5). This evidence, observed in a descriptive and intuitive way, was verified through nonparametric statistical hypothesis testing.
As noted in the methodological section, the nonparametric test applied calculated the differences between the two variables (three-digit CI − four-digit CI) in all cases (LLSs) and classified the differences as positive, negative, or null. If two variables have a similar distribution, the number of positive and negative differences does not differ significantly. Wilcoxon’s (1945) signed-rank test considers the information of the sign of the differences and the magnitude of the differences between the pairs. The results obtained from Wilcoxon’s signed-rank test (Table 7) allowed us to reject the hypothesis of null differences with a high statistical significance (p < .05) of the median values of all analyzed pair combinations. The statistically significant differences were mainly negative differences (78.2 percent of the analyzed pairs). This provided a general and statistically relevant indication that the four-digit CI values were greater than the three-digit CI values.
Differences between the Three-digits Cluster Index (CI) and Four-digits CI.
Source: Own calculations.
Explaining the Different Results according to the Sectorial Disaggregation
The analysis of four significant three-digit subsectors in the Spanish food industry (both in terms of number of companies and employment) may help to explain the divergent results at the different levels of the analysis (three digits vs. four digits)—(101) processing and preserving of meats and processing of beef products, (105) manufacture of dairy products, (107) manufacture of bakery and pastry products, (108) manufacture of other food products.
Processing and preserving of meats and processing of beef products (101)
In the three-digit-level sector (101), fourteen relevant clusters were identified. The number of relevant clusters identified at the four-digit level produced the following results: Processing and preserving of meat, twenty relevant clusters. Production of meat products and poultry, fourteen relevant clusters.
The production of meat products and poultry (1013) is characterized by small- and medium-sized businesses often closely linked to local suppliers and shows a low level of spatial concentration with very small values of the Gini index (0.0024) and the Ellison–Glaeser index (−0.0190) (see Table 8). Given the importance of this subsector in the three-digit sector (101)—36,048 jobs (62.2 percent)—it induces a bias regarding the lesser relevance of clusters at three-digit-level sectors. The distortion responds, therefore, to the effect of a subsector (four digits) that is very large in size and whose spatial distribution is highly dispersed.
Spatial Distribution of Employment and Relevant Clusters in Some Four-digit Sectors.

Source: Own calculations.
Note: On a gray background, the most relevant regions (top four) are indicated. In case of ties in the fourth place, more than four regions may appear. In sector 1054, only the top three regions are indicated (the rest are tied in fourth place).
Manufacture of dairy products (105)
The sector’s spatial agglomeration significantly diverged according to sectorial disaggregation (Tables 5 and 6). A total of eight relevant clusters were identified at the three-digit level (105). The number of relevant clusters identified at the four-digit level produced these results: Production of ice cream, twenty relevant clusters. Manufacture of cheese, thirty-three relevant clusters. Preparation of milk and other dairy products, eighteen relevant clusters.
In this case, the four-digit-level subsectors revealed the presence of relevant clusters that were not visible when the sector was analyzed at a three-digit level. This can be explained by the fact that the four-digit subsectors showed a high spatial agglomeration (see the spatial concentration indexes of Table 8), but their localization patterns were very heterogeneous. 3 If we analyze the spatial distribution of employment and of the relevant clusters at the regional level, substantial differences are observed in the four-digit subsectors analyzed (see Table 8). For example, if we look at the four main regions (top four) in terms of employment in each sector, eleven different regions are identified; that is, there are substantial differences in their location and agglomeration. Similar results are observed in the spatial distribution of number of relevant clusters. This second type of distortion responded to the impact of heterogeneous subcategories.
Manufacture of bakery products and pastry products (107)
As shown in Tables 5 and 6, the sector’s spatial agglomeration differed significantly according to the sectorial disaggregation. In the three-digit-level sector (107), four relevant clusters were identified. The number of relevant clusters identified at the four-digit level produced the following results: Manufacture of bread, fresh bakery, and pastry products, four relevant clusters. Manufacture of biscuits and long-life bakery and pastry products, eighteen relevant clusters.
The manufacture of bread, fresh bakery, and pastry products subsector (1071) is characterized by small businesses often closely linked to local demand; the sector is highly spatially dispersed (Gini index 0.0038, Ellison–Glaeser index −0.0001; see Table 8). The analysis detected a reduced number of relevant clusters, being present in 601 LLSs (78 percent of the LLSs with activity in the food industry). Given the importance of this subsector in the three-digit sector (107)—3,337 companies (87.3 percent), 41,292 jobs (75.9 percent)—it induces a bias regarding the small relevance of clusters at three-digit-level sectors. The distortion is explained again to the effect of a subsector (four digits) that is very large in size and whose spatial distribution is highly dispersed.
Manufacture of other food products sector (108)
The sector’s spatial agglomeration significantly diverged according to sectorial breakdown (Tables 5 and 6). A total of twelve relevant clusters were identified at the three-digit level (108). The number of relevant clusters identified at the four-digit level produced these results: Manufacture of cocoa, chocolate, and confectionery products, twenty-five relevant clusters. Preparation of coffee, tea, and infusions, eighteen relevant clusters. Preparation of spices, sauces, and condiments, twenty-eight relevant clusters. Preparation of prepared dishes and meals, eighteen relevant clusters. Preparation of homogenized food preparations and dietetic food, sixteen relevant clusters. Preparation of other food products, sixteen relevant clusters.
In this case, the four-digit-level subsectors revealed the presence of relevant clusters that were not apparent when the sector was analyzed at a three-digit level. This can be explained by the fact that the four-digit subsectors showed a high spatial agglomeration (see the spatial concentration indexes of Table 8), but their localization patterns were very heterogeneous. The correlations of the spatial distributions of these sectors (both in number of companies and in employees) were very small and statistically insignificant. If we analyze the spatial distribution of employment and of the relevant clusters at the regional level, substantial differences are observed in the subsectors analyzed (see Table 8). For example, if we look at the four main regions (top four) in terms of employment in each sector, ten different regions are identified. If we analyze the five most relevant clusters (top five) of each four-digit sector, twenty-seven LLSs are identified for the six sectors analyzed; that is, the top five clusters are different depending on the subsector that we analyze. That is, in each four-digit sector, there are substantial differences in their location and agglomeration. This distortion responded to the impact of spatial heterogeneous subcategories.
Discussion and Conclusions
Although most academic studies have focused on specialized productive agglomeration models centered on the traditional manufacturing industry, some studies have spread to other sectors, such as agrifood. However, to date, few studies have attempted to identify food clusters in a national territory based on systematized quantitative data methods with high territorial and sectoral disaggregation. A first important point to note is that, in the agrifood industry, these agglomerations can only be detected if measures and methods are used with a higher level of disaggregation than in the case of other industries. It is important to choose the right aggregation level in this industry because the structure of the Spanish food processing industry, with more than thirty-five subsectors and about 360,000 employees, is too complex and too heterogeneous to be analyzed at a highly aggregated level (three-digit) or in its entirety. This study contributes empirically to the body of knowledge about Spanish industry clusters and applies established conceptual approaches and methodologies to a new empirical context. In this research, we tried to make progress in this field by identifying food industry clusters in Spain.
Our results show geographical areas where agglomerations of agrifood subsectors are located, enabling the identification of clusters. In total, 196 relevant clusters are identified in the ten sectors (three-digit), and the four-digit-level analysis reveals the existence of 512 relevant clusters. Multispecialization and spatial concentration are already shown in the studies of Boix and Galletto (2006, 2008) and Boix et al. (2015). The results of these studies—applying the Italian methodology—show us that the agrifood industry is one of the sectors with the largest number of industrial districts. Although most of the districts previously detected have been identified in our analysis as relevant clusters—mainly as very relevant clusters (CI > 512)—a differential result of our research is that other relevant and potential clusters have been identified that are not visible in the results of the Italian methodology.
The quantitative relevance of the clusters detected in our research is consistent with the results of the few studies that have sought to identify agrifood clusters in a given territory using systematized methods and based on quantitative data: Italy (Unioncamere 2009), Spain (Giner and Santa-María 2017), and Germany (Hoffmann, Hirsch, and Simons 2017). Also, the research contributes to expanding studies focused on food-related industries such as those developed in Italy (Iacoponi 1990; Fanfani 1994; Bertolini 1998; Brasili and Ricci Maccarini 2003; Bertolini and Giovannetti 2006) and other European countries (Lagnevik et al. 2003).
In our analysis, the subsectors with the largest number of relevant clusters are in line with the case studies about agrifood clusters in Spain: preparation of fruit and vegetable juices (twenty-nine clusters) and other processed and preserved fruits and vegetables (thirty-six clusters; Gallego Bono 2007; Aznar Sánchez 2011; Martínez-Carrasco and Martínez Paz 2011; Giner and Santa-María 2018a); manufacture of olive oil (forty-five clusters; Sanz Cañada and Macías Vázquez 2005; García Brenes and Sanz Cañada 2012; Rodríguez-Cohard and Parras 2011); manufacture of cocoa, chocolate, and confectionery products (twenty-five clusters; Molina-Morales et al. 2015); and winemaking (thirty-two clusters; Aldecua et al. 2017; Larreina, Gómez-Bezares, and Aguado 2011; Macías Vázquez 2011; Sánchez-Hernández 2011; Soler Montiel 2011). These studies highlight the geographical proximity between the components of the cluster as a factor which generates agglomeration economies through internal specialization and division of labor. The network of connections and the informal relationships within the cluster that favor transmission of knowledge are also analyzed. Such functional and social relationships between actors are a crucial element of clusters. It has been shown in the theoretical section that contexts of geographical proximity, such as those defined as industrial clusters (Porter 1998; Tallman et al. 2004; Inkpen and Tsang 2005), can be viewed as networks because many different actors are involved, including final product firms, suppliers, customers, service providers, local institutions, policy agents, and so on. Thus, in further studies, it will be important to analyze through qualitative analysis if network effects and other cluster-inherent structures are relevant for a specific subsector region, specifically in those clusters identified in our research and not detected previously.
On the other hand, in Spain, the cluster has been used as a policy instrument, due to its positive effects on competitiveness (Preissl and Solimene 2003; Commission of the European Communities 2008). In the last decade, the Spanish government designed and implemented an industrial policy aimed at supporting the development of innovative clusters identified as “associations of innovative enterprises” (Ybarra and Domenech 2014). Our results—especially for very relevant clusters—are consistent with the associations of innovative enterprises in the agrifood sector.
Regarding the location of clusters, the research shows that most of the 540 relevant clusters (with CI > 64; 84 percent) were in rural areas in rural environments (65.7 percent) and in densely populated areas (18.3 percent). In the case of Germany (Hoffmann, Hirsch, and Simons 2017—one of the few studies addressing the identification of clusters with high sectoral disaggregation for a country), most clusters are in densely populated areas and in large urban areas (approximately 80 percent). Therefore, relevant cluster location patterns in Spain are very different from those analyzed in Germany. Other empirical studies (Boix and Vaillant 2010; Llorente-Pinto et al. 2014; Sánchez-Hernández et al. 2015) have shown the relevance of rural areas compared with urban areas in Spain’s agrifood industry.
It is worth noting that the number of relevant clusters was higher at the four-digit level, and concentrations in the industry were identified that would not have been detected at a higher sectorial aggregation level. This aspect is consistent with the preliminary analysis of Ellison and Glaeser (1997) and subsequent developments; they discuss scope in the sense of an industrial definition (i.e., whether concentration is principally a phenomenon which exists at the level of individual industries or whether it is characteristic of broad industry classes as well). Our analysis applied different sectorial disaggregation (three and four digits) which highlights how the results are substantially different.
Furthermore, the analysis of four significant three-digit subsectors in the Spanish food industry made it possible to approximate an explanatory framework of the factors that generate a lower presence of relevant clusters in three-digit sectorial disaggregation with respect to four-digit disaggregation. Specifically, we highlight two facts: the impact of four-digit subsectors with a high spatial agglomeration but with very heterogeneous localization patterns and the effect of a subsector (four digits) that is very large in size and whose spatial distribution is highly dispersed. This is another of the contributions of our research at the methodological and results level.
In this study, identifying agrifood clusters made it possible to further our understanding of the phenomenon of agroindustrial firm agglomerations as well as their localizations and main specializations. We thus compensated for the lack of significant studies on Spanish food sectors by applying our top-down methodological approach and following a high level of territorial and sectorial disaggregation. The index used in our research (CI) can provide a starting point to identify clusters and is a standard method of identification for these industrial structures.
However, some limitations of our investigation cannot be ignored. One such limitation relates to the source of information used in the analysis: only the location data of the firms were used, whereas it would be ideal to use business units or establishments.
A second set of limitations is associated with methodological aspects. One limitation refers to the use of the statistical classification of economic activities by NACE. The use of these code-based classifications faces potential difficulties and errors that can produce distorting results (Kile and Phillips 2009). In fact, these classifications present levels of inconsistency and unreliability within the same category and in the comparison analyses (Jacobs and O’Neill 2003). Bean (2016) has summarized the main limitations of these classifications.
The CI used in the identification shows a series of limitations. One of the possible limitations of the index is subjectivity when setting the minimum threshold to identify relevant or potential clusters. The following drawbacks of the CI need to be pointed out: the inclusion of the relative ID in the calculation can lead to greater difficulty in detecting clusters in larger territorial units than in smaller ones. Additionally, correcting with the relative PS could obscure clusters mainly consisting of large firms. A main disadvantage of the CI is that it does not allow identification of the functional relationships between companies and industries (Koschatzky and Lo 2007; Titze, Brachert, and Kubis 2011). Lastly, the research approach based on a quantitative analysis can identify clusters that do not fit the conceptual and empirical framework of clusters. Therefore, it is important to highlight the benefits of using both quantitative and qualitative techniques together (De Propris 2005).
We propose several lines of future research. On the one hand, it is necessary to perform a more in-depth quantitative analysis based on CI components (relative IS, relative ID, and relative PS); on the other, improvements in innovative research techniques would allow for the development of a new index that could help overcome CI’s methodological limitations.
Based on the results of our analysis, researchers can now consider the spatial dimension of clusters based on their geolocations. For example, through exploratory spatial data analysis, it can be shown whether there is a significant trend of grouping similar CI values (cluster typology) in nearby areas in the territory with significant spatial patterns in statistical terms.
Because the use of code-based sectorial classifications faces potential difficulties and errors that can produce distorting results, a future line of research may be the analysis of agrifood clusters without the constraints of sectoral classifications, such as that carried out by Molina-Morales and Martínez-Fernández (2019) in the ceramics sector.
It is also important to complement CI-based identification with the use of more qualitative (bottom-up) approaches. It would be relevant to analyze food industry sectors with numerous clusters in more detail, combining quantitative and qualitative techniques (De Propris 2005), thus describing the characteristics of these areas, how they operate, and their temporal dynamics. Relational approaches, social capital, and network of knowledge should be included in future research.
Footnotes
Acknowledgments
The authors are grateful for the helpful comments provided by the two anonymous reviewers and for the work of the editors.
Declaration of Conflicting Interests
The author(s) declared no potential conflicts of interest with respect to the research, authorship, and/or publication of this article.
Funding
The author(s) received no financial support for the research, authorship, and/or publication of this article.