




Abstract
The spatial concentration of firms has long been a central issue in economics under both the theoretical and the applied point of view mainly due to the important policy implications. A popular approach to its measurement, which does not suffer from the problem of the arbitrariness of the regional boundaries, makes use of micro data and looks at the firms as if they were dimensionless points distributed in the economic space. However, in practical circumstances the points (firms) observed in the economic space are far from being dimensionless and are conversely characterized by different dimension in terms of the number of employees, the product, the capital, and so on. In the literature, the works that originally introduce such an approach disregard the aspect of the different firm dimension and ignore the fact that a high degree of spatial concentration may result from the case of both many small points clustering in definite portions of space and only few large points clustering together (e.g., few large firms). We refer to this phenomenon as clustering of firms and clustering of economic activities. The present article aims at tackling this problem by adapting the popular K-function to account for the point dimension using the framework of marked point process theory.
Introduction
Spatial economics theories show that economic integration may boost spatial concentration of economic activities and industrial specialization both at a regional and at an international level (Bickenbach and Bode 2008). Furthermore, due to the external increasing returns driven by the spatial concentration, the core regions (where spatial clusters of firms are more likely to occur) may reach higher levels of economic growth than the peripheral regions (see Krugman 1991; Fujita, Krugman, and Venables 1999 among others). As a consequence, the phenomenon of spatial concentration is of paramount importance to explain the determinants of growth and development on one hand and regional disparities on the other hand.
Fostered by the centrality of these issues under the theoretical and the practical point of view, a variety of empirical studies have tried to develop proper indices and statistical tests to measure the degree of spatial clustering in real industrial situations. Under this respect, a series of recent articles (Arbia, Espa, and Quah 2008; Arbia et al. 2010; Marcon and Puech 2003, 2010; Duranton and Overman 2005, 2008) have introduced the use of distance-based methods. These methods are more robust than the traditional measures of spatial concentration (such as Gini Index [Gini 1912, 1921] or Ellison-Glaeser Index [Ellison and Glaeser 1997]), which make use of regional aggregates and thus depend on the arbitrariness of the definitions of the spatial units. The distance-based methods, conversely, make use of micro-economic data, treating each firm as a point on a map and studying their spatial distribution with the methods borrowed from the so-called point pattern analysis (Diggle 2003).
In many empirical circumstances where the presence of spatial clusters of firms is tested using micro-geographical data, an important element to be taken into account is represented by the firm dimension.
Indeed, a high level of spatial concentration can be due to two very different phenomena (see Figure 1). Namely,

Two extreme paradigmatic situations of spatial concentration. Case 1. Clustering of firms; Case 2. Clustering of economic activities.
Case 1: many small firms clustering in space, and
Case 2: few large firms (in the limit just one firm) clustering in space.
We can refer to the first case as the case of clustering of firms and to the second as the case of clustering of economic activities.
A proper test for the presence of spatial clusters should thus consider the impact of the firm dimension on industrial agglomeration by clearly distinguishing these two cases.
Under this respect, Marcon and Puech (2010) and Duranton and Overman (2005) have extended the use of Ripley’s K-function (Ripley 1977) considering firm size treating it as a weight attached to each of the points constituting the pattern. Both quoted articles developed relative measures of the spatial concentration, detecting the extra concentrations of firms belonging to a specific industry with respect to the distribution of firms of the whole economy. Following this procedure, a positive (or negative) spatial dependence between firms is detected when the pattern of a specific sector is more aggregated (or more dispersed) than the pattern of the whole economy. Although measures of relative spatial concentration are very useful in controlling for the idiosyncratic characteristics of the territories under study, they do not allow comparisons across different economies (see Haaland et al. 1999; Mori et al. 2005 for a more detailed discussion).
In this article, we propose a similar extension of Ripley’s K-function which leads to an absolute (rather than a relative) measure of the industrial agglomeration and which allows comparability among different empirical situations. More specifically, referring to the theory of marked point processes, we develop a stochastic mechanism that generates weighted point patterns of firms representing stylized facts of the different phenomena occurring in real cases (essentially spatial randomness or spatial concentration in the sense indicated in case 1 or case 2 above). The values assumed by the proposed measure in the various cases constitute the benchmark that allows us to formally test the departure from spatial randomness.
We will present our new approach along the following lines. In the section on Measuring the Spatial Concentration of Firms Disregarding Size: The Basic K-Function, we briefly discuss the classical Ripley’s -function which represents the starting point to develop more sophisticated measures of spatial concentration. The section, on Measuring The Spatial Concentration of Firms Considering Size: The Mark-Weighted K-Function, will be devoted to introduce the stochastic mechanism based on the marked point processes theory that allows us to develop a test for the presence of absolute spatial concentration of firms and economic activities. In this section, we introduce the new model, discuss the meaning of the model’s parameters in the context of spatial concentration of firms and economic activities, present some simulation results to better illustrate how the model works in practice. The section on A Case Study: The Localization of the High- and Medium-High Technology Manufacturing Industry in the Metropolitan Areas of Milan and Turin consists of an empirical application of this model for the study of the spatial distribution of the high- and medium-high-technology manufacturing industry in the metropolitan areas of Milan and Turin. The final section comprises a discussion of the results, some conclusions, and directions for further studies in the field.
Measuring the Spatial Concentration of Firms Disregarding Size: The Basic K-Function
It is probably fair to say that Ripley’s K-function (Ripley 1976, 1977) is currently the most popular distance-based measure to summarize the cumulative characteristics of a spatial distribution of events in the context of microgeographic data. It has indeed proved a very versatile tool to test for the presence of spatial concentration within a stationary point pattern where each event is considered as a dimensionless point. As a consequence, the K-function has been largely applied in various fields such as geography, ecology, epidemiology, and, more recently, economics (see Arbia and Espa 1996; Marcon and Puech 2003).
The K-function is defined as follows:

In order to develop a test for the presence of absolute spatial concentration, we can rely on the fact that for many stochastic processes, it is possible to compute the expectation in the right-hand side of equation (1), so that

The test for the presence of absolute concentration based on Ripley’s K-function, however, can be used to detect industrial agglomeration only if firms can be considered to have the same dimension. Indeed, in a context where economic activities are different in terms of dimension with the presence of small, medium, and large firms, a point pattern is not a good representation of the location pattern of economic activities and, as a result, the K-function is no more a proper tool to summarize the spatial distribution. For instance, the simple K-function cannot recognize a situation like the one reported in Figure 1 as Case 2 as a cluster. In other words, the test do not control for the overall agglomeration of manufacturing (Duranton and Overman 2005).
In such a context, in order to define a proper test, we need to refer to the concepts and methods of the marked point process statistics, which is a branch of spatial statistics devoted to analyze sets of events scattered in space, where each event is defined not only by its spatial location but also by a mark, a supplementary set of information that might be either quantitative or qualitative (Illian et al. 2008).
Measuring the Spatial Concentration of Firms Considering Size: The Mark-Weighted K-Function
The Mark-Weighted K-Function
The mark-weighted K-function, indicated as


Turning now to the estimation aspects, following Penttinen (2006), a proper approximately edge-corrected unbiased estimator of

In an economic context, in which the marks are the values of a quantitative variable representing the firm’s size, the mark-weighted K-function might be used to develop a test for the presence of absolute spatial concentration. However, we need to derive the benchmark value of the function representing the null hypothesis of spatial randomness. For this reason, the next paragraph is devoted to derive a stochastic model to generate marked point patterns of firms which is able to represent the stylized situations of spatial randomness and concentration in the meaning of case 1 (i.e., many small firms clustering in space) and case 2 (i.e., few large firms clustering in space).
A Model for the Null Hypothesis of Spatial Randomness
The basic idea we follow is that the spatial concentration of economic activities (in the sense of Case 1 and Case 2) can be originated by some form of correlation between the spatial point intensity and the marks. This would imply, for instance, that in regions characterized by high spatial point intensity the marks tend to be systematically large if such a correlation is positive or, conversely, small if such correlation is negative.
To define a model that incorporates such a correlation structure, we refer to the design, already explored by Ho and Stoyan (2008), of an intensity-marked Cox process, where the spatial point intensity is driven by a Cox process and the marks are realizations of a process whose parameters are conditioned by the values of the spatial point intensity.
The Log Gaussian Cox Process for the Spatial Point Intensity
To start with we assume that the spatial point intensity can be modeled as a log Gaussian Cox process (a specific kind of Cox process proposed by Møller, Syversveen, and Waagepetersen 1998). According to this model, each point pattern represents a partial realization of an inhomogeneous Poisson process characterized by a spatial intensity function
The log Gaussian assumption is particularly useful because explicit expressions can be derived for the intensity and covariance structure of the point process. Indeed, according to the moment generating function of a log Gaussian distribution, the intensity


The Marks Process
Our model assumes that the mark

The two constants a and b appearing in equation (3) are the model parameters. It is important to understand the role of these two parameters in the generation of the patterns of firms and the way in which they can model the relationship between the intensity with which firms are distributed in space and their dimension. More specifically, a is the parameter driving the correlation between the spatial point intensity process and the marks process. When a = 0, the marks are independent of the spatial intensity. Conversely when a > 0, it generates marks that tend to be larger (i.e., larger firms) in regions characterized by a high spatial point intensity. Finally, in those cases where a < 0, the marks tend to be smaller (and hence the firms of smaller dimension) in regions characterized by a high spatial point intensity. On the other hand, the parameter b represents the perturbation effect of the residual process on the correlation between marks and intensity. The larger the absolute value b, the more the residual process disturbs the phenomenon of correlation controlled by a.
The log Gaussian assumption makes the computation of the expected value of the marks process mathematically tractable, indeed we have:

The model proposed here is particularly interesting having in mind the economic application and specifically the study of firm location. In fact in the application of the present methodological framework to the problem of assessing industrial agglomeration, the marked point patterns generated when a = 0 represent the null hypothesis of spatial randomness of firms. Similarly, a > 0 and a < 0 refer to the alternative hypothesis of spatial concentration of economic activities in the sense expressed in case 1 and case 2, respectively, in the Introduction section.
To better illustrate how the model works, in the reminder of this section we will show some realizations of a marked point process. In what follows, all the generated patterns are obtained using the same random seed so that all realizations are directly comparable and the differences between the patterns can be ascribed only to differences in the model parameters. Figure 2 shows the realization of the underlying spatial point intensity process given as

A realization of the underlying spatial point intensity (gray-scale image).
In order to illustrate the role of parameter a in driving the correlation between the spatial point intensity and the marks, Figure 3 displays different realizations of the marked point process with different values for a. The six simulated marked point patterns appearing in Figure 3 show the net effect of parameter a since b is always set to zero. In each pattern, the marks are rescaled to the unit interval, and each point is represented by a circle with radius proportional to its rescaled mark. Figure 3 shows quite clearly that, for positive values of a, the marks tend to be larger where the spatial point intensity is higher, that is approximately at the center of the unitary area (see patterns i, iii, and v). On the other hand, for negative values of a, the marks tend to be smaller where the spatial point intensity is higher (see pattern ii, iv, and vi). The two kinds of clustering situation—namely, case 1 and case 2—tend to be more evident when a increases in absolute value.
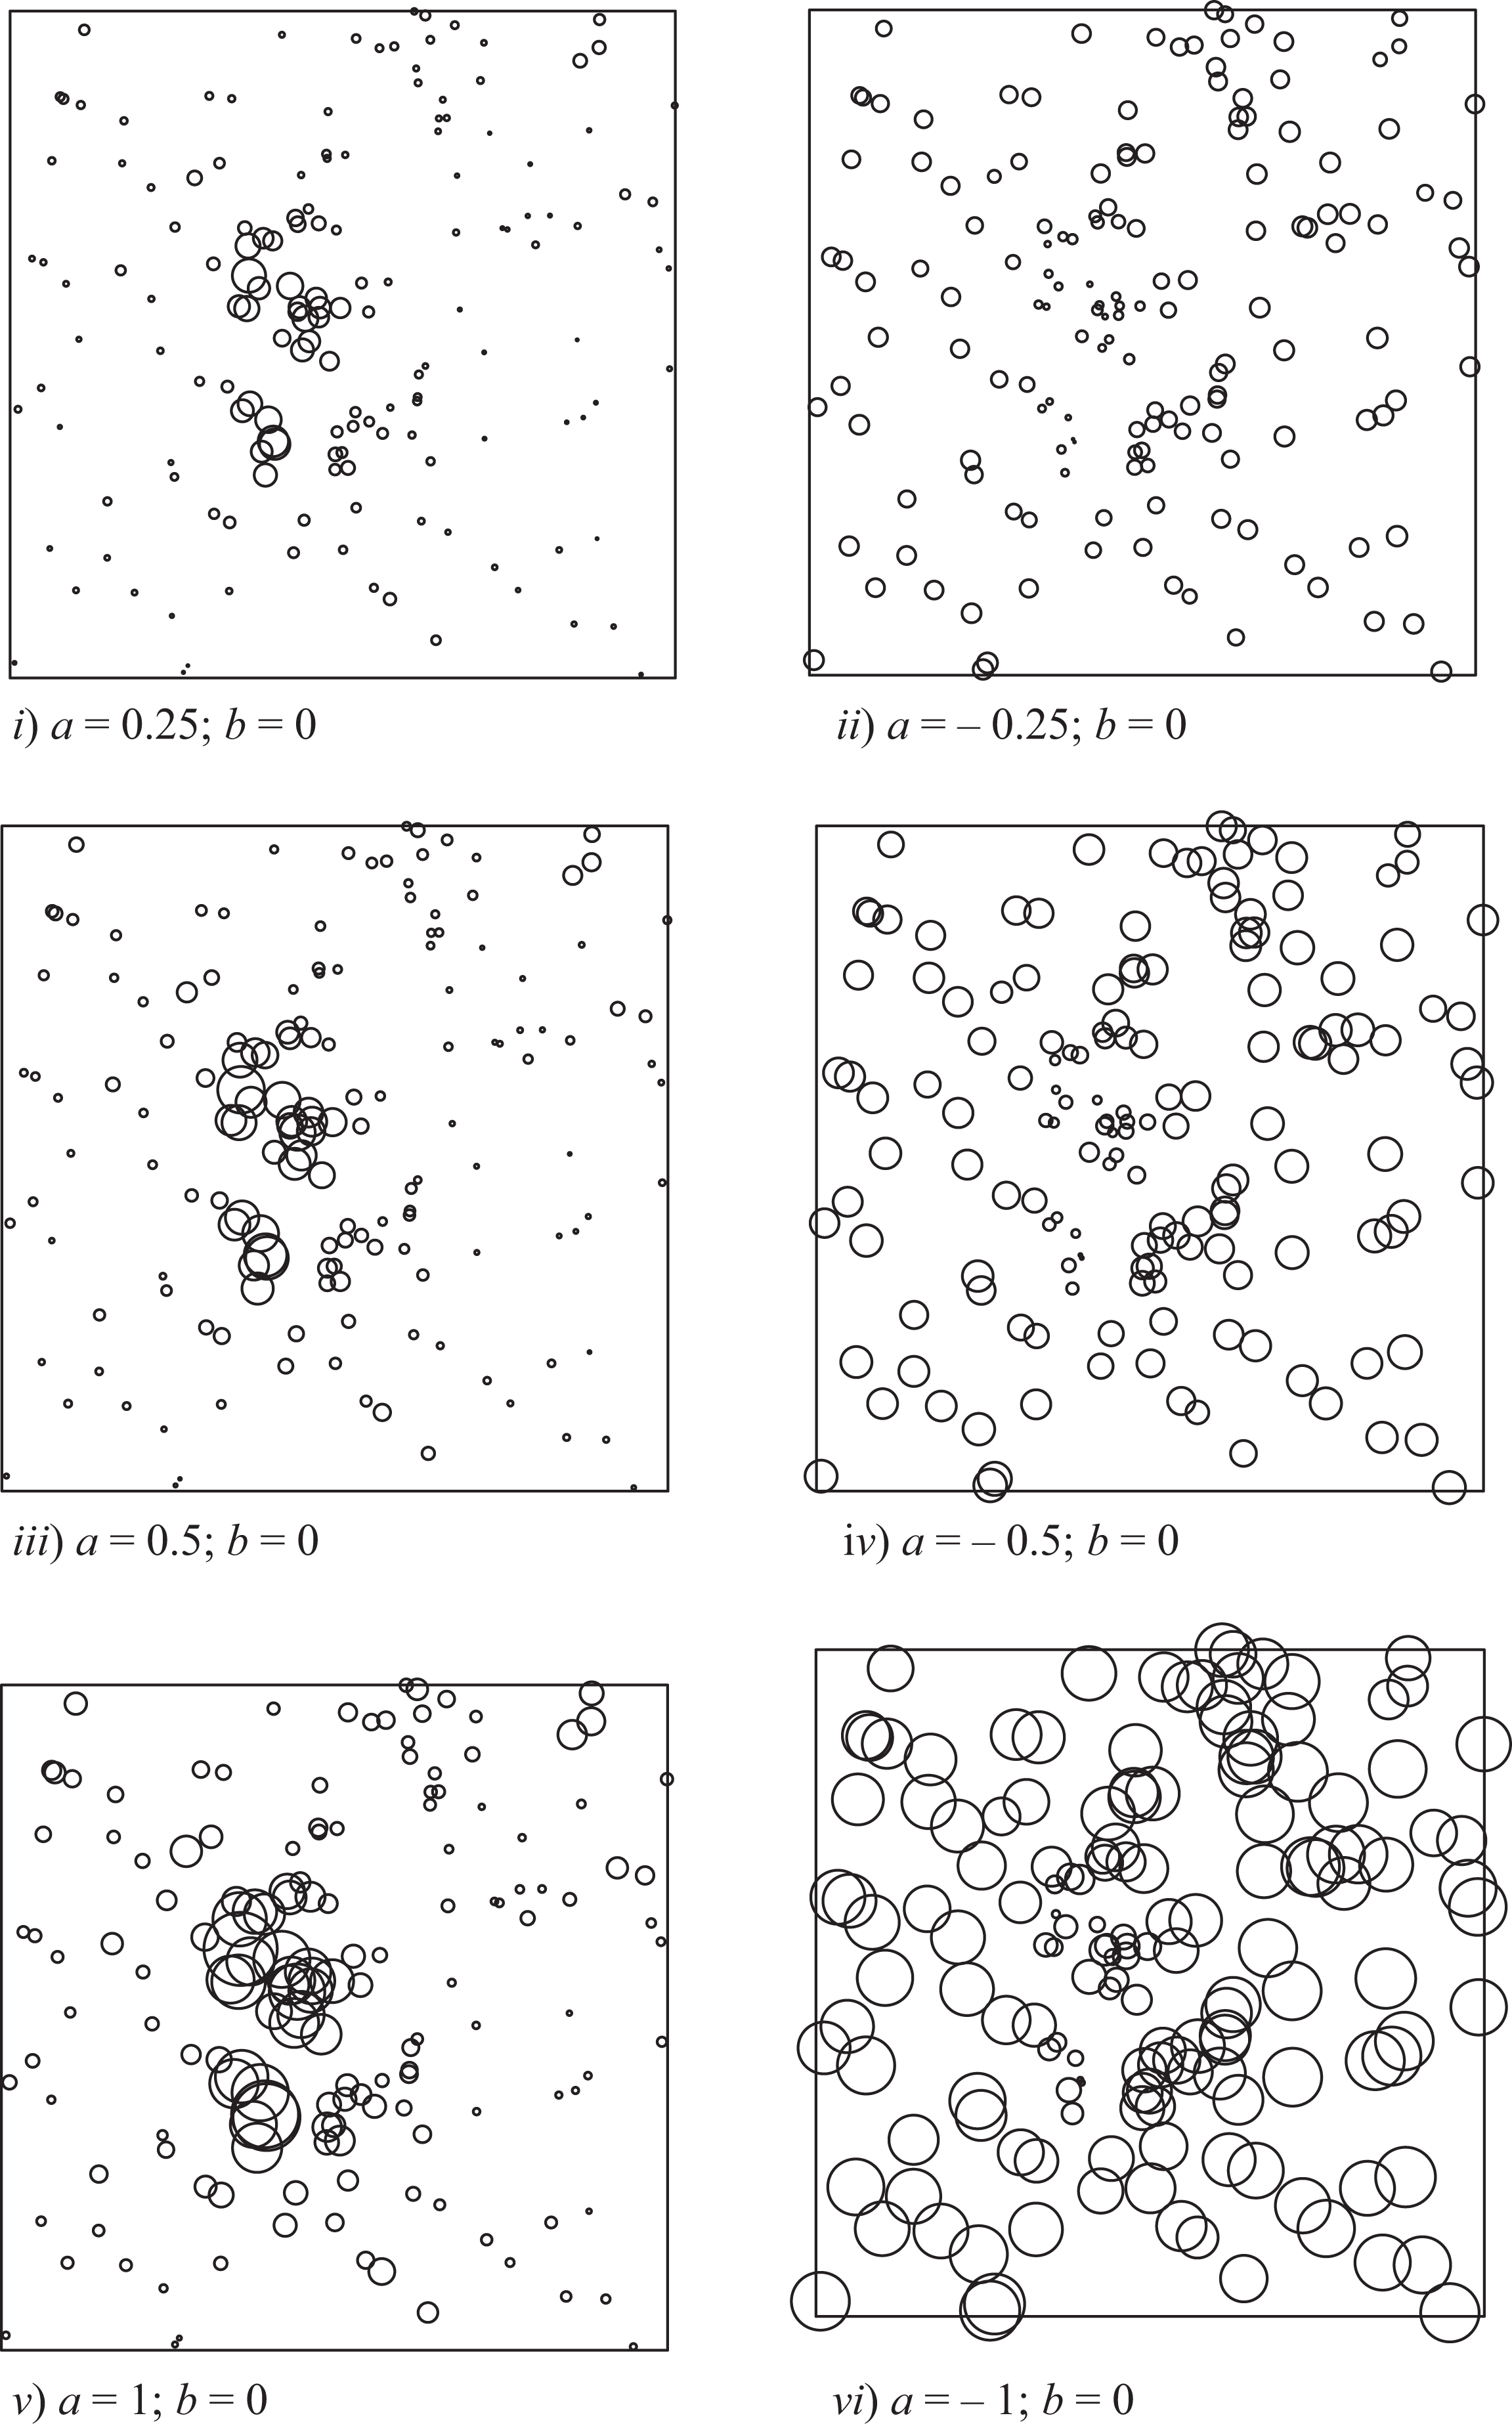
Simulated patterns of marks according to model 3. The figure illustrates the role of parameter a when b = constant = 0.
Figure 4 shows six simulated marked point patterns with different values for b, which illustrate the role of this parameter in disturbing the correlation between the spatial point intensity and the marks. In all six cases, the residual process
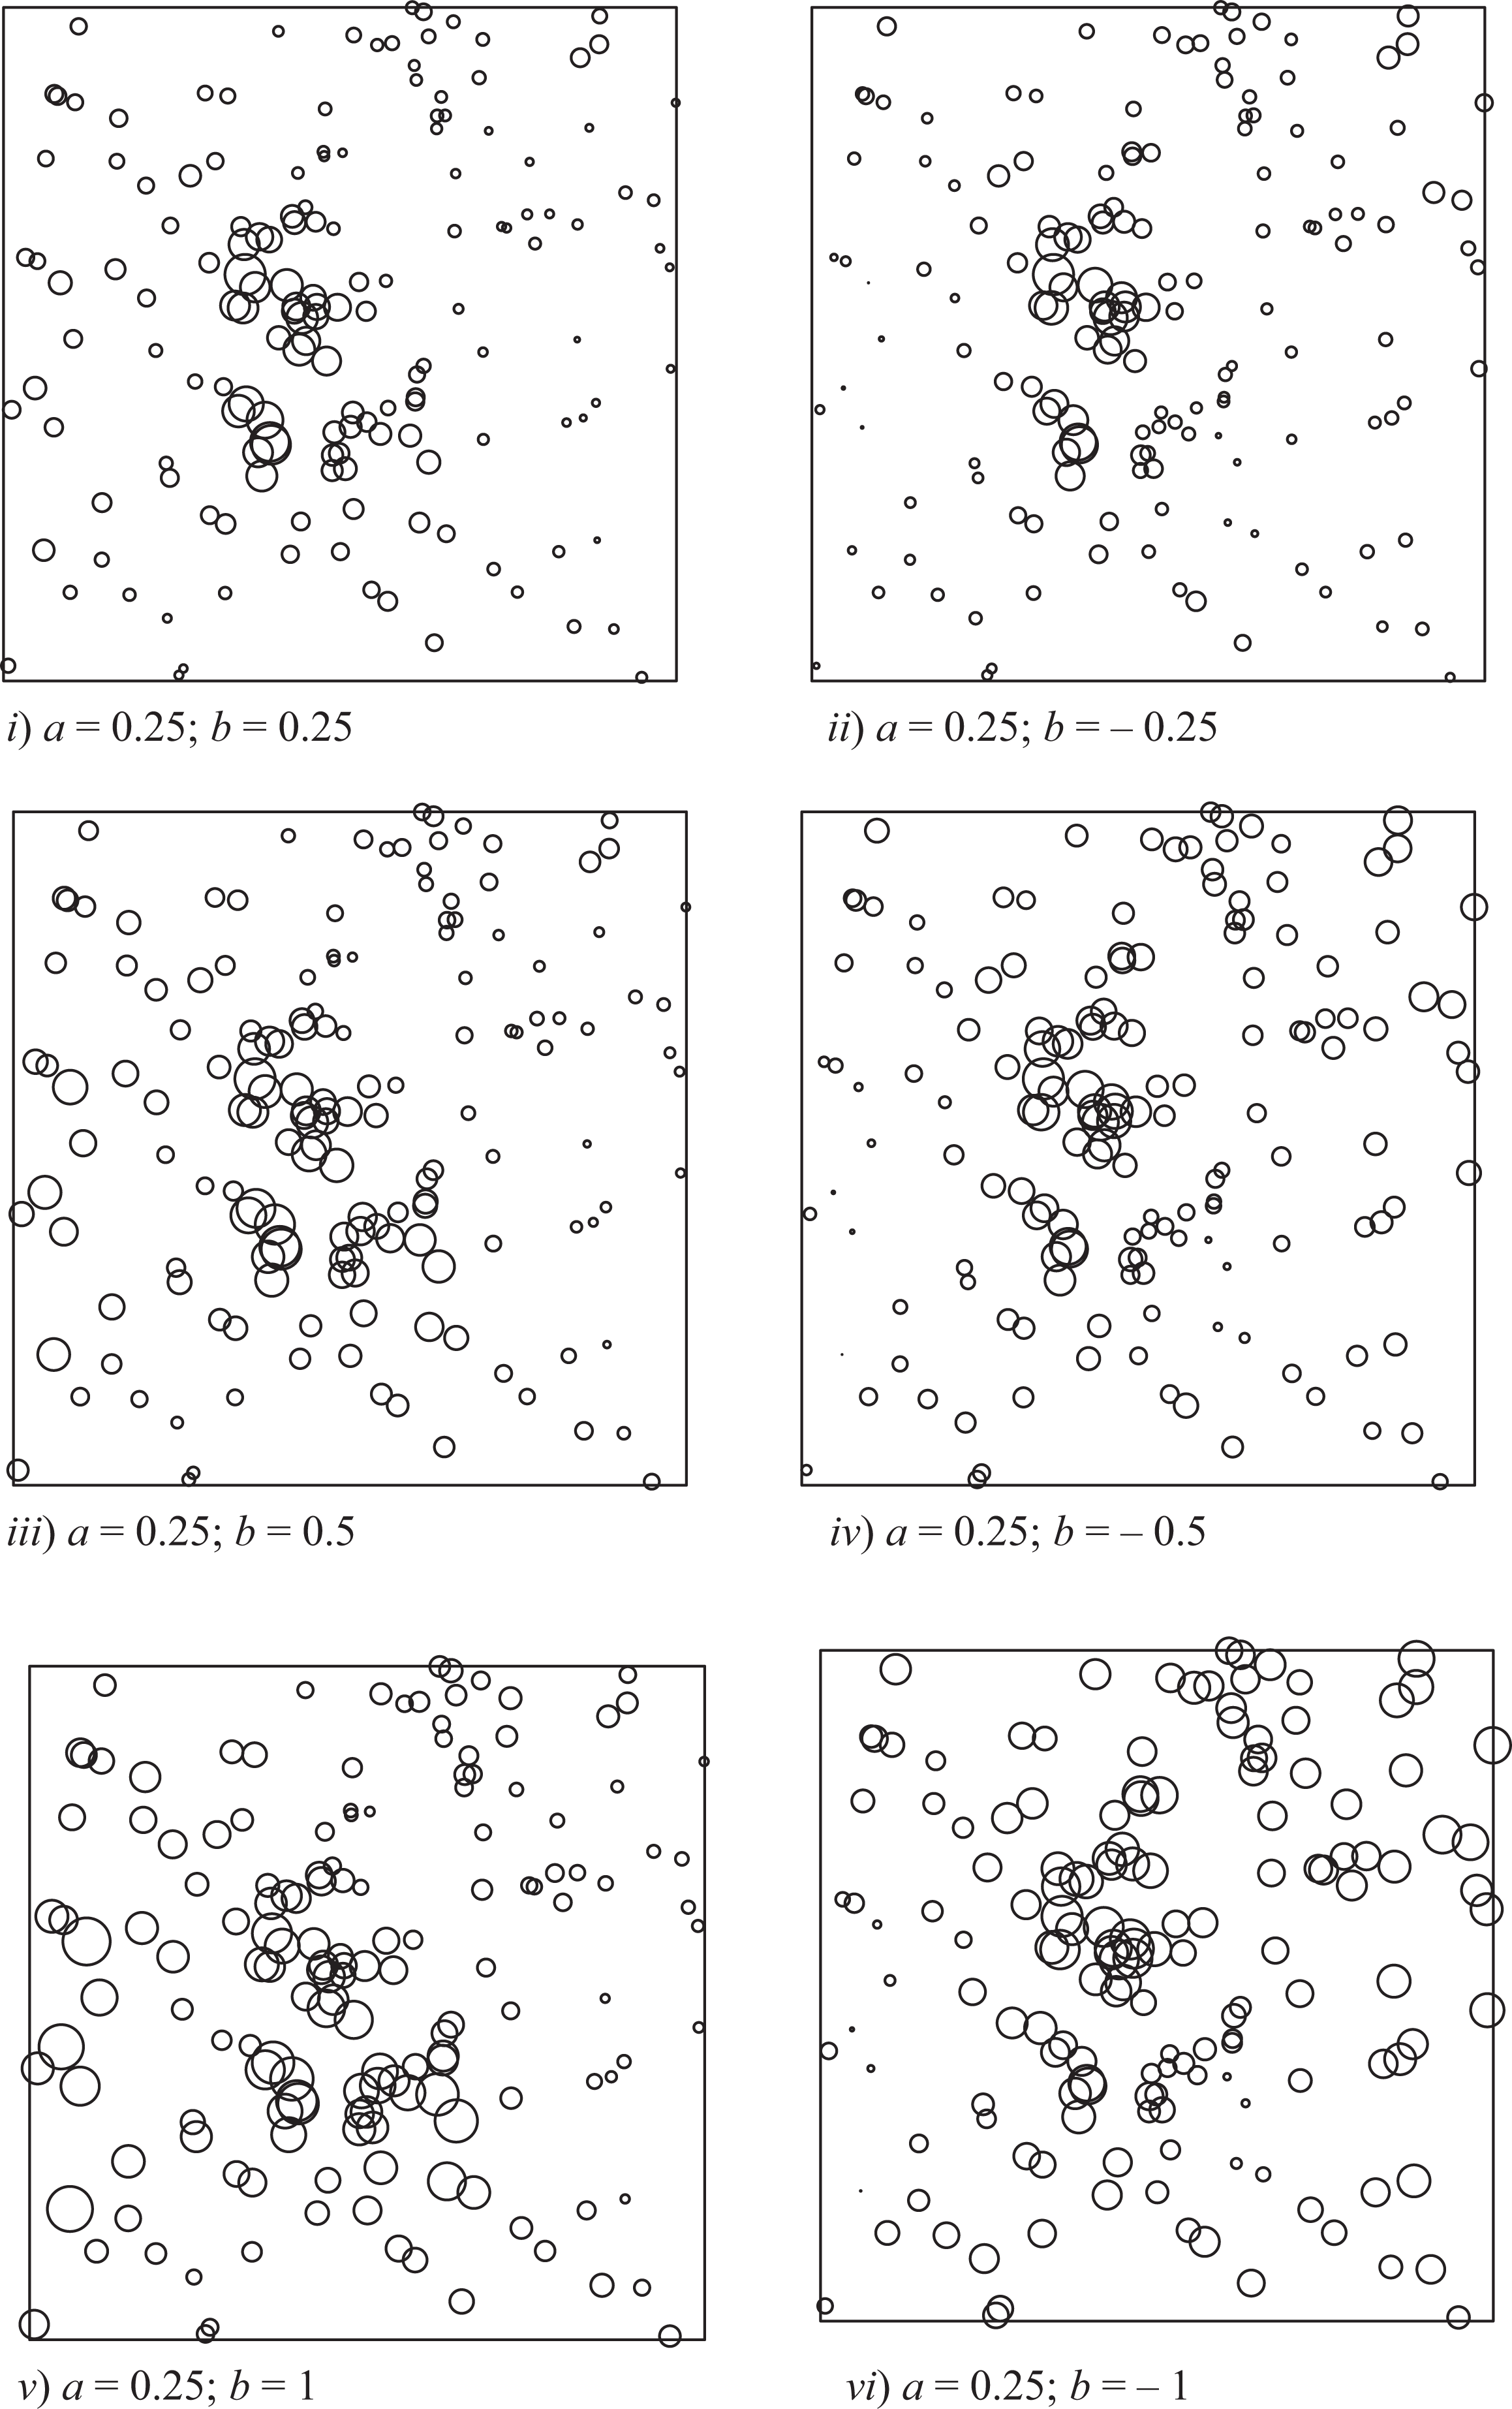
Simulated patterns of marks according to model 3. The figure illustrates the role of parameter b when a = constant = 0.25.
The Benchmark Value of the Mark-Weighted K-Function
Because of the mathematical tractability of the model defined above, the corresponding theoretical mark-weighted K-function can be derived in a closed form. Indeed, for such a marked log-Gaussian Cox process (for d >0), the mark-weighted K-function assumes the form:


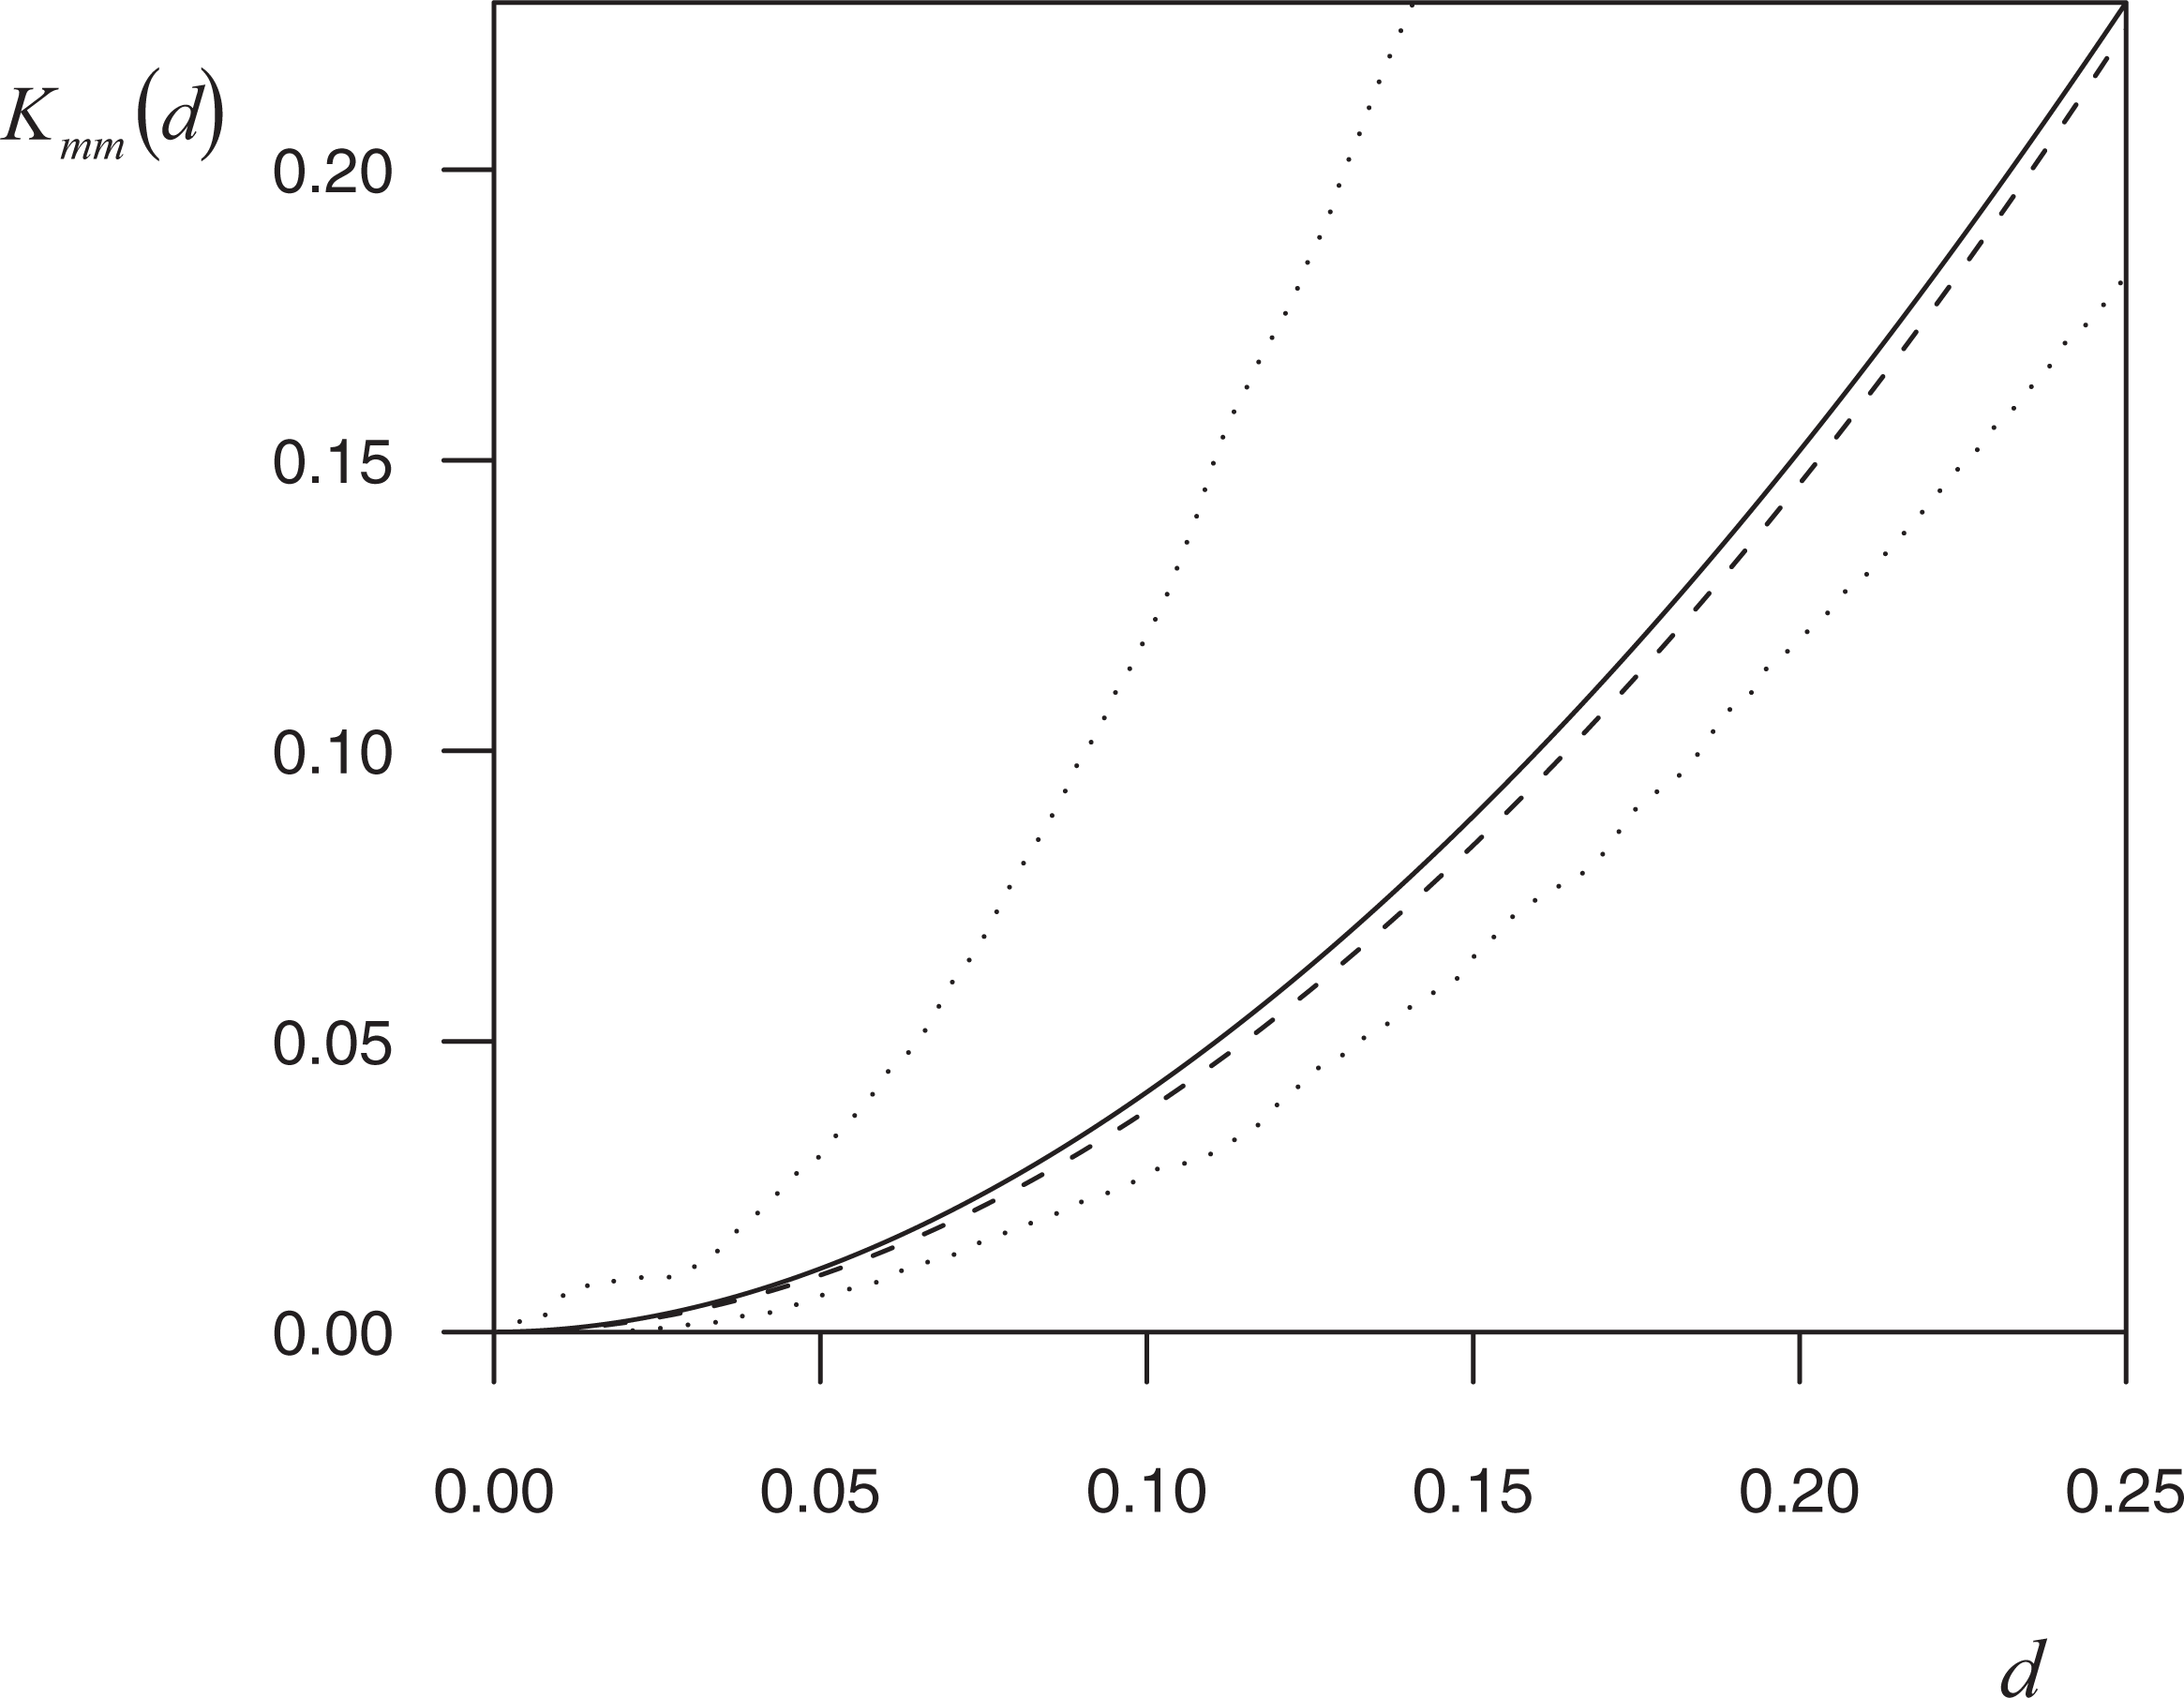
Mean of
As can be seen from equation (5), the functional form of the benchmark of spatial randomness is affected by the characteristics of the underlying random field
The Statistical Significance of the Hypothesis of Spatial Randomness: A Monte Carlo Test
In order to identify the presence of absolute spatial concentration in an observed location pattern of firms, one can then evaluate the statistical significance of the deviations of the estimated mark-weighted K-function,

In point of fact, adopting this simplified version of the model is like assuming that the value of the disturbance parameter b is fixed, equal to 1. With the aim of testing for the presence of spatial randomness, this assumption is however innocuous since the parameter b does not appear in the benchmark represented by equation (5).
The artificial patterns simulated by the model must have a number of points conditioned on the same number of points of the observed pattern. The values of the model parameters (
Concerning the estimate of the model parameters on the observed data, the values of

The values of the parameters

A Case Study: The Localization of the High- and Medium-High-Technology Manufacturing Industry in the Metropolitan Areas of Milan and Turin
The empirical part of this article concerns the analysis of the spatial distribution of the high- and medium-high technology manufacturing firms, 2 operating between 1996 and 2004, located in the municipalities of Milan and Turin. The data set is a subset of the Analisi Informatizzata Delle Aziende (AIDA) archive (Bureau Van Dijk) which provides the geographic location and size (in terms of number of employees) of the productive plants of 162 and 24 limited companies operating, respectively, in Milan and Turin. These companies are all single plant and hence have a single production site. As a way of illustration, Figure 1 shows the spatial distribution of these firms in the municipalities of Milan (Figure 6a) and Turin (Figure 6b) by the means of marked point patterns where the location of each plant is identified by a circle with radius proportional to the number of employees of the firm.
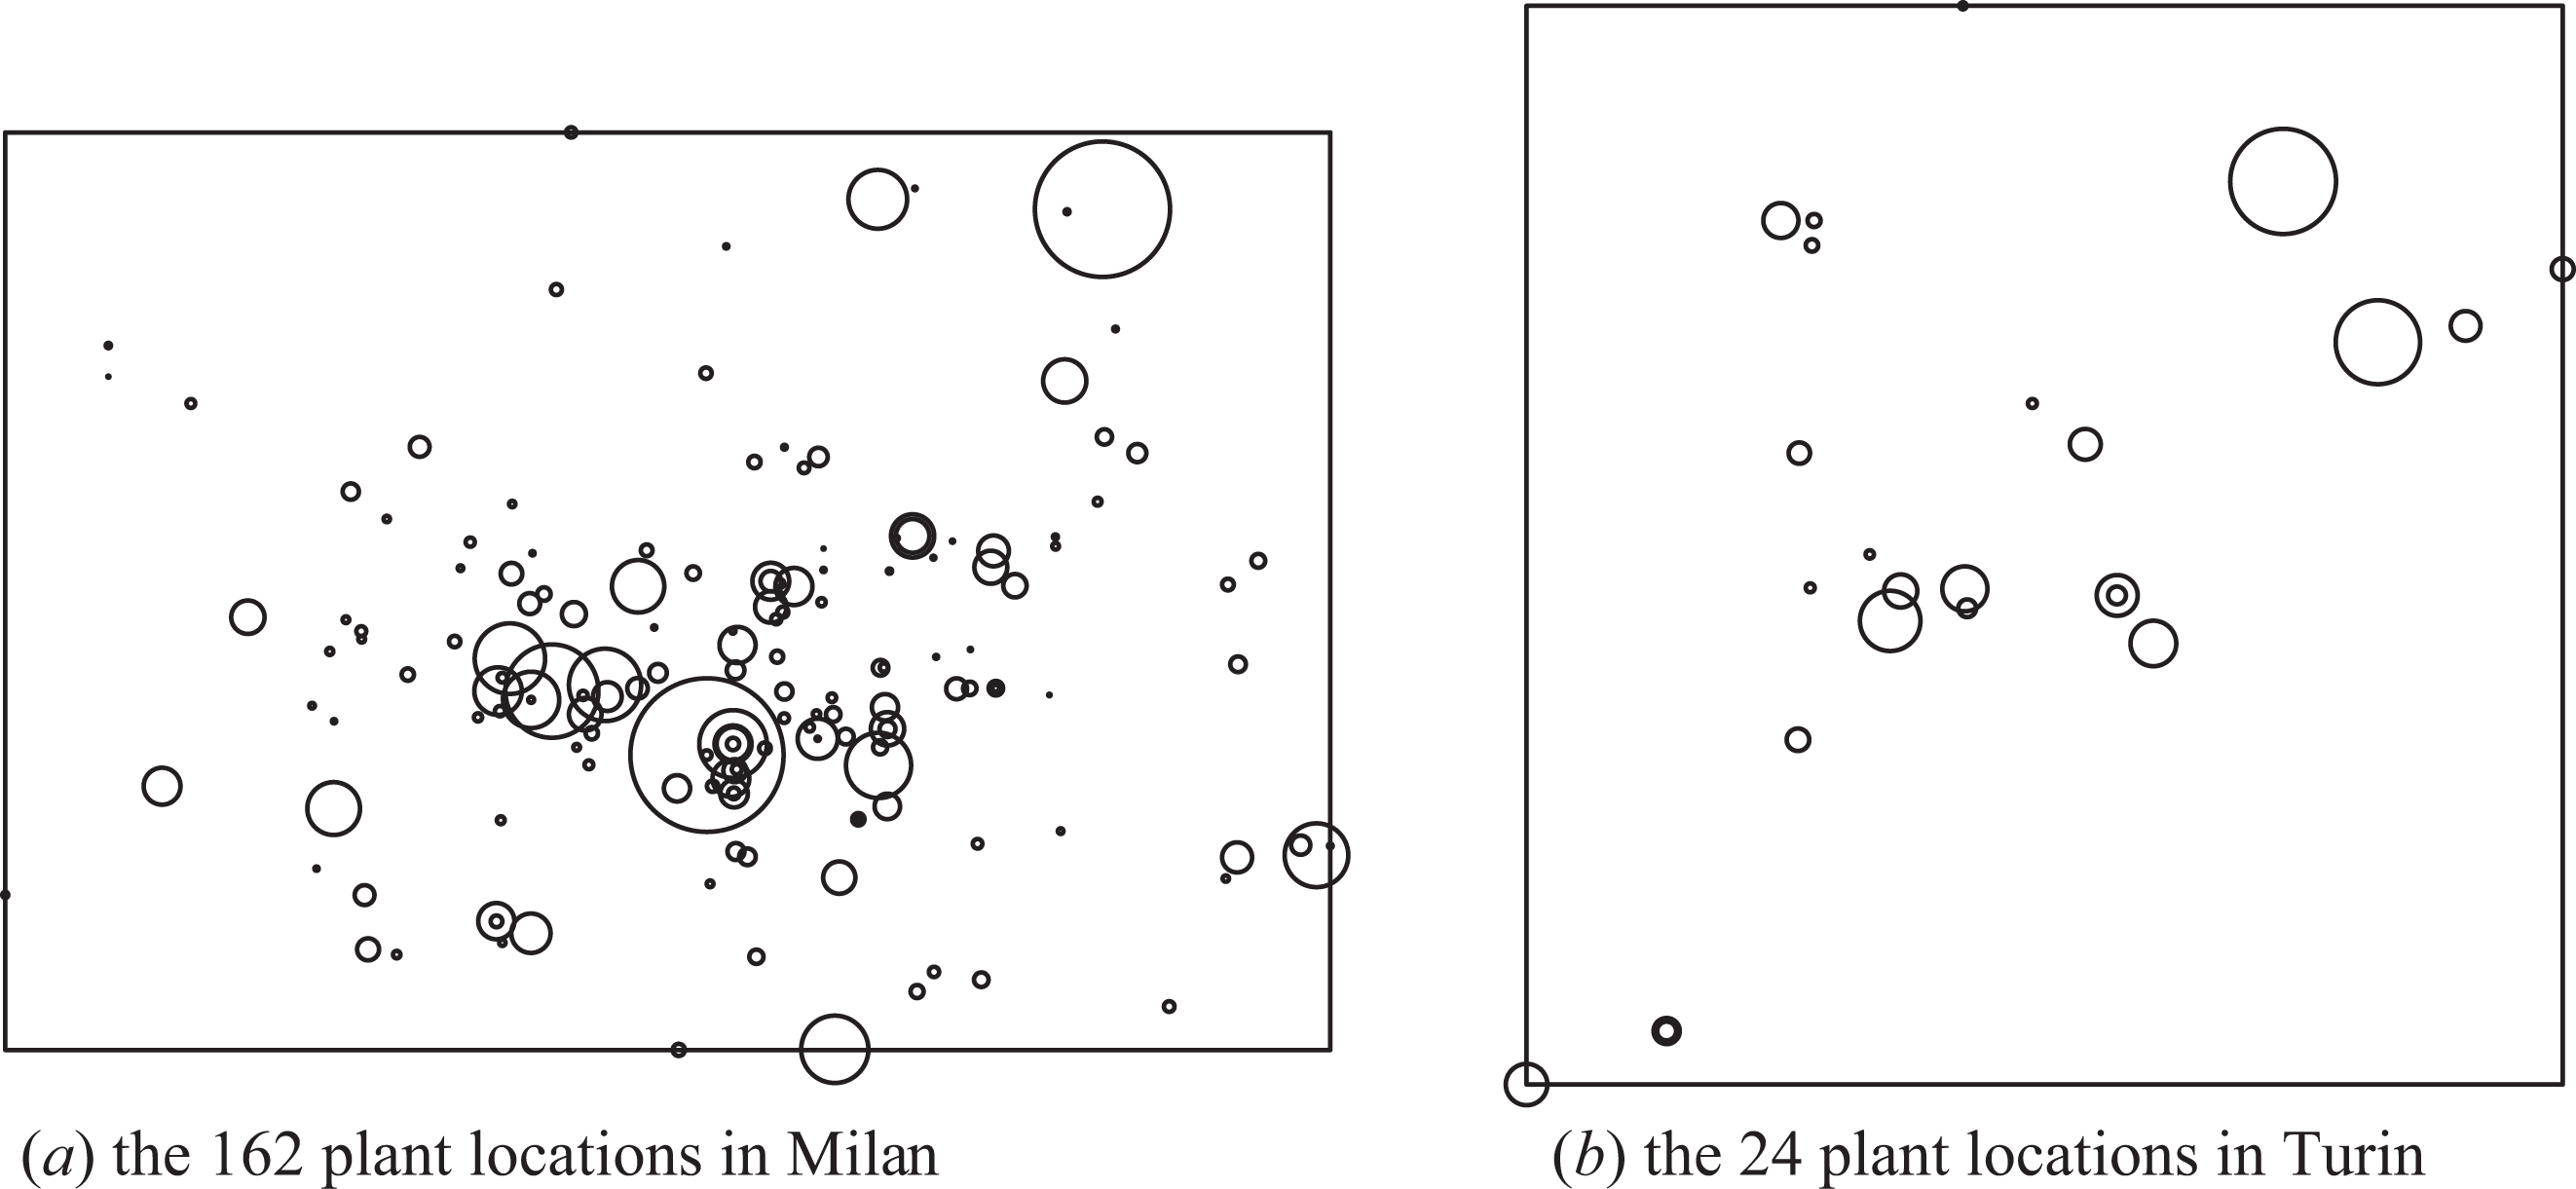
Spatial distribution of high and medium-high technology manufacturing firms in the municipalities of Milan and Turin in the period 1996–2004.
For both the location patterns of high- and medium-high-technology manufacturing firms, the presence of phenomena of spatial concentration has been tested, while controlling for the firms’ sizes, through the use of the mark-weighted K-function, as described in the section Measuring the Spatial Concentration of Firms Considering Size: The Mark-Weighted K-Function.
In order to evaluate the statistical significance of the deviations of the observed mark-weighted K-function from the hypothesis of random localization of firms, as identified by equation (5), we computed approximated 99.9% confidence envelopes from 999 simulations of the model of equation (6). More precisely, at each step of the simulation procedure, a marked point pattern has been generated from the model with a = 0 and the other parameters estimated from the data with the methods, described in the previous section on Minimum Contrast and Maximum Likelihood. Then, on the generated pattern, the mark-weighted K-function,
The two plots reported in Figure 7 show the behavior of function
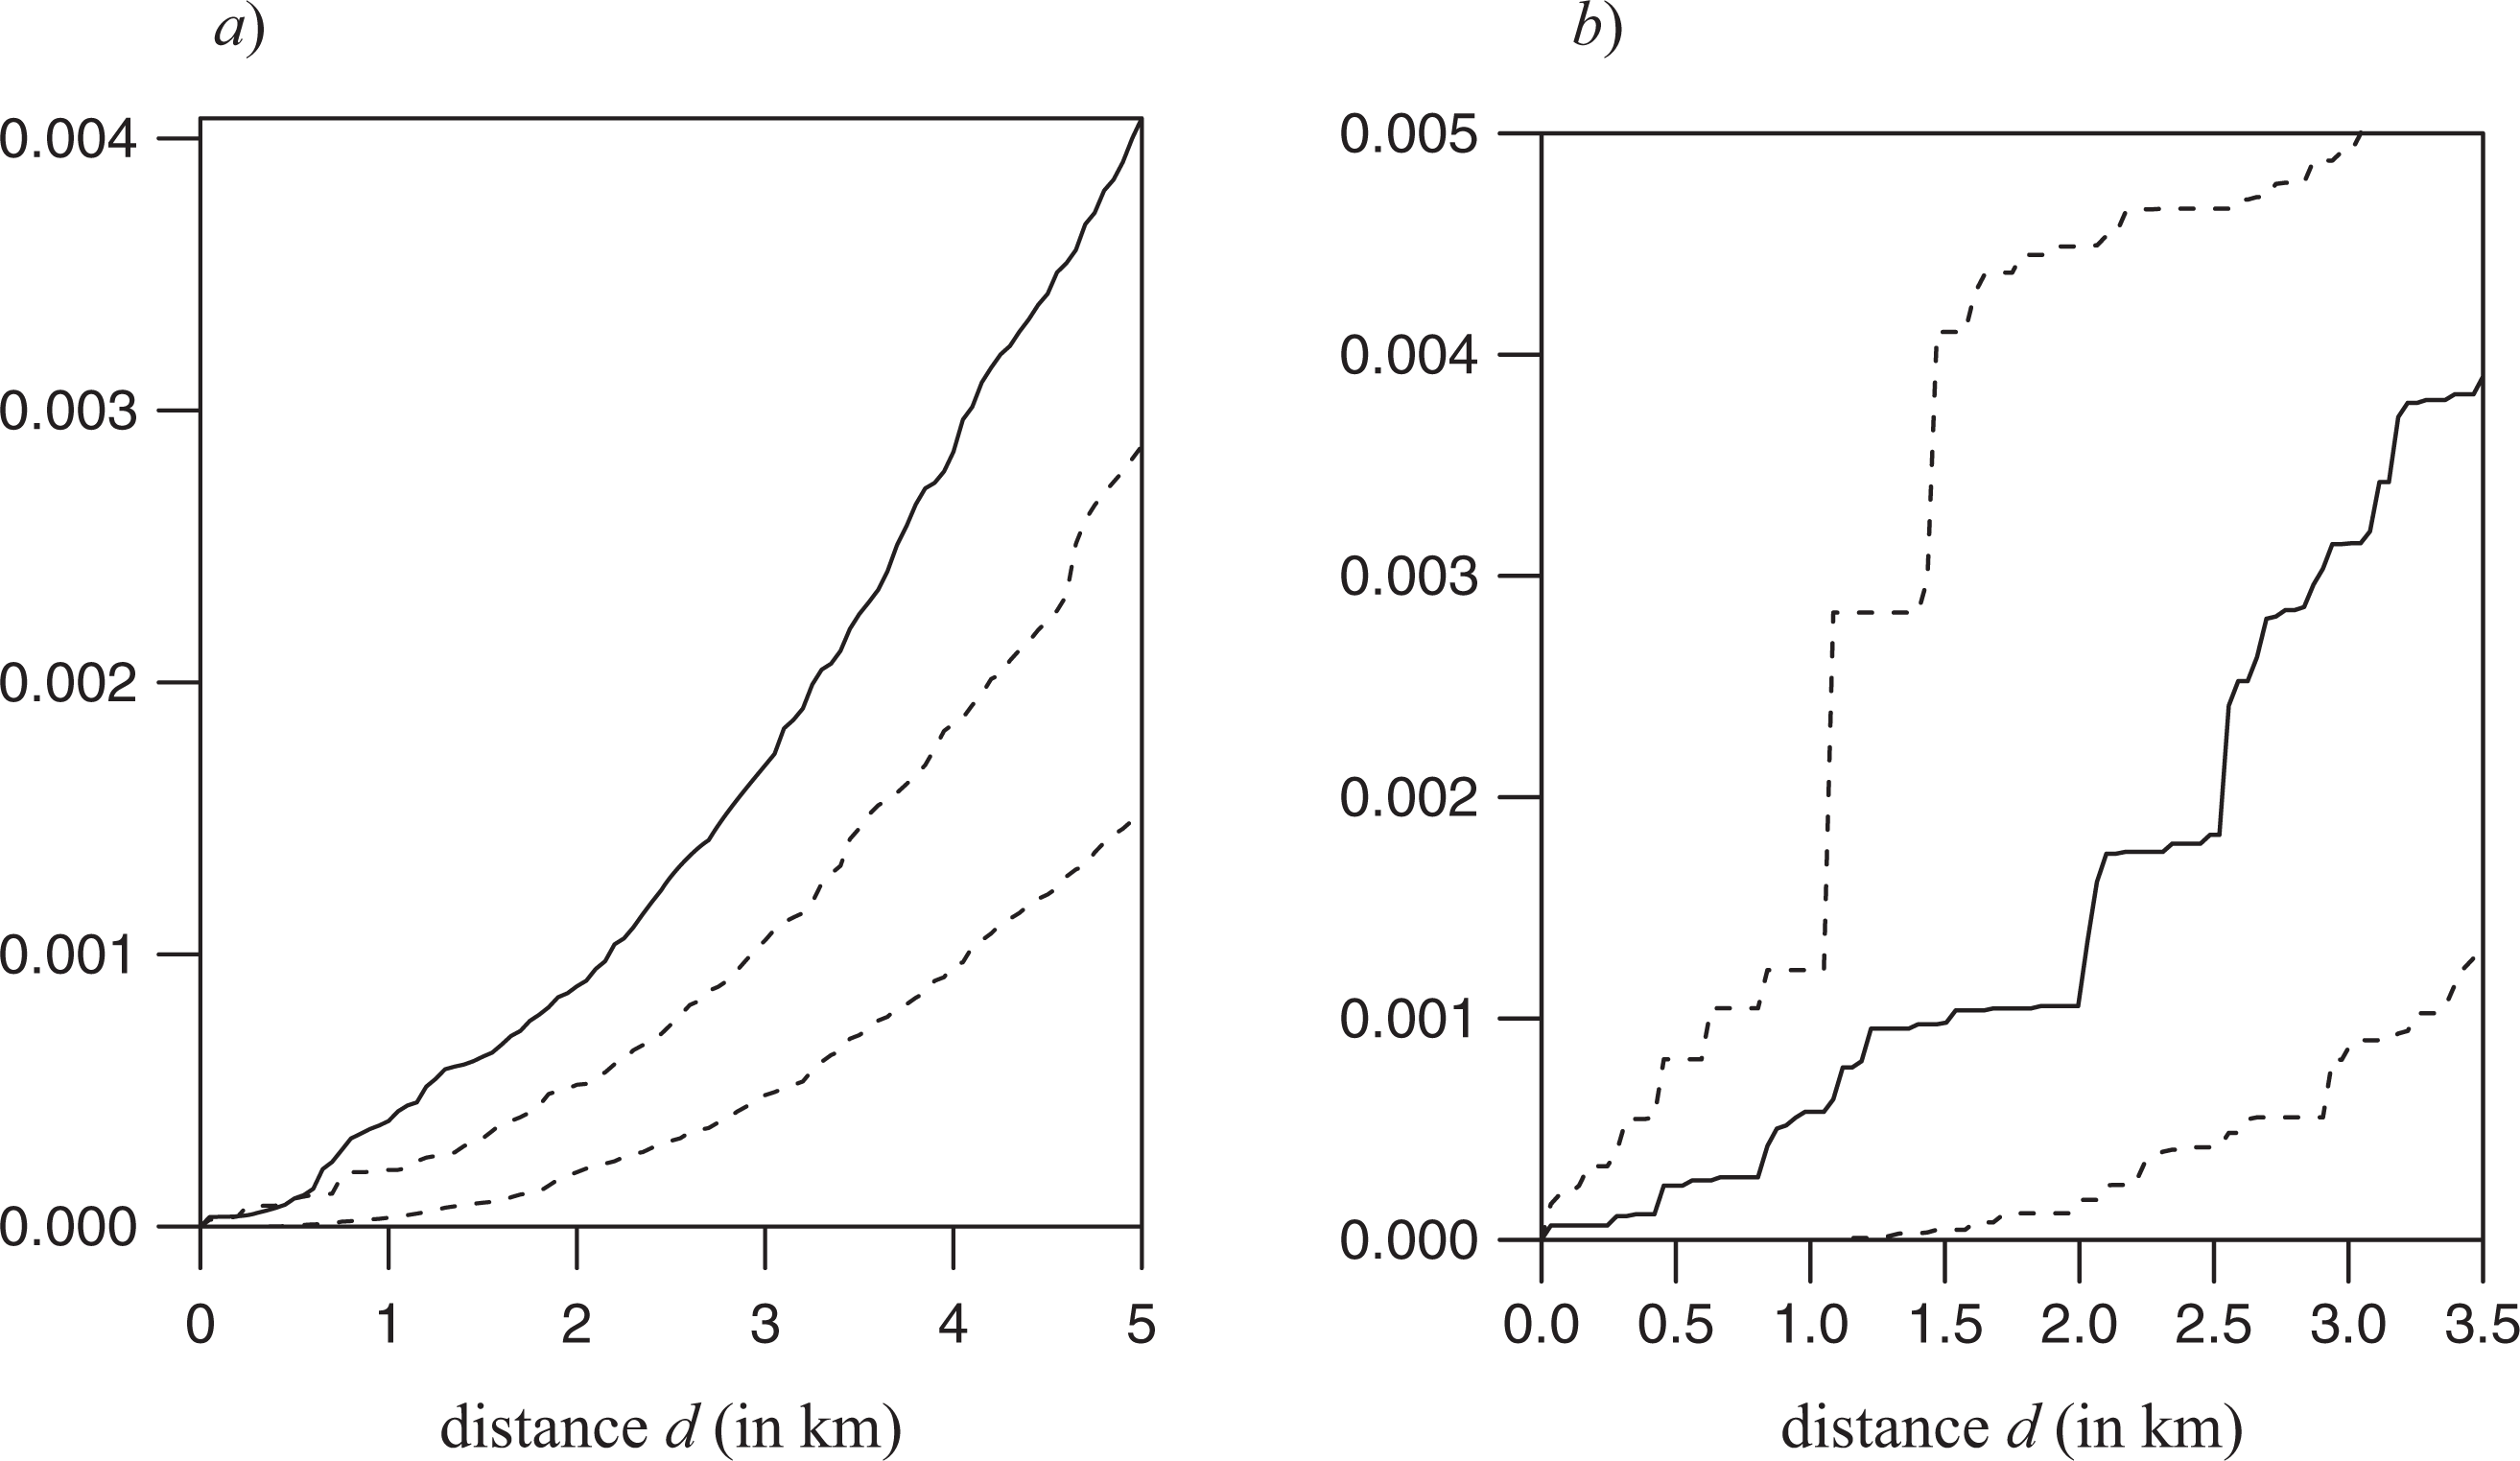
Behavior of the estimated mark-weighted K-function (continuous line) and the corresponding 99.9 percent confidence bands (dashed lines) for the high and medium-high technology manufacturing firms located in Milan (graph a) and Turin (graph b).
According to the spatial economics and regional sciences literatures, at least two general and antithetical localization phenomena regarding the innovation and technology intensive manufacturing industry can be identified: one phenomenon lead to spatial concentration in the large metropolitan areas (such as those of Milan and Turin); the other one produces location patterns where spatial interactions among economic agents are irrelevant (Arbia et al. 2010).
By the effect of the presence of knowledge spillovers and circulation of tacit knowledge (Storper and Venables 2003; Yeung, Coe, and Kelly 2007) or the existence of innovation milieux (Camagni 1991; Capello 1999), economic agents may tend to locate close to other firms with the aim of exploiting agglomeration advantages. The location pattern of Milan seems to be consistent with this stylized fact.
In contrast, according to the evolution of communication technologies, the geographic space may have a limited role in the formation of the location choices of economic agents (Sassen 1994; Castells 1996; Cairncross 2001). The decreased need of physical interaction for the transmission of knowledge and information may reduce the localization advantages due to spatial proximity. The location pattern of Turin seems to be consistent with this second stylized fact. A more in-depth study about the territorial differences between Milan and Turin in terms of agglomeration advantages would also require the analysis of other variables in addition to the information regarding the locations of firms.
Discussion and Conclusions
The spatial concentration of firms has long been a central issue in economics under both the theoretical and the applied point of view due mainly to the important policy implications. An approach to its measurement, that became recently very popular, makes use of micro data and looks at the firms as if they were dimensionless points distributed in the economic space. This approach is very attractive because it does not suffer from the problem of choosing an arbitrary partition of the economic space (such as e.g., regions, counties, or countries). However, in practical circumstances this is an excessive simplification since the points (firms) observed in the economic space are far from being dimensionless and are conversely characterized by different dimension measured in terms of the number of employees, the product, the capital, and so on. In the literature, the articles that introduced such an approach (e.g. Arbia and Espa 1996; Marcon and Puech 2003) disregard the aspect of the different firm dimension and ignore the fact that a high degree of spatial concentration may result from the case of many small points clustering in definite portions of space (as it is usually considered in the literature) but also from only few large points clustering together (e.g., few large firms). In other words they are not able to distinguish between two very different issues, namely the clustering of firms and the clustering of economic activities. The aim of this article was to introduce absolute measures of spatial concentration of firms based on an extension of Ripley’s K-function that accounts for the different firm dimension. In order to derive the null hypothesis of spatial randomness in this more complex environment, we developed a new stochastic model that generates marked point patterns of firms and is able to describe the various situations that could arise in empirical cases. In our model, the firm dimension is expressed as a function of the spatial intensity of the point process. According to the different values assumed by the model parameters, this could result either in larger points located in areas with high intensity or, conversely, smaller points located in areas characterized by high intensity. The first case is more grounded under the economic point of view where we can postulate that the same conditions that lead to a higher clustering of firms in some portions of space may also lead to the growth of the dimension of the existing firms. A good example is constituted by the action of the three Marshallian forces fostering agglomeration (Marshall, 1920). In his seminal work, Marshall emphasized that industrial agglomeration can be explained by the fact that firms try to locate near suppliers to save shipping costs, by the theory of labor market pooling and by the theory of knowledge spillovers. If some of the services are internalized in one leading big company than the same forces could produce a growth of the firms’ dimension rather than an increase in the number of firms located in the area. We would expect therefore that in most practical cases, the parameter a in equation (3) will be positive and large in absolute value. Similar arguments reinforcing this empirical expectation may be found in Krugman (1991).
On the basis of the stochastic model introduced here, we derived the corresponding mark-weighted K-function and, by making use of some simulated pattern, we presented evidence that this tool represents a proper mean to detect the presence of absolute concentration of firms keeping their dimension into account. The problem of calibrating the values of the model’s parameters in practical cases is complex and it is only partially undertaken here where we restricted ourselves to only the presentation of an inferential procedure to test if a = 0, which detects the presence of absolute concentration as a violation of the null hypothesis of spatial randomness. This procedure, however, does not allow to identify the relevant alternative hypothesis: clustering of firms (a < 0) or clustering of economic activities (a > 0). We will undertake such a problem in some future work.
Footnotes
Appendix A
Declaration of Conflicting Interests
The author(s) declared no potential conflicts of interest with respect to the research, authorship, and/or publication of this article.
Funding
The author(s) received no financial support for the research, authorship, and/or publication of this article.