



Abstract
Employment growth is a desirable outcome of Foreign Direct Investment (FDI) and the economic performance of regions. However, the evidence available for Mexico is inconclusive. This study aims to contribute to the literature by assessing the dynamic relation between FDI and employment in the states of Mexico, and investigating the conditioning role of social progress, local public investment and competitiveness. We employ Impulse Response Functions and variance decomposition, derived from a Panel Vector Autoregressive (PVAR) model. The results provide evidence on the nexus between employment growth and the different types of FDI. We confirm the dynamic interrelation is, at best, weak.
Keywords
Introduction
National and local governments in developing countries increasingly rely on the attraction of Foreign Direct Investment (FDI) to complement and encourage economic growth and employment growth. FDI can boost economic growth through capital accumulation, human capital development, technology transfers, and acquisition of new skills (Campos Kinoshita 2002). However, the soothing effects of FDI on the economies are subject to the local technological environment’s bounds, social progress, local investment, and competition at the regional level.
The evidence on the effect of FDI on GDP growth and employment growth so far is inconclusive. Some studies find that FDI positively influences GDP and employment growth through capital accumulation and knowledge spillovers (Borensztein, De Gregorio, and Lee 1998). Other studies show that FDI to developing countries might not be contributing to economic growth or employment creation (Waldkirch, Nunnenkamp, and Alatorre Bremont 2009; Jordaan 2008; Ramírez 2006).
Employment growth stands as a fundamental goal of the economic performance of regions (Porter 2013). Despite its relevance to developing countries, the investigation of FDI’s impact on employment growth has received relatively little attention compared to research on the nexus between FDI and economic growth (Waldkirch 2015). The research on the role of public investment to complement foreign investment flows to the regions is limited, despite its crucial role as a determinant of infrastructure and social progress (James 2009; Ali, Raza, and Iqbal 2015). Recent findings show that FDI marginally complements local public investment, but local investments crowd out the trajectory of foreign investment flows (Mendoza and Conde-Cortés 2019). Besides, some research has found mixed effects of social progress and regional endowments of social capital on FDI’s size and direction (Casi and Resmini 2017). Few studies have examined how regional factors, e.g. social progress, local public investment, and competition, affect FDI and employment growth in developing countries.
FDI flows to developing countries grew substantially in the past decade, particularly to Latin America, where it grew to more than $164 billion in 2019 (UNCTAD 2020). The three largest receivers of FDI in Brazil, Mexico, and Chile attracted flows of $72, $33, and $11 billion, respectively. In Mexico, FDI flows decreased by 5% for 2018 due to the automotive and power generation industries’ contraction, two of the largest employment providers and economic engines of regional development. The automotive sector alone concentrates over 20% of FDI and contributes to about 3% of the national production and 18% of manufacturing GDP (Mendoza and Rendón-Rojas 2020). One could hardly underestimate the potential role of FDI as an engine of economic and employment growth.
Accounting for regional externalities, Jordaan and Rodríguez (2012) examined FDI’s impact on regional GDP growth in Mexico. They found a positive effect of FDI flows to economic growth in the border region but a negative association between FDI stocks and GDP growth. Griffiths and Sapsford (2004) confirmed that FDI did not positively impact GDP growth in a thirty year sample period (1970–1999). These authors, however, reported a significant positive effect for a sub-sample from 1985. Few studies have investigated the link between FDI and employment growth in Mexico: early evidence suggests that FDI has contributed little to employment generation (Gallagher and Lyuba 2004). Ernst (2005) finds no clear relation between the two variables after the ’80s. Accounting for endogeneity, Waldkirch, Nunnenkamp, and Alatorre Bremont (2009) reports a fragile impact of FDI on the employment of skilled and unskilled workers in Mexico. There is no proof of the dynamic interaction between FDI and employment growth in Mexican states and how this interaction changes with social progress, infrastructure competition, and local public investment.
This study aims to contribute to the literature on the nexus between FDI and employment growth, accounting for regional social progress and competitiveness factors at the state level. We investigate how local public investment, social progress, and competition condition the dynamic relation patterns between FDI and employment growth in Mexican states. The study accounts for the differences and heterogeneity of social progress and competitiveness across regions (Porter 2013). We would expect that social progress and competition improve the nexus between FDI and employment growth. We expect complementarity effects between local public investment and the link between FDI and employment growth. The study further decomposes FDI into new FDI, FDI reinvestments, and investment balances. We also use a novel classification of progress derived from the Social Progress Index (SPI), proposed by the Social Progress Imperative (Porter, Stern, and Green 2017) and then adopted and produced in Mexico by Sintonía (2019).
This study investigates these questions using a Panel Vector Autoregressive (PVAR) model that accounts for endogeneity, estimated via a generalized method of moments (GMM) estimator that ensures unbiased and consistent estimates (Abrigo and Love 2016). We further extend the analysis to consider Impulse Response Functions and variance decomposition.
The following section briefly reviews the nexus between FDI and employment growth; we examine how this nexus relates to social progress, regional competition, and the interaction with local public investment in Mexico. The third section presents a descriptive analysis section on FDI and employment growth, while fourth section describes the methods used to analyze the dynamic interplay between FDI and employment growth. The fifth section offers a discussion and conclusion.
Literature Review
Endogenous growth theory points to a positive effect of investment on economic growth through capital formation and human capital (Romer 1986; Lucas 1988). Foreign direct investment (FDI) offers international linkages to factor markets, technology, innovation, and management strategies, among other positive synergies to host countries and their regions. Some authors confirm the positive influence of FDI on GDP and employment growth through capital accumulation and knowledge spillovers (Borensztein, De Gregorio, and Lee 1998).
FDI can also boost economic growth in emerging markets through capital accumulation, human capital development, technology transfers, and acquisition of new skills (Campos Kinoshita 2002). However, FDI effects are subject to the local technological environment’s bounds and social progress, productive conditions, and competition at the regional level. Innovation development, learning capacity, wages, government institutions, local public investment, and local infrastructure can condition FDI’s effectiveness to create employment and economic growth.
Improvements in political stability, public infrastructure (through local investment), competition, and social progress can also attract investments to the regions (Ali, Raza, and Iqbal 2015). Some studies confirm these variables’ role in developing regions in emerging countries (James 2009). Lean and Wah (2011) have explored the role of social progress, competition, and local investment to explain the nexus between FDI and GDP growth in Malaysia. The authors found that local public investment supplements the interaction between FDI and GDP growth. Titarenko (2006) reported the effect of local public investment on employment growth in Latvia. Sánchez-Juárez and García (2016) found that Mexico’s public investments negatively affect the nexus between FDI and employment growth.
Some authors find that FDI can explain employment, labor productivity, and competitiveness in Mexico (Rivas and Puebla 2016). In contrast, there is also growing evidence showing that FDI does not positively affect the country’s economic performance. The early available evidence suggests that FDI has contributed little to employment generation in Mexico (Gallagher and Lyuba 2004), and the two variables show no definite relation between them (Ernst 2005). Waldkirch, Nunnenkamp, and Alatorre Bremont (2009) reports a marginal impact of FDI on skilled and unskilled workers in Mexico, accounting for endogeneity.
Despite the high levels of FDI to the country from the beginning of the 2000s, Mexico’s economic and employment growth remain persistently low. Tornell, Westermann, and Martinez (2004) attribute such weak performance to the lack of timely judicial or structural reforms (Tornell, Westermann, and Martinez 2004). Structural changes, social progress factors, and regional competition also condition the pattern and dynamic relation between FDI and economic growth (Romero 2012; Rivas and Puebla 2016). These studies also argue that public investment conditions the relation between private investment and economic growth in Mexico.
Additional evidence confirms that FDI has not affected GDP growth. Using endogenous growth models in a thirty year sample period (1970–1999), Jordaan and Rodríguez (2012) investigated FDI’s impact on regional GDP growth accounting for regional externalities. They find a positive effect of FDI flows to GDP growth in Mexico’s border region, but they also report a negative association between FDI stocks and economic growth. Mendoza and Conde-Cortés (2019) have recently reported that FDI shocks do not affect the trajectory of regional GDP growth in Mexico.
Most research has focused on the effects of FDI on output growth. In contrast, the investigation of FDI’s impact on employment growth has received relatively little attention, despite its relevance to emerging market countries (Waldkirch 2015). Employment growth is an essential attribute of the economic performance of regions (Porter 2013). However, Mexico’s early evidence suggests that FDI has contributed little or nothing to employment generation (Gallagher and Lyuba 2004). Some research does not find evidence in favor of FDI encouraging employment growth, particularly after the ‘80s (Ernst 2005). Other authors find a weak impact of FDI on employment in Mexico (Waldkirch, Nunnenkamp, and Alatorre Bremont 2009).
Ali, Raza, and Iqbal (2015) note the role of local investment and infrastructure as complements to foreign investment flows on the regions and also recognize the conditioning nature of social progress factors as incentives of FDI (James 2009). Despite its relevance, no studies have answered how regional factors, e.g. public investment, infrastructure, or social progress, condition the relation between FDI and employment growth. What is the dynamic interaction between FDI and employment growth in Mexico’s states, and how this dynamic interaction change with social progress, competition, and local public investment?
In this study, we aim to contribute to the literature on the nexus between FDI and employment growth by accounting for regional social progress and competitiveness factors at the state level. We study how social progress and competition mediate the dynamic relation patterns between FDI and employment growth in the states of Mexico using Panel Autorregresive Vectors (PVAR) and Impulse Response Functions (IRF’s). Previous literature investigating the nexus between FDI and employment includes Çolak and Alakbarov’s (2017) study. They employ panel data cointegration tests and do not find evidence of a long-term relationship between FDI and employment for the Common Wealth of Independent States. Constantinos et al. (2019) employ a panel VAR to exploit the advantages over cointegration or traditional panel methodologies, similar to the present study, by calculating IFR’s investigating the dynamic pattern of FDI and factor productivity in OECD countries. Some other papers use Panel VAR techniques to investigate different nexus with FDI. However, to our knowledge, this is the first study to use a Panel Vector Autoregressive Model to investigate the nexus between FDI and employment growth at the regional level in emerging countries.
Descriptive Analysis of Competitiveness and Social Progress
Data and Sources
We get annual data for the thirty-two states in Mexico during the period 2006 to 2015 for all the variables in this study, including Gross Domestic Product (GDP) from the Economic Information Bank (BIE from its acronym in Spanish) of the National Institute of Geography and Statistics (INEGI) in millions of Mexican Pesos (mp) (https://bit.ly/McQPJj). Financial Balances of State and Municipal Governments produced by INEGI (https://bit.ly/2KxejYb) provide local public infrastructure investment data, except investment from other government (municipal or federal). Foreign direct investment (FDI) data in millions of U.S. dollars comes from the Ministry of Economics (2015). We transform the variables initially denominated in U.S. dollars to Mexican Pesos using the exchange rates provided by Mexico’s Central Bank (Banxico). We use the National Consumer Price Index (INPC) (2008 = 100) to transform these three variables to constant prices for the thirty-two states in Mexico.
Instead of using an overall measure of FDI, we distinguish three types of foreign investments, according to the Ministry of Economics and Banxico, also following the OECD and the IMF guidelines: 1) New FDI; 2) Reinvestments of profits from FDI, and 3) Balance Adjustments Between filial companies. 1 We follow the OECD international convention and calculate GDP shares for the investment (OECD/UCLG 2016) to account for the intrinsic capacity and productive needs in each specific state. Employment at the state level (Economically Active Population, PEA) comes from the National Survey of Occupation and Employment (ENOE), also available from INEGI (2016).
A competitiveness index calculated by the Mexican Institute for Competitiveness (IMCO) for all the states serves as a proxy for state competitiveness. According to the index score, the study assigns each state one of the five categories of competitiveness: very high, high, medium, low, and very low (IMCO 2016). The study uses the Social Progress Index (SPI) provided by the TCI Network-Sintonía (2019) as a measure of social progress. We get the most recent public measures at the municipal level and take the state level’s average score. Then the study defines five categories of progress ranging from a very high level, high level, medium level, low level, and very low level of social progress.
Figure 1 below shows the regional distribution of competitiveness and social progress in Mexico. There is some correspondence between these two variables per region, mainly in the southern region between low and very low competitiveness and social progress.
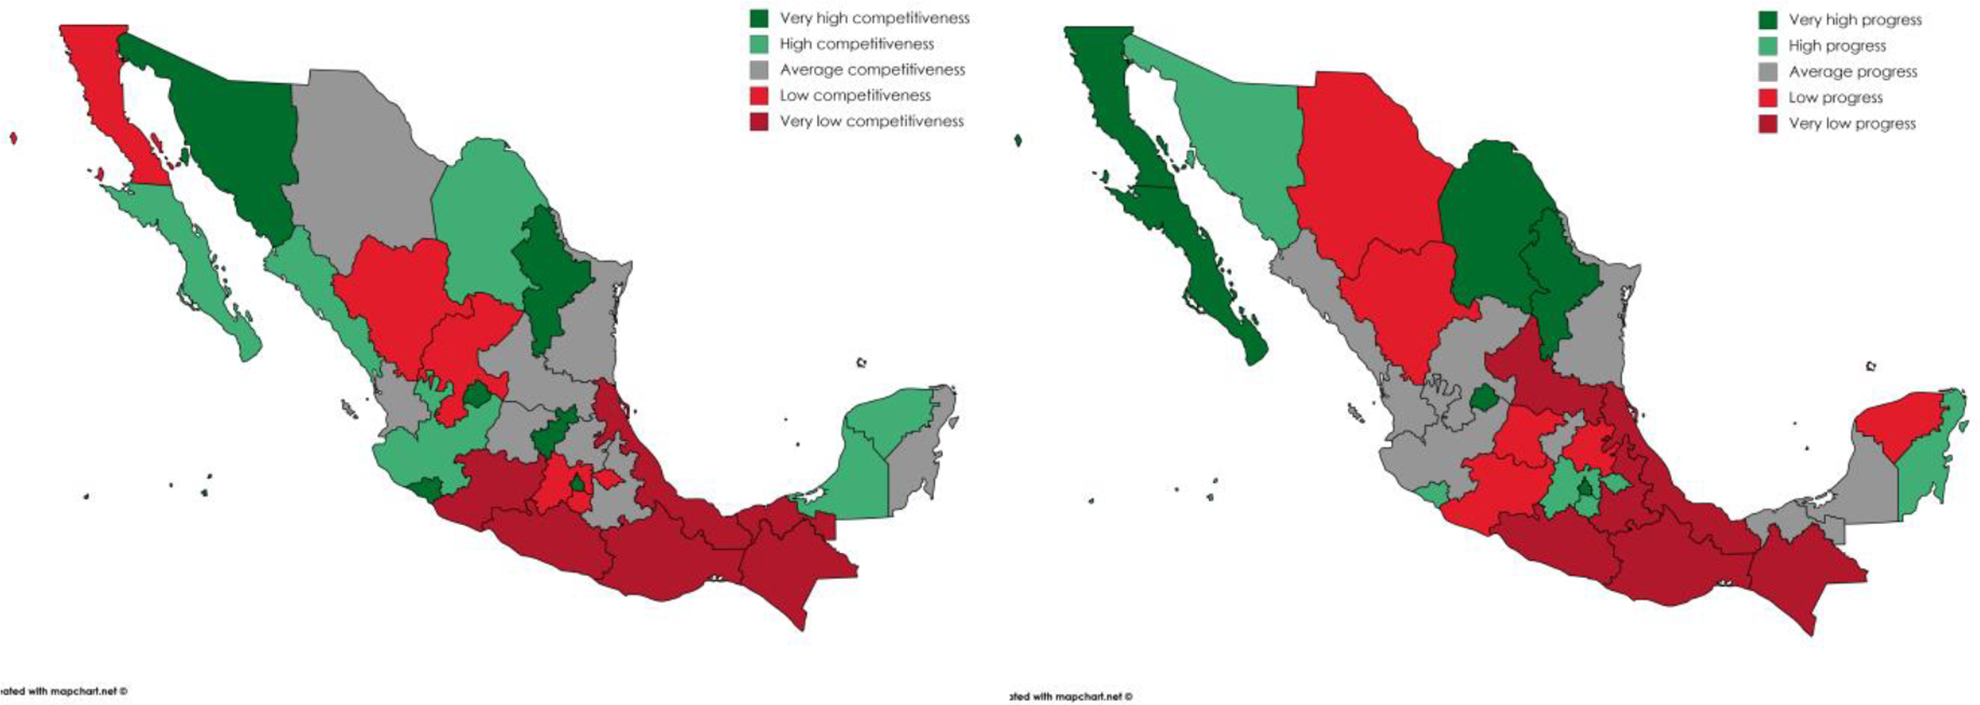
Regional competitiveness and social progress.
Descriptive Statistics
To examine the various types of foreign direct investment and employment by level of competitiveness and social progress more closely, Tables A1 and A2 show basic descriptive statistics. As expected, employment growth rises with both the level of competitiveness and social progress. Highly competitive states and highly progressive states show the highest average employment growth reaching 2.24% and 2.42%, respectively, for 2006–2015. Interestingly, states with very high levels of competitiveness show average employment growth rates (1.89%), similar to those of low (2.04%) and very low levels of competitiveness (1.38%) (see Table 1). This finding is inconsistent with employment convergence, i.e. states with low development should grow at a higher speed than those with the highest development levels. Employment growth also increases with the level of social progress. Employment growth moves from 1.50% in states with very low social progress to average rates of 2.42% and 2.22% in states with high and very high social progress (see Table A2).
New FDI has a larger share of GDP than local public investment, ranging from 0.68% in states with very low competitiveness levels to 1.44% in states with high competitiveness levels. New foreign direct investment as a share of GDP shows a positive relationship with social progress. Reinvestments and balance adjustments of FDI weigh jointly more than local public investments, with shares to GDP ranging from 0.86% to 2.06% in very low competition and low, competitive states. In terms of the SPI, these types of FDI positively correlate with social progress, with a common share of 1.15% in states with a very low level of social progress to 1.96% in states with very high levels of social progress. More progressive states attract reinvestments and funding of FDI. However, these types of FDI also show the highest levels of dispersion. Overall, FDI contributes substantially to regions. We explore next how FDI and public investment interconnect to employment growth.
Analytical Methods
Panel Vector Analysis
We investigate the dynamic association between local and foreign direct investment on regional employment growth by levels of competitiveness and social progress using Holtz-Eakin, Newey, and Rosen (1988)’s dynamic Panel Vector Autoregressive (PVAR). This approach allows us to examine the variance decomposition and dynamic affects and impulse response functions as in a standard Vector Autoregressions. The panel model suits the temporal and cross-sectional variation of the data and measures persistence and accounting for unobserved heterogeneity of common factors. We represent the k variate homogeneous VARP of order p:

where Yi, t is a (1×k) vector of endogenous variables distinguishing each state i, in time t. Xit is a (1×l) vector of exogenous covariates. ui and eit are (1×k) vectors of specific panel fixed-effects and idiosyncratic errors (Abrigo and Love 2016).
The criteria comprising J of Hansen, Bayes and Akaike developed by Andrews and Lu (2001), MBIC, MAIC, and MQIC respectively help to decide the VAR model’s optimal lag. We also verify the eigenvalues are within the unit circle to ensure the stability of parameters (statistics available from authors). With these statistics, we choose a Panel VAR(1) model using up to six lags of variables as instruments in the GMM estimations. We also checked for the Panel stability by confirming that the VAR model’s roots are within the unit circle.
In our specific application, a first order Panel VAR(1) model from (5) takes the following structure:

donde Yi, t = [lit Iit FDI
it
]’ is the vector of stationary endogenous variables: employment growth (lit), local public investment (Iit) and foreign direct investment (FDI
it
), distinguishing each state i, in time t. Cross sectional heterogeneity is captured by panel fixed effects
There is a correlation between fixed effects and the explanatory variables and the lags in Yi, t−1. Correcting correlation with the standard differencing procedure would generate bias in the estimates of a VARP. Hence, to avoid bias and ensure orthogonality of fixed effects and lags, we apply forward differencing to the mean, i.e. the Helmert procedure by Arellano and Bover (1995).
The study derives impulse response functions (IRF) and forecast error variance decompositions out of the autoregressive Panel VAR model (without exogenous variables). Stability of the systems ensures invertibility, and hence the solution of the first order Panel VAR model (Lütkepohl 2015) leads to the infinite-order Vector Moving Average (VMA) representation (Enders 2005):


where ∊it is the vector of structural shocks associated with each variable, affecting the contemporaneous values of each endogenous variable. The reduced-form idiosyncratic errors correlate contemporaneously, i.e.
The ordering of variables chosen in this study implies that contemporaneous structural shocks from FDI, i.e.
Estimation Results
Before estimating the nexus between FDI and employment growth using Panel Vector Autoregressive models, the study test for panel unit-roots using the Levin, Lin, and Chu (2002) approach. Table 1 shows the test’s overall results and reveals that all series follow an I(0) process, showing the rejection of unit roots in favor of stationarity. The variables do not need differencing to ensure stationarity. Except for local public investment, all tests include a deterministic trend. Autoregressive terms are statistically significant only for domestic public investment and for new FDI.
Unit-root Test Results.
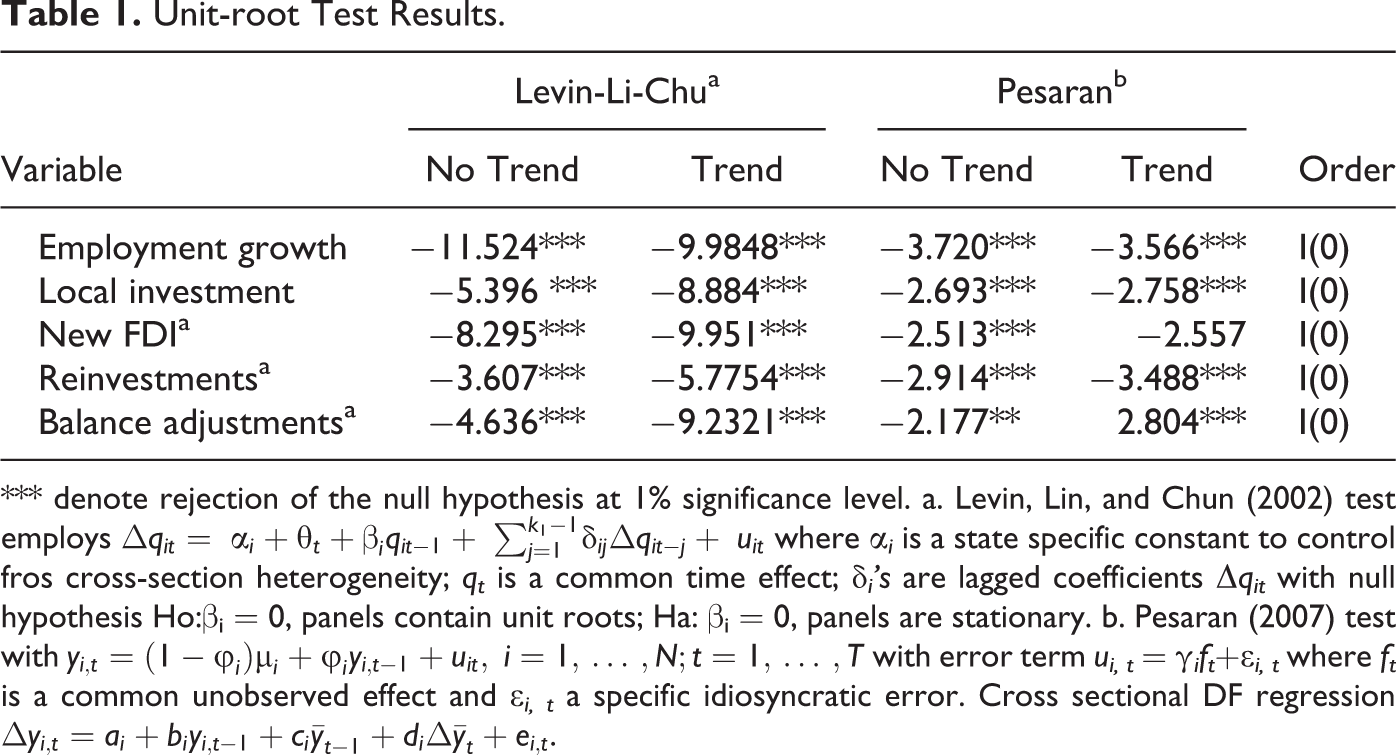
*** denote rejection of the null hypothesis at 1% significance level. a. Levin, Lin, and Chun (2002) test employs
Panel VAR Estimates
Panel VAR estimates offer a convenient way to examine the dynamic patterns of foreign investment and employment growth and the interaction with local public investment, by levels of competitiveness and social progress. Table 2 shows the estimates considering New FDI. Overall, both sets of results shown in columns Competitiveness and Social Progress provide mixed results: new FDI positively associates with employment growth in high levels of competitiveness and social progress. There is no significant relationship at very high or low levels. There is a negative interrelation in the rest of the cases. Both FDI re-investments and FDI adjustments negatively relate to employment growth in states with high, medium, and low levels of competitiveness or social progress (results available from authors upon request). These results suggest that neither social progress nor regional competitiveness mediates the nexus between FDI and employment growth. This dynamic inter-linkage seems independent of these mediating factors. Impulse Response Functions in Figure 2a and b confirm, with very few exceptions, that the nexus between FDI and employment growth is not affected by either the level of competitive level or social progress. The dynamic pattern of this linkage does not improve the null effect of FDI shocks on the trajectory, followed by employment growth.
Panel VAR Estimated Parameters by Competitiveness Level and Social Progress Index—New Foreign Direct Investment.a
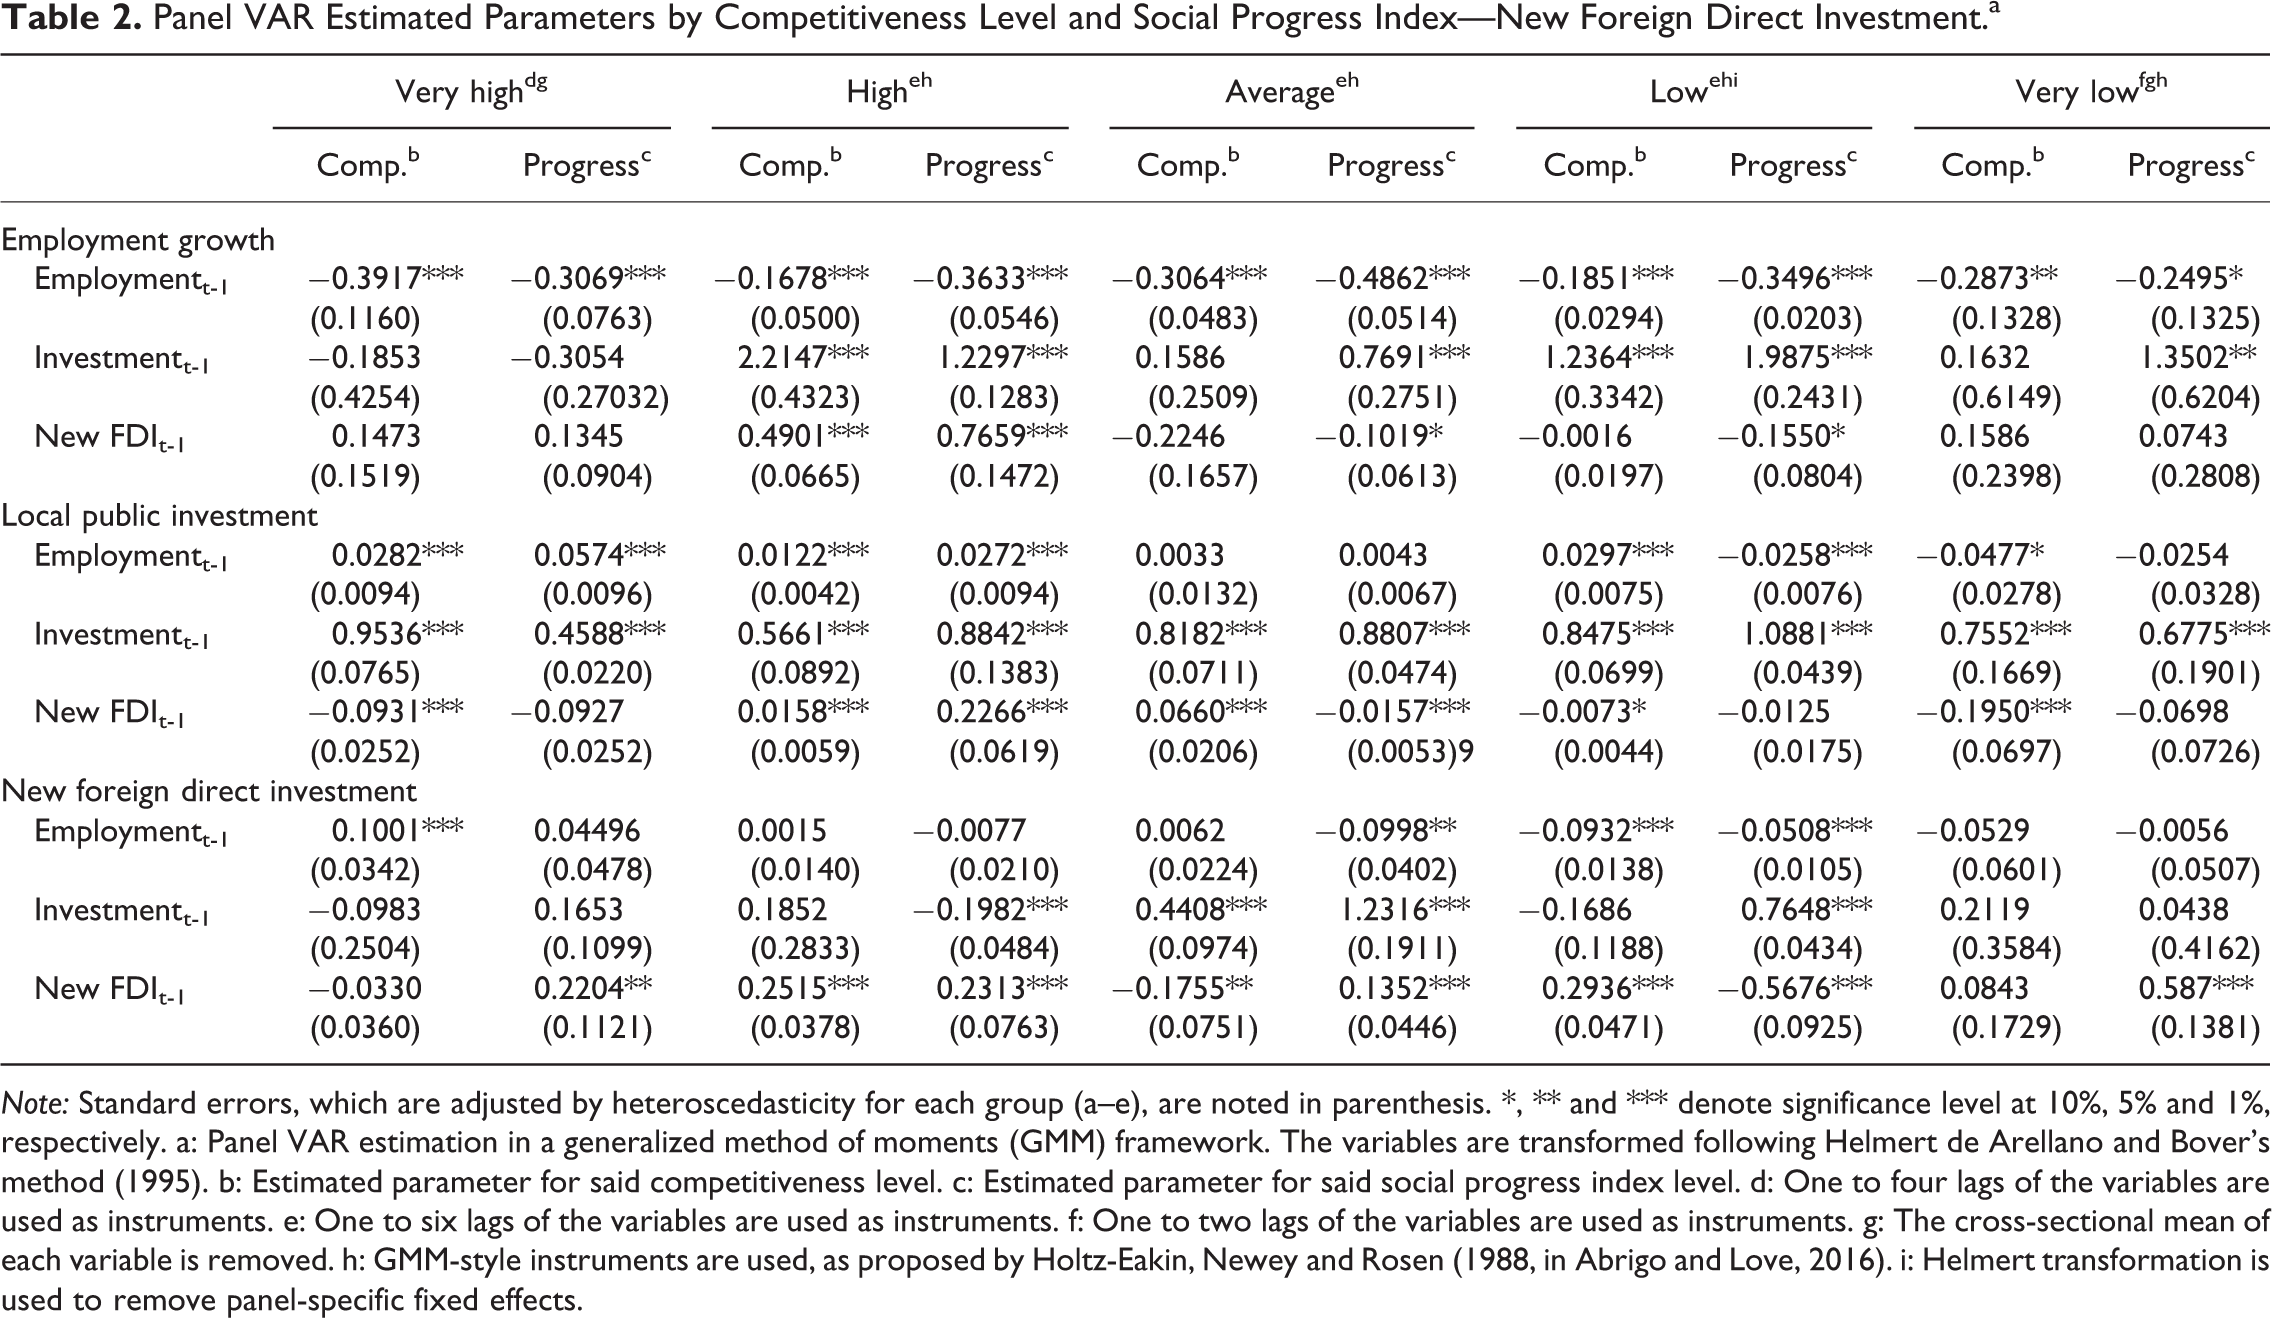
Note: Standard errors, which are adjusted by heteroscedasticity for each group (a–e), are noted in parenthesis. *, ** and *** denote significance level at 10%, 5% and 1%, respectively. a: Panel VAR estimation in a generalized method of moments (GMM) framework. The variables are transformed following Helmert de Arellano and Bover’s method (1995). b: Estimated parameter for said competitiveness level. c: Estimated parameter for said social progress index level. d: One to four lags of the variables are used as instruments. e: One to six lags of the variables are used as instruments. f: One to two lags of the variables are used as instruments. g: The cross-sectional mean of each variable is removed. h: GMM-style instruments are used, as proposed by Holtz-Eakin, Newey and Rosen (1988, in Abrigo and Love, 2016). i: Helmert transformation is used to remove panel-specific fixed effects.

(a) Impulse response functions (FDI [impulse]: employment growth [response]) by levels of competitiveness. (b) Impulse response functions (FDI [impulse]: employment growth [response]) by levels of social progress.
Variance Decomposition
The study now measures the importance of the different definitions of FDI on the variance of employment growth. Figure 3 below shows the variance decomposition of employment for ten periods ahead by competitiveness and social progress. The importance of new FDI to contribute to the variance to employment growth increases with regional competitiveness. Plots show that while New FDI explains about 1% of employment variance of states with low levels of competitiveness, the variance explanation increases in states with average and high competitiveness to 5.1%, respectively, and finally to 8.7% for highly competitive states in the long-run. Interestingly, New FDI explains 16.2% of employment variance in states with very low levels of competitiveness. The contribution to employment growth variance in the cases of reinvestments of FDI and balances of FDI has a very similar pattern.
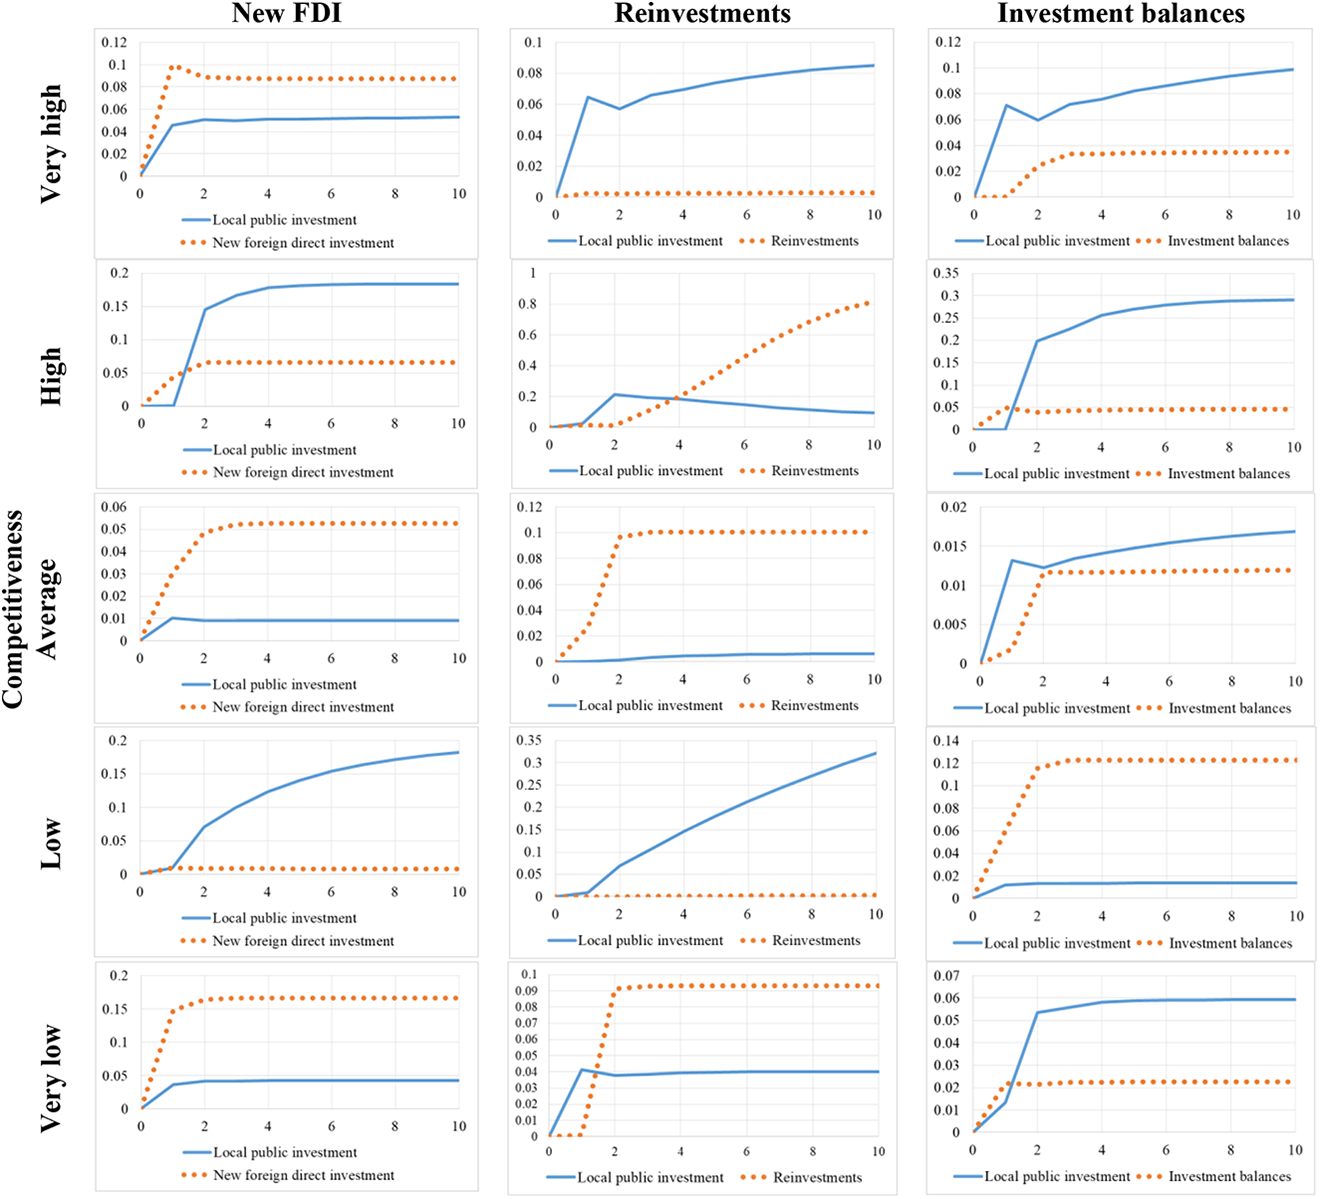
FDI and investment contribution to employment growth variance. Source: own calculations.
Discussion and Conclusion
In this study, we find that, given the contribution of variance, FDI maintains a close nexus with employment growth in Mexico’s states—competitiveness, social progress, and local public investment mediate this dynamic interrelation. New FDI Granger causes employment growth in states with high competitiveness levels, while reinvestments and balance adjustments of FDI cause employment growth in states with high, medium, and low competitiveness levels. Reinvestments of FDI and balances of FDI cause employment growth in all social progress types, except those with very low levels. These results are in line with those of Rivas and Puebla (2016), who find that FDI causes employment and labor productivity.
FDI contributes to the variation of employment growth in the states of Mexico. All types of FDI explain the variation of regional employment growth along with the level of competitiveness. Overall, the greater the level of competition is, the greater the employment variation explained by FDI. A comparable relative importance pattern emerges when analyzing the nexus between FDI and employment growth through social progress levels.
A more detailed analysis of impulse-response functions shows, however, no significant dynamic responses of employment growth following FDI shocks, in the short or long run, in none of the specific levels of competitiveness and social progress (see Figure 2a and b). Impulse response functions provide a better picture of FDI shocks’ dynamic effect and its impact on employment growth and distribution over time. In this sense, our findings support the studies reporting no effect of FDI on employment growth (Romero 2012). IRF’s reveal a feeble impact of FDI shock on the trajectory of employment growth only in states with high levels of competitiveness and social progress, a result consistent with Jordaan (2005) and Nunnenkamp, Alatorre-Bremont, and Waldkirch (2007), who report very modest effects for Mexican manufacturing or with Mendoza Osorio (2008) in the aggregate level.
The faint relation between FDI and employment growth from IRF’s may suggest a negative effect of competition forces, such as market stealing, that more than compensate the positive effects of technological spillovers or capital formation in Mexico. The market integration with the U.S. in the post-NAFTA era has not been enough to encourage employment, probably an unwanted side effect of the 2008 worldwide crisis (Waldkirch 2015). We need to investigate in this context whether FDI to exporting firms plays a role in employment growth. Our results agree with Romero (2012), who notes the weakness of the innovation process in Mexico, or Garriga (2017), who argue for a more proactive role of subnational governments in the form of public investment and more involvement in international para-diplomatic activities to discourage or prevent market stealing effects. Local public investment relates more with employment growth, even though its relatively low share to GDP and FDI levels. Public policy could promote more local and national investment as an essential complement to FDI (Ali, Raza, and Iqbal 2015).
This study’s limitations include the small sample size, the yearly frequency of data, and information aggregation level. Crescenzi and Limodio (2020) use disaggregated data at the project and district level to explore FDI’s nexus with employment and other development variables. While the global results do not show a significant association, accounting for more disaggregated data reveals a positive association between these two variables. The panel VAR method used in this study has helped address the dynamic pattern of association but has provided an average set of responses instead of state-specific results. State responses to employment growth and FDI shocks confine to groups of regions. The model provides a solid idea of employment growth responses to FDI by types of flows and a distinction of effects by competitiveness and social progress levels.
Our results reveal a very mild nexus between FDI and employment growth, but a more clear relation in states with high competitiveness and social progress and where local investment is high. While competitiveness and social progress condition the nexus between FDI and employment growth in Mexico, the claims that FDI positively affects Mexico’s employment growth do not find substantial support in this study.
Footnotes
Appendix A
Summary Statistics for Social Progress Levels.
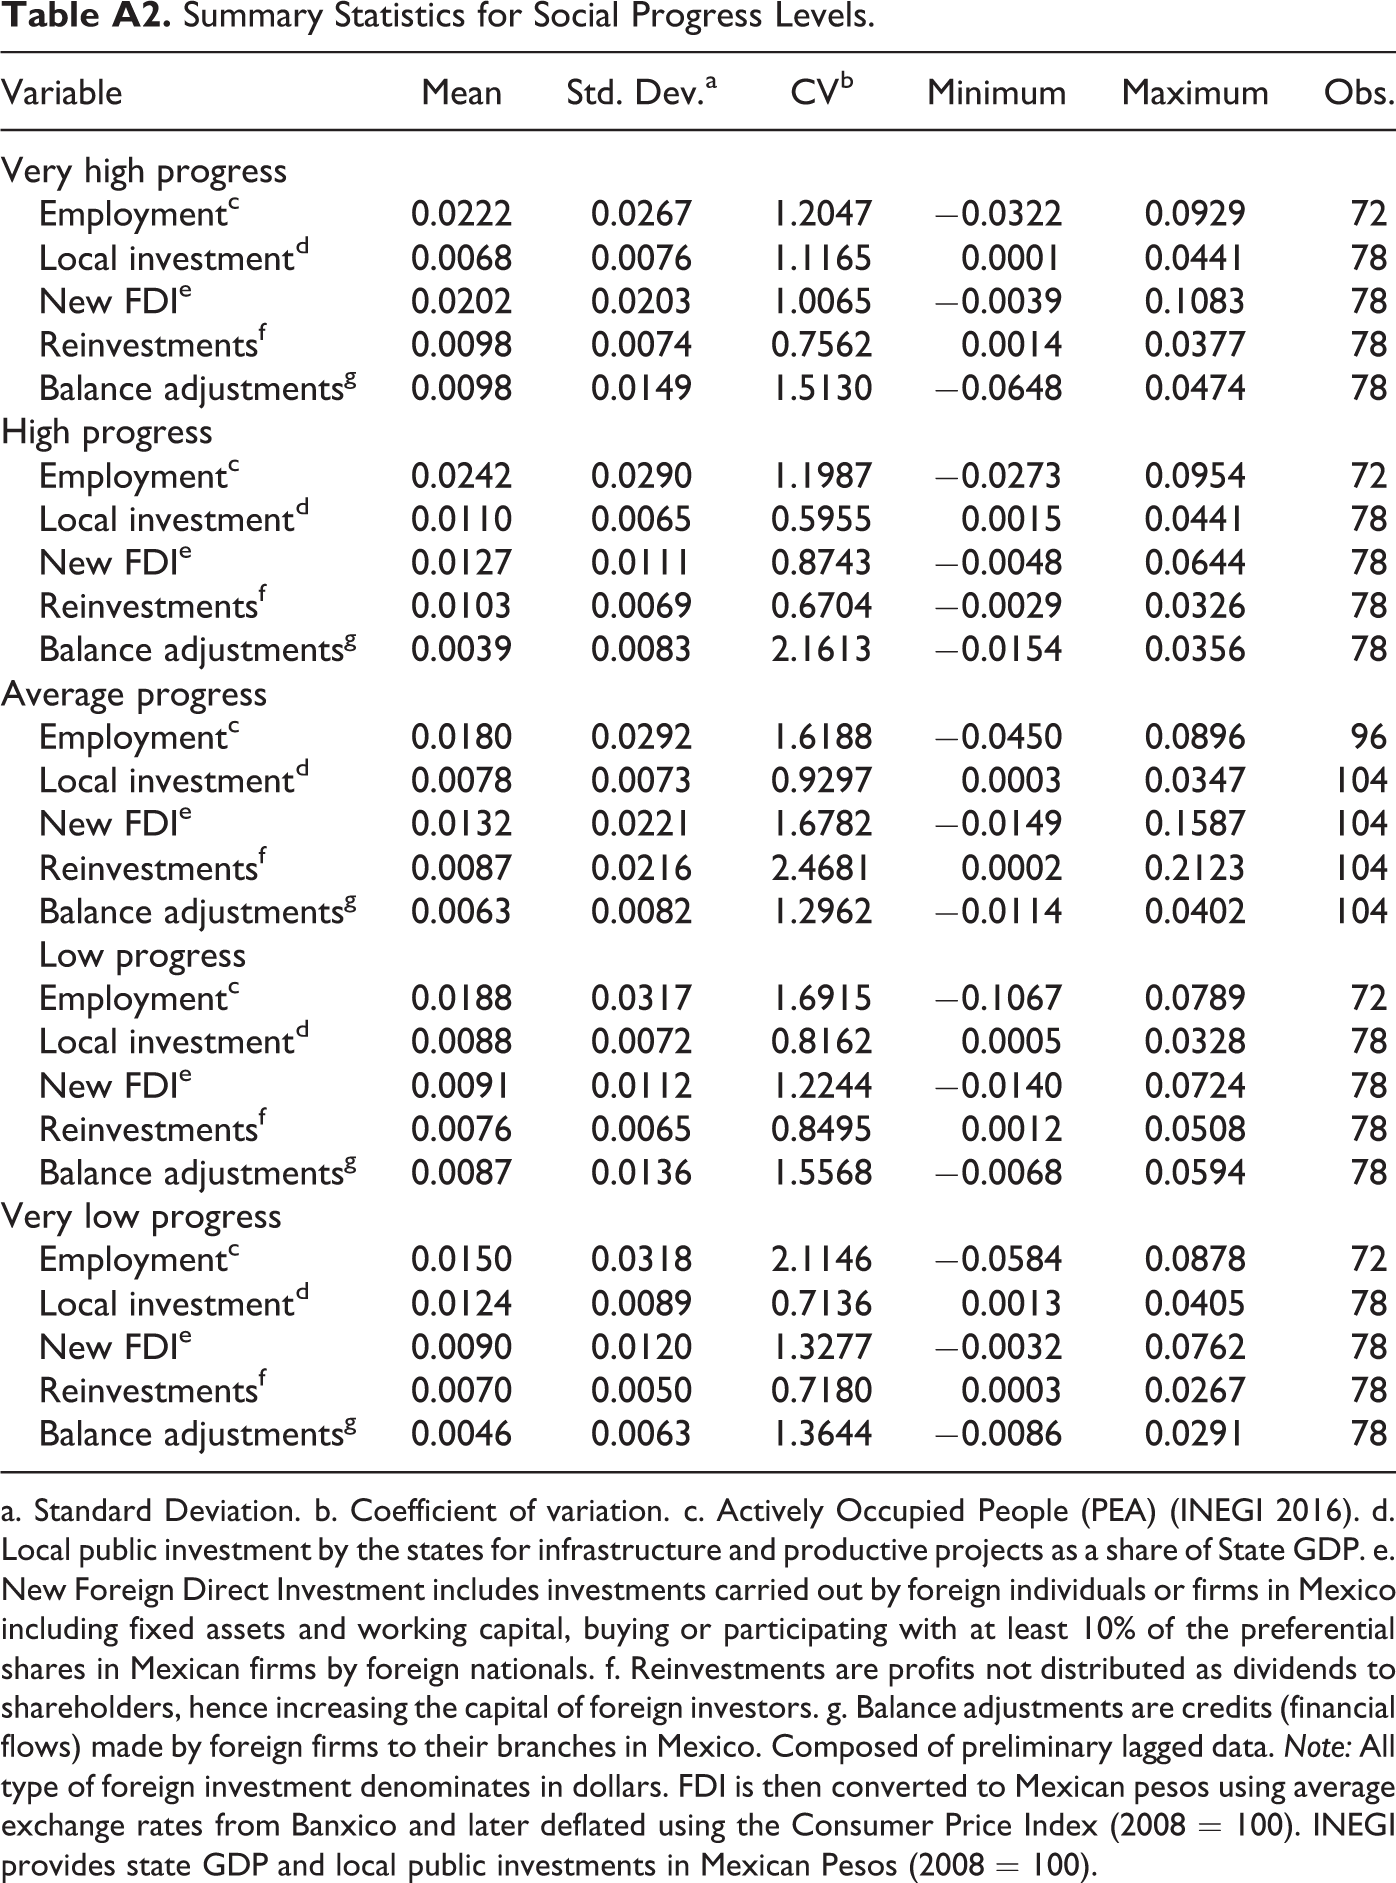
| Variable | Mean | Std. Dev.a | CVb | Minimum | Maximum | Obs. |
|---|---|---|---|---|---|---|
| Very high progress | ||||||
| Employmentc | 0.0222 | 0.0267 | 1.2047 | −0.0322 | 0.0929 | 72 |
| Local investmentd | 0.0068 | 0.0076 | 1.1165 | 0.0001 | 0.0441 | 78 |
| New FDIe | 0.0202 | 0.0203 | 1.0065 | −0.0039 | 0.1083 | 78 |
| Reinvestmentsf | 0.0098 | 0.0074 | 0.7562 | 0.0014 | 0.0377 | 78 |
| Balance adjustmentsg | 0.0098 | 0.0149 | 1.5130 | −0.0648 | 0.0474 | 78 |
| High progress | ||||||
| Employmentc | 0.0242 | 0.0290 | 1.1987 | −0.0273 | 0.0954 | 72 |
| Local investmentd | 0.0110 | 0.0065 | 0.5955 | 0.0015 | 0.0441 | 78 |
| New FDIe | 0.0127 | 0.0111 | 0.8743 | −0.0048 | 0.0644 | 78 |
| Reinvestmentsf | 0.0103 | 0.0069 | 0.6704 | −0.0029 | 0.0326 | 78 |
| Balance adjustmentsg | 0.0039 | 0.0083 | 2.1613 | −0.0154 | 0.0356 | 78 |
| Average progress | ||||||
| Employmentc | 0.0180 | 0.0292 | 1.6188 | −0.0450 | 0.0896 | 96 |
| Local investmentd | 0.0078 | 0.0073 | 0.9297 | 0.0003 | 0.0347 | 104 |
| New FDIe | 0.0132 | 0.0221 | 1.6782 | −0.0149 | 0.1587 | 104 |
| Reinvestmentsf | 0.0087 | 0.0216 | 2.4681 | 0.0002 | 0.2123 | 104 |
| Balance adjustmentsg | 0.0063 | 0.0082 | 1.2962 | −0.0114 | 0.0402 | 104 |
| Low progress | ||||||
| Employmentc | 0.0188 | 0.0317 | 1.6915 | −0.1067 | 0.0789 | 72 |
| Local investmentd | 0.0088 | 0.0072 | 0.8162 | 0.0005 | 0.0328 | 78 |
| New FDIe | 0.0091 | 0.0112 | 1.2244 | −0.0140 | 0.0724 | 78 |
| Reinvestmentsf | 0.0076 | 0.0065 | 0.8495 | 0.0012 | 0.0508 | 78 |
| Balance adjustmentsg | 0.0087 | 0.0136 | 1.5568 | −0.0068 | 0.0594 | 78 |
| Very low progress | ||||||
| Employmentc | 0.0150 | 0.0318 | 2.1146 | −0.0584 | 0.0878 | 72 |
| Local investmentd | 0.0124 | 0.0089 | 0.7136 | 0.0013 | 0.0405 | 78 |
| New FDIe | 0.0090 | 0.0120 | 1.3277 | −0.0032 | 0.0762 | 78 |
| Reinvestmentsf | 0.0070 | 0.0050 | 0.7180 | 0.0003 | 0.0267 | 78 |
| Balance adjustmentsg | 0.0046 | 0.0063 | 1.3644 | −0.0086 | 0.0291 | 78 |
a. Standard Deviation. b. Coefficient of variation. c. Actively Occupied People (PEA) (INEGI 2016). d. Local public investment by the states for infrastructure and productive projects as a share of State GDP. e. New Foreign Direct Investment includes investments carried out by foreign individuals or firms in Mexico including fixed assets and working capital, buying or participating with at least 10% of the preferential shares in Mexican firms by foreign nationals. f. Reinvestments are profits not distributed as dividends to shareholders, hence increasing the capital of foreign investors. g. Balance adjustments are credits (financial flows) made by foreign firms to their branches in Mexico. Composed of preliminary lagged data. Note: All type of foreign investment denominates in dollars. FDI is then converted to Mexican pesos using average exchange rates from Banxico and later deflated using the Consumer Price Index (2008 = 100). INEGI provides state GDP and local public investments in Mexican Pesos (2008 = 100).
Declaration of Conflicting Interests
The author(s) declared no potential conflicts of interest with respect to the research, authorship, and/or publication of this article.
Funding
The author(s) received no financial support for the research, authorship, and/or publication of this article.
