



Abstract
Fiscal stress is a common condition in shrinking cities such as Detroit. Among the contributing factors, property tax delinquency is a significant consideration due to the unwillingness or inability to pay property taxes. The literature shows that improvement in the quality of public goods and services can increase tax compliance and strengthen the social contract between taxpayers and the local government. Nonetheless, this relationship is unclear in the context of low-income shrinking cities. This article estimates the effects of new publicly provided transportation infrastructure on property tax compliance in Detroit, Michigan. Specifically, we use the announcement of the Qline in Detroit. We compute the effects of the Qline announcement on tax delinquency behavior using a Spatial Difference-in-Difference approach. The results indicate that the announcement of the Qline had an economically and statistically significant impact on tax delinquency for properties within one mile of the nearest Qline station.
Introduction
Fiscal stress is common in shrinking cities such as Detroit, of which property tax delinquency is a contributing factor (Whitaker and Fitzpatrick IV 2013). Consequently, these cities struggle to provide high-quality publicly provided goods and services due to resource constraints, which can have a detrimental effect on tax compliance because taxpayers do not see their tax contributions translated into city services and amenities. The literature shows that quality publicly provided goods and services can improve tax compliance and strengthen the social contract between taxpayers and the local government (Alm et al. 2014; Alm 2019). Our hypothesis is situated in this theoretical framework, where a new publicly provided good strengthens neighborhoods and reinforces the perception of fairness in paying taxes, thus reducing tax delinquency.
The mechanisms by which offering a new publicly provided good such as a rail line affects tax delinquency are two-fold. First, the Qline may strengthen a neighborhood and increase property values. While an increase or anticipated increase in property values may lead to a rise in tax burden (a discouragement to tax compliance), increased property value also increases the costs of non-compliance (the loss of a more highly valued property to tax foreclosure). Second, providing transportation services may reestablish and strengthen the social contract between taxpayers and the government, thus encouraging tax compliance. However, this relationship is unclear in the context of low-income shrinking cities. New publicly provided goods may increase nearby property values, potentially increasing household tax burdens and making it more challenging to meet tax obligations. The objective of this article is to shed new light on this question. While this research focuses on shrinking cities and in particular Detroit, the analysis is relevant to cities more generally, and should be of interest to urban science researchers.
This article examines the impact of new large-scale local transportation infrastructure on property tax compliance, thereby adding to the literature valuable empirical analysis regarding the linkages between publicly provided goods and tax compliance. Specifically, we examine the announcement of the Qline train in Detroit. The Qline is a new streetcar that became operational in 2017, connecting the three miles between Downtown and Midtown. While projects such as this can generate substantial social and economic benefits, the Detroit city government faces severe resource constraints that hinder its investment in such initiatives. Given the budgetary challenges, the transport system was developed by the M-1 Rail organization, a public and private partnership seeking to develop regional transit and generate economic activity. Resources from the private sector have funded 55% of the total cost of the Qline (Lowe and Grengs 2018).
The project co-funding resulted in a $7 billion new transport system connecting critical Detroit locations. The Qline route connects islands of activity such as museums, universities, and medical centers, much of which is surrounded by blight. The Qline transports 7140 passengers per day along the Woodward corridor (Kresge Foundation n.d.). Because the project is a significant investment for the city, impact evaluation is essential; however, substantial empirical challenges exist to identify a causal effect on property tax compliance, one component of the overall assessment.
These empirical challenges relate to identifying the timing of impacts and the relevant treatment area. Concerning the timing, the transport system could affect tax delinquency behavior immediately upon announcement or emerge over time as the rail is built and operationalized. There is also a lag between recognition by taxpayers that the Qline is being developed and the payment of tax obligations. Similarly, there is no clearly defined physical demarcation distinguishing the treated from the control areas, the literature suggests walking distance is the appropriate treatment. Hence, identifying the appropriate timing and treatment range are empirical questions. We utilize a non-parametric approach to allow patterns in the data to be revealed instead of setting an arbitrary treatment or control area classification. Consequently, we empirically explore the relevant boundary between the “treated” and “control” areas. In addition to these empirical challenges, we are also sensitive to potential endogeneity issues that may confound our evaluation. During the evaluation period, the city experienced several changes that could affect property tax compliance, such as installing new streetlights, the revitalization of some main streetways, and a citywide reassessment of property. Note, however, that many of these efforts are citywide. In contrast, the Qline is a geographically targeted investment. As one example, the restoration of the city streetlights may also influence tax compliance because improvements in lighting benefits pedestrians and drivers, and increases overall safety. However, the streetlight improvements were effective in the downtown area in 2016, which was prior to the Qline announcement. Likewise, the business renewal along Woodward Avenue could be a confounding factor because the Qline is located in the same area. However, as discussed later our empirical strategy is designed to isolate the impact of the Qline on nearby property owner tax compliance decisions.
In addition, potential endogeneity resulting from the nonrandom nature of the Qline location choice is a significant empirical challenge. The urban economics literature offers extensive discussions and analyses of this issue. We also address potential endogeneity related to violating the Stable Unit Treatment Value (SUTVA) assumption. As described later, we use appropriate methods to handle these forms of potential endogeneity.
Neighbors may be aware of nearby property foreclosure, independently due to taxes delinquency or mortgage default because both are highly linked. Secondly, although an imperfect measure, neighbors can observe properties’ blight and abandonment, which is also correlated with tax delinquency. The literature offers additional insight. For example, when tax compliance behavior is seen as being driven by moral considerations and households observe that their neighbors are not fully complying with the law, then tax evasion is more likely to be seen as morally acceptable (Alm, Bloomquist, and McKee,2017; 1 Wakolbinger and Haigner, 2009). Therefore, we cannot assume SUTVA and base our empirical strategy on the approach proposed by Bardaka, Delgado, and Florax (2018) and Delgado and Florax (2015). Specifically, we control for the transmission effect by incorporating spatial elements in our econometric analysis while at the same time maintaining a panel data framework.
Regarding the temporal-spatial features of the properties in the treatment area, Comber and Arribas-Bel (2017) argue that changes in the transportation system are speculative and internalized even before it begins. Hence, we use the announcement of the Qline plan in 2013 as the intervention year. When defining which properties should be treated, spatial analyses do not provide a unique answer. Therefore, we test multiple buffer distances to identify the most appropriate treatment area up to one mile from the Qline, where the treated properties are closer to the line. Once the treatment area is defined, the buffer or control area is also set. Thus, we have before and after periods for the Qline announcement and treated and control groups, which enable us to use a panel data approach with spatial difference-in-difference (SDID) characteristics.
The SDID deals with the SUTVA violation described above. It consists of a traditional DID analysis while incorporating a spatial weight matrix to model and control for the transmission effect between properties. Our approach uses a matrix based on distance. Since we are interested in transmitting the treatment, we use a spatial lag of the X model similar to Bardaka, Delgado, and Florax (2018). The dependent variable is the amount of back taxes owed with penalties. We are interested in the direct effect of the treatment, which captures the potential impact of the Qline announcement on tax delinquency behavior. The coefficients generated from this regression estimate the degree to which the Qline announcement affects tax delinquency while isolating the transmission effect.
The remainder of the paper is organized as follows: Firstly, we review the most relevant literature on the relationship between public goods and fiscal stress in the context of Detroit. Secondly, in the data section, we offer a detailed description of the data used in the analysis. The following to sections present the empirical methods and results, respectively. In the last section, we offer concluding remarks.
Literature Review
When discussing the post-industrial shrinking city phenomenon, Detroit inevitably comes to mind. Detroit is the quintessential American rust belt city: Places that were once prosperous must now somehow manage the complex challenges associated with the ongoing chronic decline (McDonald 2014). The literature agrees that the challenge in these cities, besides the loss of manufacturing, is a significant loss of population (Deng, Wang, and Yang, 2019; Xie et al. 2018). Detroit’s population has been in decline since 1950; in the recent period from 2000 to 2010, the city lost 25% of its population (Hollander and Németh 2011), which has resulted in increased vacant and abandoned houses and property tax delinquency (Gu et al. 2019).
The shrinking process is closely associated with fiscal stress. For instance, increasing poverty is common in shrinking cities, exacerbating fiscal stress by increasing public spending (Manville and Kuhlmann 2018) and curtailing tax revenue generation. These ongoing challenges in Detroit culminated in a breakpoint: In 2013, the City of Detroit declared bankruptcy (McDonald 2014). Xie et al. (2018) noted that both political and economic choices have contributed to the fiscal challenges that have resulted in households moving away from the city. Ongoing population decline has reduced tax revenues due to property abandonment, declining property values, and deteriorating housing stock and other infrastructure (Paredes and Skidmore 2017).
A complementary explanation is given by Gu et al. (2019), who suggest that housing abandonment is an abrogation of mortgage and tax responsibilities. However, Leavitt and Saegert (1988) indicate that surrounding local amenities influence property abandonment decisions. In the context of transportation, Hess and Almeida (2007) consider the city of Buffalo, which is similar to Detroit in terms of challenges associated with chronic population decline. As part of a revitalization effort, a light rail was installed. Their analysis indicated a positive relationship between the light rail and nearby property values. Although the effect is not even throughout the city, there is empirical evidence that a publicly provided good such as a light rail can be capitalized into property values when recognized as an amenity.
Further, increasing property values may influence the decision to pay property taxes. On the one hand, increased property values translate to higher tax payments and may lead to the non-payment of taxes for some. On the other hand, increasing property values notably increase the costs of tax delinquency in that more valuable property is lost in tax foreclosure.
We recognize that different channels may influence tax delinquency/compliance behavior. However, we focus on the role of public transportation because, to our knowledge, no existing studies have examined the relationship between a new transport system and property tax compliance decisions. However, several studies discuss the effects of public good provision (as a general topic) on tax compliance. For example, Bordignon (1993) suggests that a person’s tax compliance/evasion decision depends partly on their perception of the fairness of fiscal treatment in terms of public good provision. Thus, the provision of a new publicly provided transport system could reinvigorate the social contract between taxpayers and local government authorities. Other researchers, such as Alm et al. (2017), examined the importance of the treatment and behavior of other taxpayers. Using experimental methods, Alm, McClelland, and Schulze (1992) attribute tax compliance decisions of some people to the overweighting of a low probability audit and the degree to which public goods are recognized and valued.
In the more specific context of property tax delinquency, Scafidi et al. (1998) noted that tax compliance is a rational choice between the accrued unpaid taxes and the property’s market value. From the perspective of local governments, pervasive, ongoing tax delinquency may generate fiscal stress as property is abandoned. Property abandonment is associated with higher crime rates and other negative spillovers (Accordino and Johnson 2000). These negative externalities reduce the value of surrounding properties, reducing the tax base (Carroll and Goodman 2017). Likewise, tax delinquency is influenced by land use characteristics and socio-economic factors (Gu et al., 2019). In the context of Gu et al. (2019), the Qline might generate higher property values and thus more significant tax obligations, potentially increasing tax delinquency among some property owners. However, as noted above, higher property values also increase the costs of non-compliance in that the property owner loses more valuable property in tax foreclosure.
The literature points to two primary mechanisms by which the provision of a new publicly provided good, such as a new rail line, would influence tax compliance. First, a new rail line may increase property values, significantly increasing the incentive to pay taxes (the loss of a more valuable asset in tax foreclosure). In addition, as noted by Bordignon (1993), Alm et al. (2014), and Alm (2019), the provision of a new public good or publicly provided good may encourage tax compliance via the strengthening of the social contract between taxpayers and the government officials. However, the literature also points to the importance of neighbors’ perceptions of tax compliance. The importance of neighbor effects provides additional motivation for our spatial econometric empirical strategy.
In summary, the literature generally points to the idea that new or improved publicly provided goods, such as the Qline, may reduce tax delinquency. This effect may be more pronounced in struggling cities such as Detroit, where the level and quality of public services have been hampered by fiscal challenges associated with chronic population decline. As the population falls, there is an excess housing supply, property abandonment, and increasing blight. These factors may influence decisions to pay taxes (Whitaker and Fitzpatrick IV 2013). However, we also note that our evaluation is also of relevance to cities more generally by offering new information regarding the relationship between the provision of publicly provided goods and tax compliance.
Data
The initial dataset is a parcel-level balanced panel obtained from Data Driven Detroit. The dataset contains complete information on the tax delinquency status of around 254,000 residential properties between 2011 and 2016. As the literature review suggests, the potential effect of the new Qline on tax delinquency behavior is local and expected to dissipate the further a property is from Qline stations (Alm, Bloomquist, and McKee 2017; Bardaka, Delgado, and Florax 2018). Consequently, we restrict our evaluation to data on those properties located within one mile of a station, which results in a subsample of 2397 parcels per year and a total of 14,382 observations over 6 years. Because we are interested in tax compliance behavior, we restricted our data set to parcels that recorded back taxes owed at least once over the 6 years of analysis while recognizing the potential selection bias that may result from this strategy. For this reason, address this issue by including the inverse of the Mills ratio, which provides evidence of potential selection bias and corrects it. This reduced the subsample to 1330 residential properties per year, giving 7980 observations over the whole analysis period. These properties have average unpaid back taxes of $2008 over the 6 years. However, the mean back taxes due decreased over time.
Descriptive Statistics of Tax Delinquent Amounts by Year.

Note: Percentages are in parentheses. Source: own work using D3 data.
We also present the median value of tax delinquency since extreme values can influence mean values. In 2011 the median was $1,107, but by the end of the period, it was $0. More than half of the properties had no tax debt by 2015 and 2016. However, the highest median tax debt was $1903 in 2013. The mean is higher than the median for all years, indicating values in the right tail of the tax debt distribution skew the mean upward. We repeat the analysis to help reduce the skewing, but first, trim the top and bottom 1% of the tax delinquent amounts each year. Finally, the last two columns of Table 1 show the percentage of properties with and without tax debt, respectively, by year. In 2011 62% of the subsample of properties were tax delinquent, and even higher in 2013 at nearly 86%. However, after 2013 there was a significant decline to about 49% in 2015 and 2016.
We now turn to a discussion of choosing a treatment year and spatial treatment from which we can observe the effect of the Qline on tax delinquency. According to the literature, the announcement date is more appropriate than the opening date due to the anticipation of the benefits (or externalities) of the Qline (Comber and Arribas-Bel 2017). In the case of the Qline, the formal announcement was made in 2013 and thus is the primary point that differentiates the ex-ante and ex-post period of the treatment. In addition, we must also assign the spatial treatment based on distance from Qline stations, where parcels closer to a station will be designated as treated parcels, and those located further will be designated as control parcels.
Our strategy consists of creating several distance buffers. These buffers range from 0.3 miles to 0.9 miles of distance from the nearest station. Hence, every property inside each buffer is assigned as a treated property, whereas the remaining properties are assigned as controls. For example, if we define a buffer of 0.3 miles, all properties within a range of 0.3 miles or less are set as treated observations. In contrast, all the properties located in a range of 0.4 miles to 1 mile are used as control observations. This strategy enables us to avoid making arbitrary decisions about the treatment area and provides a robust strategy for further examining our estimates.
We could impose a strict spatial definition of the treatment, where we define 0.3 miles as the closest distance to stations and then set all the properties inside that distance as treated. However, a potential disadvantage of this rule is that there are too many control observations relative to the treated group. In contrast, if we are too lax in the definition of the treatment area as we move further from the station, then we generate too many treated observations relative to the number of controls. Once the treated and control properties are defined, we use “a single binary treatment” for our sample. The treatment variable is assigned the value of 1 for treated properties and 0 for control properties.
Methods
The difference-in-difference (DID) analysis is used extensively in the literature to evaluate the impacts derived from transportation systems. Assuming unconfoundedness and parallel trends, the DID approach enables us to estimate the average treatment effect (ATE) between properties that receive treatment and those that remain as controls before and after the intervention. Our data and empirical setup map perfectly with a DID methodology because we have information before and after 2013. The DID approach is expressed in equation (1).
The vector
However, we do control for two relevant time-varying factors. The first variable is the taxable value used to determine tax payment. In Michigan, the property tax basis is state equalized value, which is equal to 50% of market value. When a given parcel is purchased, the taxable value equals the state equalized value. However, the taxable value is constrained to grow at the inflation rate or five percent, whichever is lower, for as long the property owner retains ownership. Hodge (2019) demonstrated that properties were significantly over-assessed in the wake of the 2008 financial crisis. The ensuing assessment corrections helped reduce tax delinquency, particularly when assessment reductions also reduced tax payments. Therefore, our evaluation controls for both over-assessment and the correction that occurred during the period of analysis we consider.
We also include the inverse Mills ratio generated from a first-stage probit regression we estimated to examine and control for potential bias caused by nonrandom parcel sample selection (Heckmann 1979). More specifically, because we consider only the tax delinquent properties close to the Qline in our evaluation and those who were delinquent at least once, we risk generating sample selection bias. The inverse Mills ratio enables us to test for potential sample selection bias and correct it within the regressions. Finally,
The SUTVA assumes that the output variable
The SDID provides an unbiased measure of the impact of the Qline on tax delinquency (Bardaka, Delgado, and Florax 2019; Chagas, Azzoni, and Almeida 2016). Specifically, the approach separates the traditional DID ATE into the average direct effect of treatment (ADTE) which is the impact of the Qline on a property (own effects), and the average indirect treatment effect (AITE), which captures the impact of peers on that same observation (neighbor effects)
The main difference between Equations (1) and (2) is that equation (2) incorporates
Despite using SDID to address SUTVA, there are still several unaddressed issues. As discussed above, the spatial relationship is exclusively for the treatment group; therefore, other forms of dependency are ruled out, such as the spatial autocorrelation of the dependent variable or even spatial dependence in the error structure, which assumes that tax delinquency from a given household is independent of neighbors. Thus, the SUTVA violation in the SDID model is similar to omitted variable bias; other spatial econometric approaches can help resolve this potential problem more effectively than the current SDID.
Another challenge that is not yet fully explored is that the panel data can also be used to evaluate the timing of impacts. For example, the DID approach has a pre-intervention period (0) and a post-intervention (1). This approach does not identify whether the impacts affect one, two, or even 3 years after 2013. Thus, the SDID estimates the average impact over time without clarifying the amount of time required for the intervention to take effect.
Considering the issues discussed above, we propose a third approach built on spatial panel data, modeling the SUTVA violation with a lag in the treatment and tax delinquency. We capture the local effects of the interaction as illustrated above, but we add to it the global effects of the tax delinquent condition. Moreover, we further blend the SDID logic with an SDM. The idea is to continue working with treated and control groups before and after the intervention, as illustrated in equation (3). We examine these alternative models as a robustness check.
In equation (3), the dependent variable is the back taxes owed, which follows an autoregressive structure, where
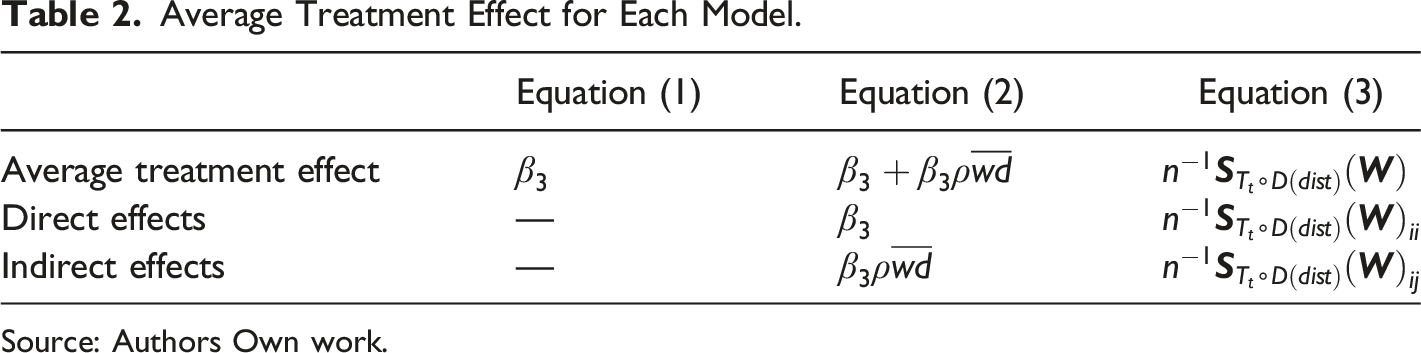
Average Treatment Effect for Each Model.
Source: Authors Own work.
In each column of Table 2, there is an equation that represents the respective estimation methods. In the rows, we have the classical ATE and the direct and indirect effects of the treatment. Table 2 clarifies that the ATE of the traditional DID is just an average of direct and indirect effects that have not been disentangled. Accordingly, equation (2) divides the ATE into the direct effect that represents the own effects. The indirect effects, as captured by
Empirical Results
We exploit the panel data to explore the dynamics of the impact over time, as shown in Figure 1. Hence, the evaluation begins with the temporal analysis. Later, we focus on the spatial analysis. The horizontal axis represents the distance of a property to the nearest Qline station in a range of 0.3–0.9 miles. The vertical axis is the ATE estimated from our core model. Time effects. Source: Authors own work using data from data driven detroit.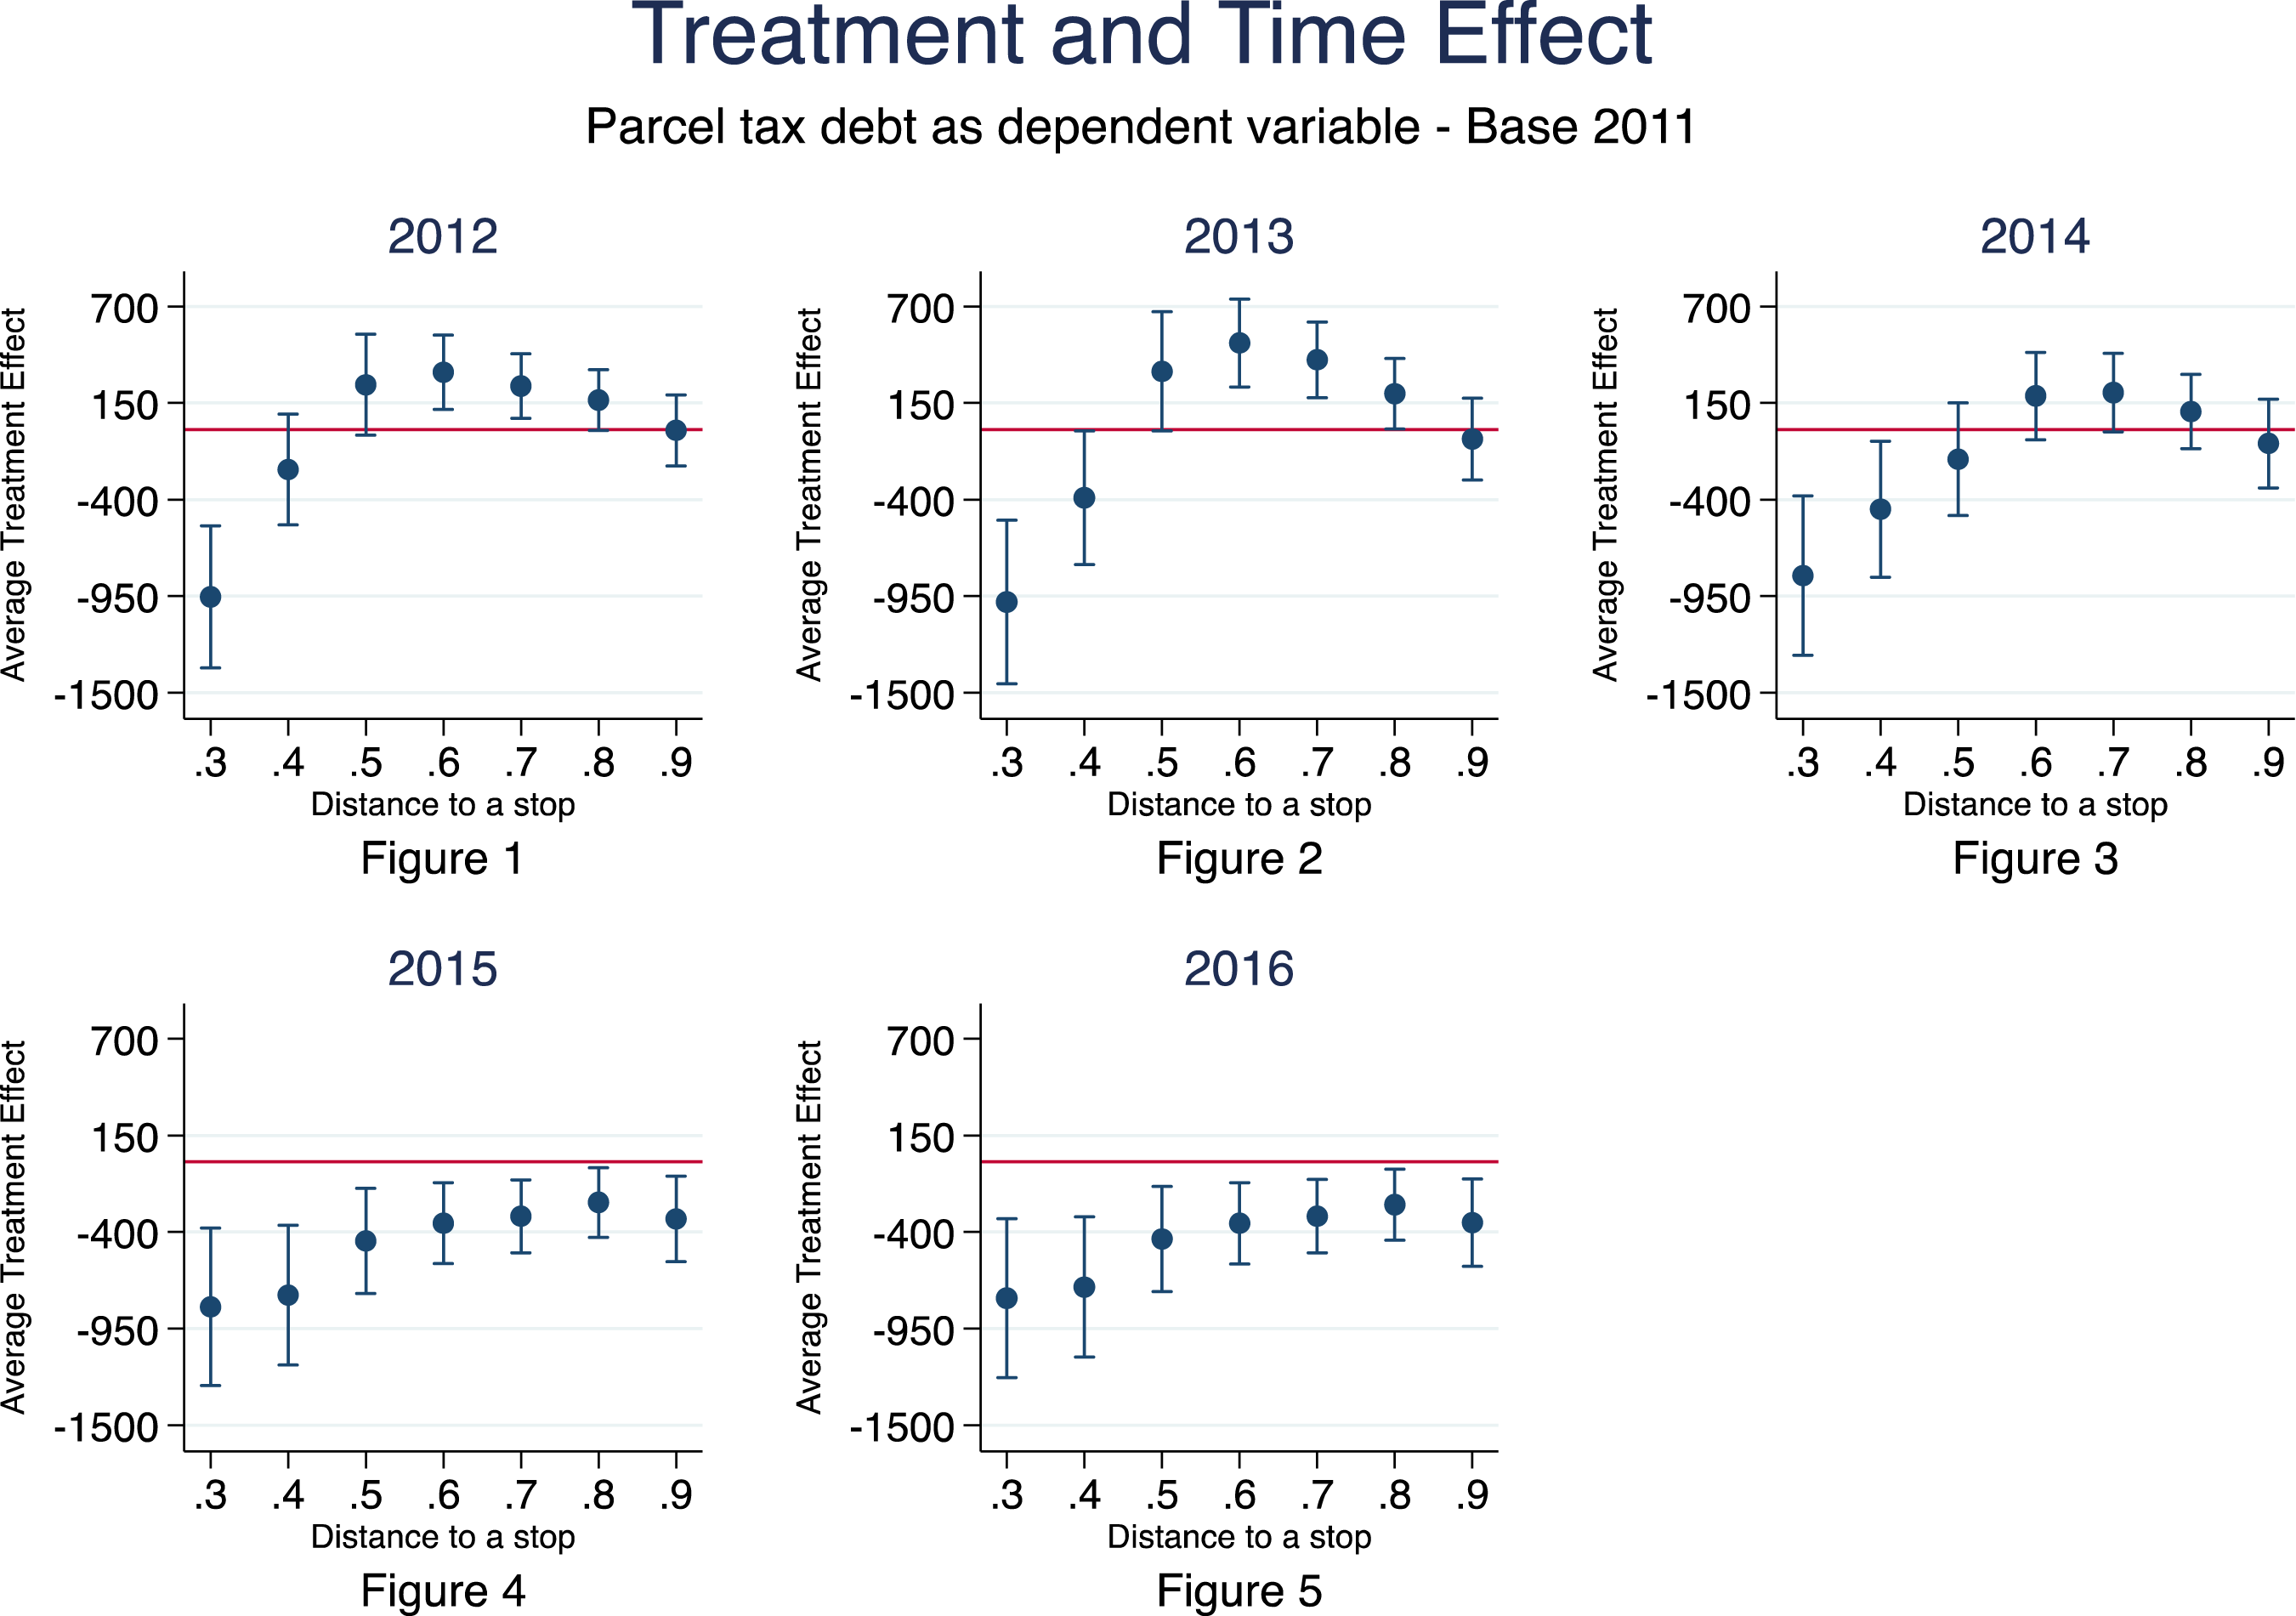
Figure 1 present estimates in which we eliminate the time variable and add time indicator variables for each year, using 2011 as the base year. The vertical axis shows the ATE interacted with the time indicator variables. The estimates for 2012 and 2013 are mixed. For a distance of 0-3-mile, the result is negative, indicating a reduction in tax debt. As we move further from the nearest station, we observe positive results, indicating an increment of debt compared to 2011. However, this effect becomes insignificant as we approach the 0.9-mile distance. By 2014, a significant reduction in tax debt emerged compared to 2011 in much of the range, and by 2015 there was a tax debt reduction over the entire one-mile range. These results indicate that it took about 2 years for the Qline announcement to be reflected in the tax delinquency records. With that in mind, consider now the difference in difference estimates.
Figure 2 shows the difference in difference model. Note first that the coefficients are negative, implying that the announcement of the Qline, on average, reduces the amount of tax delinquency for those properties that were tax delinquent for at least 1 year over the 2011–2016 period. Second, the effect of the Qline is economically and statistically significant for properties within 0.4 up to 0.9 miles of distance. This finding is consistent with our expectation that the Qline will have a localized effect; the further a property is from a station, the lower the tax debt reduction. Moreover, the debt reduction goes from about $550 in the 0.5-mile radius to almost $250 at a distance of one mile. Average treatment effect from DID and SDID; Spatial durbin model direct effects. Source: Authors own work using data from data driven detroit.
Thus far, our analysis suggests that the Qline announcement had meaningful consequences on tax delinquency behavior for property owners near the Qline. However, these results do not fully consider the treatment’s local effects; therefore, we repeat the evaluation using the SDID approach as summarized in Figure 2.
For the SDID estimations, we use an inverse distance matrix and present the direct effect of the treatment, which is analogous to the ATE effect generated from a traditional DID analysis. We anticipated that once the indirect effects of the treatment are removed, the direct impact would be substantially different from those presented in Figure 2. However, the estimates follow a similar trend throughout the distance ranges. Still, the SDID models reflected in equation (2) only consider spatial dependency in the treatment when tax delinquency behavior also has a spatial structure. As a result, we revised the way we modeled the peer effects. We estimate an SDM because this approach has a local impact on the treatment and a global impact on tax delinquency. For these estimations, we used the same distance matrix as before. The results are shown in Figure 2.
We report the direct effects once we control global and local spatial effects. With these estimations, the magnitude of the direct impact on tax debt is even bigger in absolute terms than was estimated with the previous approaches. Comparing both models, the coefficient at 0.5-miles of distance of the DID and the SDID is less than $550, while the SDM for the same setting offers a decrease of the debt of $700, approximately.
Our results indicate that spatially blind models might be biased, and the tax compliance behavior might have a larger magnitude in absolute value terms. While our estimates capture some notion of a neighbor effect, we are cautious in attributing this strictly to a peer effect; we recognize that the indirect effects 3 may capture other factors discussed above. In summary, the DID analysis estimates result from two forces that the SDID analysis could not disentangle. The differences in the coefficient estimates across spatial models could also be explained by our understanding of spatial dependency on tax delinquency. The SDID does not allow an autoregressive process for the dependent variable, while the SDM does. Thus it can capture a repercussive effect on tax delinquency on neighbors. The SDM approach appears to capture the own and peer effects of the Qline announcement.
To finalize this section, we briefly discuss the results of the selection bias correction. Consistently in every estimation, the inverse of Mills ratio was statistically significant; this means that nonrandom sample selection bias is present. However, the coefficients are similar whether or not we control sample selection; hence, our results are robust to addressing sample selection bias.
Discussion and Conclusions
This article estimates the effect of a local publicly provided good on property tax delinquency behavior. Specifically, we examined how a new public transit option affected tax delinquency in Detroit, Michigan, when delinquency was exceptionally high. We used a balanced panel of parcel-level data for tax-delinquent properties at various distances from the Qline along Detroit’s Woodward Avenue. The results indicate that the announcement of the Qline had an economically and statistically significant effect on the tax delinquency for owners of properties located within one mile of the nearest Qline station. Inside this range, we estimated reductions in tax debt ranging from $250 to $700. Overall, our estimates indicate that the Qline helped reduce back taxes owedt for properties within proximity of the streetcar line.
We also identified critical time and spatial elements in the analysis. Concerning the timing, estimates indicate that it took 2 years for the Qline announcement to reduce tax debt for the distances considered in the study, up to one mile. Our spatial analysis identified peer effects, confirming previous research regarding the influence of neighbors on tax-delinquency behavior. We interpret the announcement of the Qline to have improved overall tax compliance because households anticipated a benefit from a new local publicly provided good. However, when families perceive that their neighbors are not paying taxes, the impact is muted, resulting in a smaller tax debt reduction.
While we offer several empirical strategies to refine the estimates and capture causal impacts, we acknowledge that other possible factors potentially correlated with the Qline announcement may have influenced tax compliance decisions. As discussed earlier, there are ongoing efforts to revive business activity along Woodward Avenue, which is the location of the new transport system. Therefore, localized tax delinquency could be affected by both the Qline and other economic development efforts, thus confounding an impact evaluation. The city has also implemented other improvements such as street lighting and removing blighted structures, which have occurred all over the city. Our empirical strategy provides confidence that we are capturing the localized Qline effects. While other redevelopment efforts along Woodward Avenue may affect tax compliance decisions, the Qline is the most significant. Thus, our study points to the Qline as an essential factor influencing property tax compliance decisions.
While tax compliance is a challenge for shrinking and growing cities alike, the scale of the problems is much larger in struggling urban areas. Thus, the impacts and mechanisms for improving tax compliance varies according to the context. In cities with chronic population loss, tax delinquency is a major issue. Limited governmental resources and diminishing quality of life may result in increased tax delinquency. Moreover, relative to growing cities shrinking cities often face more acute poverty, blight, and property abandonment, andother disamenities. All of these conditions may exacerbate the tax compliance problems in shrinking cities. While our evaluation is relevant for cities in general, it is particularly relevant for shrinking cities in the United States and many other countries such as Japan and European countries that are also managing cities with declining populations.
The case of Detroit has given us the inputs to assess tax compliance behavior when there is a large-scale project partially funded by the local government. However, the findings presented in this article are pertinent to other shrinking cities across the globe. To illustrate, Bartholomae, Nam, and Schoenberg (2017) discuss shrinking cities challenges and revitalization policies in former East German cities. Oswalt and Rieniets (2007) highlights the fact that 370 cities worldwide with populations over 100,000 people, including cities in Europe, Asia, and Africa, have experience population losses in excess of 10%. As cities experience population decline, they face stagnant/declining revenues and thus the challenge of continuing to provide essential publicly provided goods and services. In the case of the Detroit Qline, resourced stakeholders recognized the constraints. These stakeholders were willing to partner with the city to reinvest in the local transportation infrastructure, thus improving transportation services. Our evaluation offers evidence that this reinvestment resulted in improved tax compliance through the renewal of the social contract. No single policy/activity can solve all the problems associated with city shrinkage. However, the research presented in this article offers empirical evidence that targeted activities designed to improve publicly provided services can be one practical feature among a suite of activities. Detroit offers lessons for other struggling cities, showing that public/private partnerships can form around the need to address shared challenges and that such reinvestments can improve a city’s fiscal condition through improved tax compliance.
Finally, we offer a few ideas for future research. First, as noted earlier, the city has made other critical reinvestments. For example, it has systematically repaired street lighting throughout the city. Do other critical investments like this help stabilize neighborhoods, improve property values, and increase tax compliance? A similar question could be asked of public spending for demolishing dilapidated housing or removing other disamenities. Importantly, while such policies may help to improve the overall economic and fiscal condition of shrinking cities, those benefits may not be equally shared across income groups or classes: An examination of the distributional impacts of such policies/activities is an important topic for future work.
Footnotes
Declaration of Conflicting Interests
The author(s) declared no potential conflicts of interest with respect to the research, authorship, and/or publication of this article.
Funding
The author(s) disclosed receipt of the following financial support for the research, authorship, and/or publication of this article: REDES180100 and the Chilean Fondecyt grant Na1220566.
