



Abstract
Student engagement is a critical feature to the teaching and learning dynamic that takes place in the classroom. Technology is often used as a means for increasing student engagement, and Student Response Technology (SRT), where students use handheld clickers to respond during classroom instruction, is one form of technology used to do this. The current study examined the effect of SRT on student engagement in elementary classrooms for students with disabilities. A multiple baseline across participants design was used to measure student engagement across several areas, including rate of participation and on-task behavior. Both visual and statistical analysis yielded a relationship between use of SRT and two areas of engagement: student’s participation and on-task behavior.
Keywords
Student engagement, which refers to classroom behaviors that demonstrate a student’s involvement in the learning process (Finn, 1989), is a key component of student success (Dix, 2013). Academic engagement is the set of behaviors significant to the learning process, such as attention to task, participation, interest in learning, and motivation. Engaging students academically affects their interest in school, participation in learning, and behavior in the classroom (Fredricks et al., 2004). Finn (1989) developed the participation-identification model to explain the correlation between student engagement and identification with school, suggesting that increased participation leads to an increased sense of belongingness in school.
In a study of three high-school classes, Duchaine et al. (2018) noted a connection between academic engagement and achievement. The authors studied the implementation of Response Cards (RC) and its effect on student engagement and achievement, for three students with disabilities and three students without disabilities, who served as a “normative comparison” across two classrooms, Student engagement was measured by participation, hand raising during baseline and written responses on cards held up to teacher questions during intervention. Achievement was measured by the accuracy of responses on a next day quiz score, with a mean increase of 10% set as criterion. Results from the study showed a substantive increase in participation for all participants, with two of the three students with disabilities surpassing participation measures of non-disabled classmates. Academic achievement gains criteria were met within 10 sessions for one class and 20 sessions for the second. Duchaine et al. (2018, p. 172) wrote, “The increase in student engagement when RC were used may have led to the increase in academic achievement.”
Research over the last 10 years has supported the use of student-directed technology as a mode of increasing academic engagement. Student Response Technology (SRT), a form of student-directed classroom technology that allows students to use hand-held devices to respond electronically to questions during class, has shown promise for increasing student engagement at the secondary and post-secondary levels (Blood, 2010; Heaslip et al., 2014). While results on the use of SRT for older students have been positive, considerably less research is available to support using SRTs to increase student engagement at the elementary level (Abode, 2010; Dix, 2013). This study aimed to expand the current research to include students with disabilities in elementary classrooms.
Students with disabilities often have low levels of academic engagement (Seo, 2006; Sridhar & Vaughn, 2001; Tabassam & Grainger, 2002), however, research on the use of technology has shown promise to address these deficits. Bryant et al. (2015) studied student engagement of four fourth-graders with learning disabilities using an alternating treatment design. They compared the engagement of students who had teacher-directed instruction (TDI) versus with the engagement of students who had reading instruction using an iPad Application instruction (AI). TDI was provided using scripted lessons on a multisyllabic word identification strategy, as well as partner reading for fluency. AI was presented using three applications that provided passage and word reading practice matched to reading levels, focused on reading fluency or words read per minute, some with tools so students could track their progress. Engagement operationally defined as eyes on the activity or teacher, student silent or on-task talking, hands to self, student listening, attending to instruction, was measured by momentary time sampling at 30 s intervals. The researchers found that participants in this study had consistently higher levels of engagement during AI instruction. Mean engagement ranged from 84.6% to 94.3% during TDI and 95% to 99% during AI. For social validity, researchers asked students which type of instruction they preferred. All participants chose the mode of instruction using iPad applications.
Research supports the use of SRT to increase engagement of students with behavioral problems. In a study of five high school students with emotional and behavioral disorders, Blood (2010) used an ABABC design to measure participants’ response rate (attempts), task engagement (as a percentage of intervals of time on task), and accuracy of responses to formal questions in an American history class. Formal questions were those pertaining to the history topics covered and not related to student behavior or social in nature. The researcher reported that the use of SRT resulted in increased responding to formal questions for all five students but did not increase task engagement.
Xin and Johnson (2015) looked at the use of clickers and their effect on on-task behaviors of students with behavioral issues. Using an ABAB design with five middle school students and utilizing 20-min interval recording, the authors reported significant effects for each of the students on-task behaviors (sitting in seat, staying quiet, raising hands, eyes on the teacher, working on task to completion). On-Task behaviors improved from a mean of 34.8% during baseline to 58.8% during the second intervention phase.
Abode (2010) used a quasi-experimental, pre-test/post-test design with a control group to investigate the impact of SRT on 100 third-grade students, some who received special education. The researcher measured achievement motivation using the School Achievement Motivation Rating Scale and added an additional five item survey to measure engagement. These were teacher scored likert responses of 1–5 on statements about student engagement in class (“on task during instruction,” “contributes during class wide discussion,” etc.; Abode, 2010, p. 126). For the treatment group, there was a significant increase from pre-test to post-test scores, compared to the control group, on three of the seven California standards measured. According to the results of an assessment that measured motivation and engagement, the authors also noted that learning motivation was significantly higher from the pre-test to the post-test for students who used student response technology.
The work by Blood (2010) and Xin and Johnson (2015) suggests a positive relationship between SRT and engagement for students with behavioral problems. While not targeting students with behavioral disabilities specifically, Abode did find a relationship for students including some enrolled in special education. This current study sought to expand upon their research by adding an additional study of elementary-aged students and including students with autism and specific learning disabilities as well. The purpose of this investigation was to determine if SRT had an effect on the academic engagement of four elementary-aged students with disabilities. Two research questions guided this study: How does the implementation of SRT affect students’ participation? How does the implementation of SRT affect students’ on-task behavior?
Method
Setting and Participants
This study took place in a small, private school for students with disabilities located in the Northeast United States. Public school Individualized Education Program (IEP) teams determined an academic need for students to be placed in the private school. One student was chosen from each of the two fourth and fifth grade classes to participate. Classroom teachers nominated one student in their class who met the designated criteria: (a) student had an identified disability as per the Individual with Disabilities Education Act, (b) student must have been placed in the special private school by a public school district because of needs relating to their disability, (c) student must have been identified as needing increased participation by the classroom teacher, and (d) parent provided consent and student provided assent to participate. All students who were nominated participated in the study.
Patrick was a 10-year-old boy in fourth grade, who was eligible for special education services because of his diagnosis of Other Health Impairment (OHI). He had additional diagnoses of dyslexia, attention-deficit hyperactivity disorder (ADHD), and generalized anxiety disorder. He demonstrated weaknesses in receptive, expressive, and pragmatic language. His full-scale IQ score was 85. Patrick was reluctant to participate in class and was often distracted by classmates and activities happening outside the classroom windows.
Matthew was a 10-year-old boy in fourth grade, who was diagnosed with an Auditory Processing Disorder. His IQ was in the average range, with a full-scale score of 90. He required frequent redirection to focus on the lesson and attend to class activities prior to the study.
John was an 11-year-old boy in fifth grade with a diagnosis of autism and ADHD. John’s full-scale IQ of 105 was in the average range, but his processing speed on the IQ test was low average. John was a very shy student who rarely participated actively in class. Additionally, John had academic challenges with processing information in the classroom, which impacted his response time when he did participate.
Zach was an 11-year-old boy in fifth grade with an IEP for his classification of being Specific Learning Disability. Zach’s full-scale IQ score of 99 was within the normal range. Prior to the study, Zach was easily distracted by objects inside his desk and often left his seat to move around the room or go to the restroom during class.
The study took place in the participants’ regular classrooms. The classrooms were designed for small classes, and the students were seated at individual desks with detached chairs. In the fourth-grade science classroom, desks were arranged in a U-shape configuration. There were eight students and one teacher in this classroom. In the fourth-grade social studies classroom, desks were arranged in two rows with space separating each desk. There were eight students and one teacher in this classroom. In the fifth-grade classroom, desks were arranged in two rows with no space separating desks. The third teacher taught both fifth-grade classes, which had nine students each.
Materials
In order to provide instruction during this study, teachers used SMART Board® interactive whiteboard and a class set of SMART Response clickers. The SMART Board® was at the front of each classroom. SMART Boards® display information from a computer or other audio-video sources. In addition, teachers and students could interact with the information by touching the board. During the study, teachers used presentations with slides to present information and ask multiple-choice questions on the SMART Board®.
SMART Response clickers, a form of SRT, are handheld devices that communicate with the SMART Board® through computer software. This interaction was similar to the way a remote control communicates with a television. The clickers have a power button, a display screen, at the top, and five response-choice buttons. The power button was used to turn clickers on and off during the study. The display screen told students when they were connected to the lesson and whether their responses were correct. The five response buttons were coded by color and shape: green circle, red triangle, blue square, yellow star, and purple diamond, which could be activated to answer a multiple response question. While there were additional buttons for settings on the clickers, they were not used in this study. Two video cameras were used to record participants across all phases of the study.
Research Design
The students chosen for the study demonstrated similar degrees of disengagement, so a multiple-baseline across participants design was used to determine the effects of implementing SRT. The design calls for the intervention to be initiated at different points in time across participants to determine experimental control (Horner et al., 2005; O’Neill et al., 2011). In this study random assignment was used to identify when participants received the intervention. Introducing randomization to the experimental design increased the internal validity of the design (Todman & Dugard, 2001) and allowed for an additional level of analysis to determine the significance of experimental effect. Using Microsoft Excel RANDBETWEEN function, random numbers were generated and assigned to each participant, establishing the order for beginning the intervention. Based on the random order assignment, students began the intervention in this order: John, Zach, Patrick, Matthew. Each participant completed at least five sessions in the baseline phase, after which random numbers were generated between 6 and 20 to determine the session in which the intervention phase began for each participant (Todman & Dugard, 2001). Based on the random numbers generated, John began the intervention phase on day 6, Zach on day 8, Patrick on day 9, and Matthew on day 11.
Baseline phase
Teachers provided direct social studies and science instruction as it was outlined in their curriculum. They used SMART Board® technology daily for instruction prior to and during the baseline phase. In each classroom, teachers asked routine formal questions intermittently throughout instruction for the 45-min class period. For the baseline phase, teachers posed five to 10 formal questions within a SMART Board® presentation of the subject matter. Multiple-choice questions were presented visually in a SMART Board® presentation, as well as read aloud to students. For example, one teacher asked, “What is the capital of New Jersey?” and gave the following labeled multiple choice options: a. Trenton, b. Princeton, c. New Brunswick, or d. Pennington. Students participated by raising their hands to show that they had formulated an answer to each question. During each classroom session in the baseline phase, the participant was videotaped to record performance data. In an effort to minimize the external effect of videotaping on participants’ performance, the participants were videotaped for three class sessions prior to the start of the baseline phase (data collection).
Intervention phase
The intervention in this study was the use of SRT, specifically clickers, in elementary classrooms with students with disabilities. Clickers were a new technology for these classes, so training was provided for participating teachers and all students in their classes. For the intervention, teachers continued to pose five to 10 formal questions in a SMART Board® presentation. The questions were in multiple-choice format, and students used clickers to respond to the questions on the SMART Board®. For example, one teacher asked, “The Inner Planets include Mercury, Venus, Earth, and _______.” Her clicker response options were Mars (green circle), Jupiter (red triangle), the Sun (blue square), or none of the above (yellow star).
After reading the question and possible answers, the teacher started (or activated) the question by clicking the green start button on the screen. Students then participated by pressing the button on the clicker that corresponded to the multiple-choice answer they thought was correct, as indicated by the color and shape represented on the button. All students in the four classes were trained by their classroom teachers and participated in using the clickers. The teachers presented three practice questions before instruction began to ensure students knew how to operate the clickers. Students were considered proficient if they participated in all three practice questions by pushing the correct button corresponding to the answer they chose. The software collected those answers via SRT until the teacher clicked the red stop button to deactivate the question. SRT software collected data from the students’ answers based on their assigned clickers.
Dependent Variables
Participation
During baseline, students demonstrated participation by answering the questions via raising their hands elevated above the student’s desk in response to the teacher-posed question. During the intervention phase, students participated in answering questions by using the SRT (i.e., clickers) to respond. Other types of student participation, such as calling out were not counted. During each session, all student responses were recorded, so it was possible to count the number of responses for each student. Teachers displayed the question and multiple-choice answers on the SMART Board® and read them aloud to the class. After reading the questions aloud, the teacher began accepting unprompted responses to the formal questions on the SMART Board®.
On-task behavior
Within this study, on-task was defined as (1) remaining in one’s seat, (2) speaking only to about the content of the class instruction and (3) attending to the instruction led by the teacher. Common non-examples of on-task included (1) getting out of one’s seat, (2) talking to another student not relating to course content, and (3) inattention. The target student’s on-task behavior was measured using a momentary time sample procedure in 10-s intervals for 10 min, beginning immediately after the teacher asked the first question. Students were considered on-task if they were exhibiting the noted behaviors and they were not exhibiting one of the three off-task behaviors.
Data Collection
Data were recorded during social studies or science content instruction as the format for teacher interaction allowed for a smooth implementation of the SRT in the structure of the class. Two video cameras were used to record each class session across participants, with sessions ranging in length from 30 to 45 min. All sessions were held nearly at the same time within the school day, thus addressing time of day as a potential confounding variable. Data were collected while watching the video recordings after the conclusion of the classroom lessons. Participation was determined by dividing the number of student responses by the number of teacher-initiated questions and multiplying by 100, yielding a session percentage for participation. Time on-task was determined by dividing the number of intervals on-task by the total number of intervals observed in the session and multiplying by 100, yielding a session percentage.
Data Analysis
Based on the similar conditions of disabilities and disengagement, participation and on-task behavior were measured independently of one another. Data on each dependent variable were collected and presented graphically. Visual analysis of the data included information on trends between phases for each participant and the consistency of points within each phase for each participant (Kratochwill et al., 2010). A change in data trends from the baseline phase to the intervention phase would have indicated a functional relationship between the dependent variables (participation and on-task behavior and the intervention (SRT)). This change could have been indicated by a change in the consistency, or stability, of data points or by an immediate change in data when participants entered the intervention phase (O’Neill et al., 2011). In addition, data were analyzed for means within each phase for each participant.
In order to assess the magnitude of change between baseline and intervention, the Points Exceeding the Median (PEM) was employed to determine the effect size of the intervention across participations for each variable. PEM was calculated by finding the median of the baseline across participants and computing the percentage of data points that exceed that median during the intervention phase. PEM scores of .9–1.0 were considered highly effective, .7–.9 were moderately effective, and less than .7 had questionable or no effect (Ma, 2006).
Data analysis focused on clinical significance. Visual analysis of data was used to determine the functional relationship between the independent and dependent variables to accept or reject the null hypothesis (Machalicek & Horner, 2018). However, nonparametric statistical analysis was also used to provide some additional strength to data analysis (Todman & Dugard, 2001). The Mann-Whitney U test, used when there are two independent samples of ranks (Heiman, 2011), provided an analysis of the differences in the means of the ranked baseline and intervention data for each dependent variable independently. This nonparametric statistical analysis was used to determine if there was a statistically significant difference between the two phases (Heiman, 2011; Todman & Dugard, 2001). In order to accommodate for the chance of a type 1 error, a Bonferroni Mann-Whitney U adjustment was done where a significance level of .025 was used (.05/2 = .025).
Fidelity
Prior to collecting any data for the study, the researcher provided each teacher with a set of written instructions for using the SRT and SMART Board® and reviewed the instructions with each teacher participant. The researcher provided a single demonstration lesson with formal questions on the clickers, so teachers understood the steps in the written instructions. Additionally, the researcher worked with each teacher individually to set up and use the SRT correctly. While observations of the live classes were not conducted during this study, researchers reviewed video recordings to ensure procedural fidelity in following the written instructions.
Reliability
In order to assure adequate reliability of the data reported, a second data recorder was used across 20% of the video sessions from each phase of the study. Inter-rater reliability of 80% or more was considered the minimal level for assuming the data was reliable (Horner et al., 2005). Prior to recording reliability data, the researcher trained the second observer by describing the operational definitions for each dependent variable and reviewing the data collection form. Then the two observers practiced recording data in tandem while reviewing one video from the study. Once each agreement reached a minimum of 80% during training, reliability data collection began. Each observer viewed subsequent videos independently.
Inter-rater reliability was calculated by dividing the number of agreements by the total number of agreements and disagreements and multiplying by 100 for each variable. For the variable participation, inter-rater reliability ranged from 81.67% to 96.67% with a mean of 89.67%. Inter-rater reliability for on-task behavior ranged from 82.67% to 93.33% across participants and phases. The mean reliability for on-task behavior was 88.22% across participants.
Social Validity
Social validity provides information on the perceived effectiveness and acceptability of the intervention (Horner et al., 2005). Each of the three teachers participating in the study completed the Treatment Acceptability Rating Form—Revised (TARF-R; Reimers & Wacker, 1988), which has an internal validity of .92. The TARF-R is a 7-point, Likert-type scale, where one represents the least possible score (“Not at all…”) and seven represents the highest score (“Very…” or “Much…”). There were three areas scored in the TARF-R: 1) teacher willingness to implement the intervention, 2) teacher expected effectiveness of the intervention, and 3) disadvantages to the teacher implementing the intervention. The response rate was 100%.
Teacher willingness to implement the intervention was based on five survey items: (1) acceptability of SRT in meeting teacher’s concerns for students, (2) teacher’s willingness to carry out the clickers in the classroom, (3) how much the teacher likes the SRT, (4) how willing others may be to carry out the clickers, and (5) how willing the teacher would be to change her routine to incorporate SRT. Teachers one, two, and three scored 30, 30, and 34 points respectively out of 35 possible points in this category, suggesting they were very willing to implement clickers in their classrooms.
The teacher’s expected effectiveness of SRT was measured by four items on the TARF-R: (1) how reasonable the clickers are given student behavior problems in the classroom setting, (2) likelihood that the clickers will make permanent improvements, (3) confidence in the clickers’ effectiveness, and (4) how effective the clickers will likely be in changing problem behaviors for students. There were 28 possible points in this category, with a higher number indicating greater perceived effectiveness of clickers in the classroom. Teachers one, two, and three scored 21, 18, and 23 points respectively in this category, suggesting they perceive clickers to be effective in their classrooms. Teachers did not report any disadvantages to implement SRT in their classrooms.
Results
The dependent variables measured in this study were participation and on-task behavior. Students demonstrated participation by answering the questions by raising their hands elevated above the student’s desk (baseline) and using the SRT to respond (intervention). Students demonstrated on-task behavior by (1) remaining in one’s seat, (2) speaking only to the content of the class instruction, and (3) attending to the instruction led by the teacher. The results of each variable are discussed here.
Participation
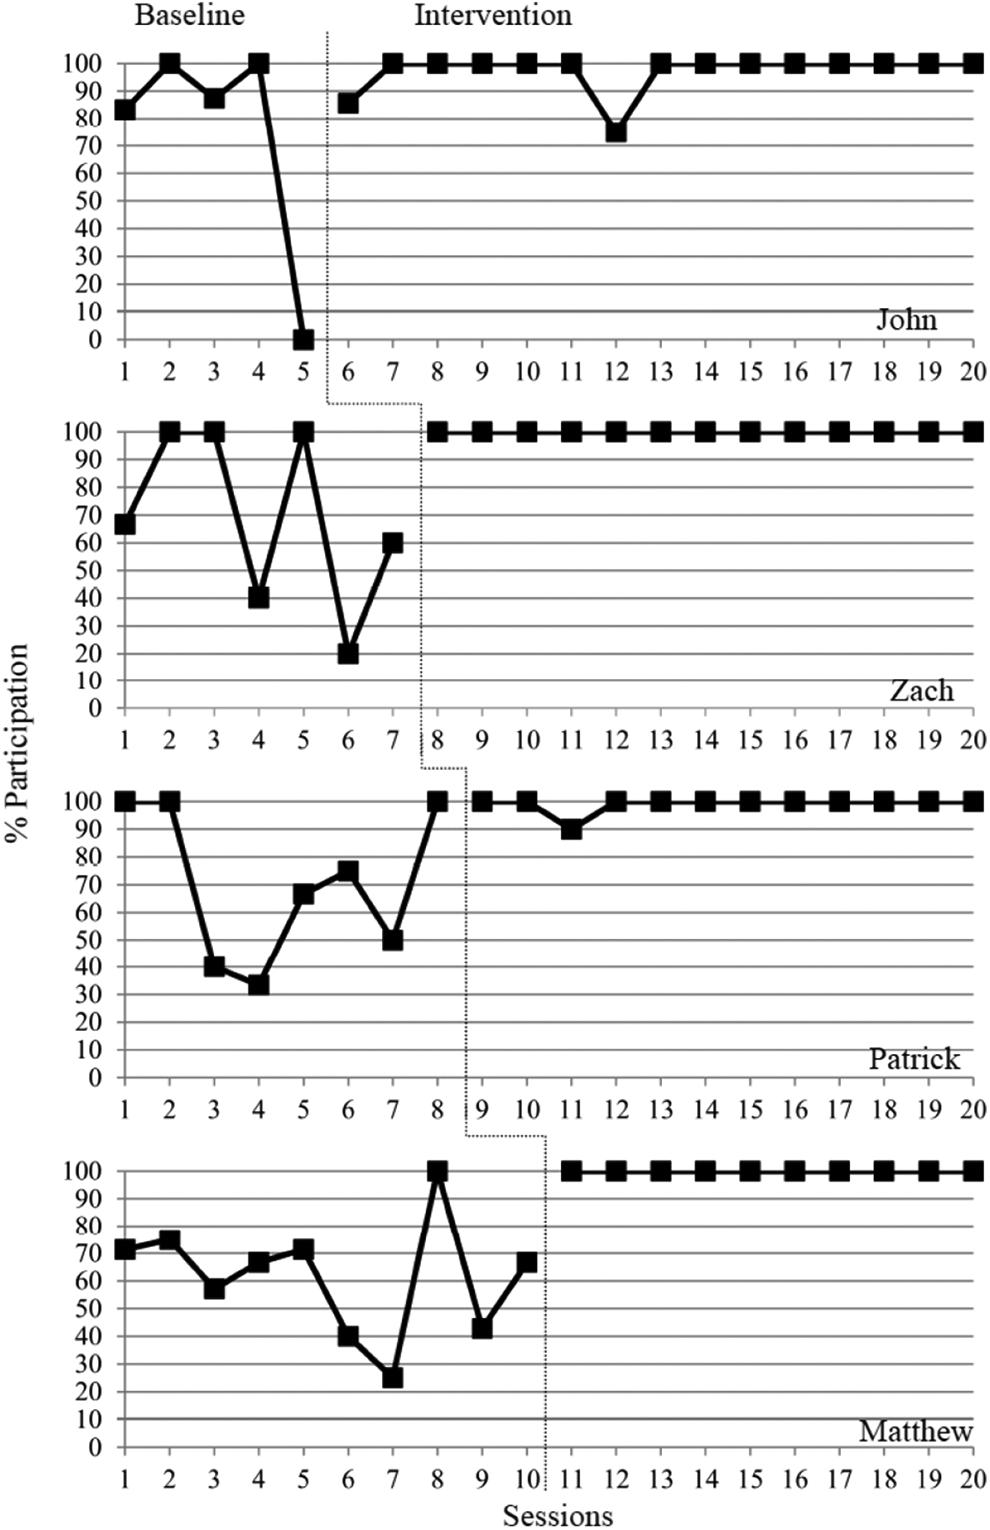
The percentage of participation was determined by dividing the number of student responses by the number of teacher-initiated questions and multiplying by 100 (Figure 1). Across all four students, participants had a mean percentage of participation of 67.96% during baseline. During the intervention phase, participants demonstrated a mean percentage of participation of 99.01%. In order to calculate the effect of the difference between baseline and intervention, the Points Exceeding the Mean (PEM) was used to determine the effect size across all participants. The PEM for all participants from baseline to intervention ranged from .86 to 1 for participation, which indicated the intervention had a moderate to high degree of effect on the variable of participation (Ma, 2006).
Participation.
John
John’s participation during baseline was inconsistent, ranging from 0% to 100%. He did not exhibit stability in his participation prior to his randomly assigned entry into the intervention phase. During baseline, John had mean participation of 74.17%, ranging from 0% to 100%. The variability in participation stabilized with the introduction of SRT. Therefore, the range of participation from 75% to 100% was much smaller during the intervention phase. During the intervention, John averaged 97.38% participation. Based on visual analysis, John’s participation had a more consistent trend when using SRT than during the baseline phase. From baseline to intervention, John had a PEM of .86, suggesting that SRT had a moderate effect on participation.
Zach
Zach’s participation during the baseline phase was also inconsistent, but his participation demonstrated an overall decreasing trend during this initial phase. During baseline, Zach had a mean of 69.52% participation, ranging from 20% to 100%. When he moved into the intervention phase, Zach demonstrated an immediate effect for higher and far more consistent participation. During the intervention, Zach’s participation was consistent with a mean of 100%, and all sessions yielding 100% participation. Visual analysis supported a functional relationship between SRT and participation, based on the increased stability in Zach’s data. The PEM was 1.0, indicating that SRT had a high degree of effect on Zach’s participation.
Patrick
Patrick’s baseline data for participation indicated a lot of variability. While there was an increasing trend toward the end of the baseline, the overall analysis was variable. During baseline, Patrick had a mean of 70.63% participation, ranging from 33.33% to 100%. When Patrick entered intervention on his randomly-assigned day, his participation became more consistent and trended higher than most baseline data points. His mean participation in the intervention phase was 99.17%. Patrick had 100% participation in 91.67% of intervention sessions. The increased stability with his entrance into the intervention phase implied a functional relationship between SRT and participation. The PEM for Patrick was 1.0, indicating the SRT had a high degree of effect on participation.
Matthew
Similar to the other participants, Matthew demonstrated a great deal of variability in participation data during the baseline phase, before he was randomly assigned to enter intervention. This variability demonstrated an unstable trend in the baseline data. During baseline, Matthew had a mean of 61.62% participation, ranging from 25% to 100%. He had 100% participation in 10% of the baseline sessions. Upon entering the intervention phase, Matthew’s variability decreased to create a stable and high trend for participation. This immediacy of effect and stability suggested a functional relationship between the introduction of SRT and increased participation. During the intervention, his mean participation was 100% with all sessions yielding 100% Matthew’s PEM for participation data was 1.0, suggesting that the effect of SRT on participation was high.
On Task Behavior
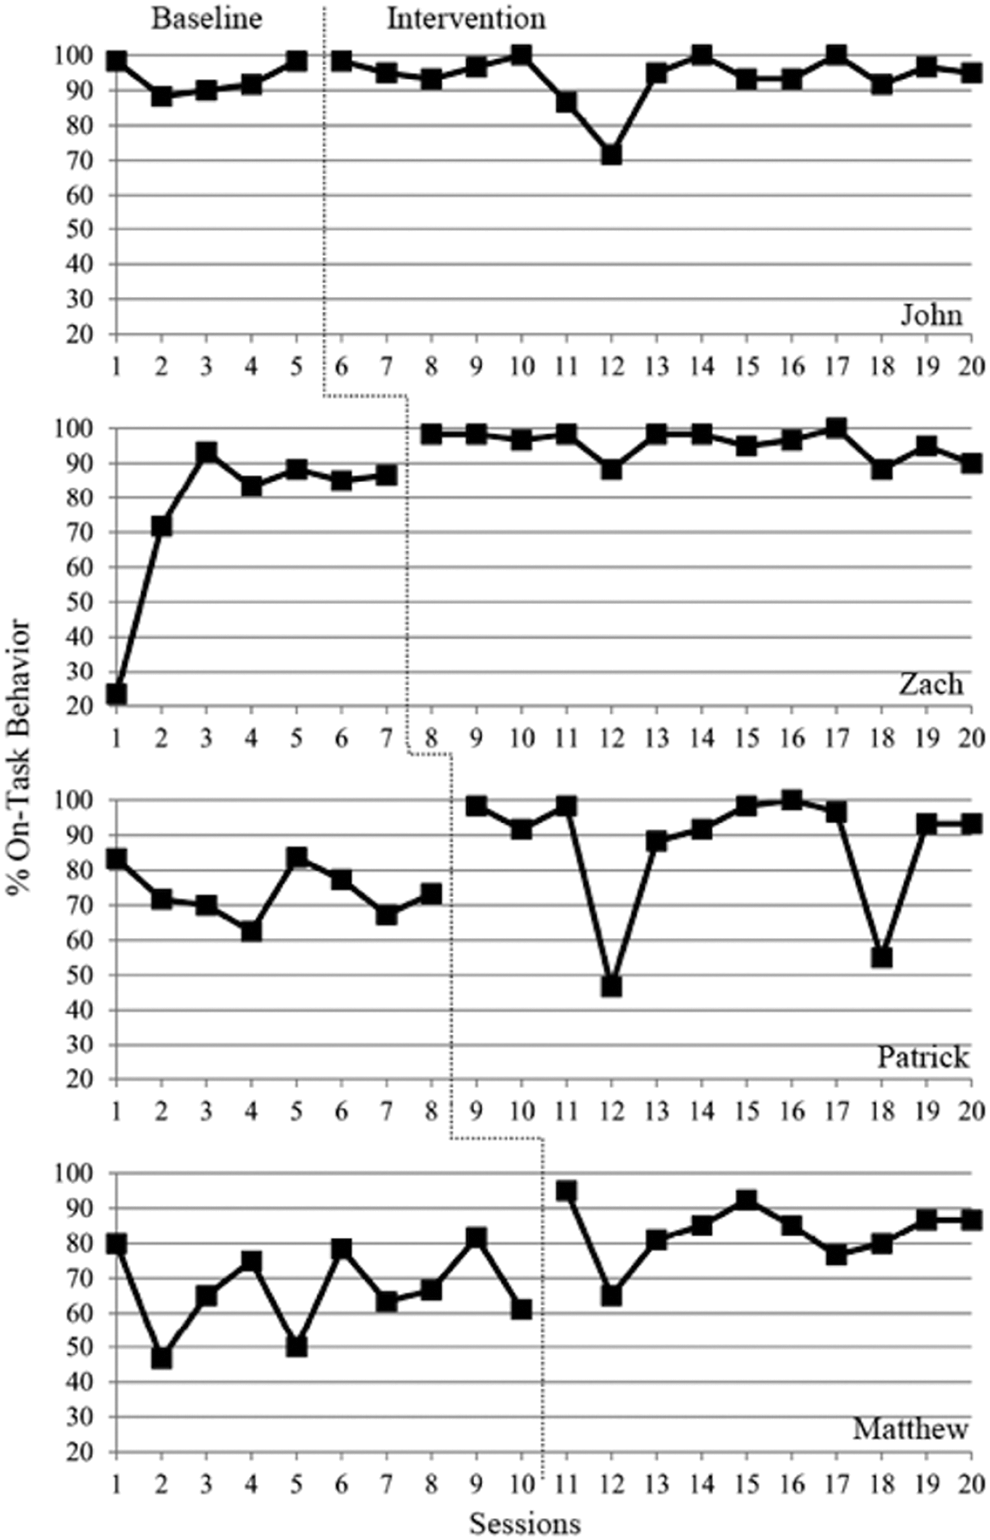
The percentage of intervals with on-task behavior was determined by dividing the number of intervals on-task by the total number of intervals observed in the session and multiplying by 100 (Figure 2). The percentage of on-task behavior exhibited across participants during the baseline phase was 75.17%. During the intervention, the percentage of on-task behavior across participants was 90.66%. The PEM from baseline to intervention was .92, with 46 of the 50 intervention data points above the baseline median. The PEM indicates the SRT intervention had a high degree of effect for on-task behavior.
On-task behavior.
John
John’s on-task behavior during baseline was high and stable. During baseline, John had an overall average percentage of 93.33% on-task intervals. The range of on-task behavior during baseline was 88.33% to 98.33%. John’s on-task behavior during the intervention phase was also high but had more variability; therefore a functional relationship was not indicated by visual analysis. His average on-task behavior during intervention was 93.78%, ranging from 71.67% to 100% of intervals measured. The PEM of .7 indicates that SRT had a moderate degree of effect on John’s on-task behavior.
Zach
During the baseline phase, Zach’s on-task behavior started low and had an initial increase. It leveled out to create a stable trend between 80% and 90% of intervals measured being on-task. Zach had an average of 75.95% on-task intervals during baseline. With a range from 23.33% to 93.33%. Upon introduction of the intervention, his percentage of on-task behavior increased, demonstrating immediacy of effect. His intervention data demonstrated a high, stable trend with minor variability at the end of the study. His average on-task behavior during the intervention phase was 95.51%, with a range from 88.33% to 100%. The PEM of 1.0 for Zach’s on-task behavior indicates that SRT had a high effect.
Patrick
While there was some variability in Patrick’s baseline on-task behavior data, the trend was stable at around 70% of intervals measured. Patrick’s average percentage of on-task behavior was 73.64% during baseline, ranging from 62.50% to 83.64%. When SRT was introduced, Patrick had an immediate increase in on-task behavior. While there continued to be some variability in his on-task behavior data, Patrick demonstrated a higher trend during intervention than during baseline, suggesting a functional relationship between SRT and on-task behavior. His average intervals of on-task behavior was 87.64% during the intervention, ranging from 46.67% to 100%. Patrick’s data results in a PEM of .8, which suggests SRT had a moderate effect on his on-task behavior.
Matthew
During baseline, Matthew demonstrated variability in on-task behavior data. The data indicated an increasing trend prior to his randomly assigned entry into intervention. During baseline, Matthew had an average of 66.78% for on-task behavior, ranging from 46.67% to 81.67% of intervals measured. Matthew’s on-task behavior data continued to present an increasing trend through intervention, and his data trended higher than in baseline. This suggested a functional relationship between SRT and on-task behavior. His percentage of on-task behavior during intervention had an average of 83.34%, with a range from 65% to 92.31% of intervals measured. Matthew’s PEM of .9 suggests that SRT had a high effect in increasing his on-task behavior.
Statistical Analysis
Mann-Whitney U
In addition to visual analysis of the data, the Mann-Whitney U test of independent means was employed to determine significance between ranked group data from the baseline and intervention phases (Dugard & Todman, 2001). For this study, a one-tailed test was used with a Bonferroni adjustment, so Type I error rate was controlled at the .025 level. For statistical analysis, each dependent variable was run independently of the other. For each dependent variable, mean ranked data was reported to show where the baseline and intervention means ranked when compared to the data as one group. For each dependent variable, statistical data was displayed in a table, including U-values, Z-scores, and significance level.
Participation
The Mann-Whitney U ranks indicate a mean rank of 23.58 for baseline and 50.65 for intervention. The U-test indicated that participation was significantly greater (Z = −5.192, p < .025) for intervention than for baseline. U-test results for significance are shown in Table 1.
Mann–Whitney U Results.

On-task behavior
The mean rank for baseline on-task behavior was 24.15, and the mean rank during intervention was 50.13. The U-test indicated that on-task behavior was significantly greater (Z = −4.886, p < .025) for intervention than for baseline. U-test results for significance are shown in Table 1.
Summary
Results were presented by the two dependent variables examined. The analysis suggested that SRT had a high degree of effect on Participation (PEM = 1.0), and data showed an increase in means from baseline to intervention across participants. Statistical analysis suggests that the increase in participation was significant. The mean on-task behavior across participants increased from baseline to intervention. With a PEM of .92, data suggests that SRT had a high degree of effect on increasing participants’ on-task behavior. Results of the Mann-Whitney U indicate that the increase in on-task behavior across participants was significant.
Discussion
The purpose of this study was to determine whether integrating student response technology (SRT) in the elementary classroom increases engagement for students with disabilities, as measured by participation in the learning activities and students’ time on task. The results of the study showed the SRT had a significant, positive effect on participation for all four students. Visual analysis showed increased consistency in data trends from baseline to intervention for three participants and immediacy of effect for the fourth participant. Therefore, visual analysis indicates decreased variability in data during intervention, which suggests a functional relationship between the implementation of SRT and participation (Kratochwill et al., 2010). Mean participation across participants rose from baseline to intervention. For each student, the range of participation during baseline was inconsistent; however, during the intervention, 94% of the time students demonstrated 100% participation. Both visual analysis of each participant’s degree of participation and the PEM calculations support the assertion that the increase in participation was significant. Additional statistical analysis using the Mann-Whitney U test added confidence to this finding but should be viewed with caution due to the possibility of Type II error. These findings further validate the previous findings of Blood (2010).
Increased participation gives teachers the opportunity to formatively assess student understanding from more than one student throughout a lesson. Traditionally, only one student answers a question asked orally in the classroom. In this case, teachers collected responses from the whole class at once. Collecting response data from the whole class may take longer, but the data was valuable in day-to-day teaching as a means of formative classroom assessment.
Additionally, students with disabilities may be more likely to participate with the knowledge that their answers can be acknowledged via technology. Students with disabilities may also be more likely to participate since their risk yields definite feedback.
Students with disabilities may more readily afford themselves the risk of participating through SRT, with the understanding that their answers will be displayed anonymously as part of a percentage. In this study, students with disabilities had a relatively high rate of participation during the baseline phase. Nevertheless, all four students had an increase in participation when SRT was implemented. Repeating this study on a sample of students with lower levels of initial participation has the potential to produce more significant results, as there was the potential for a larger discrepancy from baseline to intervention. In addition, there was an assumed motivation that goes along with implementing technology in the classroom. Thus, it would be valuable to replicate the study using a different mode of SRT to determine whether the effect would be the same.
During the study, on-task behavior data varied across students. Visual analysis of John’s data did not suggest a functional relationship between SRT and on-task behavior. His data demonstrated a high, stable trend during baseline, so it cannot be concluded that SRT had a high effect on the continued high level of on-task behavior during intervention. However, data trends from the other three participants did support a functional relationship. Trends across the other three participants demonstrated immediacy of effect of the intervention and higher, more consistent rates of on-task behavior (O’Neill et al., 2011). The percentage of on-task behavior increased from 75.17% during baseline to 90.67% during intervention across students. The PEM of .92 suggested that the intervention of SRT had a high degree of effectiveness in increasing students’ on-task behavior. The increase in on-task behavior represents increased engagement in the target learning activities. Further research is warranted to determine the effect of SRT on students with lower levels of on-task behavior during the baseline phase. Both visual analysis of each participant’s percentage of on-task behavior and the PEM calculations support the assertion that the increase in on-task behavior was significant. Additional statistical analysis using the Mann-Whitney U test affirms this finding but should be viewed with caution due to the likelihood of Type II error. However, visual analysis does not support a high degree of effect for on-task behavior, given the lack of change for John’s on-task behavior and the variability among other participants. Therefore, there are mixed findings on the effect of SRT on on-task behavior. Given the success of increasing on-task behavior with SRT in previous studies (Xin & Johnson, 2015), further research is necessary to determine the level of effect SRT has on on-task behavior.
Limitations
Due to the nature of this study, there were several limitations that must be considered. Based on the multiple baseline methodology, results from this study cannot be generalized to a larger population because of the small sample size. However, results may be transferred to situations in which variables and participants are similar to those outlined in this study. Additionally, statistical analysis was used in the study to add strength to the visual analysis of data. Randomization was introduced to determine the order in which students would enter the intervention phase to allow for this statistical analysis. This resulted in participants entering the intervention phase before they demonstrated a stable baseline. It is also important to note that there is a high likelihood of Type II error in the statistical analysis, given the small sample size. The data for this study were taken during a relatively short time period. While data collection spread through three calendar months, only 20 sessions of class time were taken for each participant, including the baseline and intervention phases.
During this study, the participants were all in social studies or science content classes in their respective grade levels. During the baseline phase, the content changed for all four students. If a student began a study in social studies, he completed the study in science and vice versa. In addition, two students changed teachers when they changed subject areas. The change in content and/or teacher could have had an effect on the data collected.
Prior to the study, the researcher trained the participating teachers in the procedures for the study to provide fidelity. However, there was no follow-up during the phases of the study to ensure the teachers were abiding by the outlined procedures. Fidelity was only monitored in reviewing the recordings. In future studies, researchers should conduct periodic live observations to provide an ongoing fidelity measure throughout. While teachers were assessed on the social validity of the intervention, students were not formally assessed on their acceptability of using this system. Previous studies suggest that there is a high level of social validity from students’ perspectives (Abode, 2010; Bryant et al., 2015; Duchaine et al., 2018). Therefore, additional data was not collected.
Finally, each student was in a different classroom. Variability of classroom expectations and instruction could have had an impact on the results of the study. Across classrooms, there was variability in class size, content, and teacher. The number of questions used during each session also varied. While consistent methods for implementing the intervention were used to minimize the effects of outside factors, these classroom variables could have impacted the study.
Future Directions
Overall, further research in similar settings is needed to begin to generalize the findings of the effects of SRT on students’ participation, and on-task behavior in elementary classrooms for students with disabilities and learning support needs. This study provides strong evidence that implementing SRT in classrooms for students with disabilities is a reasonable intervention for increasing academic engagement.
In this study, efforts were taken to minimize external factors relating to the dependent variables. One factor that was not controlled in this study was the nature of the questions. Teachers were permitted to ask any content-related question, as long as it was in a multiple-choice format on the SMART Board®. In future studies, researchers could investigate the impact of SRT on various levels of questioning, from basic recall to higher-order-thinking questions. Future studies could also consider the impact of SRT on the accuracy of student responses at these various levels of questioning. In future studies, researchers could also track common behaviors within a classroom to create a more individualized operational definition of participation and on-task behavior.
While teachers were a part of this study, the researcher did not collect data on the effects of SRT on the teachers. Further investigation could include the effects of SRT on teacher instruction and assessment. The social validity results presented in this study support the use of SRT as an intervention. More specific information may impact the way teachers use SRT.
Conclusion
Student engagement is related to students’ participation and performance in the classroom (Dix, 2013; Finn, 1989; Fredricks et al., 2004). SRT has shown promise in increasing student engagement (Abode, 2010; Bryant et al., 2015; Dix, 2013; Duchaine et al., 2018; Xin & Johnson, 2015). While students with disabilities tend to have low levels of academic engagement (Seo, 2006; Sridhar & Vaughn, 2001; Tabassam & Grainger, 2002), there is a gap in the research on how SRT affects elementary-aged students with disabilities. This study sought to fill that gap. The purpose of the study was to determine if SRT had an effect on the engagement of elementary-aged students with disabilities as measured by participation and on-task behavior.
The students with disabilities included in this study demonstrated an increase in both participation and on-task behavior. The implementation of SRT as an intervention for academic engagement had a moderate degree of effect overall on both participation and on-task behavior in this study. In conclusion, the results of this study support the implementation of SRT to increase academic engagement for students with disabilities in the elementary classroom.
Footnotes
Authors’ Note
As per Todman and Dugard, we added in the random assignment so we could use the statistical test where randomization is a key part of the study. While this is not common in the research over time, it has become more acceptable over the last 20 years. The Mann-Whitney U test, used when there are two independent samples of ranks (Heiman, 2011), provided an analysis of the differences in the means of the ranked baseline and intervention data for each dependent variable independently. Each dependent variable was run independently of the other, so there are not two dependent variables in the statistical analysis. The two groups are the baseline data and the intervention data in each case. We added a Bonferroni adjustment to address the issue of Type 1 error.
Declaration of Conflicting Interests
The author(s) declared no potential conflicts of interest with respect to the research, authorship, and/or publication of this article.
Funding
The author(s) received no financial support for the research, authorship, and/or publication of this article.
