
Abstract
There is a need to standardize methods for assessing fidelity and adaptation. Such standardization would allow program implementation to be examined in a manner that will be useful for understanding the moderating role of fidelity in dissemination research. This article describes a method for collecting data about fidelity of implementation for school-based prevention programs, including measures of adherence, quality of delivery, dosage, participant engagement, and adaptation. We report about the reliability of these methods when applied by four observers who coded video recordings of teachers delivering All Stars, a middle school drug prevention program. Interrater agreement for scaled items was assessed for an instrument designed to evaluate program fidelity. Results indicated sound interrater reliability for items assessing adherence, dosage, quality of teaching, teacher understanding of concepts, and program adaptations. The interrater reliability for items assessing potential program effectiveness, classroom management, achievement of activity objectives, and adaptation valences was improved by dichotomizing the response options for these items. The item that assessed student engagement demonstrated only modest interrater reliability and was not improved through dichotomization. Several coder pairs were discordant on items that overall demonstrated good interrater reliability. Proposed modifications to the coding manual and protocol are discussed.
There is evidence that fidelity moderates program outcomes. With the widespread dissemination of evidence-based prevention programs, a major challenge is to assess the fidelity with which interventions are delivered. In studies published to date, comparable methods have not been systematically applied. Fidelity is a multidimensional construct. Knowing which features of fidelity moderate intervention effectiveness is important to understanding how programs achieve or fail to achieve their goals. A key issue, therefore, is access to tools for assessing fidelity that can be readily and reliably applied. It will be helpful to advance our understanding of program effectiveness under conditions of dissemination to have methods that can be applied in similar ways across multiple interventions. Because nearly all assessments require observed events to fit into a conceptual structure, subjective judgments are an essential component of fidelity measurement. As such, reliability is a key issue that must be resolved before meaningful research on fidelity can be completed.
Measurement by itself cannot improve fidelity; however, without standardized and reliable measures, strategies for improving fidelity will not be developed and cannot be tested. The goal of this article is to report about the reliability of one possible set of measures that may ultimately be applied systematically to curriculum-based prevention efforts.
Evidence of the Moderating Effect of Fidelity
The impact of programs is expected to diminish when fidelity is poor (Dusenbury, Brannigan, Falco, & Hansen, 2003; Pentz et al., 1990; Spoth, Guyll, Trudeau, & Goldberg-Lillehoj, 2002). In contrast, high fidelity has been associated with improved outcomes in terms of substance use (Aber, Brown, & Jones, 2003; Burke, Oats, Ringle, Fichtner, & DelGaudio, 2011; Durlak & DuPre, 2008; Kalafat, Illback, & Sanders, 2007; Abbott et al., 1998). In a recent review of fidelity studies, prevention program outcomes were more positive when programs were carefully implemented and free from serious implementation problems (Durlak & DuPre, 2008).
Studies that have assessed fidelity for disseminated programs find that high-quality implementation is seldom achieved in practice. Even within the context of rigorous field trials, research suggests that teachers leave out program content (Durlak & DuPre, 2008; Melde, Esbensen, & Tusinski, 2006; Pentz et al., 1990; Resnicow, Cross, & Wynder, 1993; Rohrbach, Graham, & Hansen, 1993). For example, Ringwalt and his colleagues (2002) found that only 15% of experienced teachers reported following their curriculum guides “very closely.” In this nationwide study, teachers frequently reported adapting the curriculum to meet the needs of minority students, with the language and the context of examples being the primary changes noted. Adherence improved if teachers believed they had some discretion in which prevention lessons to cover, held a belief that the program they were delivering was effective, felt adequately trained, and the school principal supported substance use prevention. In a follow-up study several years later, Hanley and colleagues (2009) found that 35% of prevention teachers using an evidence-based program reported using their curriculum guides “very closely” and about one third reported delivering all program lessons.
In a study of Life Skills Training, implemented under dissemination conditions, Dusenbury, Brannigan, Hansen, Walsh, and Falco (2005) found that adherence varied markedly and that all teachers adapted the program by adding, changing, or omitting prescribed elements. Furthermore, fewer than half of observed adaptations were expected to increase the effectiveness of the program. Instead, most were expected to reduce program effectiveness. Similarly, an evaluation of the Protecting You/Protecting Me program found that teachers adapted more than three quarters of the lessons by either adding or omitting program material (Pankratz et al., 2006).
Dariotis and colleagues (2008) found in their study comparing school-based, community, and family prevention programs that school-based programs demonstrated the least adherence and were characterized by a greater perception of barriers to implementation. The tendency of teachers to adhere less to prevention programs may be due to several factors, including multiple demanding goals (i.e., standardized test scores) and time constraints.
Collectively, these studies suggest that many teachers leave out program content and/or adapt program content to fit their needs. However, none of the above studies used the same metrics for assessing fidelity. The dissemination environment, in contrast to the research environment under which programs are initially tested for efficacy, is likely to lead to marked variations in program implementation. Documenting how programs are implemented will be an important component of understanding how programs fare when disseminated. Without systematic assessments of fidelity, the moderating role that fidelity plays in achieving intended outcomes will remain unseen.
Components of Fidelity
Among the basic concepts important to understanding program fidelity are (1) adherence—the degree to which facilitators follow program methods, complete delivery as outlined in the curriculum, and deliver the program in a manner that achieves activity objectives and session goals, (2) quality of delivery—the degree to which the intervention is delivered in a manner likely to have an impact on goals and objectives, (3) dosage—providing sufficient exposure to the program, often thought of as either the number of sessions delivered or the number of targeted participants reached, and (4) participant engagement or interactivity—the degree to which participants are appropriately involved in intervention tasks (Dane & Schneider, 1998; Dusenbury et al., 2003). In addition to these concepts, Durlak and DuPre (2008) suggest including (5) adaptation—the degree to which a program’s methods and content are modified, such as attempts to make the intervention developmentally and culturally relevant.
Adherence
Adherence has been broadly defined as the degree to which the person providing the intervention uses the prescribed procedures and avoids procedures that are restricted, banned, or forbidden (Schoenwald et al., 2011). Program adherence is typically documented by observers as either (1) the percentage of points and objectives covered in a program (Botvin, Baker, Dusenbury, Tortu, & Botvin, 1990; Dusenbury et al., 2005), (2) coverage of key program concepts (Spoth, Redmond, & Shin, 1998), or (3) the extent to which the teacher followed the protocol outlined in the program (Botvin et al., 1990; Rohrbach, Dent, Skara, Sun, & Sussman, 2007; Sobol, Rohrbach, Dent, & Gleason, 1989). Adherence has also been documented as (4) percentage of program activities completed (Dusenbury et al., 2005).
Quality of Delivery
The types of measures researchers use to assess quality of delivery have included (1) assessing the general quality of teaching practices (Abbott et al., 1998; Hansen, 1996; Harachi, Abbott, Catalano, Haggerty, & Fleming, 1999; Pentz et al., 1990), (2) assessing teachers’ understanding of concepts, as evidenced by interpreting the program as intended (Abbott et al., 1998), (3) completing ratings of teacher effectiveness and enthusiasm (Botvin, Dusenbury, Baker, James-Ortiz, & Kerner, 1989; Hansen, Graham, Wolkenstein & Rohrbach, 1991), and (4) assessing of the quality of the teaching strategy used (Giles et al., 2008; Harachi et al., 1999).
Dosage
Dosage refers to the amount of intervention received by participants and has been conceptualized in several ways. Strategies include (1) assessing the total number of subject areas taught in a program (Basen-Engquist et al., 1994), (2) counting the number of students who participated in a program (Dent et al., 1998), (3) estimating the amount of time spent completing the program (Pentz et al., 1990), (4) counting the number of sessions implemented (Dane & Schneider, 1998; Rohrbach et al., 1993), and (5) assessing the completeness of program delivery (Tappe, Galer-Unti, & Bailey, 1995).
Engagement
Interventions typically require involvement or a response from participants. Engagement is conceptualized as the degree to which facilitators actively engage the target audience in the program, with the implication of mental and affective involvement (Dane & Schneider, 1998). Ratings of the instructor’s performance in being able to involve participants in discussion have been used to assess engagement (Sobol et al., 1989). Tobler and Stratton (1997) conducted a meta-analysis and found that providing opportunities for engagement was an essential component to the design of effective programs. Giles and colleagues (2008) conducted a study to develop and validate an observation measure designed to capture teachers’ use of interactive teaching skills while delivering All Stars. They developed a measure of engagement that measured teachers’ propensity to praise and encourage youth, accept and use ideas of students, ask questions, give personal self-disclosures, and manage their classroom. Student-centered methods, such as accepting student ideas and asking probing questions, were positively related to student idealism and normative beliefs, and marginally predicted decreases in student marijuana use.
Adaptation
Of all the concepts related to fidelity, adaptation is the least studied. An adaptation is a clear and obvious deviation from what is called for in a program manual. Adaptations can also occur when teachers modify the program methods or content to meet local needs, including developmental or cultural relevance, in accordance with the theory that guides the program (Dusenbury et al., 2003). Program adaptation has been found to be inevitable in real-world implementation settings (Hill, Marcione, & Hood, 2007; Ozer, Wanis, & Bazell, 2011; Ringwalt et al., 2002). For example, Ringwalt and his colleagues (2002) reported that teachers frequently justify adapting the curriculum to meet the needs of minority students. Thus, a teacher may change characters’ names, the setting, or the context of a role play to be more culturally relevant to the population with whom they are working.
Some studies have found that adaptations hinder program outcomes, while other studies have found that adaptations improve outcomes. Kumpfer, Alvarado, Smith, and Bellamy (2002) found cultural adaptations improved program retention, but reduced positive program outcomes. On the other hand, a study on a school-based cardiovascular health intervention found that having a higher percentage of classroom sessions modified by the teacher was associated with improved student outcomes (McGraw et al., 1996). In recent research (Hansen et al., 2013), the addition of uncalled for normative messages, changing instructions given for completing tasks, the introduction of new concepts, and changes in activity structure were all associated with reduced effectiveness, In contrast, added motivational messages, steps, and questions were associated with improved student outcomes. However, in this study, teachers who made few adaptations that were judged to be positive had improved outcomes over teachers who made either a lot of adaptations or who made adaptations that were judged to be negative. These inconsistent findings underscore the importance of documenting program adaptations and understanding the context under which they take place.
Sources of Data
Fidelity can be assessed using both direct (i.e., observational) and indirect methods (Schoenwald et al., 2011). In research studies, there is a preference for data collected by observers as opposed to data collected from teacher self-reports (e.g., Domitrovich & Greenberg, 2000). Of the 14 studies reviewed by Dusenbury and her colleagues (2003), nine used observers to assess quality of delivery, six collected data using teacher self-report, one study used both sources, and two studies used student reports. The preference for using observers for coding fidelity is supported by a study that compared teachers’ and observers’ ratings about the degree to which 12 content areas were covered in teaching drug education (Hansen & McNeal, 1999). When describing the content of programming delivered to students, observers were found to have high interrater reliability (average κ = .87). This exceeded the agreement between observers and teachers (average κ = .23). Generally, teachers overestimated the number of content areas their teaching addressed.
Differences in teacher and observer reports of fidelity are likely to be due to the circumstances under which forms are completed and knowledge of fidelity-related concepts. For example, observers provide fidelity ratings as they are watching the teacher, either live or via video recordings, while teachers must complete forms after they teach a program, sometimes waiting days or even months to complete them. Observers typically undergo training to complete fidelity ratings, whereas teachers are usually asked to specify what they did, often with only a cursory understanding of how they should assess their fidelity of program delivery. There is also the issue of social desirability bias, such that teachers may be more positive in their ratings (Donaldson & Grant-Vallone, 2002).
Generally, observer-based assessment systems provide consistently high-quality data. For example, a study employing observers demonstrated high interrater reliability for a measure that assessed how often teachers employed a classroom management strategy, praised students, accepted students’ ideas, incorporated students’ ideas into the lesson, asked original questions, repeated questions, and asked probing questions of students (Giles et al., 2008). In this study, average Pearson product–moment correlations of 0.88 and intraclass correlations of 0.90 on the validation sample of observations were observed.
A study of implementation fidelity of the Protecting You/Protecting Me program, an alcohol use prevention program for elementary school-age youth, assessed adherence and adaptation (Pankratz et al., 2006). Adherence was measured by determining whether or not a program section was completed. Content adaptation was assessed by determining how much program material was presented out of order, how much information was omitted or added, whether a teacher mentioned effects of drugs other than alcohol, and whether or not teachers used language other than what was specified in the curriculum to address a key concept. Adaptation to teaching methods was assessed by determining if teachers used methods other than interactive techniques. Paired observers had high interrater reliability for rating adherence (average κ = .92), adaptation to content (average κ = .82), and adaptation to teaching methods (average κ = .88). All three of these studies’ findings were based on ratings applied to video recordings as an alternative strategy to self-report and live observation.
A method for assessing adherence, exposure, participant responsiveness, and quality of program delivery was developed for the Blueprint Drug Prevention Program (United Kingdom). This method was applied during live observations. It was found to have good interrater reliability among live observers, ranging from 0.71 to 0.91 (Stead, Stradling, MacNeil, MacKintosh, & Minty, 2007), although details for each component of fidelity were not reported.
Fidelity Measurement Systems
The numerous studies that have demonstrated good interrater reliability of fidelity instruments used for specific curriculum-based programs, suggest that it is possible to develop a standardized method for measuring program fidelity that can be applied to all session-based prevention programs designed for implementation in school settings. Research (e.g., Dariotis, Bumbarger, Duncan, & Greenberg, 2008; Fagan, Hanson, Hawkins, & Arthur, 2008) further suggests that a common approach can be used to assess the fidelity of multiple interventions. For example, the instrument developed by Dariotis and her colleagues (2008) assesses adherence, including implementer characteristics, implementing organization characteristics, program characteristics, program recipient characteristics, and school/community context. The relationship between these key implementation factors and program adherence was assessed across multiple programs (school, community, and family programs). To date, the interrater reliability of this measure has not been reported.
Fagan and her colleagues (Fagan et al., 2008) similarly created an implementation monitoring system for the Communities That Care model designed to promote high levels of program fidelity. This instrument was designed to be used across multiple prevention programs and measured four constructs of fidelity: (1) adherence to a program’s content and components, (2) dosage (number, length, and frequency of sessions), (3) quality of delivery, and (4) participant responsiveness. Trained in situ observers completed the same session-specific program fidelity instruments as program implementers and reliability was assessed by calculating the percentage agreement between observers and implementers. Percentage agreement between observers and program implementers for program adherence was high (88%) across 13 prevention programs. On the other hand, agreement has not yet been reported between observers and implementers for program adaptations, dosage, quality of delivery, and participant engagement.
A Broadly Applicable Model of Program Fidelity Assessment
Based on this literature and interviews with program developers, policy makers, practitioners, and prevention researchers, our goal has been to develop an instrument that documents adherence, quality of delivery, dosage, participant engagement, and adaptation. The model is intended to be broadly applicable to curriculum-based drug and violence prevention programs listed on the National Registry of Evidence-based Programs and Practices (NREPP; http://www.nrepp.samhsa.gov/). State funding agencies often require local providers to use programs on the NREPP list. To qualify as a standardized approach, a coding manual, data collection forms, and training procedures need to be developed.
Following the typical format of curriculum-based interventions, coding is organized by program session, with each session having its own form, customized to allow the various components of the session to be appropriately assessed. For example, activities, main points, and objectives are typically unique to each session of a program. Items that assess dosage (at the session level, assessed by the number of students present), student engagement, general teaching quality, teacher understanding of concepts, classroom management, the potential of the program to achieve intended outcomes, and the nature of adaptations are standard measures that can be used to assess the implementation of all session-based prevention programs.
The goals of this article are 2-fold. First, we describe a standardized method for collecting fidelity of implementation for session-based programs, which includes adherence, quality of delivery, dosage, participant engagement, and adaptation. Second, we report about reliability of these methods when applied by observers who coded video recordings of the All Stars prevention program.
Method
Sample
We selected nine teachers from a prior study that examined changes to the fidelity with which teachers implemented All Stars over a 3-year time period (Ringwalt et al., 2009). Teachers in the sample were public and parochial middle school teachers in Chicago, Illinois. Teachers were selected who had taught All Stars for three consecutive years and whose classroom results spanned the spectrum of mediating variable outcomes observed. Three teachers had consistently positive mediating variable outcomes, three had consistently poor outcomes, and three had outcomes in the middle. Three teachers were African American, four were White, one was of mixed ethnicity, and one was Asian/Pacific Islander. Seven teachers were female and two were male. Six instructors were classroom teachers and three were counselors. Instructors averaged 9.7 years of experience in the education field, ranging from 2 to 25 years of experience. Three had 5 or fewer years of experience in education, three had 6–10 years of experience, and three had more than 10 years of experience. Seven teachers had graduate degrees and two held bachelor’s degrees. Teachers received the standard 2-day training for the All Stars program and throughout the study had access to web-based support and, upon request, technical assistance from a master trainer.
All Stars
All Stars is an evidence-based prevention program designed for delivery in sixth and seventh grades. The program is designed to prevent or reduce adolescent substance use, early sexual behavior, and violence through changing mediating variables (Hansen, 1996; Harrington, Giles, Hoyle, Feeney, & Youngbluth, 2001). All Stars targets five mediators: (1) normative beliefs—correcting erroneous youth norms about the acceptability and prevalence of substance use among their peers, (2) lifestyle incongruence—helping youth realize that substance use, violence, and premature sexual activity do not fit with their desired future, (3) commitment—building intentions to avoid substance use, violence, and premature sexual activity, (4) positive parental attentiveness—engaging parents in communicating expectations about risky behavior and promoting parental monitoring and supervision, and (5) bonding—increasing attachment to prosocial institutions (e.g., school or clubs). There are 13 required sessions in the program. The program is designed to be delivered within a 45- to 60-min class period.
Video Recording Procedure
Teachers were instructed to video record their delivery of All Stars. Recording equipment was placed in the back of the classroom. Video recorded sessions of the All Stars program were examined for three classes of students for each of the nine teachers. This yielded 27 teacher/class combinations. While teachers were instructed to video record each of the 351 sessions, several teachers did not send in video recordings resulting in 27 missing sessions. Thus, a total of 324 video recordings were available for coding instead of the originally anticipated 351.
Video Coding Procedures
Observers coded video recordings using procedures defined in a 33-page coding manual. The manual included instructions for how to download session-specific coding forms from the Internet, detailed criteria of each scoring option, and examples that coders could use as points of reference.
Adherence
Two items assessed adherence. The first assessed whether or not each activity in a session was completed (yes or no). The second assessed how much of a session has been skipped or omitted (0–5%, 5–15%, 15–25%, and 25% or more).
Quality of Delivery
Several measures assessed quality of delivery. The first was specific to each session and assessed how well student-centered objectives were achieved. This involved using a 4-point scale (1 = poorly, 2 = adequately, 3 = very well, 4 = exceptionally) to rate each of the multiple objectives that were the focus of each session. There were also four measures of quality that were generally applied and included: (1) ratings of classroom management, (2) general quality of teaching, (3) an estimate of the teacher’s understanding of program concepts, and (4) overall potential for the session to be effective at changing targeted mediators and behaviors. All four of these measures were rated on a 1–5 scale with 1 reflecting poor quality and 5 reflecting high quality.
Dosage
The measure of dosage used for the current study asked the coder to estimate the number of students in attendance during a session. Coders were instructed to use whatever clues they could to make the best estimate if they watched a video that limited their view of the entire class. The number of students in attendance was rated (1–5, 6–10, 11–15, 16–20, 21–25, 26–30, 31–40, 41–50, 51–100, or 100+). Observers were limited to the number of video recordings that were available. Because a missing video available did not necessarily mean that a session had been skipped (e.g., there could have been technical difficulties in production), no inference about the number of sessions taught was made.
Student Engagement
Engagement was judged on a 1–5 scale, with 1 reflecting poor engagement and 5 reflecting high engagement. Coders were asked to consider how personally involved the majority of participants were in the program when rating student engagement. For example, coders were instructed to assess how directly students participated in session activities, as well as the proportion of students involved in activities. The coding manual provided examples of negative and positive engagement for coders to reference when assessing engagement. An example of positive engagement was when students volunteered constructive comments and freely offered answers to questions. An example of negative engagement was when teachers had to “pry” responses out of students or when it took a long time for students to come to attention or follow instructions.
Adaptations
Adaptations were definable deviations from what was called for in the curriculum guide. Our approach to coding adaptations was to segregate adaptations into two broad categories—changes in methods and changes in the message. Categorization of adaptations had evolved from unpublished pilot research. Method adaptations involved the teacher doing something that differed from the procedures called for in the program. When teachers changed the methods called for, they typically either replaced one method with another or added something new that was not originally called for in the program. Five categories of method adaptations included (1) changed activity structure, (2) changed instructions, (3) added steps to an activity, (4) added or changed questions asked of students, and (5) added examples or stories. Message adaptations focused on changes in content. Four categories for message adaptations were identified: (1) uncalled for messages about norms or attitudes, (2) added messages that underscored the importance of what was taught or that have the potential to motivate students, (3) new messages that promoted skill development, and (4) the introduction of concepts not specifically intended by the program. Each individual adaptation was coded as either a method or message adaptation. If we observed an adaptation that included both a method and a message adaptation, each was noted as a separate adaptation.
Coders provided narrative descriptions of adaptations. They also assigned a valence to each adaptation, which reflected the degree to which an adaptation was judged to affect the outcome of the program for better or for worse. A change that improved the potential for the program to achieve its goals was rated as +1 or +2, depending on how much impact it was expected to have. Changes that were detrimental to the program were rated as –1 or –2. Changes that were not likely to have any impact, or may have had an unclear impact, were rated as 0. Overall valence scores (–2, –1, 0, +1, +2, or not applicable) were coded separately for both method and message adaptations.
Coder Training and Assignment
Four coders (denoted A, B, C, and D) received training on how to code video recordings. Each coder was provided with the coding manual. For introductory training, six video recordings from Session 8, which had previously been coded by two PhD coders, were used. Once training on these was completed, three video recordings were selected for each of the remaining 12 All Stars sessions. Each coder and three PhD researchers coded these 45 videos. To complete training, coders independently rated each recording. The team then met to review each rating and each adaptation of every recording. Ratings for which there was a discrepancy were discussed and coding principles were reviewed until a consensus was reached about what values to assign. Discrepancies in adaptations were similarly reviewed with the video recording replayed to ensure a consensus of the narrative descriptions, categorization, and valence ratings. The discussion from these trainings resulted in a final “gold standard” set of ratings and narrative descriptions for each of these videos.
The remaining 279 sessions were each rated by a pair of coders. Each member of the pair independently coded each session and then met to review their ratings. Where discrepancies were noted, raters discussed until a consensus was reached for each rating and narrative description. Each pair’s original ratings were retained for analysis in the current study and a “gold standard” synthesis rating was produced. With four coders, this resulted in six coder pairs. We systematically ordered coders so that the coder who completed the highest number of paired ratings in a pair was always listed as the primary coder.
Statistical Analysis
Activity completion was calculated as a sum score for each program session, ranging from 1 to 7, depending on the session observed. Activity objectives were rated for each session in All Stars. We examined activity objectives across all sessions in the program. All sessions have at minimum two objectives and as many as five. Dosage (the number of students receiving the program) was recoded from a 10-point scale to a 6-point scale because coders did not use some of the scale response options. Response options for valence ratings were recoded from a 5-point scale (–2, –1, 0, +1, +2) to a 3-point scale by combining all negative ratings, keeping the 0s and combining all positive ratings (negative, neutral, or positive). This was done because coders did not use the extreme points on the scale in five of the six pairs.
We calculated the interrater agreement between coder pairs using several methods. Interrater agreement for items rated on a scale was assessed by calculating the Pearson product–moment correlations, the intraclass correlation, and McNemar–Bowker’s test. Pearson product correlation coefficients measure the degree to which coder pairs agree on ratings, while intraclass correlation coefficients take into account how closely coder pairs agree with each other. McNemar–Bowker’s tests for marginal homogeneity were calculated to determine whether coder bias was present. Marginal homogeneity refers to rater’s tendency to use each rating category in the same way. Rejection of marginal homogeneity, on the other hand, is the tendency of coders to differ in the ratings they apply within a category. A statistically significant McNemar–Bowker’s test statistic indicates that disagreement is not spread evenly and that one rater is inclined to rate differently (more positively or negatively) than another. For dichotomous items, we calculated percentage agreement, calculated Cohen’s κ, and conducted McNemar’s test. Percentage agreement was calculated using the 2 × 2 table of paired coder ratings and is the sum of the number of times coders agree on a rating divided by total number of a pair’s ratings. Cohen’s κ is used as a measure of interrater reliability for categorical or dichotomous items that takes into account agreement by chance alone. A higher κ coefficient indicates greater agreement between a pair of coders. McNemar’s test, a test of marginal homogeneity, was also calculated using the 2 × 2 table of paired coder ratings. Percentage agreement and Cohen’s κ was conducted across all sessions in All Stars for all coder pairs combined. McNemar’s test of marginal homogeneity was calculated for each of the six coder pairs to determine if any coder bias was present.
Our analyses of items rated on a scale revealed that 6 items had Pearson product correlations below 0.70, indicating low interrater agreement. Items with low correlations included achievement of activity objectives, classroom management, program effectiveness, student engagement, and the valence scores for method and message adaptations. Therefore, we recoded completion of activity objectives from a 4-point scale to a dichotomous item, where 0 indicated the objective was not achieved (a rating of 1—poorly) and 1 indicated it was achieved (ratings of 2, 3, and 4). We recoded classroom management, program effectiveness, and student engagement from a 5-point scale to dichotomous items, where response options of 1–3 were coded as 0 (not positive) and 4–5 were coded as 1 (positive). Therefore, we recoded the method and message valence scores as dichotomous items, where ratings of +1 were coded as 1 (positive adaptations) and ratings of 0 and −1 were coded as 0 (nonpositive adaptations).
Results
Interrater Agreement—Scale Items
Pearson Product–moment Correlation Coefficients
Pearson product–moment correlation coefficients were 0.70 or higher for items that measured percentage of program skipped, activity completion, dosage, quality of teaching, and teacher understanding of concepts. Table 1 outlines Pearson product–moment correlation coefficients.
Interrater Reliability for Adherence, Dosage, and Two Quality of Delivery Items.
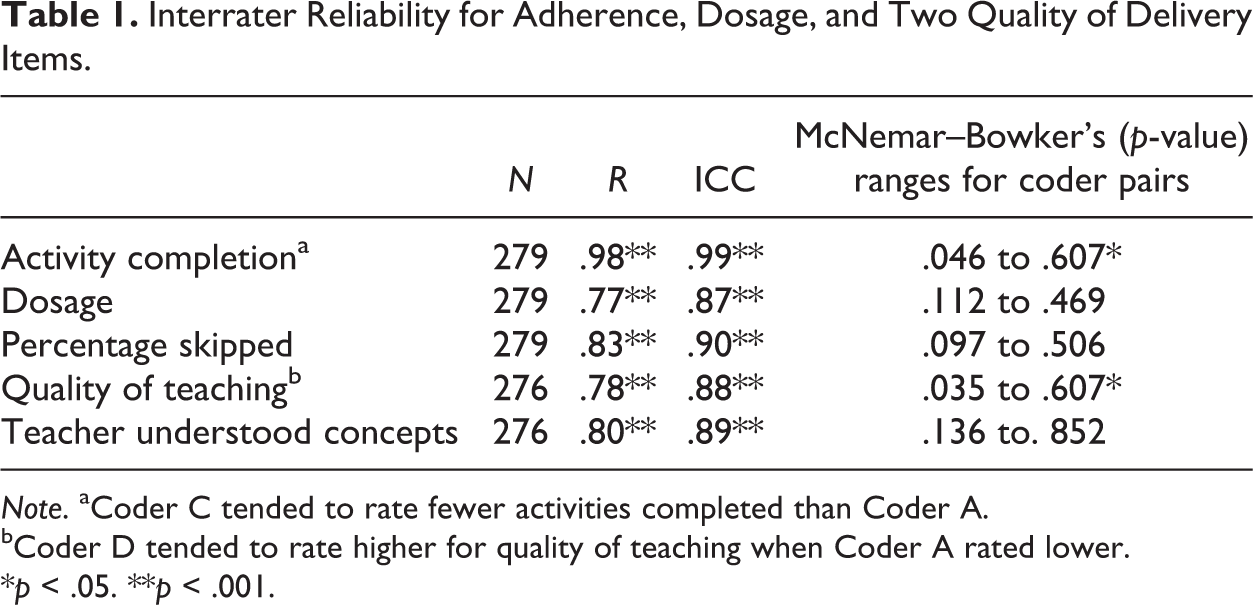
Note. aCoder C tended to rate fewer activities completed than Coder A.
bCoder D tended to rate higher for quality of teaching when Coder A rated lower.
*p < .05. **p < .001.
Intraclass Correlations
Intraclass correlation coefficients were above 0.70 for all scale items, indicating that even when coders differed on ratings for these items, ratings were nonetheless close (see Table 1).
McNemar–Bowker’s Test
The McNemar–Bowker’s tests for coder pairs were nonsignificant for 3 of the 5 items indicating that there was no bias for individual coder pairs for these items. However, McNemar–Bowker’s test statistics were significant for two coder pairs for activity completion and quality of teaching. These differences reflect specific coding biases. For example, Coder C tended to note that fewer activities were completed than Coder A and Coder D tended to rate quality of teaching higher than Coder A (see Table 1).
Interrater Agreement—Dichotomous Items
Recoding into dichotomous items improved reliability for activity objectives, classroom management, program effectiveness, message valence, and method valence. Percentage agreement was above 70% for these items and Cohen’s κ coefficients were statistically significant (see Table 2). Percentage agreement for student engagement remained below 70%. Thus, recoding this item into a dichotomous variable did not improve reliability.
Interrater Reliability for Recoded Quality of Delivery and Adaptation Valence Items.
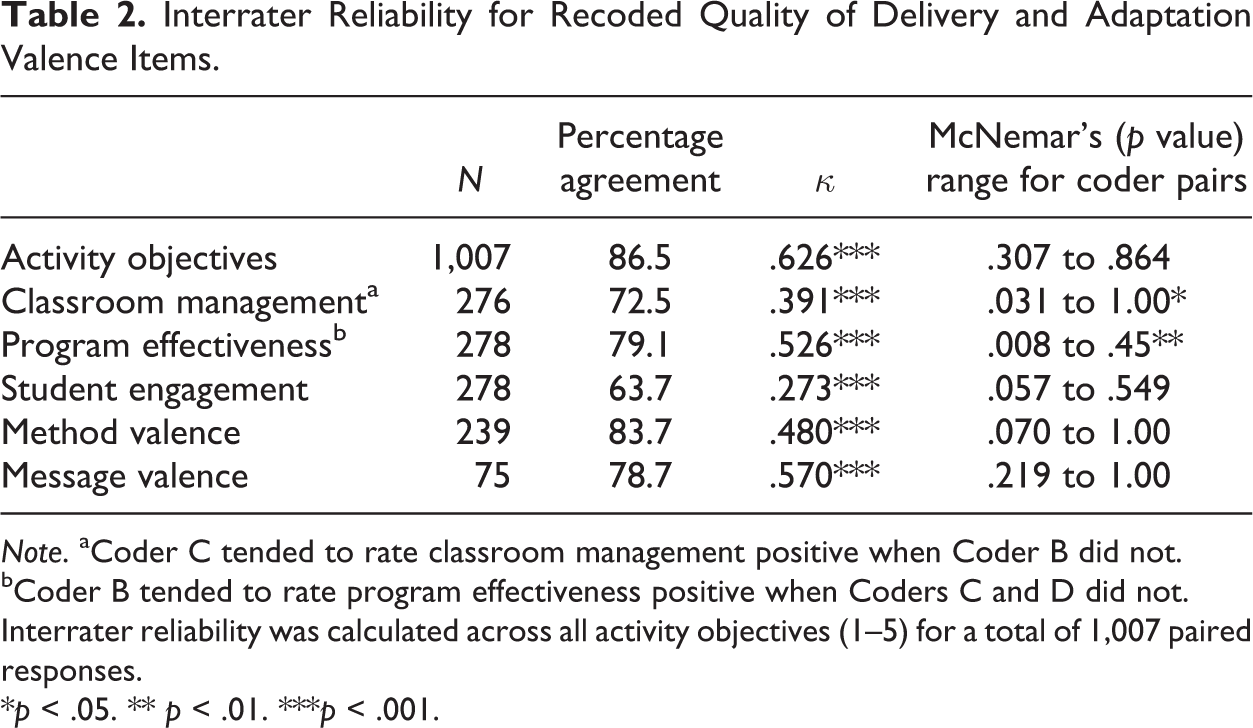
Note. aCoder C tended to rate classroom management positive when Coder B did not.
bCoder B tended to rate program effectiveness positive when Coders C and D did not.
Interrater reliability was calculated across all activity objectives (1–5) for a total of 1,007 paired responses.
*p < .05. ** p < .01. ***p < .001.
When results from the McNemar’s test were examined for each of the six coder pairs, we found that two pairs were discordant on whether or not the class was managed well and another pair on whether or not the program was effective. Coder C tended to rate classroom management as positive when Coder B did not. Coder B tended to rate program effectiveness as positive when Coders C and D did not (see Table 2).
Interrater Agreement—Program Adaptations
Percentage Agreement
Percentage agreement for whether or not adaptations were made ranged from 72.8% for activity structure changes to 94.9% for norm messages, indicating that coder pairs were in agreement of the presence or absence of adaptations (see Table 3).
Interrated Reliability for Adaptation Items.
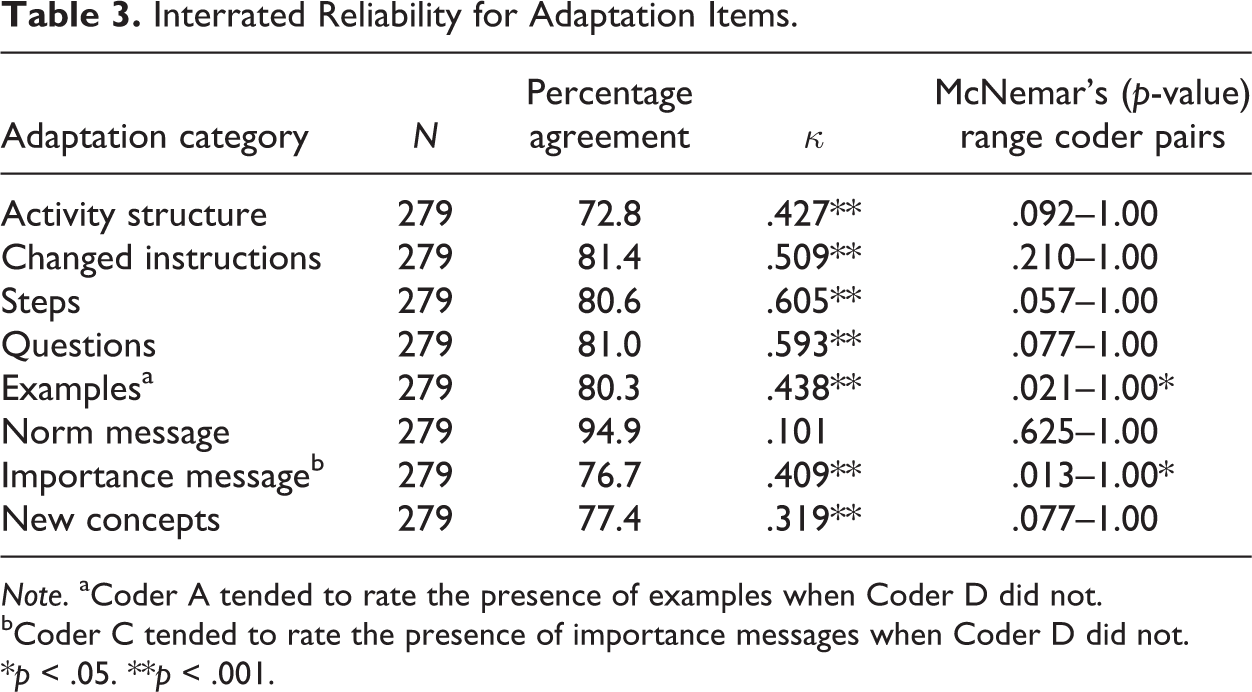
Note. aCoder A tended to rate the presence of examples when Coder D did not.
bCoder C tended to rate the presence of importance messages when Coder D did not.
*p < .05. **p < .001.
Cohen’s κ
Cohen’s κ statistics were statistically significant for all adaptation categories, except norm messages, indicating that coders were in agreement on ratings for most adaptations (see Table 3). Agreement between coders was higher for method adaptations than for message adaptations. Agreement was highest for added steps and added questions. Although percentage agreement was highest for norm messages, Cohen’s κ was nonsignificant due to the fact that norm messages not called for by the program were rarely coded as having occurred. Thus, coder pairs have excellent reliability on agreeing on the absence of norm messages, but have difficulty agreeing on their presence when they do occur. For example, of the 279 sessions that had ratings, there were 264 instances where pairs agreed norm messages were not present and only 1 instance where a pair agreed on the presence of a norm message. Raters were discordant on the remaining 14 ratings.
McNemar’s Test
The results of the McNemar’s test of coder pairs were nonsignificant for activity structure changes, changed instructions, added steps, added questions, added norm messages, and new concepts, indicating that there was no bias for individual coder pairs for these variables. There were significant results for two adaptation categories, added examples and messages of importance. When results from the McNemar’s test were examined for each of the six coder pairs, we found that one pair was discordant on the presence of examples and another on the presence of importance messages. Coder A tended to rate the presence of examples when Coder D did not and Coder C tended to rate the presence of importance messages when Coder D did not (see Table 3).
Discussion
Reliability of the Method
The goals of this study were to describe a method for assessing fidelity and to test the interrater reliability of each measure for a curriculum-based prevention program implementation. The fidelity measure, coding manual, and training procedures in their current form demonstrated good interrater reliability for measuring two components of program adherence (percentage of program skipped and activity completion), dosage (number of students present), and two measures of quality of delivery (quality of teaching and the degree to which teachers understood program concepts).
The fidelity measure also demonstrated good interrater reliability for coding program adaptations. Method adaptations are specific to what kinds of changes to teaching style and structure of the program were introduced. Message changes addressed what kind of content was addressed. Coders had no difficulty distinguishing between the two and they were able without any difficulty whatsoever to appropriately categorize each adaptation as being either methodological or focused on message. There were a few cases where adaptations met the classification as both a message and method adaptations, but these were extremely rare and coders had no difficulty noting when both occurred.
This suggests that this system can be used reliably by trained observers to assess adherence, dosage, teaching quality, teachers’ understanding of concepts, and program adaptations. When interrater reliability was low at first examination, it could usually be improved, or at least explained.
There is always a challenge in getting high reliability on rare events. For example, coders agreed on the absence of normative messages, but had difficulty agreeing on their presence. Because the curriculum addressed norms as an integral part of the intervention, the frequency of adding normative messages to curricula that do not include such messages may be more prevalent, and therefore easier to agree on.
The interrater reliability for several items was improved by dichotomizing response options. Specifically, items were rated as having met or having not met the criteria for activity objectives, classroom management, program effectiveness, and positive adaptation valences. While dichotomizing increases reliability, doing so results in a loss of information. For example, the difference between adequately met objectives and exceptionally met objectives has the potential to have profound effects on outcomes, whereas only distinguishing between whether an objective was met or not differentiates very little.
The item measuring student engagement demonstrated poor interrater reliability, despite our attempt to improve reliability by dichotomizing the item. As such, the current measure for student engagement is not reliable to the extent we desire and will need to be modified. In part, the challenge of rating student engagement from video recordings may stem from two facts. First, the focus of the camera was specifically set to capture the teacher and minimize coverage of students. Second, engagement may be an internal state that is not always amenable to observation. One obvious alternative to measuring participant engagement is to get assessments directly from students in posttest surveys as has been done in other research (Giles, Harrington, & Fearnow-Kenney, 2002).
At times, problems with reliability were specific to the pair of coders being examined. For example, one coder pair had low interrater reliability for activity completion and one pair for quality of teaching (see Table 1). Two pairs had low interrater reliability for program effectiveness and one pair for classroom management when response options were dichotomized (see Table 2). One pair evidenced low agreement on the presence or absence of examples and one pair on the presence or absence of importance messages (see Table 3).
Challenges to Be Addressed
When explaining these outcomes, the fact that coders bring with them their prior experiences and training, which may color their interpretation of events, must be considered. Even when objectivity is stressed, it is inevitable that bias in one form or another will persist. How observers rate a teacher’s delivery of an intervention will always be subject to such biases. Developing greater clarity in the coding criteria and providing increased numbers of examples may help reduce bias, but may not eliminate it entirely. In our case, the fact that paired observers were required to come to consensus is expected to alleviate some of the issues of observer bias as coders fine tune their rating process as they hear what their colleagues considered in coming to their rating. However, even when consensus is sought, biases may not entirely disappear as one member of each pair may have a dominant personality that may influence outcomes. The resolution of these issues may require further research.
It should be noted that dosage as measured in this study focused solely on the number of students present. A conceptually better measure of dosage is either the number of sessions of an intervention to which students are exposed or the total time of exposure. In the case of our sample, we had physical evidence of which sessions were completed by virtue of the video recordings that were available for coding. We were also able to track the duration of video recordings, which may also provide an estimate of dosage. Using such evidence to assess dosage clearly has its advantages. It was not reported here primarily because our focus has been on understanding the reliability of observers’ judgments. In future research, having access to this evidence should be fully exploited. However, it should be noted that access to a complete set of video recordings may be problematic, in that recordings may be missing due to technical failures (e.g., equipment problems) or management challenges (e.g., teachers may forget to send in recordings or teachers may turn on or turn off recording equipment mid-session).
It is important to make refinements to the coding manual and to training procedures to help coders better differentiate their ratings. We dichotomized several items in order to improve interrater reliability. While dichotomizing the response options for these items improved reliability for the purpose of this article, we do not feel that we should proceed with dichotomizing these items in future analyses. There are several strategies that can be employed to improve the clarity of what is required. For example, we have already discussed the current criteria for these items outlined in the coding manual and have discussed ways to further clarify ratings for these items. This will include providing more specific examples that allow coders to distinguish between ratings of adequate, very good, and exceptional student achievement of objectives and between varying degrees of classroom management. Similarly, there will be more examples of negative, neutral, and positive valence scores for adaptations.
Implications
The clear limitation of this research is that it was conducted among few teachers in one city who delivered one program. The payoff is that, as with all methods that eventually become systematized, initial experiences that are costly and time consuming are required. We expect that eventually, methods similar to the one investigated here can be routinely applied to a wider variety of programs.
The intent of the system envisioned here is for it to be a tool for understanding the moderating role that fidelity has on the outcomes of evidence-based programs when disseminated. Several researchers have recently called for the development of standardized methods (e.g., Schoenwald et al., 2011; Swanson, Wanzek, Haring, Cuillo, & McCulley, 2011). Having a reliable method for assessing fidelity will be crucial to understanding the moderating role that the various components of fidelity have on program outcomes.
Our experience with systematically coding the fidelity of 324 video recordings that captured the instruction of nine teachers who delivered All Stars has resulted in the development of a method that may be applied to multiple curriculum-based prevention programs. The value for the field is that this represents a meaningful step toward having access to a standardized strategy. As with all methods, refinements are needed. However, there are definable benefits that are available to the field. The coding manual, which has gone through extensive refinement with the clarification of definitions and the addition of examples, is available for researchers to use. For those who are interested in receiving training in coding procedures, gold standard observations are available that might be used as practice observations. Coders can view their own performance against the cumulative record.
Forms for coding observations for a variety of programs can be readily produced. Fidelity forms have already been developed to measure fidelity of several NREPP programs, including other versions of All Stars (Booster and Plus), Keepin’ It REAL, Life Skills Training (Middle Schools 1, 2, and 3), Positive Action (High School Kit 1), Project ALERT (Core and Booster), Project Northland (Amazing Alternatives, Class Action, Powerlines, and Slick Tracy), Project SUCCESS, Project Towards No Drug Abuse, Project Towards No Tobacco Use (Core and Booster), Reconnecting Youth, Second Step (Levels 1, 2, and 3), Too Good for Drugs (Grades 3, 4, 5, 6, 7, 8, and High School), and Too Good for Violence (Grades 5 and 6). Versions for other programs can be easily developed when sessions, activities, and student-centered objectives are specified.
We also perceive other benefits that may result from having a standardized fidelity assessment method. Using assessment tools that have a common structure will allow researchers to make cross-program comparisons. Program developers in particular may benefit by noting which objectives are more difficult for teachers to achieve and identifying which sessions are most likely to be adapted or have large numbers of steps skipped. Indeed, a primary side benefit of having completed these analyses has been the revision of All Stars Core in which less than ideal outcomes were observed (Hansen et al., 2011).
Caveats
The hope underlying this research is to create a fidelity assessment strategy that will be useful for assessing multiple curriculum-based prevention interventions. Nonetheless, because of the availability of video recordings for only one program, All Stars Core, the ability to generalize reliability of measurement to other interventions cannot be made. The strategy has not been tested with other NREPP programs. Future research is needed using our updated coding form and protocol to see if satisfactory interrater reliability can be established with other NREPP programs.
There is one additional concern that deserves attention. The task of creating video recordings of curriculum-based interventions is relatively easy and the tools for accomplishing this are increasingly inexpensive. However, compiling observations requires extensive time and effort. In the end, the field (including funders, prevention providers, program developers, and researchers) will need to weigh the value of this approach against its cost and practicality. Should analyses demonstrate the value of understanding the moderating effects of fidelity, we believe this method, or a similar approach, will hold significant promise for the field.
Conclusion and Future Directions
The results of this study have established that multiple dimensions of fidelity can be reliably measured for at least one curriculum-based intervention, All Stars. These dimensions include assessments of adherence, dosage (student attendance), quality of teaching, teacher understanding, and the presence of specific program adaptations. Items on the form that assess achievement of activity objectives, program effectiveness, classroom management, and valence ratings for method and message adaptations demonstrated good interrater reliability when dichotomized. Dichotomizing is not an ideal approach in that information is lost that may be valuable for understanding how fidelity moderates program effectiveness. Therefore, a strategy to gain increased reliability for these items is needed.
Our measure for student engagement in its current form is not sufficiently reliable. Future research is needed to see if refinements can be added to improve observers’ assessments of student engagement. We are currently coding video recordings for additional teachers. The same coder pairs are involved as in the project discussed in this article. The proposed revisions to our coding manual, combined with coder meetings will hopefully improve interrater reliability for student engagement. At a minimum, posttest items on student surveys that address student engagement are needed.
While the manual and training procedures for the coding program implementation in its current form are reliable for coding adherence (percentage of program skipped, activity completion), dosage, two measures of engagement (quality of teaching and teacher understanding), and most program adaptations for one program (All Stars), until these procedures are replicated with other programs, its ability to serve as a standardized method for assessing implementation will not be known. The proposed method is ready for testing when similar sources of data become available.
Footnotes
Declaration of Conflicting Interests
The author(s) declared no potential conflicts of interest with respect to the research, authorship, and/or publication of this article.
Funding
The author(s) disclosed receipt of the following financial support for the research, authorship, and/or publication of this article: This project was funded by a grant from the National Institute on Drug Abuse (R01 – DA024639).