
Abstract
This study investigated differences in cognitive risk and objective cognitive performance between lesbian, gay, and bisexual (LGB; n = 309) and heterosexual (n = 16,207) older adults using baseline data (2011–2015) from the Comprehensive cohort of the Canadian Longitudinal Study on Aging (CLSA). Cognitive risk was assessed using the Australian National University – Alzheimer’s Disease Risk Index (ANU-ADRI). Cognitive performance was measured using a composite score based on performance on six cognitive tests. The analytic strategy included a combination of t-tests, chi-square tests, and linear regression models. Contrary to expectations, LGB participants exhibited lower cognitive risk scores (M = −1.08, SD = 8.85) in comparison to heterosexual participants (M = 0.61, SD = 10.62). On subcomponents of the ANU-ADRI score, LGB participants reported higher rates of depression and smoking, and lower social engagement. In terms of cognitive performance, LGB participants scored significantly higher (M = 104.58, SD = 14.72) in comparison to heterosexual participants (M = 100.12, SD = 15.05). This difference remained even after controlling for ANU-ADRI score, race, and income. Our findings highlight the importance of incorporating sociodemographic characteristics into cognitive risk assessments.
Introduction
With advances in health and living conditions, the average life expectancy worldwide is rising. Concurrently, the number of people living with age-related cognitive impairments, such as dementia, is also increasing (Nichols et al., 2022). Cognitive impairment refers to a decline in one or more cognitive domains, such as memory, executive function, perception, or attention (World Health Organization, 2022). Dementia is a neurocognitive disorder characterized by cognitive impairment that significantly interferes with activities of daily living (World Health Organization, 2022). It is estimated that the global prevalence of dementia will grow from approximately 57 million people living with dementia in 2019 to over 152 million people in 2050 (Nichols et al., 2022). While research efforts continue to pursue curative solutions, public health initiatives have pivoted towards prevention through the identification of modifiable risk factors. One of the ways that research has to identify the risk of developing future cognitive impairment or dementia is through the calculation of cognitive risk scores (e.g., Anstey et al., 2013). Certain members of the population may show higher risk of cognitive impairment due to lifecourse experiences of minority stress such as lesbian, gay, and bisexual people (LGB) (Hsieh et al., 2021). This paper focuses on risk factors for cognitive impairment through the computation of cognitive risk scores, and examines the role of sexual orientation using data from the Canadian Longitudinal Study on Aging (CLSA).
Literature Review
Recent meta-analyses have identified a number of potentially modifiable risk factors that significantly increase the risk of dementia later in life, including smoking, depression, obesity, diabetes, heavy drinking, and high blood pressure (Anstey et al., 2019; Li et al., 2020). Similarly, a Commission from The Lancet identified 14 modifiable risk factors that, if addressed, might prevent or delay up to 45% of dementia cases: less education, hearing loss, high LDL cholesterol, depression, traumatic brain injury (TBI), physical inactivity, diabetes, smoking, hypertension, obesity, heavy alcohol use, social isolation, air pollution, and vision loss (Livingston et al., 2024).
Assessment tools have been developed to identify individuals at increased risk of developing dementia based on these modifiable risk factors and to guide risk-reduction efforts. These tools, such as the Cardiovascular Risk Factors, Aging, and Dementia (CAIDE) risk score (Kivipelto et al., 2006), LIfestyle for BRAin health (LIBRA) risk score (Schiepers et al., 2018), and the Australian National University - Alzheimer’s Disease Risk Index (ANU-ADRI; Anstey et al., 2013), were developed using systematic reviews and meta-analyses that assign points based on severity of risk. Overall, tools such as the ANU-ADRI help individuals understand their dementia risk, and empower them to make informed decisions and take preventive action to lower their risk.
Additional risks have been identified since the development of these assessment tools. For example, Livingston et al. (2024) include hearing loss and vision loss as modifiable risk factors for dementia. Emerging evidence also suggests that social determinants, such as race and income, influence dementia risk (Forrester et al., 2019; Ou et al., 2023; Shiekh et al., 2021). Many of the cognitive risk factors identified cluster around inequalities, putting members of minoritized communities at an increased risk of cognitive decline (Livingston et al., 2024). Population health studies have demonstrated that sexual minority (i.e., lesbian, gay, and bisexual [LGB]) older adults exhibit a higher prevalence of physical and mental health conditions and health-related behaviours (e.g., smoking) known to be risk factors for cognitive decline. For example, LGB older adults are more likely to smoke in comparison to their heterosexual peers (Fredriksen-Goldsen et al., 2013; Stinchcombe et al., 2018), and smoking is associated with 34% increased risk of developing dementia (Zhong et al., 2015). Older lesbian and bisexual women display a higher risk of obesity (Fredriksen-Goldsen et al., 2013), and obesity (BMI ≥ 30) is associated with a 33% increased risk of dementia (Albanese et al., 2017). Higher rates of cardiovascular disease (e.g., coronary heart disease; CHD) have been observed among LGB adults (Stinchcombe et al., 2018), and history of CHD is associated with 27% increased risk of developing dementia (Wolters et al., 2018). Additionally, LGB older adults have a greater prevalence of depression in comparison to heterosexual older adults (Stinchcombe et al., 2020), and depression is associated with 82% increased risk for dementia (Fernández Fernández et al., 2024). Taken together, the elevated prevalence of cognitive risk factors among LGB adults suggests that they may face a greater risk of developing dementia as they age.
Consistent with these inequalities, emerging evidence suggests that older sexual minority people display a higher prevalence of cognitive impairment in comparison to heterosexual people (Hsieh et al., 2021). In a nationally representative study of cognition in the United States of America, older adults in same-sex relationships had 78% higher odds of having cognitive impairment than those in different-sex relationships (Liu et al., 2021). Similarly, Flatt et al. (2021) found that, after controlling for demographic covariates (e.g., race, education, and income), sexual minority older adults were 26% more likely to report subjective cognitive decline than heterosexual older adults. Jacob et al. (2021) found that, in comparison to heterosexual participants, LGB participants had a 1.4 times higher odds of reporting concentration complaints. Given these findings, additional exploration of dementia and cognitive impairment in LGB older adults is imperative to understanding these inequalities.
The health inequalities found among sexual minority people are the result of minority stress experiences, such as stigma and discrimination (Meyer, 2003). These unique, chronic, and socially-based stressors accumulate over the lifespan to produce health disparities in older adulthood, and can be further exacerbated by intersecting identities (e.g., race, gender, income) that are associated with disadvantage (Ferraro & Shippee, 2009; Meyer, 2003). For example, many older LGB people today have faced a myriad of minority stressors across their lifecourse, including structural stigma in the form of criminalization of same-sex activity, lack of legal recognition of same-sex marriage and partnerships, and institutional neglect during the HIV/AIDS crisis (for more on LGB policy history in Canada, see Stinchcombe & Wilson, 2021). Minority stress theory has been extended to aging, suggesting that stressors such as discrimination increase allostatic load, which in turn elevates dementia risk (Forrester et al., 2019). While the biopsychosocial framework of minority aging has primarily examined race, it can also be applied to sexual orientation and other minority identities, which may contribute to cognitive decline and dementia risk through physiological stress pathways.
Despite growing evidence of health and cognitive disparities among LGB populations, few studies have assessed cognitive risk in this group using validated risk scores. Fewer still have explored how sexual orientation may influence the relationship between cognitive risk and objective measures of cognition. The purpose of this study was to leverage existing data from the CLSA to calculate cognitive risk scores using the ANU-ADRI and to compare these scores between LGB and heterosexual participants. By applying this established risk index to a large, population-based dataset, we sought to explore how cognitive risk factors manifest across sexual orientation groups and examine their relationship with objective cognitive outcomes.
Research Design
We used cross-sectional data from the Canadian Longitudinal Study on Aging (CLSA) at baseline (Raina et al., 2019). Participants were eligible to participate in the CLSA if they were between the ages of 45 and 85 at baseline (2011–2015) and had the ability to communicate in French or English (Raina et al., 2009). Participants were excluded if they were full-time Canadian Armed Forces members, lived on First Nations reserves, lived in an institutional setting, or displayed cognitive impairment at baseline (Raina et al., 2019). Further details on sampling strategy are described elsewhere (Raina et al., 2009, 2019). Given the large number of participants, data collection spanned from 2011 to 2015; however, each participant was only recorded once during this time period. CLSA participants were assigned to one of two cohorts: a Tracking cohort, who participate in phone interviews; and a Comprehensive cohort, who undergo more extensive testing at one of eleven data collection sites (DCS) across Canada. The Tracking cohort was excluded from this study because some key cognitive risk factors (i.e., TBI, fish intake) and objective cognitive tests (i.e., Controlled Oral Word Association Test and Stroop Test) were only collected from and administered to the Comprehensive cohort. Baseline data were selected in order to establish initial cognitive risk, providing the foundation for future analyses examining whether ANU-ADRI predicts cognitive change over time.
ANU-ADRI
The approach to computing cognitive risk scores was drawn from the ANU-ADRI (Anstey et al., 2013). The ANU-ADRI is one of the most comprehensive cognitive risk calculation tools, incorporating 15 variables (11 risk factors and 4 protective factors): age, sex, education, Body Mass Index (BMI) at mid-life, diabetes, depression, cholesterol at mid-life, Traumatic Brain Injury (TBI), smoking, alcohol intake, social engagement, physical activity, cognitive activity, fish intake, and pesticide exposure (Anstey et al., 2013). The ANU-ADRI was developed through a systematic literature review (Anstey et al., 2013), with points assigned to each variable based on effect sizes (positive points for risk factors; negative points for protective factors) (Anstey et al., 2013). A total ANU-ADRI score is calculated by summing across all variables, with higher scores indicating greater dementia risk.
The ANU-ADRI has been validated as an effective tool for predicting individuals who will develop dementia, with C-statistics ranging from 0.637 to 0.740 in predicting Alzheimer’s disease (values of 0.5 indicate chance-level and 1.0 denotes perfect discrimination) (Anstey et al., 2014). The ANU-ADRI’s predictive ability is comparable to other dementia risk prediction tools, such as the Cognitive Health and Dementia Risk Index (CogDrisk) and Lifestyle for Brain Health (LIBRA) tool (Huque et al., 2023). Notably, the ANU-ADRI remains valid even when scores are calculated exclusively using self-report data, as well as when modified to exclude mid-life BMI and cholesterol (e.g., when mid-life health information is unavailable; Anstey et al., 2014). ANU-ADRI scores have been associated with poorer cognitive performance both at baseline and over a two-year follow-up in a Finnish sample (Hall et al., 2024). Higher ANU-ADRI scores have also been associated with an increased likelihood of progressing from normal cognition to Mild Cognitive Impairment (MCI) over a 12-year period (Andrews et al., 2017).
With the exception of pesticide exposure, all ANU-ADRI variables were collected through the CLSA. In line with previous work, BMI and cholesterol were excluded from the present analysis as they are only predictors for dementia when measured before the age of 60 (Anstey et al., 2014; Hall et al., 2024). The current analyses were approved by the University of Ottawa REB (REB #H-10-22-8648). A comprehensive description of the CLSA variables, specific questionnaire items, and their mapping to the ANU-ADRI is available in Supplemental Table 1.
Demographic Variables
Age and Sex
Participants’ age and sex were recorded during the interview. Age groups matched those specified in the ANU-ADRI: 55–65, 65–70, 71–75, 76–80, 81–85, 86–90, and >90 years. Given that the ANU-ADRI is validated for use with adults ages 55 and older, CLSA participants under the age of 55 were excluded.
Education
Education was self-reported by participants. Scores were assigned based on the highest level of education attained, classified as: >11 years (0 points), 8–11 years (+3 points), and <8 years (+6 points).
Medical History
Diabetes
Diabetes status was self-reported based on history of diagnosis. Points were assigned as follows: no diabetes (0 points), diabetes (+3 points).
Traumatic Brain Injury (TBI)
TBI was assessed in the CLSA using a screener for history of head injuries. The screen was positive if the participant reported at least one head injury with one or more of the following symptoms: feeling dazed, confused, or “seeing stars”; not remembering the injury; losing consciousness. Participants with no history of TBI received 0 points, and those with a positive history of TBI received +4 points.
Depression
Depression was assessed using both self-reported history of diagnosis of a depressive disorder and the Centre for Epidemiological Studies Depression Scale 10-item (CES-D-10; Andresen et al., 1994) score. The CES-D-10 includes questions about common symptoms of depression experienced over the past week and has been validated for use with healthy community-dwelling older adults (Cronbach’s alpha: 0.70; Mohebbi et al., 2018). The original ANU-ADRI used a 20-item version of the CES-D with a recommended cutoff score of 16. However, the CLSA uses a shorter 10-item version, which carries a widely accepted cutoff score of ≥10. Points were assigned as follows: CES-D < 10 and negative history of depression diagnosis received 0 points; CES-D ≥ 10 and/or positive history of depression diagnosis received +2 points.
Lifestyle Factors
Physical Activity
Physical activity was measured using a modified version of the Physical Activity Scale for the Elderly (PASE), which asks about various types and duration of physical activity engaged in over the past 7 days (Washburn et al., 1993). Types of activities include walking outside, light sport/recreational activity, moderate sport/recreational activity, strenuous sport/recreational activity, and strength training. It is considered a reliable and valid measure of physical activity in community-dwelling older adults (Washburn et al., 1993).
We estimated weekly minutes of moderate- and vigorous-intensity physical activity using reported participation in moderate and strenuous sport/recreational activities. Specifically, we selected the mid-point value for the frequency (e.g., 5–7 days per week was classified as 6 days) and average minutes per day (e.g., 30–59 minutes per day was classified as 45 min) and multiplied these to estimate weekly number of minutes (e.g., 6 days per week and 45 min/day is 270 min). Estimated minutes per week of moderate and strenuous activities were summed to create a total estimated minutes per week of physical activity. This approach to calculating weekly exercise minutes in the CLSA is based on work by Yuan (2023). Points were assigned based on activity levels as follows: highly active (≥300 min: −3 points), active (150–299 min: −2 points), and inactive (<150 min: 0 points), based on supplemental methods described by Brady et al. (2023).
Smoking
Smoking status was assessed in the CLSA using 23 items measuring smoking habits (current and former) as well as environmental smoke exposure. These items were adapted for use in the CLSA from the Canadian Health Measures Survey and the Canadian Tobacco Use Monitoring Survey (Statistics Canada, 2008; Tremblay & Gorber, 2007). Points were assigned as follows: never smoker (0 points), former smoker (+1 point), and current smoker (+4 points).
Alcohol Intake
Alcohol consumption was assessed in the CLSA using a six-item measure that asked about the amount and type of alcohol consumed in the past 12 months and ever. These items were adapted from the Ontario Health Study which were originally sourced from the Centre for Addiction and Mental Health (Ialomiteanu & Adlaf, 2012). Points were assigned based on weekly drink intake, differentiated by sex: males (0.25–20.5 drinks/week: −3 points); females (0.52–13.5 drinks/week: −3 points). Intake outside these ranges scored 0 points.
Social Engagement
The original ANU-ADRI used five domains of social engagement based on the Honolulu Asia Aging Study (HAAS): marital status, living arrangements, frequency of participation in social activities, social network/contact with close friends, and presence of a confidant (Anstey et al., 2013; Saczynski et al., 2006). Variables from the CLSA that most closely aligned with the original ANU-ADRI were selected, including marital status, number of people in household, level of social activities, timing of last get together with close friends, and frequency of availability of a confidant (see supplemental materials for more detailed information).
A social engagement composite score was calculated guided by the method used in the HAAS (Saczynski et al., 2006). Each of the 5 domains contributed 1 point to the score, for a total social engagement composite score ranging from 0–5. Specifically: for marital status, married/common law received 1 point, and other marital statuses (single, widowed, divorced, separated) received 0 points; for living arrangements, two or more people living in the household in addition to the participant received 1 point, and living alone or with one other person received 0 points; for social activity, weekly or daily participation in social activities received 1 point, and monthly or less frequent participation in social activities received 0 points; for contact with close friends, gathering with a close friend within the last week or two received 1 point; gathering with a close friend within the past month or less frequently received 0 points; for presence of a confidant, having someone to confide in all of the time or most of the time received 1 point, and having someone to confide in some of the time, a little of the time, or none of the time received 0 points.
ANU-ADRI points were then assigned based on total social engagement composite scores as follows: high social engagement (composite score 4 or 5; 0 points), medium-high social engagement (composite score of 3; +1 point), low-medium social engagement (composite score of 2; +4 points), and low social engagement (composite score of 0 or 1: +6 points).
Cognitive Activity
Cognitive activity was evaluated in the CLSA using two variables: (1) frequency of engaging in cognitive activities, such as playing board games, cards, crossword puzzles, jigsaw puzzles, or sudoku; and (2) frequency of playing a musical instrument or singing in a choir. These variables were collected as part of a larger General Health module which asked participants about their physical, mental, and social well-being. Points were assigned as follows: frequent engagement (i.e., either item was “every day” or both items were “several times per week”) received −7 points, regular engagement (i.e., either item was several times per week, but not both) received −6 points, and infrequent engagement (i.e., both of these items were endorsed several times a month or less) received 0 points.
Fish Intake
Fish intake was collected in the CLSA as part of the 36-item Short Diet Questionnaire (SDQ), which asks about frequency of consumption of a selected number of foods and nutrients thought to be important for aging (Gaudreau et al., 2007; Shatenstein & Payette, 2015). The SDQ was developed as part of the CLSA Phase II validation studies and is considered valid in estimating frequency of specific food intake among older adults (Shatenstein & Payette, 2015). Fish intake was scored based on weekly number of portions of fish, including salmon, trout, sardines, herring, tuna, and mackerel: <0.25 fish portions/week (0 points), 0.25-2 fish portions/week (−3 points), 2-4 fish portions/week (−4 points), and >4 fish portions/week (−5 points).
Objective Cognition
Overall Cognition Composite
We use the term objective cognition to describe cognition measured through validated cognitive test performance. This construct is distinguished from subjective cognition, which reflects self-reported cognitive symptoms or experiences. Overall objective cognition was assessed using the CLSA-derived composite cognition score, a latent construct index generated from a six-test cognitive battery that is language invariant. The composite score integrates performance across the modified Rey Auditory Verbal Learning Task (Immediate and Delayed Memory) (Rey, 1964; Tuokko et al., 2017), Controlled Oral Word Association Test (Animal Fluency, Letter Fluency) (Lezak et al., 2004), Mental Alternation Test (Teng, 1995), and Stroop Test – Victoria Version (Strauss et al., 2006). Detailed information on the selection of the cognition variables used in the CLSA, including psychometric evaluation, is available elsewhere (Tuokko et al., 2017). The CLSA standardizes each of these measures to the Comprehensive cohort, sums the six standardized scores, and applies a linear transformation to rescale the composite to a mean of 100 and a standard deviation of 15 (Canadian Longitudinal Study on Aging, 2022; O’Connell et al., 2022). Further information about the calculation of the composite variable are summarized in detail elsewhere (Canadian Longitudinal Study on Aging, 2022).
Additional Explanatory Variables
Sexual Orientation
All participants were asked about their sexual orientation. In English, participants were asked “Do you consider yourself to be: Heterosexual? Homosexual? Bisexual?” and in French, participants were asked “Vous considérez-vous: hétérosexuel(le)? Homosexuel(le)? Bisexuel(le)?”. In order to maximize cell sizes of sexual minority respondents, homosexual (n = 242) and bisexual (n = 67) were grouped into one LGB variable (n = 309).
Income
Participants were asked about the total income received by all household members from all sources in the past 12 months (before taxes and deductions). Income was grouped into five levels (in Canadian dollars): <$20,000, $20,000–49,999, $50,000–99,999, $100,000–149,999, and ≥ $150,000.
Race
Participants were asked: “People in Canada come from many different cultural and racial backgrounds. Are you white? Chinese? South Asian? Black? Filipino? Latin American? Southeast Asian? Arab? West Asian? Japanese? Korean? North American Indian? Inuit? Métis? Other (please specify)?” Multiple responses were permitted and were categorized as “multiple racial or cultural origins”. Racial group sizes ranged from n = 2 to n = 209. To maximize cell sizes, race was grouped into two categories: white (n = 15,766) and non-white (n = 739).
Hypertension
Participants were asked: “Has a doctor ever told you that you have high blood pressure or hypertension?” with response options of yes and no. Those who answered yes were classified as having hypertension.
Hearing Loss
Participants were asked: “Is your hearing, using a hearing aid if you use one, excellent, very good, good, fair, or poor?” Participants who reported fair or poor hearing were classified as having hearing loss, while those who reported excellent, very good, or good hearing were classified as not having hearing loss.
Vision Loss
Participants were asked: “Is your eyesight, using glasses or corrective lens if you use them, excellent, very good, good, fair, or poor/non-existent?” Participants who reported fair or poor/non-existent eyesight were classified as having vision loss, and those who reported excellent, very good, or good vision were classified as not having vision loss.
Statistical Analysis & Missingness
We conducted a series of analyses examining group differences in ANU-ADRI scores and objective cognition scores by sexual orientation. All analyses were performed using Stata/SE 18.0 (StataCorp, 2023). First, we calculated cognitive risk scores using the ANU-ADRI framework. Missing data were managed through listwise deletion. Given that the original ANU-ADRI included BMI and cholesterol only for those under the age of 60, and some CLSA participants were beyond this age, we excluded these two variables in our calculations in line with previous studies (Anstey et al., 2014; Hall et al., 2024). We then examined differences between heterosexual and LGB groups on each component of the ANU-ADRI scoring using independent samples t-tests and Chi-square tests, as appropriate. We adjusted for unequal groups using Satterthwaite’s approximation. All statistical tests were two-tailed with significance set at p < .05 and exact p-values are reported here unless they are less than .001.
Next, a series of linear regression analyses were conducted to examine whether overall ANU-ADRI risk scores were associated with cognitive function. Multicollinearity among ANU-ADRI components was evaluated using variance inflation factors (VIFs). We examined how the addition of sexual orientation and other social determinants influenced the association between ANU-ADRI scores and cognition. Finally, we ran an exploratory model incorporating other physical risk factors that have been identified (Livingston et al., 2024), including hypertension, hearing loss, and vision loss. Adjusted R2 values are reported to account for differences in the number of predictors across models and to provide a more accurate estimate of model fit.
The analytic sample included only participants who were ages 55 and older with complete data on ANU-ADRI variables, sexual orientation, and overall cognition. Sample demographic characteristics are available in eTable 1. The analytic sample was n = 16,516 (n = 16,207 heterosexual and n = 309 LGB). No significant differences in missingness were observed between heterosexual and LGB participants (eTable 2). Of the 22,502 participants who fell within the validated ANU-ADRI age range (i.e., ages 55+), complete data were available for 73% of participants. The most common missing variable was the overall cognition variable (15%) and, to a lesser extent, physical activity (5%) and social engagement (3%); missingness on these variables was expected as they were derived from multiple items, increasing the chance of incomplete data. A correlation analysis across all model variables indicated that nearly all associations among missingness indicators were very small (|r| < 0.05), with the exception of a moderate correlation between missing depression and missing diabetes data (r = 0.41). Additional logistic regression modeling of missingness in the overall cognition variable showed small but statistically significant associations with age (i.e., older participants were slightly more likely to have missing data; B = .02, p < .001) and sex (i.e., males were slightly more likely to have missing cognition data; B = .10, p = .001). These patterns suggest that missing data were related to observed characteristics, and are therefore considered Missing at Random (MAR).
Results
ANU-ADRI Points Comparison
ANU-ADRI Points by Sexual Orientation Group
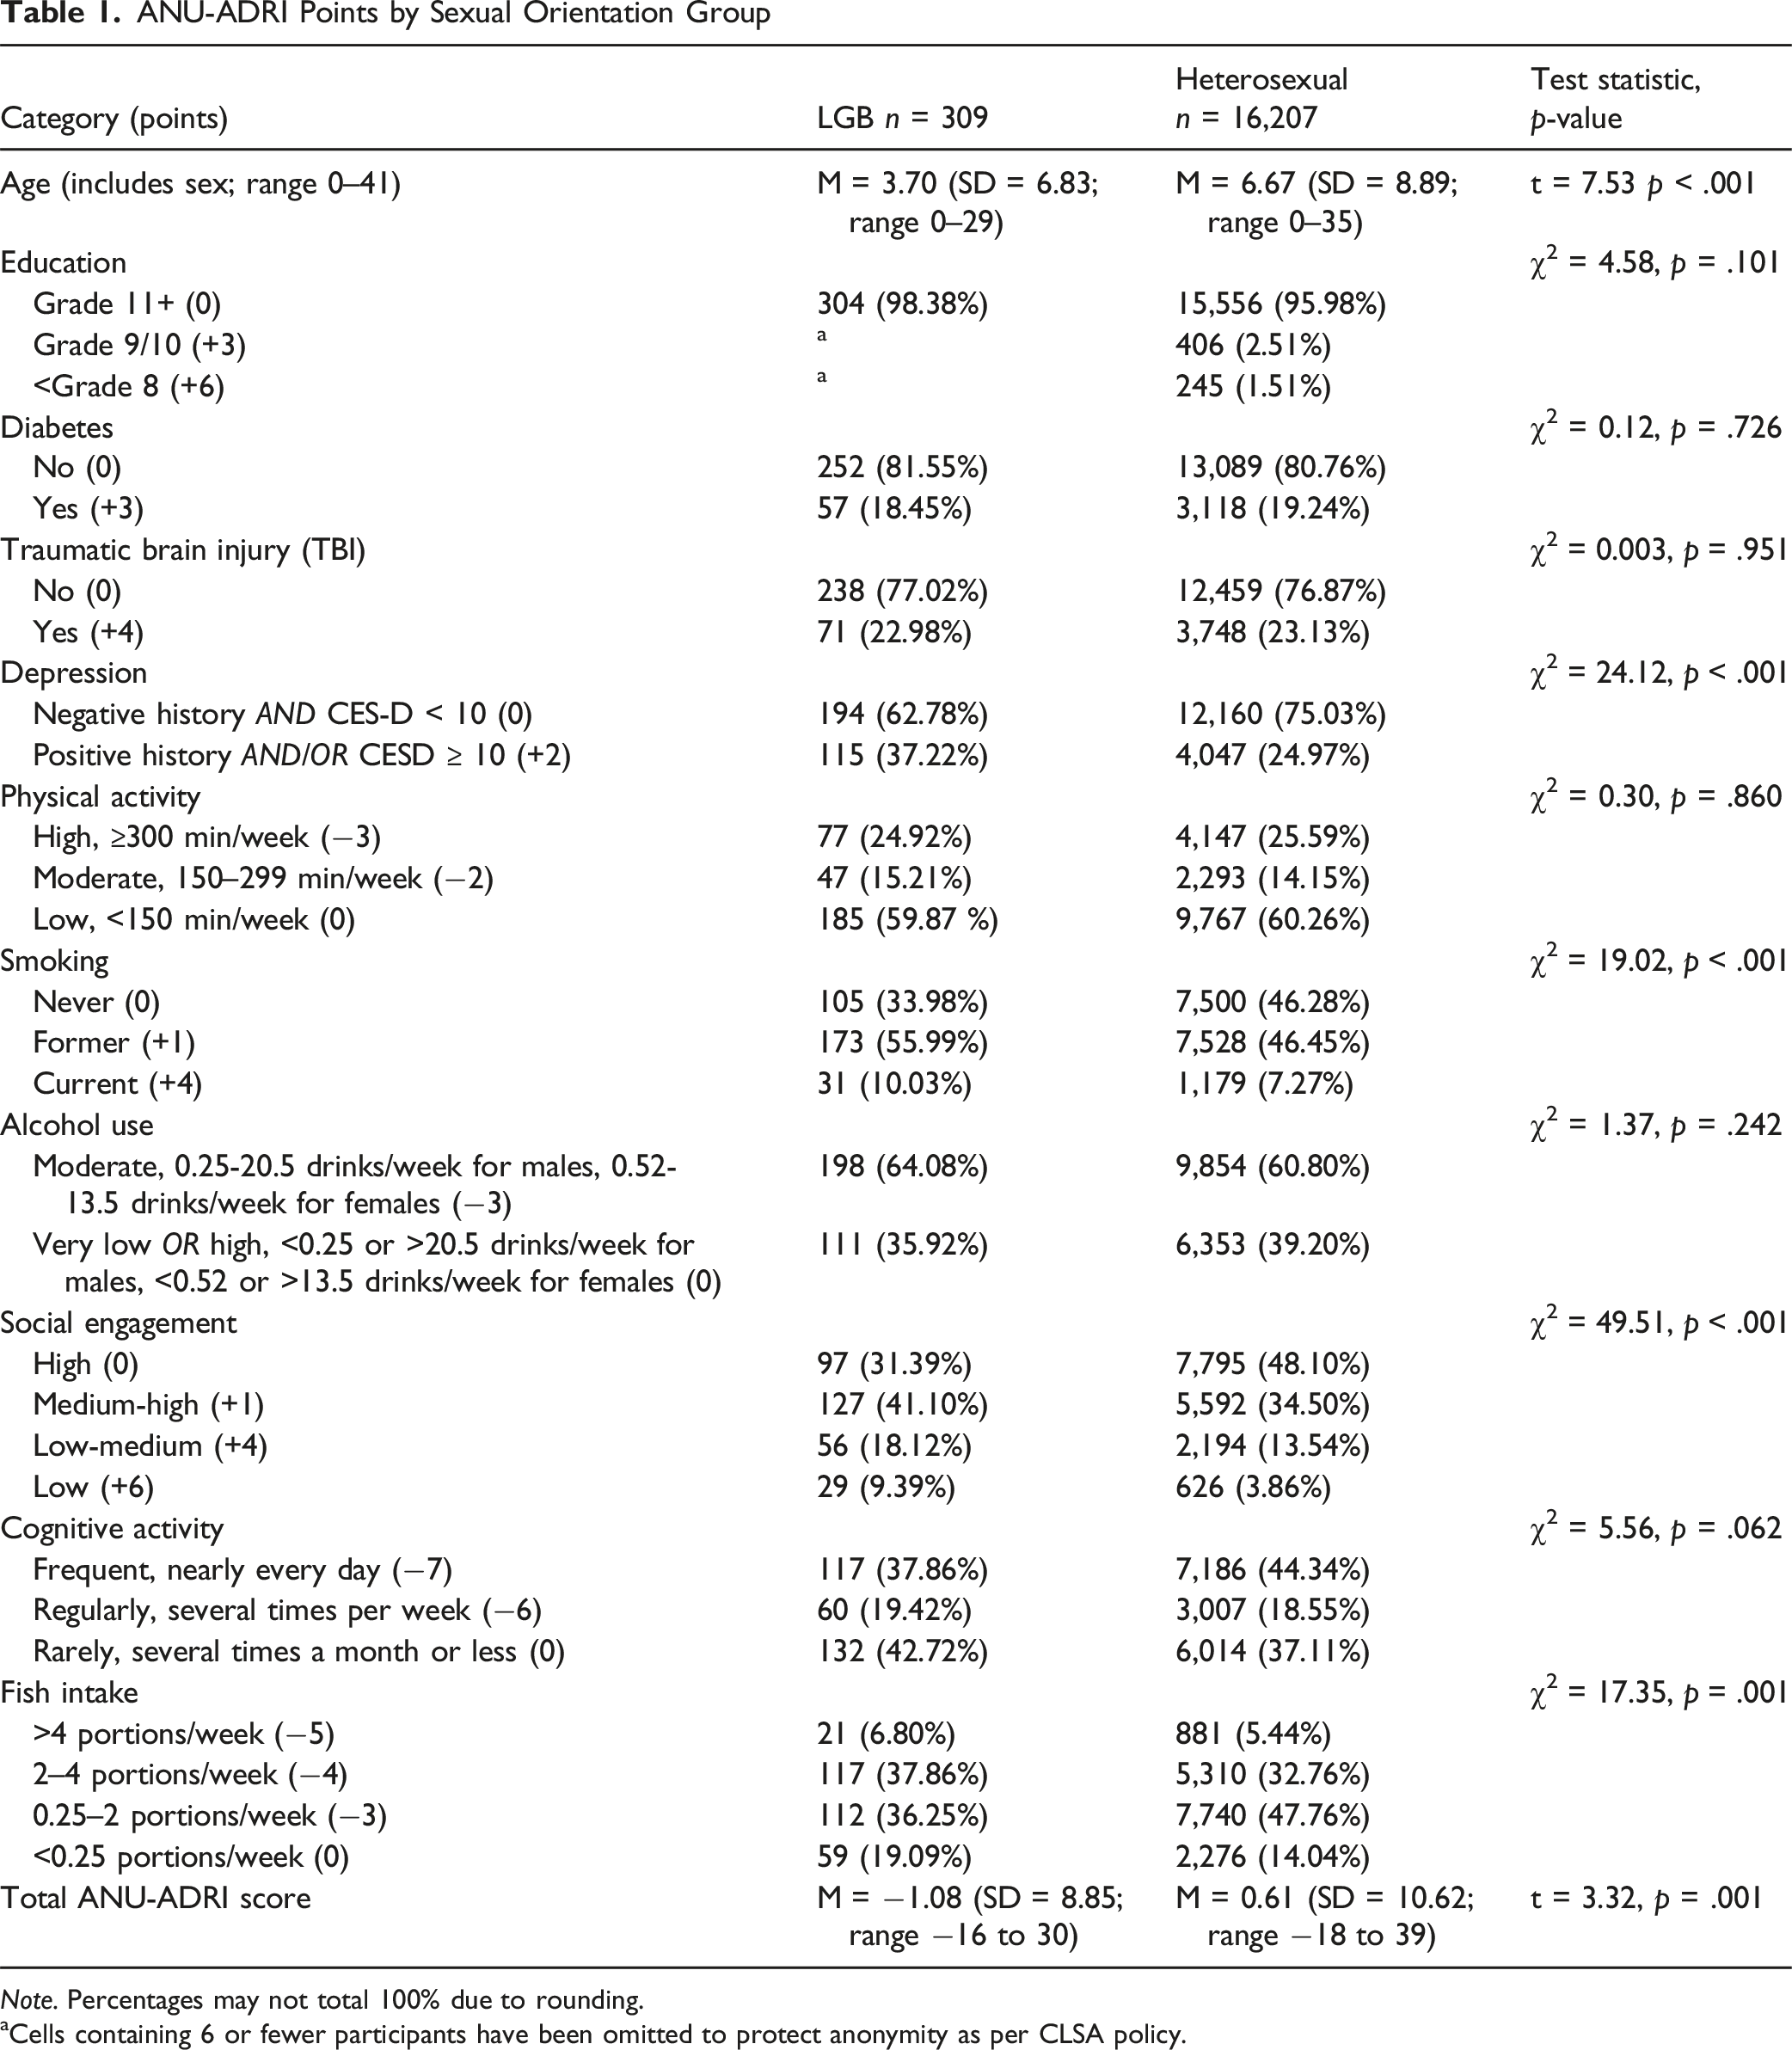
Note. Percentages may not total 100% due to rounding.
aCells containing 6 or fewer participants have been omitted to protect anonymity as per CLSA policy.
The mean ANU-ADRI score for LGB participants was M = −1.08 (SD = 8.85; range −16 to 30), and the mean score for heterosexual participants was M = 0.61 (SD = 10.62; range −18 to 39). The difference in total ANU-ADRI scores was significant (t = 3.32, p = .001), with heterosexual participants displaying higher risk scores on average.
Overall Cognition Scores
The mean overall cognition score of the analytic sample (heterosexual and LGB combined) was M = 100.20 (SD = 15.06; range 36.60–169.19). The mean cognition score for LGB participants was M = 104.58 (SD = 14.72; range 65.07–149.85), and the mean cognition score for heterosexual participants was M = 100.12 (SD = 15.05; range 36.60–169.19). In comparison to the heterosexual group, LGB participants had higher overall cognition scores (t = 5.27, p < .001).
Linear Regression Modelling
Step 0: Simple Linear Regression
No substantial multicollinearity was detected among ANU-ADRI variables (all VIFs < 5). We ran a crude linear regression model with total ANU-ADRI score as the predictor and objective cognition as the outcome. Higher ANU-ADRI risk scores were significantly associated with lower objective cognition scores (B = −0.23, p < .001), indicating that each additional point increase in ANU-ADRI score corresponded to a 0.23-point reduction in overall cognition score. The overall model was significant F(1, 16,514) = 460.91, p < .001, R2 = 0.03.
Step 1: Adding Sexual Orientation
Hierarchical Linear Regression Models Predicting Objective Cognitive Performance
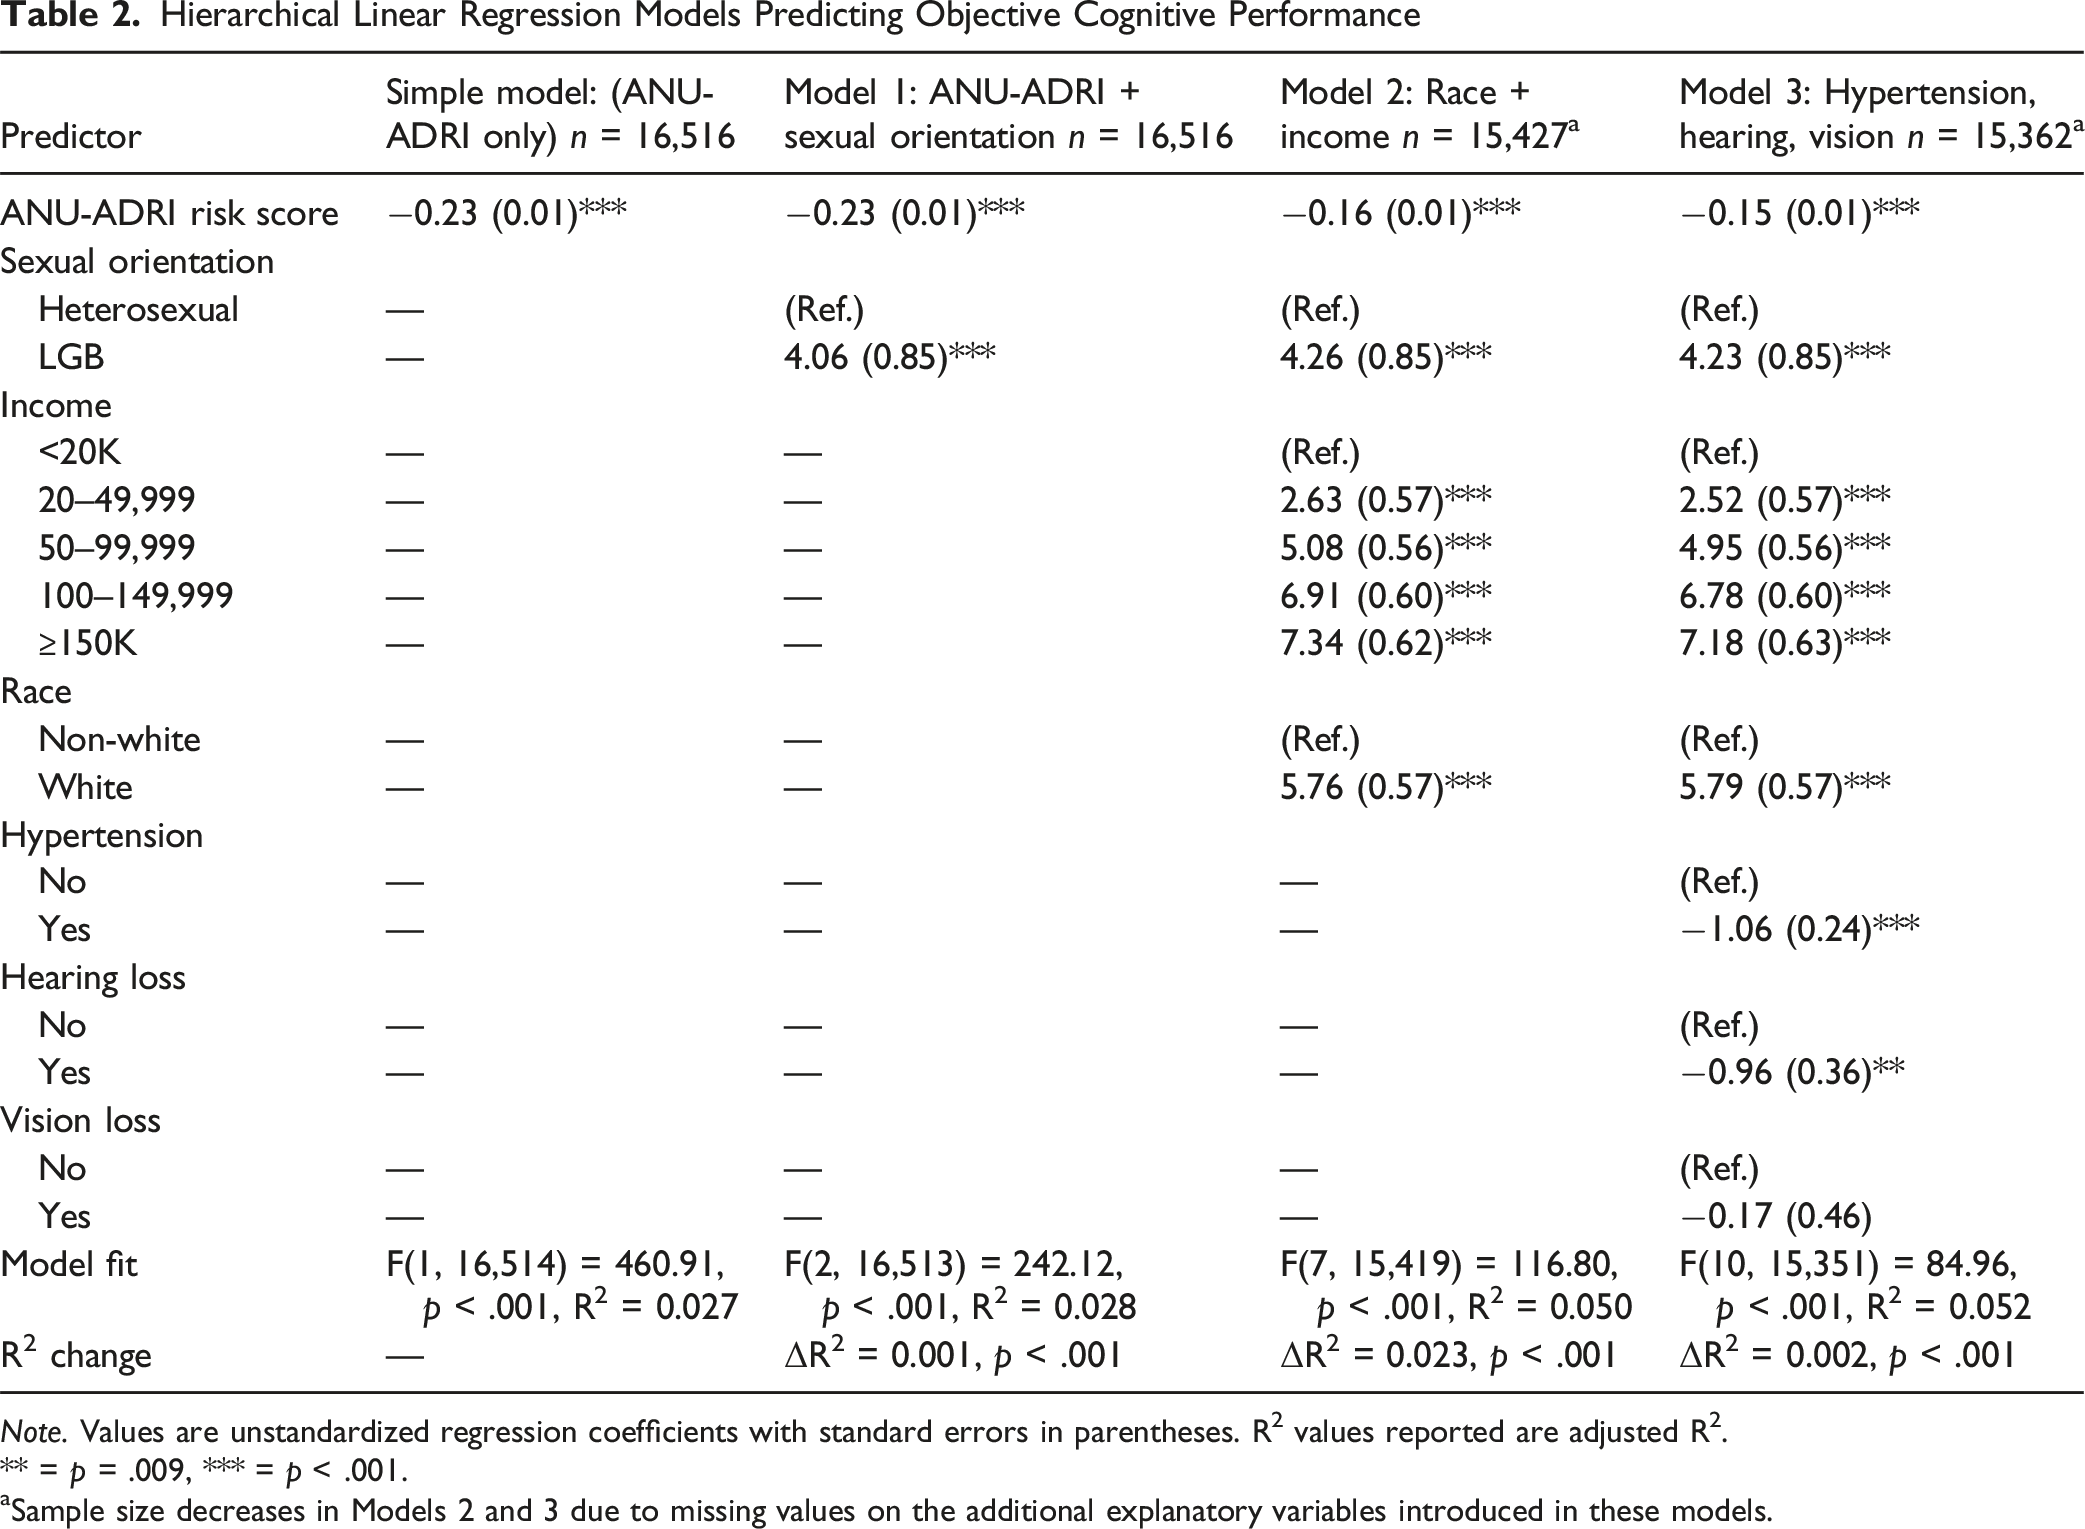
Note. Values are unstandardized regression coefficients with standard errors in parentheses. R2 values reported are adjusted R2.
** = p = .009, *** = p < .001.
aSample size decreases in Models 2 and 3 due to missing values on the additional explanatory variables introduced in these models.
Step 2: Adding Social Determinants
We then added race and income to the model. Sample size decreased in Steps 2 and 3 due to missing values on the additional explanatory variables introduced in these models. The overall model was significant F(7, 15,419) = 116.80, p < .001, R2 = 0.05 (Table 2). Higher cognitive risk scores remained significantly associated with lower cognition scores (B = −0.16, p < .001), though the effect size was reduced from the crude model. All social determinants were significant predictors of objective cognitive performance. Higher income was associated with better objective cognitive performance, with participants earning ≥$150,000 scoring 7.34 points higher than those earning <$20,000 (p < .001). White participants scored significantly higher on cognition than non-white participants (B = 5.76, p < .001). Even after controlling for income and race, sexual orientation remained a significant predictor of cognition (B = 4.26, p < .001).
Step 3: Adding Risk Factors
As an exploratory analysis, we expanded the regression model to include additional risk factors identified by Livingston et al. (2024): hypertension, hearing loss, and vision loss. The overall model was significant F(10, 15,351) = 84.96, p < .001, R2 = 0.05 (Table 2). Hypertension and hearing loss were both significantly associated with lower objective cognitive performance (B = −1.06, p < .001 and B = −0.96, p = .009, respectively). Vision loss was not a significant predictor (B = −0.17, p = .710). Sexual orientation remained a significant predictor of cognition (B = 4.23, p < .001), even after controlling for hypertension, hearing loss, vision loss, race, and income.
Discussion
The purpose of this paper was to explore differences in cognitive risk scores by sexual orientation and to examine the association between risk scores and objective cognition in LGB and heterosexual groups. Our findings provide several noteworthy insights.
Unexpectedly, LGB participants had lower mean ANU-ADRI scores in comparison to heterosexual participants. Upon examination of ANU-ADRI subcomponents, differences emerged in age, depression, smoking, social engagement, and fish consumption. Given that the ANU-ADRI heavily weights age (e.g., an 80-year-old female receives +21 points for age/sex; in comparison, a current smoker receives +4 points), and the LGB participants were significantly younger than the heterosexual participants, this difference may be driven by age. However, other subcomponents were consistent with previous literature. For example, LGB participants had higher rates of depression and depression symptoms, aligning with established findings indicating higher prevalence of depression among sexual minorities (e.g., Fredriksen-Goldsen et al., 2013; Ross et al., 2018; Wittgens et al., 2022). Additionally, higher smoking rates among LGB individuals have been well documented (J. Li et al., 2021).
Social engagement was also lower among LGB participants in comparison to heterosexual participants, though this finding should be interpreted with caution. The calculation of social engagement for the ANU-ADRI is based on five domains: marital status, living arrangements, frequency of participation in social activities, social network/contact with close friends, and presence of a confidant. Given that LGB adults are historically less likely to marry and more likely to live alone, this measure may not capture actual social support which may include chosen family, LGBTQ+ community, and online social networks (Grady & Stinchcombe, 2025; Humble, 2021). Therefore, lower social engagement scores among LGB participants may reflect a misclassification rather than a true deficit. Future research should incorporate more inclusive measures of social support that take into account the unique social support structures within LGBTQ+ populations.
In terms of overall objective cognition score, LGB participants had significantly higher scores in comparison to heterosexual participants. While previous research has demonstrated that LGB adults have higher rates of cognitive impairment (Hsieh et al., 2021; Liu et al., 2021), subjective cognitive decline (Flatt et al., 2021), and concentration complaints (Jacob et al., 2021), emerging evidence suggests that LGB adults perform the same or better on cognitive tasks. For instance, Manca et al. (2022) found that older adults in same-sex relationships performed better on measures of episodic memory in comparison to those in different-sex relationships. While Forrester et al.’s (2019) biopsychosocial framework of minority aging suggests that psychosocial, behavioural, and physical/biological factors influence cognitive functioning across the lifecourse, our results align more closely with Correro and Nielson (2020), who suggest that protective factors such as social support, LGBTQ+ community engagement, and identity acceptance might foster cognitive resilience despite minority stress.
In the overall sample, higher ANU-ADRI scores were significantly associated with lower objective cognition scores. This is in line with previous work that found that higher ANU-ADRI scores were significantly related to worse cognition at baseline (Hall et al., 2024). While longitudinal analyses are necessary to confirm these relationships, our findings provide preliminary support for the ANU-ADRI’s applicability within the CLSA.
In linear regression models, sexual orientation remained a significant predictor of objective cognitive performance even after adjusting for ANU-ADRI score, race, and income. While we are unable to draw causal conclusions from cross-sectional data, these findings indicate that current risk assessment tools may overlook critical sociodemographic characteristics such as sexual orientation. Given the significant variance explained by these variables at baseline, longitudinal research will be essential to understand their long-term impact on cognitive trajectories.
We also explored additional dementia risk factors identified by Livingston et al. (2024), and found that hypertension and hearing loss were significantly associated with lower objective cognitive performance, while vision loss was not. Vision loss may not have impacted cognition as it primarily affects cognition in late life, and particularly when left untreated (Livingston et al., 2024). Incorporating these updated risk factors into future cognitive risk score assessments might improve predictive power. Newer tools are being developed that include additional risk factors such as hypertension, stroke, atrial fibrillation, and insomnia to help guide prevention efforts (e.g., CogDrisk; Anstey et al., 2022; Huque et al., 2023).
Our findings suggest that sociodemographic variables, including sexual orientation, account for additional variance in objective cognitive performance. Distinctive features inherent to the aging trajectories of sexual minorities may contribute to heightened cognitive risk or, alternatively, serve as mechanisms of resilience. For example, HIV diagnoses largely impact members of gay and bisexual men communities, and HIV is associated with increased risk for cognitive impairment (Deng et al., 2021; Eaton et al., 2017). Additionally, LGB people are more likely to experience social stressors throughout the lifecourse (i.e., experiences of minority stress; Meyer, 2003) which are risk factors for cognitive impairment (Correro & Nielson, 2020). Although marriage and common-law relationships (which are identified as protective in the ANU-ADRI framework) are less prevalent among LGB people, many LGB people exhibit rich social support networks and interdependence through fictive kin (i.e., chosen family; Brotman et al., 2007). Accordingly, while the ANU-ADRI offers a valuable framework, its applicability must be interpreted within the context of diverse social and cultural conditions and individual identities. Future research should evaluate cognitive risk across sexual orientations, and consider whether cognitive risk models require adaptation to more fully capture unique lifecourse experiences.
This study presents multiple strengths. The use of the Comprehensive cohort in the CLSA provided a robust sample size allowing for detailed comparisons. To our knowledge, this is the first time the ANU-ADRI risk scores have been mapped onto variables within the CLSA. We established a methodological foundation for future longitudinal examinations of cognitive trajectories within the CLSA. Additionally, our findings emphasize the necessity of incorporating axes of diversity into cognitive risk calculations, including sexual orientation, race, and income. Our preliminary evidence suggests that a one-size-fits-all approach to cognitive risk may not fit minoritized populations.
Our study also carries several limitations. The cross-sectional nature of our data prevents causal interpretations regarding prediction of dementia and cognitive decline. Despite efforts to map CLSA variables closely onto the ANU-ADRI, minor differences in methodologies (e.g., wording of questions) could introduce variability in interpretation. Data were managed using listwise deletion; however, missingness analyses suggested minimal risk of sampling bias.
Additionally, while our sample was drawn from a large, nation-wide study, it was not a specifically LGB-focused study. This may have limited LGB representation due to hesitance to disclose sexual orientation and mistrust related to previous discrimination among healthcare providers and researchers. The relatively small sample of LGB participants (approximately 2% of the CLSA sample) precluded subgroup analyses within sexual minority identities. LGB people are a heterogeneous population, and combining these groups is a limitation of this study. Sexual minority older adults have lived through historical periods of heightened stigma and structural exclusion, which may introduce survivorship and selection biases in population-based cohorts such as the CLSA. Consequently, demographic differences between LGB and heterosexual participants (e.g., age, education) may limit the generalizability of group comparisons. Future research should include larger samples of older LGB adults in order to adequately explore the differences across these subgroups.
Despite these limitations, our findings demonstrate meaningful differences between heterosexual and LGB participants, and highlight the predictive value of ANU-ADRI scores for objective cognitive performance. This study provides the foundation for longitudinal exploration and underscores the importance of inclusive risk assessments to accurately represent diverse aging populations.
Conclusion
This study provides novel insights into the complexities of cognitive aging among sexual minority populations, and highlights both vulnerabilities due to minority stress and potential protective factors fostering resilience. Despite elevated risk factors such as depression and smoking, LGB participants exhibited lower cognitive risk scores and better objective cognition scores in comparison to their heterosexual peers. These findings may be influenced by younger age among LGB participants. Overall, our findings suggest that traditional cognitive risk assessments may not accurately capture the diverse experiences of minoritized groups. Future research should explore more inclusive cognitive risk assessments that include intersectional factors to better understand cognitive aging among diverse populations.
Supplemental Material
Supplemental Material - Associations Between Cognitive Risk Scores and Objective Cognition by Sexual Orientation: Evidence From the CLSA
Supplemental Material for Associations Between Cognitive Risk Scores and Objective Cognition by Sexual Orientation: Evidence From the CLSA by Alexandra Grady and Arne Stinchcombe in Research on Aging
Footnotes
Acknowledgements
This research was made possible using the data collected by the Canadian Longitudinal Study on Aging (CLSA). Funding for the Canadian Longitudinal Study on Aging (CLSA) is provided by the Government of Canada through the Canadian Institutes of Health Research (CIHR) under grant reference: LSA 94473 and the Canada Foundation for Innovation, as well as the following provinces, Newfoundland, Nova Scotia, Quebec, Ontario, Manitoba, Alberta, and British Columbia. This research has been conducted using the CLSA Baseline Comprehensive Dataset version 7.0, under Application Number 2206027. The CLSA is led by Drs. Parminder Raina, Christina Wolfson and Susan Kirkland. The opinions expressed in this manuscript are the author’s own and do not reflect the views of the Canadian Longitudinal Study on Aging. Data are available from the Canadian Longitudinal Study on aging (![]() ) for researchers who meet the criteria for access to de-identified CLSA data. The time and commitment of the participants to the CLSA study platform is gratefully acknowledged, without whom this research would not be possible. The development, testing and validation of the Short Diet Questionnaire (SDQ) were carried out among NuAge study participants as part of the Canadian Longitudinal Study on Aging (CLSA) Phase II validation studies, CIHR 2006–2008. The NuAge study was supported by the Canadian Institutes for Health Research (CIHR), Grant number MOP-62842, and the Quebec Network for Research on Aging, a network funded by the Fonds de Recherche du Québec–Santé. CLSA is supported by the Canadian Institutes of Health Research (CIHR).
) for researchers who meet the criteria for access to de-identified CLSA data. The time and commitment of the participants to the CLSA study platform is gratefully acknowledged, without whom this research would not be possible. The development, testing and validation of the Short Diet Questionnaire (SDQ) were carried out among NuAge study participants as part of the Canadian Longitudinal Study on Aging (CLSA) Phase II validation studies, CIHR 2006–2008. The NuAge study was supported by the Canadian Institutes for Health Research (CIHR), Grant number MOP-62842, and the Quebec Network for Research on Aging, a network funded by the Fonds de Recherche du Québec–Santé. CLSA is supported by the Canadian Institutes of Health Research (CIHR).
Funding
The authors disclosed receipt of the following financial support for the research, authorship, and/or publication of this article: Alexandra Grady holds a Canada Graduate Scholarship Doctoral Award (CGS-D) from the Social Sciences and Humanities Research Council of Canada. Dr. Arne Stinchcombe holds a PHAC/CIHR Research Chair in Applied Public Health.
Declaration of Conflicting Interests
The authors declared no potential conflicts of interest with respect to the research, authorship, and/or publication of this article.
Supplemental Material
Supplemental material for this article is available online.
Author Biographies
References
Supplementary Material
Please find the following supplemental material available below.
For Open Access articles published under a Creative Commons License, all supplemental material carries the same license as the article it is associated with.
For non-Open Access articles published, all supplemental material carries a non-exclusive license, and permission requests for re-use of supplemental material or any part of supplemental material shall be sent directly to the copyright owner as specified in the copyright notice associated with the article.