
Abstract
A systematic analysis and comparison was conducted of the psychometric properties of standard (paper-and-pencil) and computerized sociometry and peer assessments. The standard assessment took place with 817 children (47.5% boys) in 34 fifth- and sixth-grade classrooms of 28 elementary schools. The computerized assessment took place with 893 children (52.3% boys) in 35 fifth- and sixth-grade classrooms of 30 elementary schools. The computerized method yielded more nominations given and received and fewer missing data. Correlations among behavioural and relational constructs followed similar patterns in both methods, but were generally stronger in the computerized method. Voter agreement was the same in both methods. The computerized method resulted in higher internal consistency of sociometric and peer assessment constructs. The methods were validated by predicting preference and popularity from behavioural and relational characteristics. The two methods yielded the same pattern of results. The advantages and disadvantages of both assessment methods were discussed.
Sociometric and peer assessment methods have been used over the 75 years since Moreno (1934) designed the procedure. Traditionally, these data are collected with standard paper-and-pencil questionnaires. More recently, due to technological innovations, computerized data collection is becoming more common in the social sciences. Such methods are gaining favour because they can save time, money, and energy in large data collections (Bartram, 2006; Garb, 2007). Because sociometric and peer assessment data are often collected in multiple classrooms or grades of multiple schools, it is becoming increasingly attractive to collect these data electronically. However, there are as yet no systematic comparisons of the data that result from computerized and standard (paper-and-pencil) assessments. The current study made that comparison.
Sociometry and peer assessment methods are used to examine relationships and peer affiliations in groups of youth. Peer assessment methods are used to measure behavioural characteristics, while sociometric methods are used to measure forms of peer status (Bukowski, Cillessen, & Valásquez, 2012). Peer nominations are the most common way to collect this data. With peer nominations, the respondents are informants of their own affiliations and preferences, and of the behavioural characteristics of the other members of the reference group. The reference group typically includes all members of a school classroom or grade. Traditionally, the respondents receive a paper questionnaire that includes all sociometric and peer assessment questions. Each respondent then nominates as many or as few peers for each question (relationship or behaviour) by writing down their names or code numbers. Sometimes, a roster with the names of all members of the reference group is provided below each question, so that respondents can simply check off the names they want to nominate. Nominations received are then counted for each group member and transformed into several relational and behavioural constructs.
There are several variations of this procedure. For example, researchers are still debating the use of same- or cross-sex nominations and limited or unlimited nominations (Bukowski et al., 2012; Cillessen & Marks, 2011). Still, the basic principles of these assessments are always the same; each member of a reference group is seen as an informant who is asked to name group members for several constructs. Yet, new technologies give researchers the opportunity to collect sociometric and peer assessment data using computers instead of paper questionnaires (e.g., de Bruyn & Cillessen, 2006; de Bruyn, Cillessen, & Wissink, 2010). This new technology has advantages and creates opportunities, but may also have implications for the psychometric properties of the data.
Profits and possibilities
An important advantage of computerized assessment is the possibility to collect more data in less time (Garb, 2007). First, participants no longer have to fill in their answers by hand, which is time-consuming and can cause frustrations and fatigue (Poulin & Dishion, 2008). In computerized assessments, respondents can answer more rapidly by clicking on predefined choices. This reduces nomination time per peer, and makes it possible to ask additional questions in a fixed amount of time (e.g., one class period). Second, data processing no longer requires a significant amount of time, as data are stored directly on the computers. Third, there is a large gain in the flexibility to adjust and correct data collection procedures and questions, because the electronic scripts can be adjusted without having to reprint a large number of questionnaires (Pettit, 2002).
Computerized assessment not only saves time, but also money. The cost of computers and specialized software are initially high. However, these costs are off-set by saving the costs of paper questionnaires. In large projects, multiplying paper questionnaires can be more expensive than purchasing simple laptop or netbook computers. Moreover, the latter can be used for multiple projects over multiple years, eventually leading to a large reduction in research costs. Thus, computerized data collection can quickly become profitable for large scale and/or longitudinal studies (Bennet, 2006).
Computerized assessment can also solve some of the traditional problems of data collection among peers. First, a common procedure is the method of unlimited nominations, allowing participants to name as many or as few peers as they want for each question. Some researchers prefer limited nominations that take less time to collect, are easier to analyse and are equally reliable and valid (Newcomb & Bukowski, 1983; Terry, 2000). In computerized assessment, the names of all peers are presented on screens and participants simply click on those names. They no longer have to write down names or code numbers. As a result, computerized assessment substantially reduces the extra time needed for unlimited nominations. Moreover, computerized assessment easily enables the researcher to use both limited and unlimited nominations within the same questionnaire.
Another problem with standard data collection among peers is the risk of order effects, both with respect to nominees and with respect to questions. When youths receive a list with the names (and code numbers) of the peers they can choose from, there is a risk that they name those at the top of the list more frequently than those at the bottom (Poulin & Dishion, 2008), regardless of the content of the question. In addition, questions are often presented in a fixed order, which may also result in order effects. One solution to both potential sources of order effects is to randomize the names of the peers as well as the order of questions for each participant. This is typically logistically impossible with standard questionnaires on paper. With computerized assessment, the randomization of questions and nominees can be programmed easily.
Further, computerized assessment is less error-prone during data collection and data processing. Respondents will make fewer errors while filling in the answers on the computer, because answers are predefined (Butcher, Perry, & Atlis, 2000). In addition, poor handwriting will no longer lead to unusable answers (Garb, 2007). It is also less likely that respondents will accidentally skip questions, because they can be prompted to answer each question before they can continue to the next one (Garb, 2007). The computerized questionnaire can be programmed in such a way that questions are displayed on screen one at a time. This reduces any distraction caused by extra information that is not required to answer the current question (e.g., next questions, other instructions, being aware of the fact that many questions still have to be answered). Further, computerized questionnaires can also be programmed so as to make the task more enjoyable (e.g., sounds, animations, pictures, colours), which reduces the risk of errors due to fatigue or frustration. Finally, data entry errors by the research team are omitted, because data are stored directly and do not have to be entered by hand (Butcher et al., 2000). The prevention of these errors will lead to fewer missing data and increased data reliability.
Finally, there are ethical advantages of computerized assessment regarding the confidentiality of data collection and the anonymity of data storage. Martin and Nagao (1989) and Kiesler and Sproul (1986) found that computerized questionnaires lead to less social desirability. This could be the result of stronger feelings of anonymity in computerized assessment, because the data is stored directly on the computer, and names are immediately replaced by code numbers. This direct replacement increases the sense of confidentiality for the participants (Bell-Dolan & Wessler, 1994). Some researchers indeed found that participants preferred computerized assessment over a face-to-face interview and were more comfortable to answer questions about socially sensitive behaviours on a computer (Davis, Hoffman, Morse, & Luehr, 1992; Davis & Morse, 1992; Turner et al., 1998). In addition, the immediate conversion of names into anonymous code numbers reduces ethical concerns regarding the storing of names for research purposes (Mayeux, Underwood, & Risser, 2007).
Constraints and complications
Although there are many profits and possibilities to computerized assessments, there are also some potential constraints and complications. First, respondents might give more votes in computerized nominations, because it is easier and faster to click on names than to write down multiple names or code numbers. As a result, the scale of the psychological constructs that are measured may become broader and the associations among constructs may differ as a result (Drasgow & Mattern, 2006; Mead & Drasgow, 1993). In a meta-analysis, Mead and Drasgow (1993) indeed showed that scale scores and constructs of cognitive ability sometimes differ between computerized and paper-and-pencil tests, especially with tests that rely on speed and time limitations. This is in line with Bartram (2006), who showed that computerized assessment is often equal to paper assessment, as long as it is carefully designed and is not timed.
The reliability of the scores can also be affected negatively if there is an increase of the random response rate. It has been shown that random responses are more likely to occur with computerized assessment than with paper-and-pencil assessment (Beach, 1989) and interviews (Locke & Gilbert, 1995). Computerized data collection makes it possible to force respondents to answer each question and to nominate at least one member of the reference group in order to reduce the amount of missing data. However, it is possible that respondents will be pressured into giving random votes. Moreover, it has been argued that the most valid representation of the social structure in a group can only be acquired if each respondent participates spontaneously and is not coerced into making choices (Fox, 1987; Moreno, 1934, 1951; Terry, 1991). By encouraging respondents to complete each question, the amount of missing data will decrease. At the same time, the data can become less representative and the reliability of the method may be affected.
The current study
Given the general increase of computerized data collection in the social sciences, computerized sociometric and peer assessment is also becoming more common. Unfortunately, there are as yet no systematic comparisons of the data that result from computerized versus standard (paper-and-pencil) data collections. The current study therefore compared the reliability and validity of computerized and paper assessments.
First, the number of nominations and missing data were examined. It was expected that computerized assessment would lead to more nominations given and received, and to less missing data. Second, the correlations between scores for sociometric status and social behaviour derived from both methods were examined. It is possible that computerized assessment may lead to a different pattern of correlations among constructs (Mead & Drasgow, 1993). It is also possible that the pattern of correlations stays the same.
Third, the internal consistency reliability of all sociometric and peer assessment constructs was examined to test whether they are influenced by assessment method. Fourth, the interrater reliability among respondents was examined by determining and comparing the agreement among participants in both assessment methods. Opposing predictions are possible. On the one hand, construct reliability and voter agreement may be negatively affected by the computerized method if it increases the random response rate (e.g., Locke & Gilbert, 1995). On the other hand, the decrease in missing data in the computerized assessment may lead to more reliable votes. In addition, the increased feelings of anonymity during responding could improve the validity of the peer affiliation and behaviour scores.
Fifth and finally, the predictive validity of the peer assessments of social behaviour for the sociometric assessments of popularity and preference was compared between both methods. If the pattern of associations among constructs is affected, the associations between measures of social behaviours and measures of preference and popularity may also differ between both methods. Yet, if construct reliability and respondent agreement are equal in both methods, no differences in predictive validity may occur.
Method
Participants and procedure
Participants were part of two related studies on peer relations from the same lab using similar methods. The standard sociometric and peer assessment was part of a study on peer affiliation and classroom climate (van den Berg, Segers, & Cillessen, 2011). The computerized assessment was part of the ongoing Nijmegen Longitudinal Study on the social development of youth (van Bakel & Riksen-Walraven, 2002).
The standard assessment took place in 2009 in 34 fifth- and sixth-grade classrooms in 28 elementary schools. Average classroom size was 24.03 (range 12–34). Participants were 817 children (47.5% boys), with a mean age of 11.30 years (SD = .66, range 9.20–13.73 years). The computerized assessment took place in 2010 in 35 fifth- and sixth-grade classrooms in 30 elementary schools. Average classroom size was 25.51 (range 15–32). Participants were 893 children (52.1% boys), with a mean age of 12.02 years (SD = .62, range 9.50–13.83).
The schools were located in the same area in The Netherlands with similar demographics. Data were collected in a 45- to 60-minute classroom session. The samples did not differ in classroom size or gender composition. Because the standard assessment took place in the first semester of the school year, and the computerized assessment in the second semester, children in the computerized assessment were on average eight months older.
In all classrooms, teachers gave their active consent for participation. With regard to parental permission passive consent procedures were used. Teachers were asked to give the parents or guardians of all students a letter, in which the study was fully explained, and in which they could indicate if they did not want their child to participate. In the standard assessment classrooms, no parents refused participation. In the computerized assessment classrooms, one teacher decided not to participate and five children were not allowed by their parents to fill in the questionnaire.
Sociometric and peer assessments
The standard and computerized assessments used the same 4 sociometric questions and 7 peer-assessment questions, which were worded identically. The classroom was the reference group, allowing both same-sex and other-sex choices and unlimited nominations. In both cases, children were instructed to nominate at least one classmate for each question and to not name themselves. In both cases, students answered all questionnaires individually and worked quietly by themselves.
Participants in the standard assessment completed the questions on a paper-and-pencil questionnaire. Each child received a list with the first names of all classmates in alphabetic order, preceded by a code number. Participants were instructed to nominate classmates who best fitted each description by filling in their code numbers.
Participants in the computerized assessment completed a digital questionnaire on a netbook or desktop computer. Each question was presented at the top of a separate screen, followed by a roster with the names of their classmates below it on the same screen. The order of names was randomized for each participant, but remained the same across the 11 questions for that participant. Children named classmates for each question by clicking on their names. If a child clicked on a name, the colour of the name changed from black to gray. In this way, the child could see who he or she had nominated, while others could not easily detect a choice if they happened to see the screen. Children had to nominate at least one classmate for a question before they could go to the next question. Children could not name themselves; their names were not presented on the screens.
Popularity and preference
Preference and popularity were measured with four questions: liked most, liked least, most popular, and least popular. The number of nominations received was counted for each question and standardized to z-scores within classrooms by gender. A score for social preference was computed as the difference between the standardized (within classrooms by gender) liked most and liked least scores, and again standardizing the resulting difference scores within classrooms (Coie, Dodge, & Coppotelli, 1982). A score for popularity was computed as the difference between the standardized most popular and least popular scores, and again standardizing the resulting scores within classrooms (Parkhurst & Hopmeyer, 1998). For both preference and popularity, z-scores less than –3 or larger than +3 were truncated to –3 and +3, respectively (Tabachnick & Fidell, 2007).
Friendship and behavioural characteristics
The following peer assessment questions measured friendship and behaviours: unilateral friendship (“Who are your best friends?”), humour (“Who is funny or makes jokes often?”), victimization (“Who is bullied?”), prosocial behaviour (“Who can cooperate well with others?”), physical aggression (“Who kicks, hits, or pushes others?”), grades (“Who gets the highest grades in general?”) and withdrawn behaviour (“Who plays alone or keeps to themselves?”). Nominations received were counted for each child for each question, and standardized within classrooms by gender to z-scores to control for differences in classroom size (Coie et al., 1982). Z-scores of –3 or lower and +3 or higher were set to –3 and +3 (Tabachnick & Fidell, 2007).
Results
Descriptive statistics and correlations
Table 1 presents the means and standard deviations of the raw number of nominations given and received for each question. If a child did not nominate anyone for a question or was not present during the assessment, it was coded as missing. To avoid missing nominations, in the instructions children were asked to name at least one classmate for each question. In the computerized assessment, giving no nominations was not even possible. In the computerized assessment, the absence of nominations given indicated an interruption of the digital questionnaire or incorrect saving of answers. In the standard assessment, it was unknown if no nominations given for a question indicated an accidental skip, a deliberate refusal to answer, or an error of data processing. Therefore, the absence of nominations given was always coded as missing. The percentage missing nominations is also presented for each question. There were more missing nominations in the standard assessment, especially for negative characteristics such as victimization, physical aggression and withdrawn behaviour.
Descriptive statistics, internal consistency, and interrater agreement of standard versus computerized sociometric and peer assessments
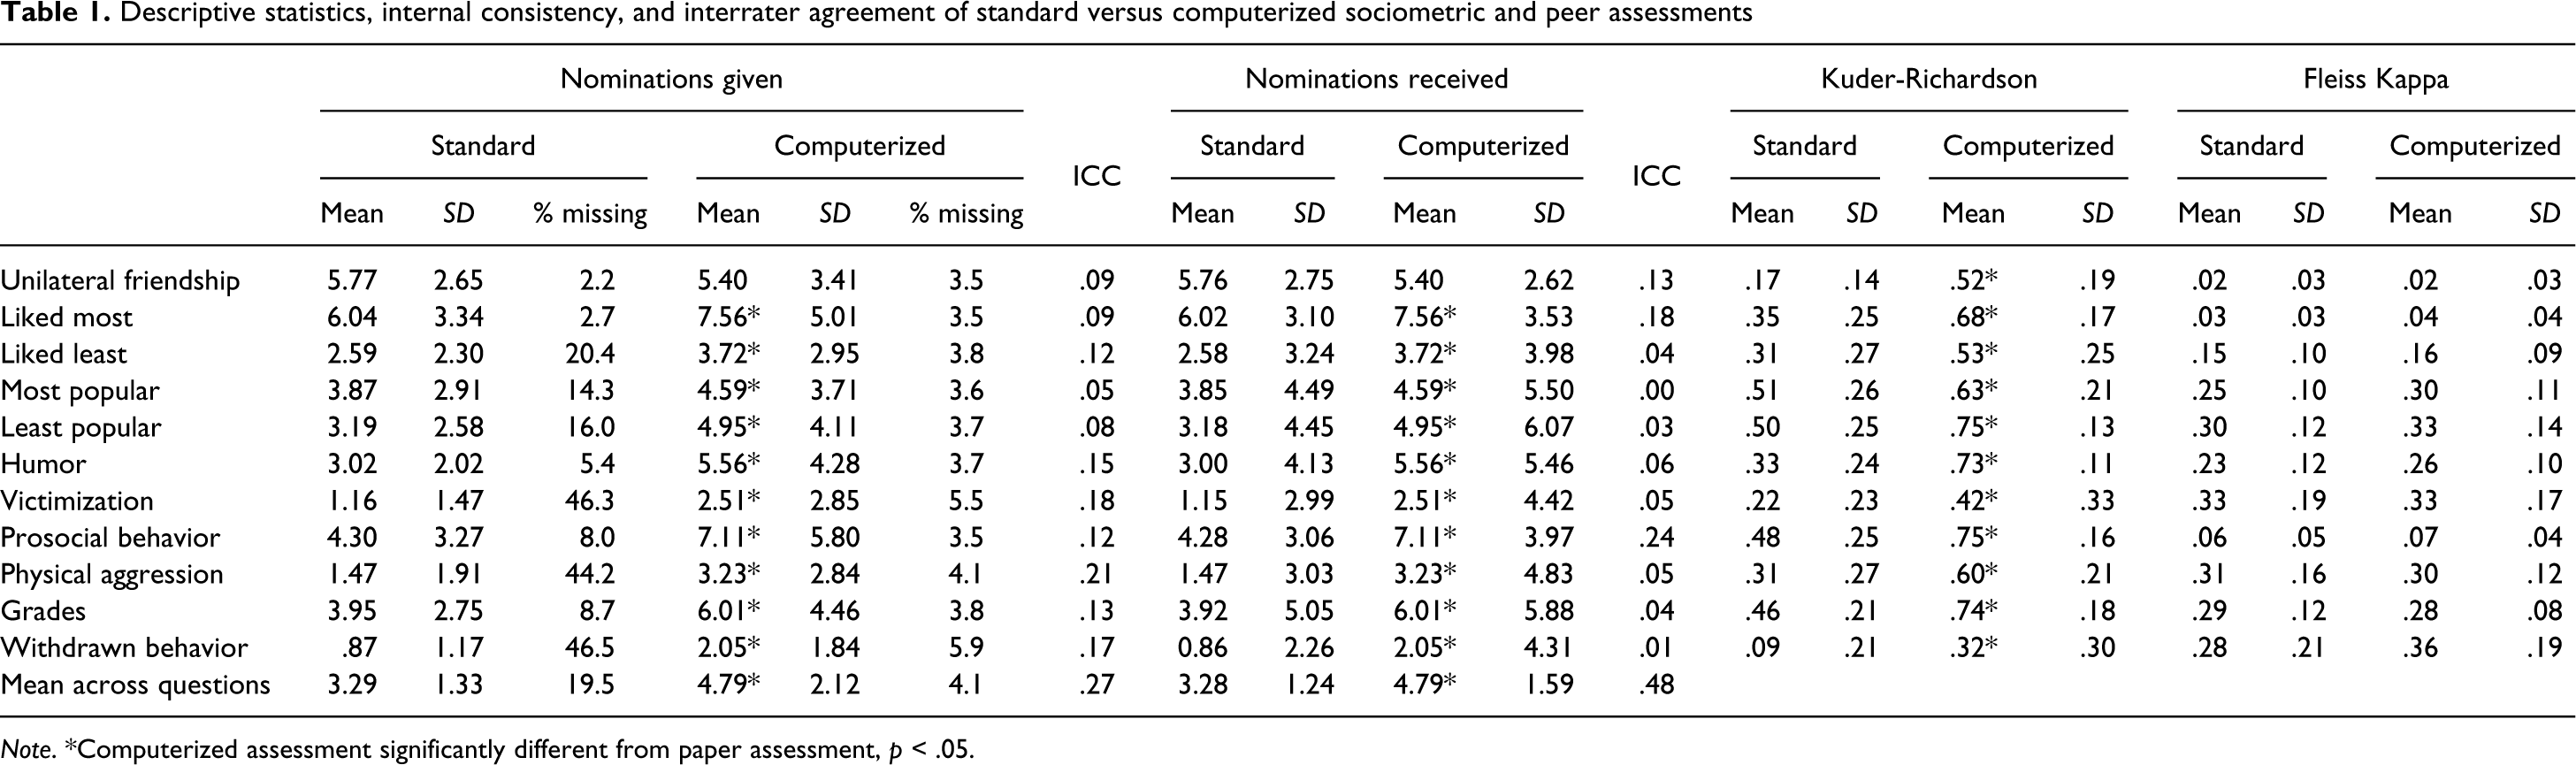
Note. *Computerized assessment significantly different from paper assessment, p < .05.
Intraclass correlations (ICCs) were calculated to measure how much of the variance in nominations given and received was due to classroom differences. Because the ICC was higher than .05 for most questions, Multilevel Linear Mixed Models with random intercepts were used to test the differences between the standard and computerized assessments in the raw numbers of nominations given and received for unilateral friendship, likeability, popularity, humour, victimization, prosocial behaviour, physical aggression, grades and withdrawn behaviour, allowing the intercepts to vary across classrooms. For all questions except unilateral friendship, significantly more nominations were given and received in the computerized assessment than in the standard assessment. The average number of nominations given and received across all questions was also significantly higher in the computerized assessment than in the standard assessment. Thus, the computerized method yielded more nominations given and received and fewer missing data.
Table 2 presents the correlations among the sociometric and peer assessment scores from both methods. Due to the large samples, almost all correlations differed significantly from 0. Fisher’s r-to-z transformations tested whether the correlations differed significantly between methods; 48 did (62%) and 30 did not (38%). Examination of the exact values of the 48 differing correlations indicated a similar pattern and direction of associations between methods (43 out of 48, 90%). However, these correlations were on average stronger in the computerized method than in the standard method (36 out of 48, 75%).
Correlations among sociometric and peer assessments with standard (below diagonal) versus computerized (above diagonal) methods
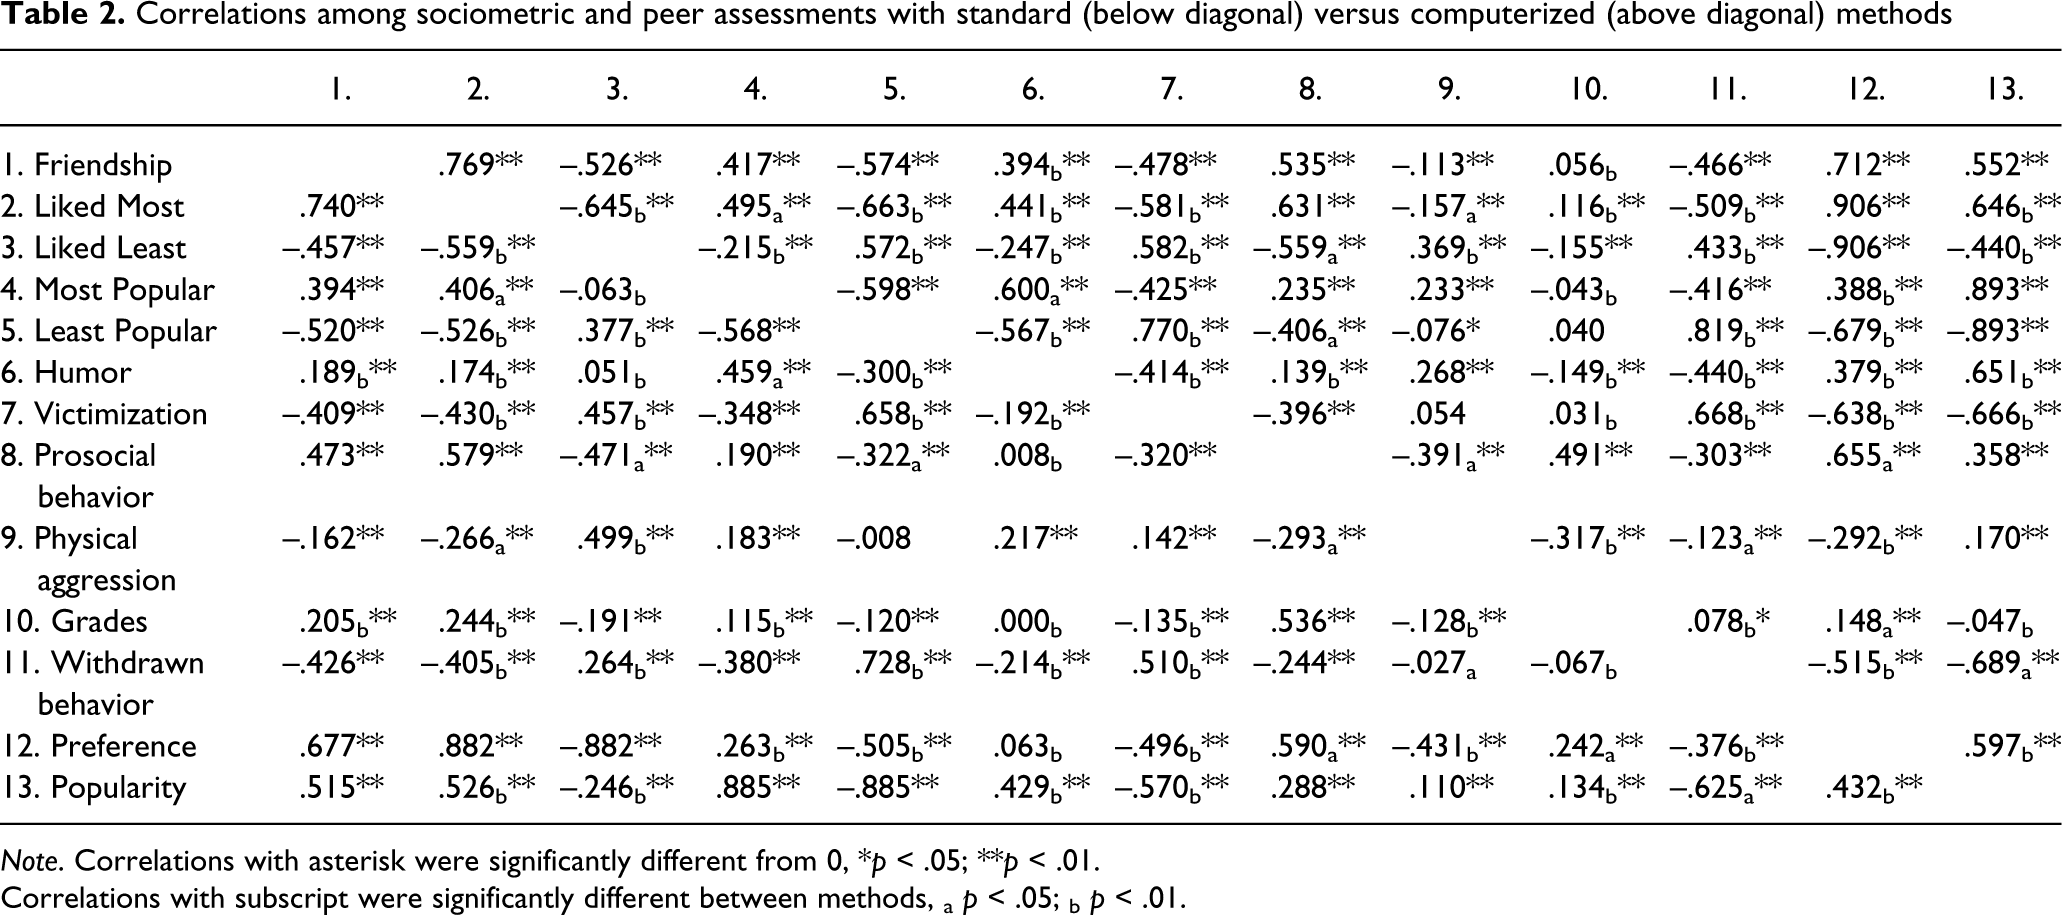
Note. Correlations with asterisk were significantly different from 0, *p < .05; **p < .01.
Correlations with subscript were significantly different between methods, a p < .05; b p < .01.
Given some variability in how researchers standardize sociometric scores, the same analyses were conducted with scores standardized by classroom only, instead of by sex and classroom. The results were mostly the same except for an additional four correlations (of victimization with prosocial behaviour and friendship, of grades with least popular, and of prosocial behaviour with popularity) that differed between methods, whereas the correlation of physical aggression with prosocial behaviour no longer differed between methods.
Internal consistency and interrater reliability
Kuder-Richardson Formula 20 (Kuder & Richardson, 1937) was used to test whether the internal consistency of sociometric and behaviour constructs differed between methods (see Table 1). This formula is the same as Cronbach’s α, but modified for dichotomous data. The nominations for each question were converted to a 0–1 matrix for each classroom with voters in rows and votees in columns. A 1 in a cell of this matrix indicated that a child nominated a peer, a 0 that a child did not nominate that peer for this question. If a child named no one or named everyone in the classroom, the child’s responses were coded as missing. As expected, the reliability of measurement was higher for popularity than for likeability (liked most and liked least). In addition, the internal consistencies for withdrawn behaviour and victimization were lower than for the other constructs.
A Multilevel Linear Mixed Model with random intercepts was run to test the effect of method (standard vs. computerized) on the classroom internal consistencies (KR-20’s) for unilateral friendship, likeability, popularity, humour, victimization, prosocial behaviour, physical aggression, grades and withdrawn behaviour. Intercepts were allowed to vary across schools. For each question, internal consistency was higher in the computerized assessment than in the standard assessment. Thus, the constructs were more homogeneous when measured with the computerized method than with the standard method.
Furthermore, Fleiss Kappa’s were calculated for each question in each classroom, to test whether agreement between voters (interrater reliability) differed between the computerized and standard assessments. Fleiss Kappa’s is similar to Cohen’s kappa, but is designed to measure agreement between more than two raters (Fleiss, 1971). Again, 0–1 matrices of the nominations for each question were used.
This time, the rows represented the votees and the columns the voters. The results showed poor agreement (κ < .20; Landis & Koch, 1977) among children about the dyadic constructs, such as unilateral friendship and likeability (like most and like least). The interrater reliabilities of reputational constructs, such as popularity and social exclusion (victimization and withdrawn behaviour) were fair (.20 > κ < .40; Landis & Koch, 1977).
Again, a Multilevel Linear Mixed Model with random intercepts was run to test the effect of methods (standard vs. computerized) on the classroom interrater reliabilities (Fleiss Kappa’s) for unilateral friendship, likeability, popularity, humour, victimization, prosocial behaviour, physical aggression, grades, and withdrawn behaviour. The intercepts were allowed to vary across schools. Interrater reliability did not differ significantly between methods for all questions. Thus, the reliability of agreement did not change when questions were measured electronically, even though more votes were given.
Predictive validity
To further validate and compare the two methods, a Multilevel Linear Mixed Model with random intercepts were run to predict preference and popularity from unilateral friendship, humour, victimization, prosocial behaviour, physical aggression, grades, withdrawn behaviour, in interaction with assessment condition (0 = standard, 1 = computerized). Intercepts were allowed to vary across classrooms. The results are shown in Table 3.
Prediction of Preference and Popularity from Peer Assessments Using Standard Versus Computerized Methods
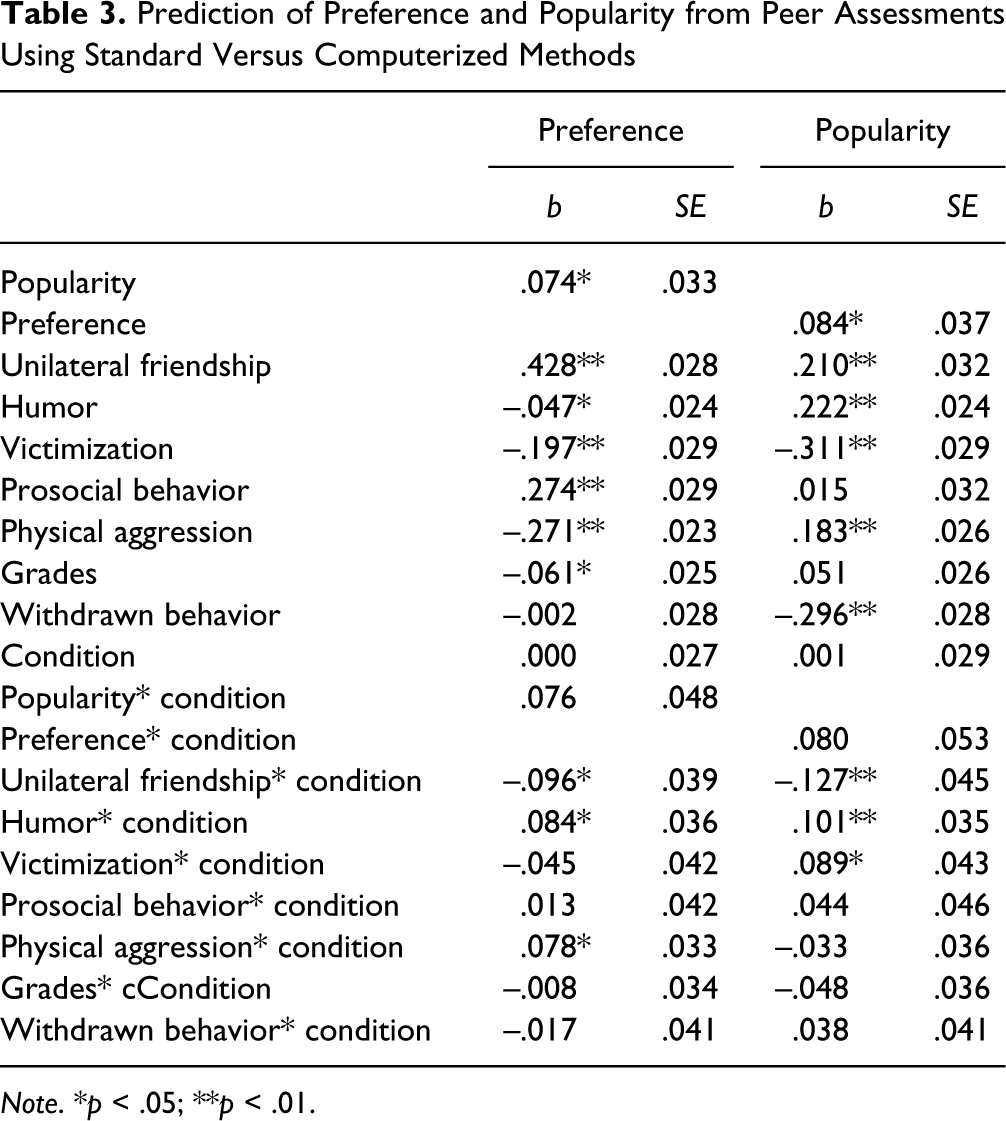
Note. *p < .05; **p < .01.
Preference was positively predicted by popularity, F(1, 1548) = 5.03, p = .025, and prosocial behaviour, F(1, 1548) = 91.30, p < .01, in both assessment methods. Children who were seen as more popular and prosocial were also more preferred. Preference was negatively predicted by grades, F(1, 1548) = 5.92, p = .015, and victimization, F(1, 1548) = 7.25, p < .01, indicating that children who received more nominations for good grades or victimization were less preferred. There were significant interaction effects of condition with unilateral friendship, humour, and physical aggression. To interpret each interaction, the multilevel model was repeated for the standard and computerized assessments separately, without the main effect of condition and the interaction terms.
These analyses showed that preference was significantly predicted by unilateral friendships in both conditions. However, the estimated slopes were steeper in the standard assessment, b = .428, t(720) = 14.75, p < .01, than in the computerized assessment, b = .332, t(828) = 12.94, p < .01. For physical aggression significant negative associations were found with preference in both conditions. However, the estimated slopes were steeper in the standard assessment, b = –.271, t(720) = –10.96, p < .01, than in the computerized assessment, b = –.194, t(828) = –8.57, p < .01. Finally, although a significant condition by humour interaction was found, preference was not significantly predicted by humour in the computerized assessment, b = .037, t(828) = 1.434, p = .152, nor in the standard assessment, b = –.047, t(720) = –1.89, p = .060. The predictions of preference by popularity, victimization, prosocial behaviour, grades, and withdrawal did not differ between methods.
Further, popularity was positively predicted by preference, F(1, 1548) = 5.13, p = .024, and physical aggression, F(1, 1548) = 49.67, p < .01. Children who were more preferred and physically aggressive were also seen as more popular. Popularity was negatively predicted by withdrawn behaviour, F(1, 1548) = 113.25, p < .01; children who scored higher on withdrawn behaviour were seen as less popular.
There were significant interaction effects of condition with unilateral friendship, humour, and victimization. Unilateral friendship significantly predicted popularity in both conditions, but significantly stronger in the standard assessment, b = .209, t(720) = 6.11, p < .01, than in the computerized assessment, b = .083, t(828) = 2.84, p = .005. Humour also significantly predicted popularity in both conditions. Yet, the estimated slopes were steeper in the computerized assessment, b = .323, t(828) = 13.40, p < .01, than in the standard assessment, b = .222, t(720) = 8.75, p < .01. Finally, victimization negatively predicted popularity in both conditions. However, the estimated slopes were steeper in the standard assessment, b = –.311, t(720) = –10.07, p < .01, than in the computerized assessment, b = –.223, t(828) = –7.35, p < .01. The predictions of popularity by preference, prosocial behaviour, physical aggression, grades, and withdrawn behaviour did not differ between methods.
The same analyses were again conducted with scores standardized by classroom only. The results were the same when predicting preference, except for an additional significant condition by victimization effect, F(1, 1710) = 5.76, p = .016. The association between victimization on low preference was stronger in the computerized assessment, b = –.252, t(893) = –8.80, p <.01, than in the standard assessment, b = –.155, t(817) = –5.482, p <.01. With regard to popularity the results were also the same, except that the interactions of humour and victimization with condition disappeared (their main effects remained significant).
Discussion
This study was a systematic analysis and comparison of the psychometric properties of standard (paper-and-pencil) and computerized sociometric and peer assessments. The computerized method yielded more nominations and fewer missing data. Correlations among behavioural and relational constructs from both methods followed a similar pattern, but were stronger in the computerized method. Internal consistency of sociometric and peer constructs was higher in the computerized method, while interrater reliability was the same between methods. The validity of scores derived from both methods was tested by predicting preference and popularity from behavioural and relational characteristics. Three of the eight predictions of preference and three of the eight predictions of popularity differed in size between methods. Yet, all estimates were in the same direction between methods.
The clearest difference between standard and computerized assessments regarded the number of votes given and received. Even though the instructions were the same and unlimited nominations were allowed in both methods, more nominations were given and therefore also received in the computerized method. Apparently it is easier to click on names than to write them down. This difference in number of votes also creates a difference in the variance in the data. If more votes are given, the response scale is larger and there is more variance. It is therefore not surprising that most correlations differed in size between methods. Still, their pattern and directions were similar.
There was also a clear reduction of missing data in the computerized method, in particular for more delicate questions such as victimization and physical aggression. Part of this reduction can be explained by the fact that children could not skip questions on the computer. One could argue that this may have led to more random answers which would reduce interrater reliability. In contrast, interrater reliability was higher in the computerized method. Participants may have felt more secure and comfortable reporting socially sensitive behaviours on computers, because they could see for themselves that their answers were stored anonymously. This is in line with Davis and colleagues (1992, 1998), who also showed that participants prefer computerized assessments for socially sensitive questions.
Even though the reliability and validity were not negatively affected by the computerized assessment, there were still some constraints and complications. First, reciprocity of votes is a key element in studies of friendship and network or clique structures (Furman, 1996; Kindermann & Gest, 2009). Yet, when more votes are given it can also lead to more reciprocal votes. This increase in reciprocal votes might be the true representation of the actual social relationships of the respondents, but may also have implications for the analyses and interpretation of the results. This should be kept in mind when administering friendship or network data electronically.
In the computerized condition, the script was programmed so that children could not proceed to the next question before nominating at least one classmate. There was an important technical reason to build in such a procedure, which makes it more difficult for children to skip questions. If one collects data with paper questionnaires, it is easy for the researcher to determine if children have skipped questions while filling in the questionnaire. However, on small-screen computers with only one question per page, it is easier for children to skip questions, not read the instructions, and quickly toggle through the questionnaire. Requiring children to consider at least one peer was our strategy to avoid random responding that cannot be easily detected or deterred by the researchers.
An important consideration in the current computerized format is if the one-choice requirement might induce feelings of coercion among participants. There were no indications from any of the participants in this large-scale study that this might have occurred. However, the potential of it is a human subjects concern and could be a concern for ethical review boards. Such concerns can be prevented by carefully following the ethical principles and code of conduct for psychological data collection (American Psychological Association, 2002), as we did in this study. For example, respondents were and must be told that they can stop at any given moment if they do not want to answer more questions. This emphasizes the importance of providing very careful verbal instructions, in which the purpose of the questions and the meanings of anonymity and confidentiality are carefully explained to the children.
If a researcher does not want to ask children to choose at least one peer for each question, but still wants to encourage them to consider all questions, one could add an answer option such as “I don’t know anyone for this question” or “I would prefer not to answer.” This would enable researchers to determine if a child truly did not know a classmate for the question, or might have felt uncomfortable reporting on a socially sensitive behaviour. Such answer options might also alleviate potential concerns of review boards. Future studies should determine how many participants would use such options and for what questions. It will then also be possible to examine if participants who use such questions stand out in terms of certain individual characteristics, such as a tendency to socially desirable responding, or a certain position in the peer group (e.g., victimized, withdrawn, or isolated).
A final issue concerning the one-choice instruction is its potential effect on score accuracy when the reference group is small. In a larger group, all possible sociometric roles and behaviour reputations may indeed occur at least once. In smaller groups with fewer peers, some roles or behaviours may not occur. A smaller group may not happen to include someone who is quite aggressive, quite popular, or particularly victimized. In such cases, the respondents could not really nominate a peer, but they would be asked to do so. It is thus particularly important to remember that sociometric and peer assessment scores derived from peer nominations are relative to the group within which they were collected.
The problem of not being able to name anyone for a certain question would be exacerbated for participants who are relatively new to the group, and do not yet know their peers quite well. In the current study, relatively small reference groups were used (classrooms rather than grades). Nevertheless, internal consistency and interrater agreement between voters were high. This may be due to the fact that the Dutch school system has a strong classroom structure. Students are in the same classroom with the same peers the entire day throughout the school week. Therefore, they come to know each other very well. In schools without a strong classroom structure, in which peer groups change more quickly during the day and over time, the one-choice procedure might be more problematic for respondents.
With regard to the sample equivalence, there was a significant age difference between the two samples. This study had a between-subjects design with computerized and standard assessments collected in two different samples. Both samples included students from the same grades (5–6), from the same with similar demographics, and from schools with the same structure and classrooms as the primary peer reference group. However, the children in the computer method sample were somewhat older than in the standard method sample, because the computerized assessment took place a semester later (but in the same grades). One could argue that participants in the computerized condition may have given more nominations because they knew each other longer and had more situations to recall to when making their nominations. However, we do not think that this can explain the difference between both methods. The students in these classrooms knew each other very well from very early on in the school year, given the time they spent together in this school system. We do not believe that there was a large difference in acquaintanceship between the two data collection points. In addition, previous research has shown that peer nominations given and received are highly stable over the course of one academic year (Jiang & Cillessen, 2005; Mayeux, Bellmore, & Cillessen, 2010), especially for the age group of this study.
There was also a difference in the equivalence of assessment procedure. In the standard assessment, the names of votees were presented in alphabetical order. Poulin and Dishion (2008) showed that this may lead to order effects, because respondents tend to choose nominees at the top of the list more often than those at the bottom. This could negatively affect the reliability and validity of the scores. Therefore, the names of votees were randomized between participants in the computerized condition, thus preventing potential order effects. At the same time, the difference in ordering of votees may have impacted both methods, for example, in terms of the internal consistency of scores. Yet, in the study by Poulin and Dishion children received a list of 216 to 317 names. In our study, children saw 12 to 34 classmates, which may already reduce potential order effects. It is therefore unlikely that the differences between methods in this current study can be fully explained by differences in the order in which votees were presented to respondents.
Overall, the differences between both methods of collecting peer nomination data were modest, whereas they were exactly identical in other important ways (e.g., the wording of the questions). From a broader perspective, it should be kept in mind that peer nominations, whether standard or computerized, continue to be a powerful method of collecting data on multiple dimensions of youths’ social development in a short time. In the current study, all reliability coefficients were high, irrespective of method and often higher than can be obtained from teacher, parent, or self reports. Previous reviews have also documented excellent psychometric properties of sociometric measures in general (see, e.g., Bukowski et al., 2012; Jiang & Cillessen, 2005). The sociometric constructs popularity and peer acceptance cannot easily be assessed with other methods than peer nominations; psychometric properties are much more limited when these constructs are derived from other sources. Thus, even though we reported differences between both versions of the peer assessment method, we strongly advocate for the continued use of peer nominations in social development research, in particular in light of their excellent psychometric properties in comparison to teacher, parent and self-report data. How peer nominations will compare to newer methods of data collection emerging in social development research (see Laursen, Little, & Card, 2012) is an issue for future research.
A complication that results from this new way of collecting data is the storage of data. An advantage of computerized assessment is the direct storage of data, but this requires that the data are stored and saved properly. Names should be replaced by code numbers immediately and files that link names with code numbers should be stored separately from the recoded data files. The American Psychological Association (2002, 2010) has rules for data storage and most research institutes have additional instructions. Comparable rules for computerized assessments and electronic data storage may become necessary to make sure that confidentiality is maintained at all times.
In conclusion, computerized assessment has the major advantage that more data can be collected in less time, with similar or even better data quality than already achieved with standard sociometric methods. Even though the computer administered data were not identical to traditionally assessed data, this study provided strong support that reliability and validity were not affected. Therefore, computerized assessment is a promising tool to collect sociometric and peer assessment data among children and adolescents in the 21st century.