




Abstract
The effects of selective missingness on the size of observed correlations between scores derived from peer assessment procedures were examined with a sample of 719 boys and girls drawn from 57 peer groups in seven schools in Montréal, Québec, Canada or Barranquilla, a city on the northern Caribbean coast of Colombia in Latin America. Peer groups (i.e., the boys or girls within in a school classroom) in which participation rates exceeded 90% were randomly assigned to either a “complete” or a “missing” group. In separate procedures, children whose scores placed them above the 20th percentile for their group were excluded from the “missing” groups on measures of passive withdrawal, popularity, and aggression. When the correlations observed with the “complete” groups were compared with the correlations observed with the “missing” groups, few differences were observed. These findings are discussed within the context of the effects of missing data on peer assessment techniques and the factors underlying the association between different peer assessment measures.
Introduction
Two persistent sample-related concerns in the literature on peer assessment and sociometry are sample size and sample composition. Each concern raises different anxieties. Concerns about sample size have focused on bias in the metrics of observed scores. Specifically, variations in class size have seen a source of bias in observed values (Bukowski, Cillessen, & Velásquez, 2012; Newcomb & Bukowski, 1983; Rubin, Bukowski, & Parker, 2006). It has been assumed that peer assessment and sociometric scores will be positively associated with the size of the peer group, leading to inconsistencies in the meaning of measures observed across classes that vary in size. Concerns about the composition of samples have focused on whether the children who are missing from the participating peer group are a random or a selective subgroup. Selective, rather than random, absence would bias means when the full distribution of scores was not observed for a particular measure. If, for example, children in a group who were either very high or very low on a particular measure were missing, then the observed distribution for these scores would be truncated at either the upper or the lower end. Sample size problems and sample composition problems are believed to affect the size of means and observed variances. A restriction in variance is problematic as it can constrain the amount of observed covariance. Limitations in covariance will, in turn, lead to biases in correlations. Accordingly, neither of these problems can be ignored.
Various solutions have been proposed to deal with the potential biases that may result from variations in group size. Some of the better-known solutions, such as creating standardized or proportional scores, can be dismissed because they create further problems or other kinds of bias (see Velasquez, Bukowski, & Saldarriaga, 2012). Velasquez et al. developed a regression-based procedure that corrects scores on a group-by-group basis. This procedure calculates the amount by which the scores for classes of a particular size will be inflated or deflated due to class size variations. This calculation relies on the overall linear and curvilinear effects of class size on the scores observed with groups that vary in their size. These correction effects are often quite small.
Efforts to deal with problems that would derive from the use of a non-representative sample for a particular group have been rare. This lack of attention may come from two interrelated practical issues. One is that in most circumstances one cannot tell whether a sample is biased due to composition problems. If one has no information about the features of the missing children, then one cannot tell whether their absence from the sample is random or selective. If their absence is random, one need not worry about biases, except for those that come from sample size per se; if one knows that their absence is selective, then one might be able to perform an adjustment to make up for what is missing. The second practical issue follows from the first issue. If one does not know the features of the children who are missing, then one cannot perform a corrective adjustment of the distribution to make up for the parts that are missing. Perhaps peer researchers have not paid attention to this elusive problem because it appears to be difficult, if not impossible, to solve.
There are two notable exceptions to this avoidance. One is a study by Noll, Zeller, Vannatta, Bukowski, and Davies (1997). They examined the differences between children whose names had been included in peer assessment and sociometric assessments but who either had received or had not received parental permission to take part in the study. Noll et al. received permission from the ethics board of the primary author’s institution to include children without parental permission as nominees in their procedures but not as nominators. They reported that the children without parental permission were less sociable and more aggressive than the children with parental permission. They also reported that in spite of these mean differences, the observed associations between the sociometric measures (i.e., acceptance, rejection, and sociometric preference) and the peer assessment measures (i.e., aggression, isolation, and sociability) did not differ as a function of whether the children without parental permission had been included in the analyses. Their findings, derived from a unique, diverse, and large sample, are largely reassuring. They revealed very little evidence of selective missingness and they showed that the consequences of missing data were, at best, relatively weak.
The other exception to the avoidance of the problem of representativeness is the recent study by Babcock, Marks, van den Berg, and Cillessen (2016). They assessed the repercussions of using a sample with high levels of selective missingness. They reported that when children who were especially high on a particular measure were treated as missing, the correlations observed with these measures were weaker. For example, when children who were high in popularity were excluded from the creation and use of their measures, the correlations between the measure of popularity and other measures appeared to be smaller.
These findings point to the importance of problems that may result from the use of truncated distributions. In doing so, they challenge us to think more carefully about the problems raised by variations in representative participation. The goal of this study was to try to replicate the findings reported by Babcock et al. (2016). We wanted to see if selective absence from distributions of peer assessment measures would significantly affect the size of correlations observed with samples that include the whole, or nearly whole, peer group and those samples for which there was selective absence. We compared the correlations observed with groups that had full representation with the correlations observed with groups from which we had eliminated any presence of children who were above the 80th percentile. Several types of score were used in these comparisons, including the raw scores, scores adjusted for group size using the Velasquez et al. (2012) procedures, and scores that had been corrected for the skew with square root transformations and by reducing the scores of outliers. We compared the correlations observed with the two groups (i.e., the groups with no missing members and the groups from whom we had selectively eliminated members) to assess whether they differed from each other.
Method
Participants
The sample used in this study was drawn from a larger sample of 791 fourth, fifth and sixth graders (mean age = 10.70 years, SD = 1.20, N for boys = 452) from 34 classrooms in seven mixed-gender schools located in lower-middle and upper-middle-class neighborhoods in Montréal, Québec, Canada and Barranquilla, Colombia (n = 547). The participation rate in each classroom was at least 90%. Each classroom was further subdivided by gender, creating a group of girls and a group of boys from each classroom. Eleven of these 68 subgroups were excluded due to having a low number of children (i.e., seven or fewer). A total of 719 participants drawn from 57 subgroups comprised the final sample. The average subgroup included 12.6 children.
Procedure
A multi-stage recruitment process was used in each city. In Montréal, permission was first obtained from the relevant school board, then from school principals. Active consent was required from parents of potential participants. In Barranquilla, the parents of the potential participants were informed by the school principal of the purposes and procedures of the study. They were also informed that participation in the study was voluntary. Parents could ask that their child would not be included in the study. In this region of Colombia school principals often act in loco parentis. Their rights as participants were explained to them prior to the beginning of the data collection. Each participating child in each of the two locations provided assent to be in the study.
The children completed a questionnaire at their desks in a classroom-based group administration. At least three members of the research team were in the classrooms during the data collections to make sure the children understood the instructions and the questions. The Colombian participants completed a version of the questionnaire that had been translated into Spanish by translators working in the areas of education and psychology, and then back-translated into English by a separate group of translators to ensure that the meaning of items was retained in the translation.
Measures
Participants completed several measures including a peer assessment procedure (see Bukowski et al., 2012). Several dimensions of behavior and functioning were assessed in the peer assessment measure. Four dimensions were used in the present study: passive withdrawal (i.e., being excluded from the peer group), care (i.e., responding to the needs of others), popularity, and aggression. Three items were used to assess passive withdrawal: “Is often left out”/“Lo(a) excluyen frecuentemente,” “Has trouble making friends”/“Tiene dificultades para hacer amigos,” and “Can’t get others to listen”/“No es capaz que los demas lo(a) escuchen.” Two items were used to measure care: “Cares about others”/ “Es compasivo(a)” and “Helps others when they need it”/ “Ayuda a otros cuando lo necesitan.” Popularity was measured with two items: “Is liked by lots of people”/“Todos lo(a) aprecian” and “Is popular”/“Es popular.” Three items were used to assess aggression: “Is mean to others”/“Trata mal a los demas,” “Hurts other people”/“Aporrea a los demas,” and “Causes other people trouble”/“Causan problemas a los demas.” Each child could nominate up to four peers for each item. Scores were assigned to each child for each item according to how many times the child was chosen for the items by peers. Each of the four sets of items had a higher-than-acceptable level of internal consistency (Cronbach’s alpha = .84, .78, .86, and .84 for the measures of passive withdrawal, care, popularity, and aggression, respectively). It should be noted that the item “Is liked by lots of people”/“Todos lo(a) aprecian” is not a sociometric measure in the sense that it is an index of how many children actually like a particular peer. Instead it is a peer assessment measure that assesses the degree to which a child is perceived to be liked by classmates. The observed scores for these items were then adjusted for variations in group size with the regression-based procedures described by Velásquez et al. (2012).
Selective Missing Assignments
A two-step procedure was followed to create “complete” groups and “missing” groups. First, each of 57 subgroups was randomly assigned to be a “complete” or a “selective missing” group. Twenty-eight groups were designated as “complete” and 29 were designated as “missing.” Second, three separate targeted elimination processes were used to selectively exclude specific participants from each “missing” group. Separate elimination processes were used with the measures of aggression, passive withdrawal, and popularity. In each process, participants who had high scores on a particular measure were excluded from the group. For example, in the elimination process associated with popularity, for the groups assigned to the “missing” condition the participants whose popularity scores placed them above the 80th percentile were excluded. For groups that had 12 or fewer members, two participants were excluded; with groups that had 13 to 17 members, three participants were excluded; for groups that had 18 to 22 members, four participants were excluded. Overall the size of the missing groups was reduced by roughly 20%.
The final composition of the groups in the two conditions differed in size due to the elimination process. The overall N of the complete groups continued to be 358. The N of the “missing” groups was 285, roughly 20% lower than the complete groups. The average size of the 28 compete group was 12.34; the average size of the 29 “missing” compete groups was 9.83.
Next, the scores on the measures of passive withdrawal, care, popularity, and aggression for the remaining children in the missing groups were adjusted to account for nominations received from the participants who had been excluded. Three sets of separate adjustments were performed, one for each of the three new dimension-based elimination processes. For example, with the groups whose composition had been reduced by excluding children who were high in passive withdrawal, each child’s scores on the four dimensions of passive withdrawal, care, popularity, and aggression were lowered according to the number of nominations they had received from the excluded peers. These adjustments were conducted for each of the three new groups (i.e., one for passive withdrawal, one for popularity, and one for aggression). They were performed with the raw scores corrected for the nominations made by the excluded peers and with the class size-adjusted scores that had been corrected for nominations made by the excluded peers. These new scores indicate what a child’s scores would have been if the excluded children had not participated in the study.
Two final adjustments were conducted with each of the groups. First, with the “complete” group the raw scores and the group size-adjusted scores were adjusted for skew with a square root transformation; with the “missing” group a square root transformation was used to correct for skew in raw scores and the group size-adjusted scores that had been corrected for nominations made by the excluded peers Second, for the complete group the raw scores and the group size-adjusted scores were adjusted for skew/outliers by reducing scores that were more than 2.5 standard deviations above the mean for their group to a value that equalled this criterion; this same correction was performed with the scores from the “missing” group, except that their scores had been corrected for the nominations that were received from the peers who had been selectively excluded.
Results
General Plan of Analyses
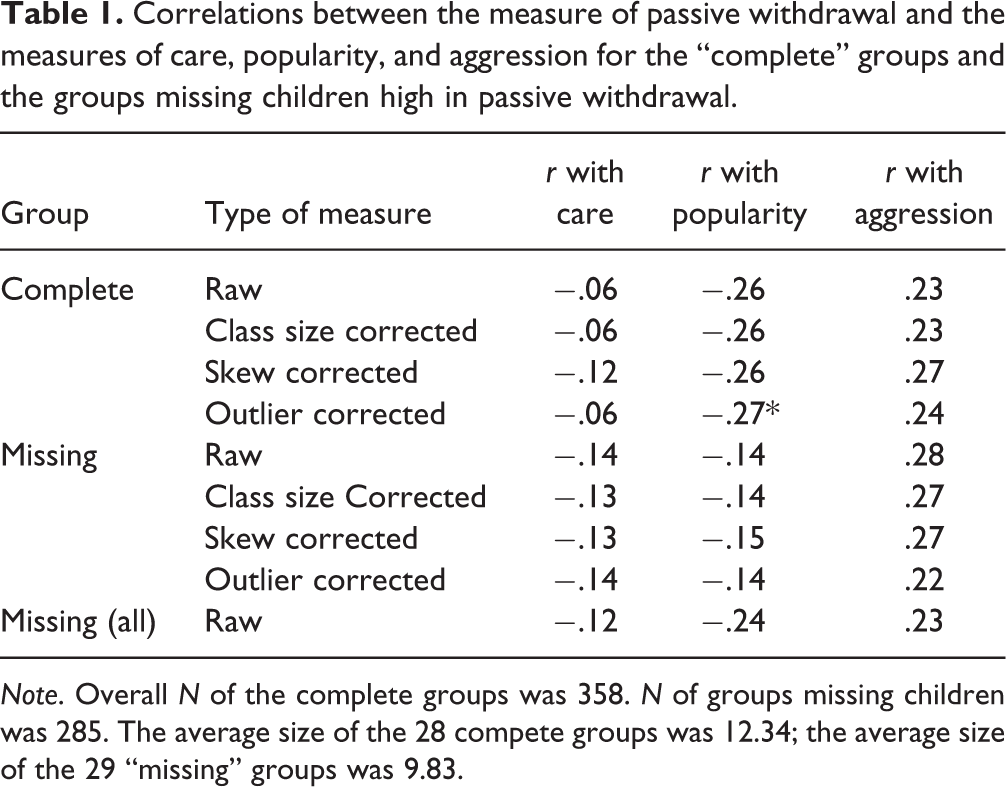
The goal of the analyses was to assess whether the correlations observed with the missing groups differed from the correlations observed with the complete groups. Three sets of broad comparisons were made. In one set, correlations observed for the complete group were compared with those observed when the children excluded from the missing group were those who were high in passive withdrawal. In this set, comparisons were made with three correlations, specifically the correlations between passive withdrawal and care, passive withdrawal and popularity, and passive withdrawal and aggression.
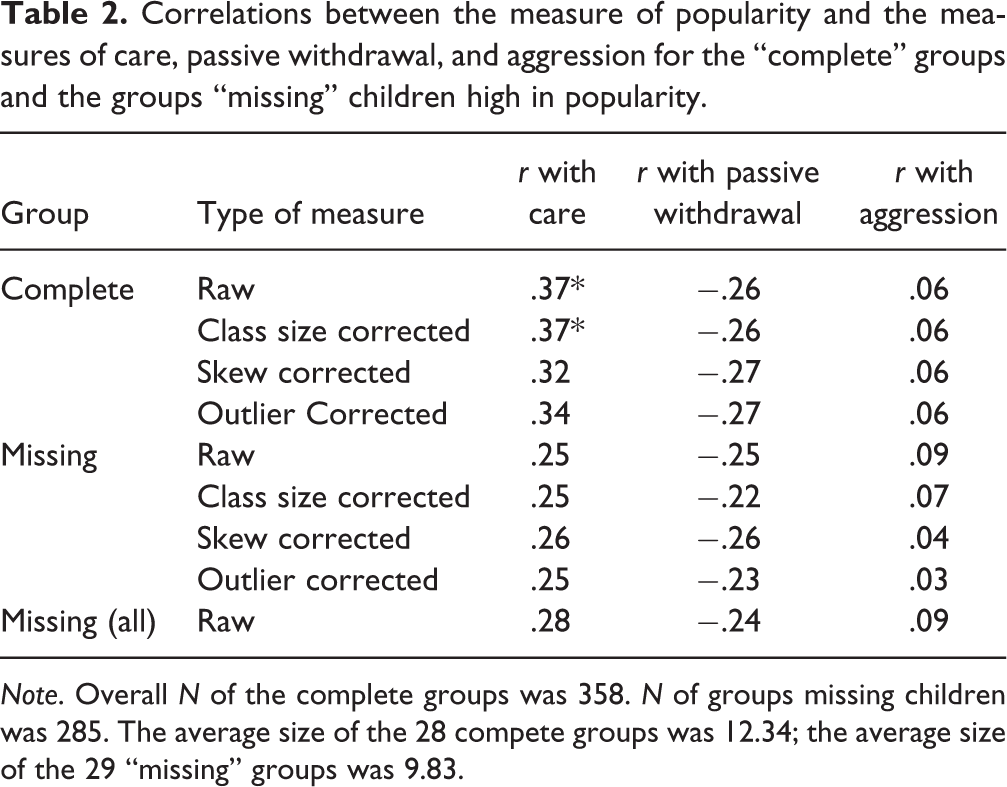
In a second set, correlations observed for the complete group were compared with those observed when the children excluded from the missing group were the those who were high in popularity. In this set, comparisons were made with three correlations, specifically the correlations between popularity and care, popularity and passive withdrawal, and popularity and aggression.
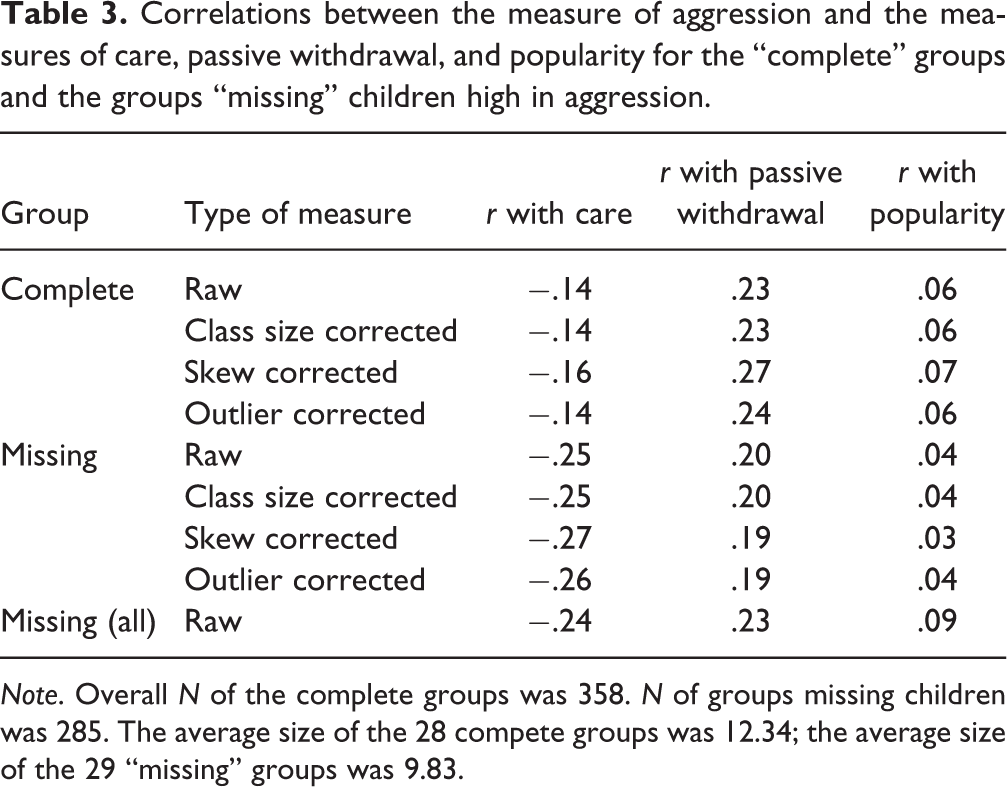
In the third set, correlations observed for the complete group were compared with those observed when the children excluded from the missing group were those who were high in aggression. In this set, comparisons were made with three correlations, specifically the correlations between aggression and care, aggression and popularity, and aggression and passive withdrawal.
Four types of correlations were examined. One type of correlation was with the “raw” scores. For the participants in the complete groups, these were simply the observed scores; for the participants in the missing groups, these scores were the raw scores corrected for the nominations received from the excluded children. The second type was parallel to the first type, but they were also adjusted for class size differences. The third type were parallel to the first type but were corrected for skew with the square root transformation. The fourth type was the version of the first type but with a correction for skew and extreme scores via an outlier correction.
These three sets of correlations are shown in Tables 1, 2 and 3. Table 1 presents the correlations for the complete groups and the missing group from which the children high in passive withdrawal had been excluded; Table 2 presents the correlations for the complete groups and the missing group from which the children high in popularity had been excluded; and Table 3 presents the correlations for the complete groups and the missing group from which the children high in aggression had been excluded. Each table has the same structure. Each column shows a different correlation. The first four rows are for the four types of measure with the complete groups; the second four rows present the corresponding values for the missing groups. The final row in each table presents the correlations that were observed for the missing group when all the children had been included (i.e., when the children with high scores had not been excluded).
Correlations between the measure of passive withdrawal and the measures of care, popularity, and aggression for the “complete” groups and the groups missing children high in passive withdrawal.
Note. Overall N of the complete groups was 358. N of groups missing children was 285. The average size of the 28 compete groups was 12.34; the average size of the 29 “missing” groups was 9.83.
Correlations between the measure of popularity and the measures of care, passive withdrawal, and aggression for the “complete” groups and the groups “missing” children high in popularity.
Note. Overall N of the complete groups was 358. N of groups missing children was 285. The average size of the 28 compete groups was 12.34; the average size of the 29 “missing” groups was 9.83.
Correlations between the measure of aggression and the measures of care, passive withdrawal, and popularity for the “complete” groups and the groups “missing” children high in aggression.
Note. Overall N of the complete groups was 358. N of groups missing children was 285. The average size of the 28 compete groups was 12.34; the average size of the 29 “missing” groups was 9.83.
Corresponding correlations were compared with Fisher’s r-to-z transformation. This efficient procedure was used to assess whether a correlation observed with the complete group differed for the correlation observed with the missing group. Using a p value of .05 and assuming a one-tailed non-directional null hypotheses, only two significant differences were observed. One was a difference observed with the correlation between passive withdrawal and popularity when the children with high passive withdrawal scores had been excluded from the missing groups (see Table 1). With the outlier corrected scores, the difference between the correlation for passive withdrawal and popularity observed with the “complete” groups (r = −.27) was significantly different (z = 1.72, p < .04) from the correlation observed with missing group (r = −.14). This difference was observed only with the outlier corrected scores.
A second difference was observed with the correlation between the “raw” and “adjusted” measures of popularity and care when children with high popularity scores had been excluded from the “missing” groups (see Table 2). According to the Fisher r-to-z transformation, the difference between the correlations observed with the complete groups (r = .37) and the correlations observed with the missing groups (r = .25) was statistically significant (z = 1.68, p < .046). This significant difference was not observed when this correlation was computed using the measures whose skew had been corrected with a square root transformation or by adjusting the scores of outliers.
Discussion
The purpose of this study was to reconsider the question initially raised by Babcock et al. (2016) regarding the effects of selective missingness on the correlations observed between peer assessment variables. We examined differences between the correlations observed with “complete” groups in which there was full or nearly full participation and the correlations observed with “missing” groups from which we had selectively excluded the top 20% of children in each group on a particular variable. These comparisons provide clear results.
Scant evidence was found for differences between these two sets of correlations. Significant differences were observed with only two of, at the very least, nine comparisons. The parameters used in the null hypothesis tests were set to maximize sensitivity. We used (a) a one-tailed criterion rather than a directional two-tailed test and (b) a very large sample, and we did not adjust the p value for the number of comparisons that were performed. One could argue that we made 36 comparisons (four types of measures by three correlations across three sets of complete/missing groups). Even the more conservative claim that we performed only nine comparisons (three correlations across three sets of complete/missing groups) would have led to a Bonferroni-reduced p value of less than .006. Neither of the differences we observed came close to meeting this criterion.
One cannot, however, overlook the general pattern that the correlations observed with the missing groups tend to be smaller than those observed with the complete groups. Part of this difference has to do with the differences that are seen between the two sets of groups even before the exclusion of the children with high scores. Nevertheless, in spite of weak evidence from the null hypothesis tests, the overall pattern suggests that selective missingness may lead to the attenuation of observed correlations.
It is important to keep in mind that the present findings were observed under contrived circumstances that we created. The missing groups were specifically created to form hypothetical conditions. We asked what would happen if the top 20% of children on a particular measure in a group were not in the participating sample. We followed this procedure so as to replicate the processes used by Babcock et al. One can ask whether the conditions we created are representative of what would ever happen in actual studies. It is hard to answer this question positively. The conditions we created and that Babcock et al. created are not only largely inconsistent with the findings from Noll et al. (1997) but they also contradict what we presume to know about the constructs we studied. Popular children in early adolescence are motivated to engage in events in their classrooms. It is very hard to imagine that the top 20% of popular children in every group in a study with a large sample are going to opt out from participation. Moreover, in so far as some aggressive children are also popular, they may, due to their popularity, be motivated to participate even though, as Noll et al. indicated, there may be a general tendency for aggressive children to decline participation. The bottom line is that the what-if conditions that we and Babcock et al. studied are so contrived and unrealistic that their practical application to peer research may be limited, if not useless.
It may not be a coincidence that each of the two differences that we observed involved a measure of popularity. Popularity is known to be an amorphous construct whose significance varies across contexts (Bukowski, 2012). As importantly, the concept itself pulls for outliers. Popular children are the ones at the top of the status hierarchy. Eliminating them from the distribution changes the basic dynamics underlying their association with other measures.
What can one conclude from these findings? It is hard to accept them as incontrovertible evidence that samples that include missing data are fundamentally problematic. Even though we maximized the likelihood we would find differences between the correlations observed with “complete” and “missing” groups, few compelling differences were observed. Certainly, however, no one thinks that having missing data is desirable. At the same time, it is also unlikely that missingness is random or that it is as narrowly selective as it is in our, and in Babcock et al.’s, contrived comparisons. Although peer assessment techniques and sociometric techniques have been used for decades, we know little about how observed results are affected by variability in sample parameters. When given the option of studying conditions that may not occur in nature or studying how variations in the features of actual groups affect peer experience, we might be better off choosing the second option rather than the first.
Footnotes
Acknowledgment
The first two authors acknowledge the support received from the Social Sciences and Humanities Research Council of Canada.
Funding
The author(s) received no financial support for the research, authorship, and/or publication of this article.