



Abstract
While age effects in reaction time (RT) tasks across the lifespan are well established for level of performance, analogous findings have started appearing also for indicators of intra-individual variability (IIV). Children are not only slower, but also display more variability than younger adults in RT. Yet, little is known about potential moderating sex effects on RT-IIV. We analyzed responses in a simple RT task with 120 trials in children, younger, and older adults. To best capture sex differences we used generalized additive models (GAMs), a semi-parametric regression approach, to fit splines relating nonlinearly age to RT, and capable of testing sex differences therein. This method is more adequate to test sex differences in nonlinear age relations than polynomial regression. Results show that (a) males are faster than females (except in the older adults), and (b) in younger and older adults, males are less variable than females. No sex difference in IIV emerged in children. Results are consistent with the hypothesis that sex differences in RT variability may be attributable to brain effects of sex hormones, in particular estrogen, whose receptors are present in several brain regions involved in information processing and attention, which are systems involved in the regulation of variability in information processing. Thus, according to this hypothesis, sex differences in RT-IIV should be present after puberty, but not in pre-pubertal children.
Intra-individual variability (IIV) is a familiar concept to all contemporary developmentalists. Indeed, understanding human functioning necessitates analyzing not only the level of performance of an individual, but also the amount and type of variations in performance around the level. This longstanding statement (e.g., Nesselroade, 1991) has recently been supported by much empirical evidence (e.g., Deary & Der, 2005a, 2005b; de Ribaupierre, 2015; Hultsch, Strauss, Hunter, & MacDonald, 2008; MacDonald, Li, & Bäckman, 2009). In particular, IIV in simple cognitive tasks, such as simple and choice reaction time (RT) tasks, has been found to be more predictive of death and long-term cognitive decline than indicators of level of performance (e.g., Deary & Der, 2005a; Ghisletta, Fagot, Lecerf, & de Ribaupierre, 2013). Hence, IIV in simple cognitive tasks is considered a behavioral indicator of processes related to brain integrity (Hultsch et al., 2008).
With respect to age effects, much behavioral, neural, and behavioral-genetic evidence indicates that RT-IIV (IIV in RT tasks) undergoes marked differences from mid-adulthood to advanced adulthood (e.g., Bielak, Cherbuin, Bunce, & Anstey, 2014; Finkel & McGue, 2007; MacDonald et al., 2009). Some have indeed suggested that RT-IIV may be a neurocognitive marker of impairment in elderly individuals (e.g., Dixon, Garrett, Lentz, MacDonald, Strauss, & Hultsch, 2007), but in fact RT-IIV undergoes marked age differences across the entire lifespan (e.g., Williams, Hultsch, Strauss, Hunter, & Tannock, 2005). Though evidence in children is quite scarce, extant results show that children display more RT-IIV than younger adults and as much as, or more than, older adults (e.g., Dykiert, Der, Starr, & Deary, 2012; Mella, Fagot, Lecerf, & de Ribaupierre, 2015). These findings hold for both simple reaction time (SRT) and more complex choice reaction time (CRT) tasks. RT-IIV can thus tentatively be conceived as a marker of lifespan development.
Sex differences in RT-IIV, however, remain largely unexplored (for a review, see Dykiert et al., 2012). Deary and Der (2005b) and Der and Deary (2006) found sex differences in both level of performance and in IIV in a SRT and a CRT task in large and representative adult samples: Adult women displayed higher IIV than adult men (from middle adulthood onwards in Deary & Der, in older ages in Der & Deary). Bielak, Cherbuin, Bunce, and Anstey (2014) found that in young adulthood, women were more variable than men in a SRT task, while sex differences in a CRT task were limited. Dykiert and colleagues found no sex differences in SRT and CRT-IIV in children, whereas adult women were more variable than adult men. The authors’ conclusions were supportive of the hypothesis of Deary and Der that sex differences in RT variability may be attributable to brain effects of sex hormones, in particular estrogen, that are present after puberty. Estrogen is known to differentially affect male and female brains (McEwen, 2001). There are estrogen receptors in several brain regions involved in information processing and attention, and these systems may be involved in the regulation of variability in information processing (Li, Lindenberger, & Sikstrom, 2001). Indeed, estrogen regulates dopamine transmission (e.g., Nordström, Olsson, Halldin, 1998) and, interestingly, women perform better on spatial tasks when their natural level of estrogen is at the lowest menstrual phase (Kimura, 1996). Moreover, dopamine may regulate (through neuromodulation) cognitive performance differentially in men and women, and these differences may be age dependent (Harper Mozley, Gur, Mozley, & Gur, 2001). Prior to puberty, females are not yet exposed to adult sex hormone concentrations, so that there should be no sex differences in RT-IIV in childhood. Starting at puberty, greater production of estrogen in females may lead to differential behavioral outcome, resulting in greater RT-IIV compared with males. Understanding how sex hormones may influence sex differences in cognitive performance and variability may help the understanding of brain pathologies that involve the dopamine system (e.g., Parkinson’s disease and schizophrenia) and that are subject to sex differences. This, in turn, can shape pharmacological treatments that have been shown to influence differentially men and women (Kimura, 1996).
The Dykiert, Der, Starr, and Deary (2012) study was based on a large lifespan sample with a nearly symmetric sex composition (N = 1,994, age range 4–75 years, 42.5% males). Focusing on a SRT task, the dependent variables were the mean (M) and the standard deviation (SD) across 20 trials, calculated for each participant. To test age relations and sex differences therein, the authors performed polynomial regression analyses, where both individual Ms and SDs were analyzed as a function of a degree-five polynomial of age, and of the interactions between all polynomial terms with sex. This type of approach presumes that the analyst either knows in advance the degree of the polynomial necessary to capture the relation of interest, or that a fair amount of exploratory analyses precedes the specification of the polynomial degree. Furthermore, the regression model rests on two important assumptions: first, the polynomial terms are equally important throughout the entire range of the predictor (age, in this case). Wood (2006) points out that while polynomials are useful in the vicinity of a single specified value (a precise age), they are somewhat problematic over whole domains (a large age range). Second, the use of polynomials engenders a high number of statistical tests (thus increase in Type 1 error rate) and adds great difficulty in interpreting parameters (what is the psychological interpretation of a cubic or a quartic term?). Indeed, a degree-five polynomial relating age to RT M or SD estimates six parameters (with the intercept) and an additional five parameters to test interactions with sex. Yet, any theoretical hypothesis about sex effects will likely not be about any specific polynomial term, but general in nature. In sum, the polynomial regression approach in this context, while allowing for nonlinear age-trajectories of level of and variability in RT, is not the most efficient statistical model to test for sex differences.
Generalized Additive Models (GAMs; Hastie & Tibshirani, 1986; Wood, 2006) use a spline approach, which in this setting (a) best captures all nonlinear age relations (without the need to specify them with a parametric function) and (b) allows a covariate such as sex to maximally express its effects throughout the entire age range. Basically, this approach fits a spline-like smoothing function of age separately for each sex, thereby maximizing both the relationship between age and the dependent variable, and the sex differences therein. More importantly, GAMs provide a single statistical test for sex differences in the smoothing function (rather than multiple tests for all polynomial terms). Thus, GAMs appear better suited than polynomial regression to test for sex differences in RT M and SD.
We investigate level of performance and IIV in a SRT task. We study how age and sex differences are expressed in the M, the classical indicator of level of performance, and in the SD, the typical indicator of IIV, of a SRT task. We use the GAM statistical framework to (a) maximize the sex-specific age relation with the M and the SD and (b) test for sex differences in these age relations. Based on new data and the application of a novel method, we thus extend the analyses of Dykiert and colleagues (2012) in assessing the hormonal hypothesis of Deary and Der (2005b).
Method
Participants
The Geneva Variability Study (Ghisletta et al., 2013) sample (N = 557) is composed of children (n = 201), younger adults (n = 137), and older adults (n = 219). Children were recruited from local elementary schools and ranged in age from nine to 12 years (M = 10.52, SD = 1.12). Younger adults (19–33 years, M = 21.71, SD = 2.53) were second- or third-year psychology students. Older adults (59–89 years, M = 70.10, SD = 6.77) were recruited from senior organizations, the Senior University of Geneva, and via ads in local newspapers; they lived independently, did not present signs of dementia, and were mainly in relatively satisfactory to good physical health. All participants were fluent French speakers.
The sample comprised 374 females and 183 males. The sex distribution was uneven in the adults (117 females vs. 20 males in the younger adults, 165 females vs. 54 males in the older adults) and quite symmetric in children (92 females vs. 109 males).
Procedure
Participants were tested individually, by a trained tester, in a quiet room, and were administered a computerized battery of cognitive tasks. The entire protocol lasted on average two sessions of 1.5 hours each and started with the SRT task.
Simple Reaction Time Task
A large, white plus sign (+) in Arial font, size 66, was shown on a computer screen on a black background. The stimulus appeared after a central fixation point at the center of the screen. Participants had to press an answer key as quickly as possible, with their dominant hand, immediately after the stimulus appears. Six practice trials preceded the 120 testing trials. The whole task lasted at most 3 min.
Data Preparation
RTs were measured in ms. To exclude unlikely responses due to anticipation, we only considered RTs equal to or greater than 150 ms. Similarly, to avoid overestimating variability, we excluded RTs greater than 1,000 ms. The application of such cutoffs (as is typically done in the literature; e.g., Bielak et al., 2014; Dykiert et al., 2012; Williams et al., 2005), if anything, underestimates the amount of IIV. In the end, we excluded only 0.81% of all response times, and analyzed 66,294 responses.
The natural positive skew of RT distributions partially explains why the intercorrelation between the intra-individual mean (M) and the intra-individual standard deviation (SD) is often spuriously high. We applied the natural logarithmic transformation to all RTs before calculating individuals Ms and SDs. Across all participants, this transformation diminished the M–SD correlation from .65 to .23. Table 1 presents the descriptive statistics (in terms of M and SD of the natural logarithm) of the RTs by age and sex groups.
Descriptive Statistics of Intra-individual Mean and Standard Deviation of the Simple Reaction Time Task by Age Group and Sex.
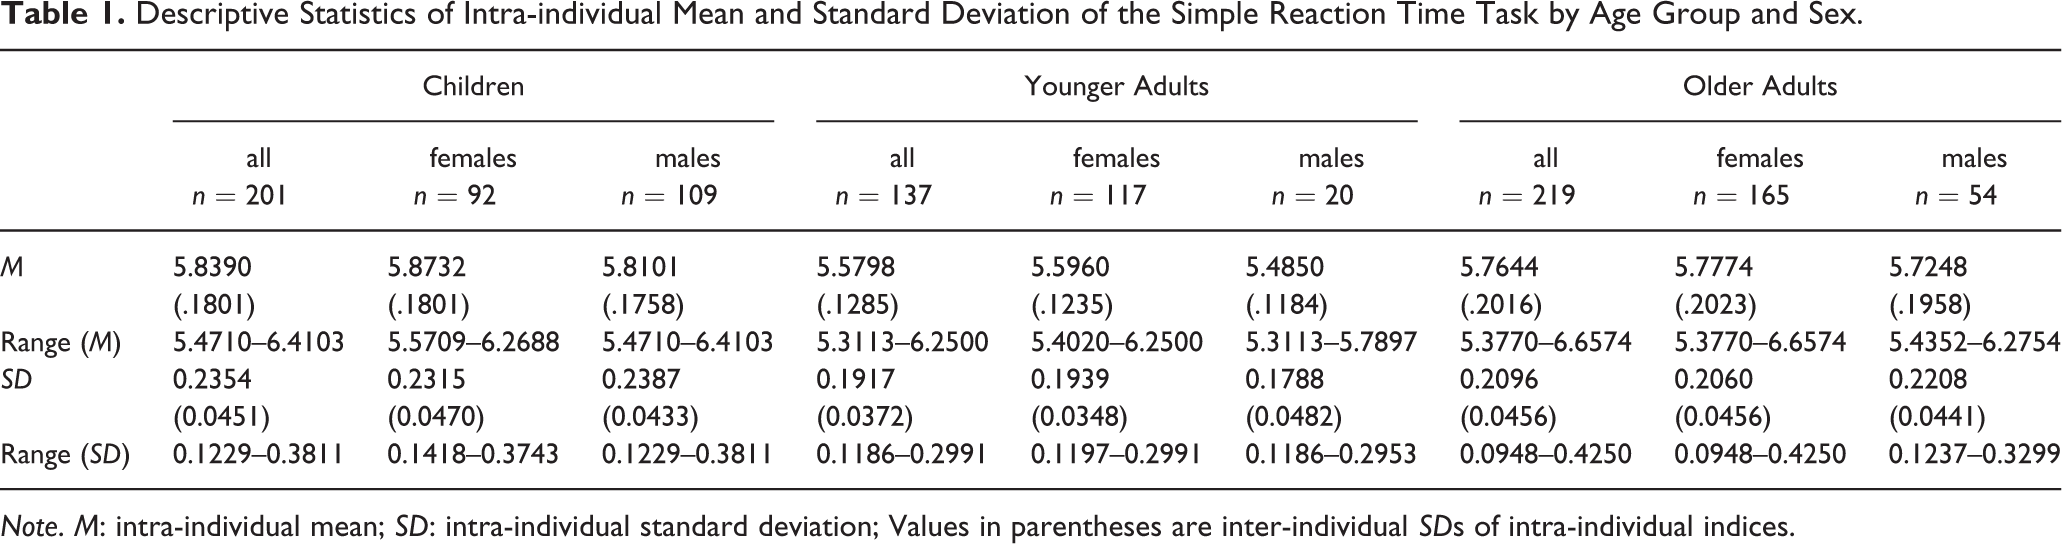
Note. M: intra-individual mean; SD: intra-individual standard deviation; Values in parentheses are inter-individual SDs of intra-individual indices.
Analyses
We used GAMs to test age associations with RT, conditioned on sex. GAMs make use of additive models, a semi- or nonparametric technique, to uncover nonlinear relations that optimally adjust the outcome to the predictors, and that can condition such relations on covariates. The effects of the covariates need not be equally valid at all values of the predictor. This feature guarantees that even with a low representation of covariates’ values at given predictor values (e.g., few men among the adults), the covariates effects are maximally tested (Wood, 2006). In our application, this should compensate for unequal sex distributions in the adult and old age ranges.
GAMs rely on smooth functions of covariates, which penalize for unnecessary complexity (Wood, 2006, 2016). This avoids both over-smoothness, which would miss out important patterns in the data, and under-smoothness, indicative of a model that adjusts also to noise in the data. This approach is preferred over alternatives such as polynomial regression, where the analyst must specify a priori the degree of the polynomial, thereby risking both under- and over-smoothness. Though the use of GAMs has gained much popularity in many applied statistical fields, they are yet relatively unknown in behavioral research (but cf. Shadish, Kyse, & Rindskopf, 2013).
In our context, we wanted to ensure the optimal relation between age, on the one hand, and individual Ms and SDs in RTs, on the other hand. Moreover, we included the age by sex interaction to obtain the optimal age-M and age-SD relations in each sex group, and to test for their differences. The application of GAMs thus ensures the optimal test of sex effects on the age-M and age-SD relations.
The specification we adopted was:

where Y i = M(RTs) or SD(RTs). We specified the identity link function and the normal distribution for Y i. β 0 is the intercept (expected M or SD for females of average age) and β 1 (sex i, 0 for females, 1 for males) represents the main effect of sex for individual i on either his/her M or SD; these two parameters represent the parametric specification of the GAM; the nonparametric specification is given by f 1(age i), the smoothing function of age for females, and by f 2(age i · sex i), the change in the smoothing function for males. Thus, β 1 and f 2 represent the overall test of sex effects on M and SD. We used the R statistical environment (R Development Core Team, 2016; v. 3.2.4) and its mgcv package (Wood, 2016; v. 1.8-12).
Results
Age and Sex Differences in the Entire Sample
Table 2 shows the results for the entire sample of the GAMs on both the intra-individual mean (M; upper panel) and intra-individual standard deviation (SD; lower panel) across all trials of the SRT task. The intercept and the sex lines represent the parametric portion of the model (β 0 and β 1 in the equation). For these, familiar statistical information (t and F statistics) are available and can be interpreted. The age and age · sex lines represent the nonparametric portion of the GAM (f 1 and f 2 in the equation). For these, it is technically possible to obtain parameter estimates, but given that they are derived from a smoothing function, they represent complicated nonlinear functions that are typically not interpreted. Of interest is the F-statistic (and its p-value) to test for the statistical significance of f 1 and of f 2. Because of the rather large overall sample size and to correct for multiple testing we adopt the α = .01 cutoff.
Results from GAMs Predicting M and SD of the Simple Reaction Time Task in the Entire Sample (9–89 Years; N = 557).
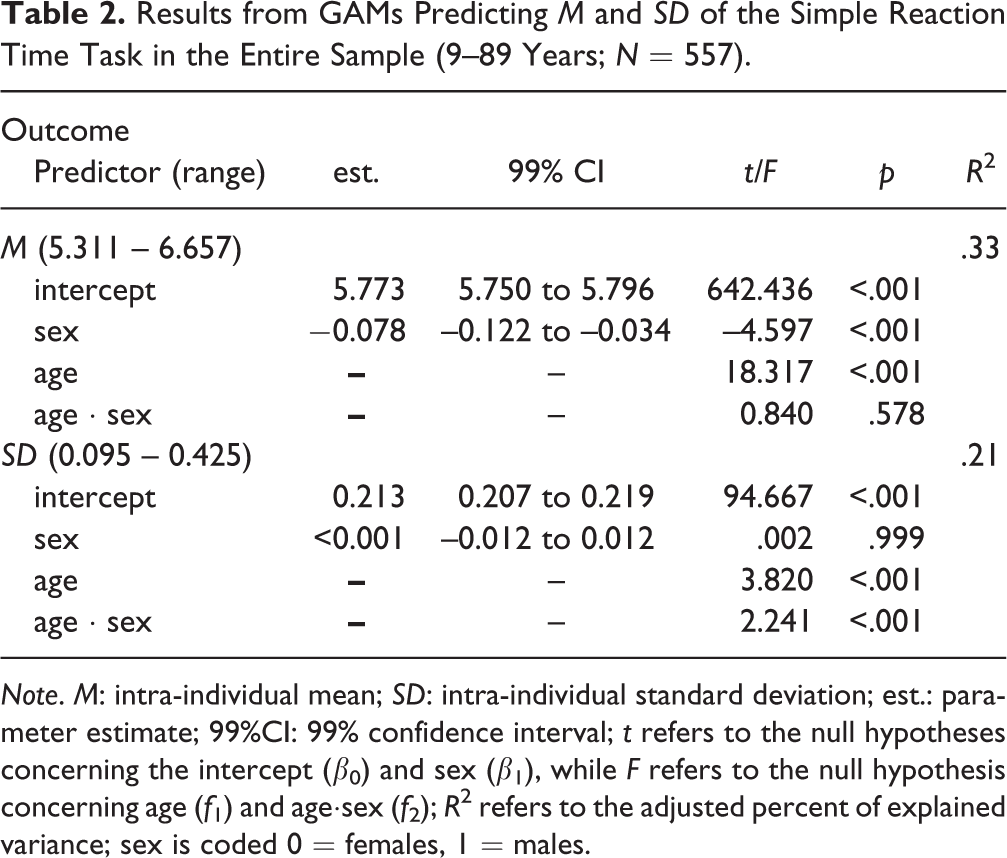
Note. M: intra-individual mean; SD: intra-individual standard deviation; est.: parameter estimate; 99%CI: 99% confidence interval; t refers to the null hypotheses concerning the intercept (β 0) and sex (β 1), while F refers to the null hypothesis concerning age (f 1) and age·sex (f 2); R 2 refers to the adjusted percent of explained variance; sex is coded 0 = females, 1 = males.
Given that we model the M and SD of the natural log of RTs, the intercept is unsurprisingly significantly different from zero. Of interest for the M is the significant main effect of sex (males tend to be faster than females) and of age. Overall, the model accounts for a third of the variance of M-RT (R 2 = .33). With respect to variability, age displays a main effect and sex only an interaction effect with age. To fully understand these results, we further investigate age and sex differences within the separate age groups.
Age and Sex Differences in the Separate Age Groups
To further the understanding of possible sex effects, we computed the same GAM analyses in each age group separately. Given that GAMs allow the data to maximally express the age relation with RT M and SD, and sex differences therein, we directly assess the hypothesis that sex differences in RT SD are not present in children, whereas they should emerge in younger and older adults. Table 3 presents the GAM results from each age group.
Results from GAMs Predicting M and SD of the Simple Reaction Time Task in each Age Group (Children: 9–12 Years, N = 201; Younger Adults: 19–33 Years, N = 137; Older Adults: 59–89 Years, N = 219).
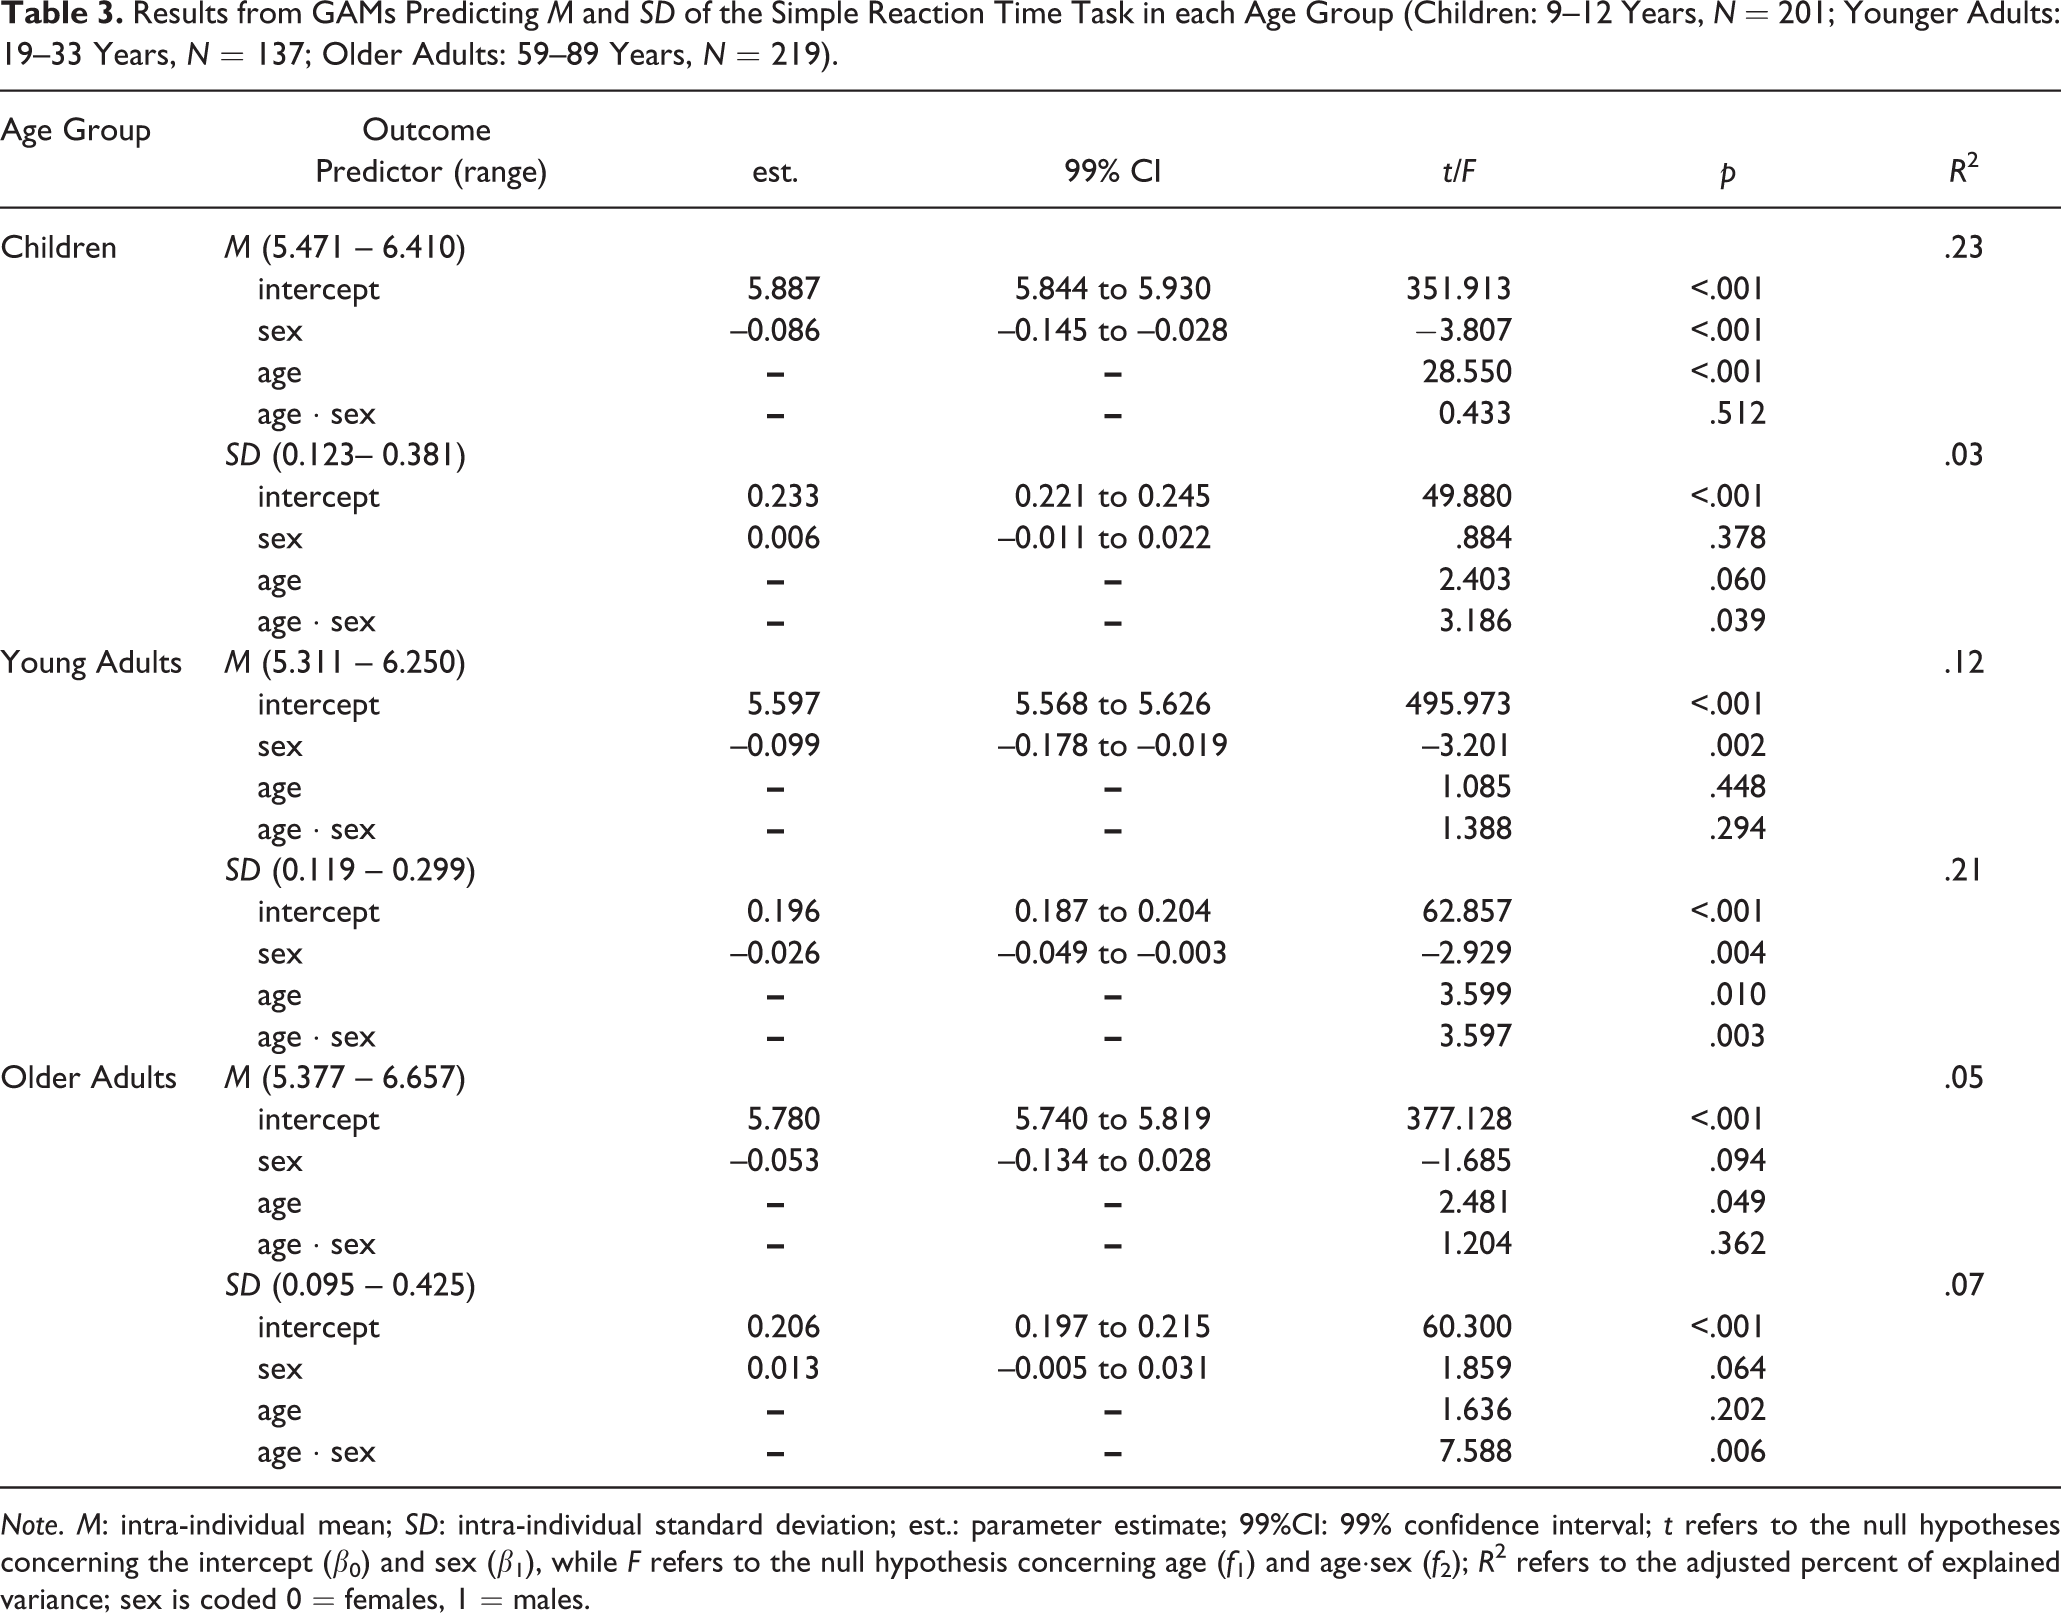
Note. M: intra-individual mean; SD: intra-individual standard deviation; est.: parameter estimate; 99%CI: 99% confidence interval; t refers to the null hypotheses concerning the intercept (β 0) and sex (β 1), while F refers to the null hypothesis concerning age (f 1) and age·sex (f 2); R 2 refers to the adjusted percent of explained variance; sex is coded 0 = females, 1 = males.
In Table 3, upper panel, we see that for M in children, boys are overall faster than girls and there is an overall age effect. For SD, boys are not differentially variable than girls, as neither the main sex effect nor the age by sex interaction are significant. The model explains a moderate to low amount of variance in M (R 2 = .23) and virtually no variance in SD (R 2 = .03).
In younger adults (middle panel), we observe that for M, men are generally faster that women and age exerts no effect. For SD, men are less variable than women and age exerts a main and interaction effect. For both M and SD the model explains relatively low to moderate amounts of variance (R 2 = .12 and .21, respectively).
Finally, for the older adults (lower panel) there appear no solid age or sex difference on either M or SD, except for the age by sex interaction in IIV. The effect sizes are very low (R 2 = .05 for M and .07 for SD).
Discussion
We replicated and extended recent findings about lifespan age differences in level of and variability in a SRT task and partially replicated and extended results about sex effects in RT tasks. We confirmed the familiar age pattern of overall slowest RTs in children, fastest in younger adults, and of intermediate magnitude in older adults. We also found the largest IIV in RT tasks in children, followed by older adults, and smallest inconsistency in younger adults. These initial results about age differences in levels of and variability in performance served to validate the application of the semi-parametric regression (GAM) analysis we adopted to investigate sex differences.
We confirmed that girls and young adult women were slightly slower than boys and young adult men. This sex difference, however, was not observed in older adults, a finding that might appear surprising in light of the recent studies by Deary and Der (2005b), Der and Deary (2006), Bielak et al. (2014), and Dykiert et al. (2012), all of whom found men to be slower than women. Two potentially important methodological features, however, distinguish those studies from ours. First, in our study the sample ranged up to 89 years, whereas in Bielak et al., Dykiert et al., and Deary and Der the maximum age was, respectively, 72, 75, and 64 years. The sample of Der and Deary ranged to 94 years, but only 4.26% of the participants were over 75 years (whereas in our sample their proportion was more than double). We repeated the analyses on the 170 older adults below 75 years of age and found a clear age effect and male advantage for M; for SD, no age or sex effect emerged. Hence, the sample age may partially explain these differences. Second, our task included 120 items, whereas in Bielak et al. there were 80 items for simple RT, while in Deary and Der, Der and Deary, and Dykiert et al. there were only 20 items. The number of items could also have influenced the results.
We found sex effects on IIV in younger adults, where women were slightly more variable than men, confirming previous results (Deary & Der, 2005b; Dykiert et al., 2012). We did not, however, find a main sex difference in variability in the older adults, except for the age by sex interaction. Again, the methodological features mentioned above could also play a role with respect to variability in RT. Furthermore, some studies have found no sex differences in SRT variability, even in large, representative samples (e.g., Fozard, Vercruyssen, Reynolds, Hancock, & Quilter, 1994). In general, the magnitude of sex effects on RT-IIV, when present, appear to be moderate to very weak (similarly to Der & Deary; Dykiert et al.). This is consistent with our small estimates of percentage of variance explained (cf. Table 3) in the oldest group. It thus appears that the male advantage in older adults in both speed and variability in RT is not unquestionable, and, if present, is rather weak in size. Finally, the hypothesis that brain effects of sex hormones induce sex differences in RT-IIV would predict that in older postmenopausal women, whose level of estrogen has naturally decreased, RT variability should be comparable to that of older men. We, however, ignore whether our sample of older adults lacked sex differences in estrogen. Indeed, a measure to counteract menopausal symptoms (e.g., hot flashes, vaginal dryness, pain during intercourse) is to undergo hormonal replacement therapy (which usually consists of intake of estrogen and/or progesterone that are no longer naturally produced). We ignore whether some of our older women participants underwent such treatment (although its administration rarely exceeds 5 years after the last menstrual period), and hormonal measurements were not available in this study.
As expected, we found no sex effects on IIV in children, despite our use of a statistical framework that maximizes power to reveal such sex effects. This result confirms those of Dykiert et al. (2012), and, coupled with the presence of such effects in young adulthood, is consistent with the hypothesis of Deary and Der (2005b) of hormonal effects on IIV. Estrogen, whose production in females increases after puberty, may possibly be associated with brain structures involved in neurotransmission of dopamine, which may regulate the signal-to-noise ratio in information processing, motor performance, and attention processing, ultimately influencing RT-IIV. Bielak et al. (2014) investigated not only sex differences in baseline RT-IIV, but also in change (over an 8-year period). In their longitudinal sample, which ranged from 20 to 72 years (and hence did not include pre-pubertal individuals), the authors found sex differences in RT-IIV at baseline, but not in change. We expect that, if a sample of older children/younger adolescents undergoing puberty were assessed longitudinally, no sex differences in baseline RT-IIV would appear (in agreement with our cross-sectional findings), whereas significant sex differences in change in RT-IIV, due to pubertal differences in estrogen levels between young women and men, would emerge.
How task complexity may modulate sex differences in IIV remains an unanswered question, to be addressed in future research. However, it has been shown that patients with Parkinson’s disease react differently to changes in difficulty in a perceptual decision-making task depending on whether they are on or off dopaminergic medication (Huang, Georgiev, Foltynie, Limousin, Speekenbrink, & Jahanshahi, 2015). The interaction between task complexity and dopamine intake could manifest itself in terms of sex differences in RT-IIV, given that estrogen regulates dopamine transmission.
Limitations
There are two limitations that need to be considered when interpreting our results. First, the sex distribution was uneven across the age range. Women constituted a higher percentage than men in samples of younger (85%) and older (75%) adults, while girls (46%) were about as numerous as boys. Despite this obvious disparity, sex effects were related both to M and SD in younger adults, owing to the power of GAMs. Also, in children, where the sex breakdown was symmetric, sex effects appeared in M, but not in SD, as expected. Had we obtained a better sex distribution in younger and older adults, we would have expected stronger sex differences on both M and SD in younger adults—and perhaps more statistical power to detect a male advantage in older adults with respect to higher speed and less variable responses. Second, we offer an indirect assessment of the hypothesis proposed by Deary and Der (2005b) that sex hormones affect variability in response, via their influence on brain regions involved in information processing, attention, and the regulation of variability in information processing. Studies measuring individual hormonal concentrations are needed to directly assess this hypothesis.
Conclusion
Our results, albeit based on cross-sectional data, are consistent with the assertion that IIV in RT tasks is not only a fundamental phenomenon of aging (cf. Bielak et al., 2014) but can be considered a fundamental developmental phenomenon across the entire lifespan. Moreover, sex effects in RT-IIV emerge only in postpubertal periods of the lifespan. Whether sex hormones play a key role in differentiating men and women in terms of RT-IIV remains at present a speculation, given the lack of studies with direct measurements of individual hormonal concentrations.
Footnotes
Funding
The authors declared receipt of the following financial support for the research, authorship, and/or publication of this article: This research was supported by the grants no. 100011-107764 and 100014-120510 from the Swiss National Science Foundation. The content of this article is solely our responsibility and does not necessarily represent the official views of the Swiss National Science Foundation. We thank all the participants to this research as well as the various collaborators. We thank Dr. Stephen Aichele for very useful comments on the first version of the manuscript.