



Abstract
Selective non-participation and attrition pose a ubiquitous threat to the validity of inferences drawn from observational longitudinal studies. We investigate various potential predictors for non-response and attrition of parents as well as young persons at different stages of a multi-informant study. Various phases of renewed consent from parents and young persons allowed for a unique comparison of factors that drive participation. The target sample consisted of 1675 children entering primary school at age seven in 2004. Seven waves of interviews, over the course of 10 years, measured levels of problem behavior as rated by children, parents, and teachers. In the initial study recruitment, where participation was driven by parental consent, non-response was highest amongst certain socially disadvantaged immigrant minority groups. There were fewer significant group differences at wave 5, when young people could be directly recruited into the study. Similarly, attrition was higher for some immigrant background groups. Methodological implications for future analyses are discussed.
Introduction
Longitudinal studies in normative samples are critical for making inferences about the developmental processes underpinning child and adolescent development. Non-random participation and attrition, whereby presence in a research sample at a given wave is directly or indirectly related to the characteristics under study, represent important challenges for such studies (e.g., Singer & Willet, 2003). Knowledge of the nature and severity of selective participation and drop-out is fundamental for applying appropriate corrections to data analyses and can inform strategies to ameliorate selective participation and drop-out in future studies and/or measurement waves. In this study, we therefore sought to identify key parent and child characteristics that predict non-participation at different stages in a 10-year multi-rater longitudinal study of youth development.
Child participation in longitudinal studies typically relies on parental consent until the child is of an age where they are legally able to provide informed consent. It is also common for parents to directly participate in the research as informants on their child’s behavior. As such, characteristics of both the parent and child can influence participation and drop-out in studies of child and adolescent development. These characteristics are often related to those under study (e.g., Audrain, Tercyak, Goldman, & Bush, 2002; Asendorpf, van de Schoot, Denissen, & Hutterman, 2014; Noll et al., 1997; Ullebo et al., 2012), resulting in the effects due to non-random participation and non-random attrition undermining the representativeness of study samples. Moreover, non-random drop-out can introduce spurious developmental effects or mask genuine ones. Brame & Piquero (2003), for example, note that in longitudinal studies of delinquent behavior, those with the highest levels of delinquency tend to be more likely to drop-out. In such cases, estimates of normative changes in delinquent behavior over development will be negatively biased because of the selective loss of higher scoring participants.
To draw valid conclusions about developmental processes from longitudinal data, relations between participation and study outcomes need to be taken into account. Characterizing non-random attrition has important implications for the interpretation of statistical results from an affected dataset, as well as for the application of appropriate mitigation strategies. Examples of such strategies include selection models, range restriction corrections, data weighting, maximum-likelihood, multiple imputation, pattern mixture models, and random coefficient models (e.g., Asparouhov, 2005; Enders, 2011; Sackett & Yang, 2000; Schafer & Graham, 2002). It is important to note that each method comes with a different set of assumptions about the missing data mechanism. For example, maximum-likelihood estimation for missing data yields unbiased parameter estimates only if non-participation can be described as “missing at random,” that is, participation is related to the observed but not the unobserved data (Rubin, 1976). When participation is related to unobserved values over and above its relation to observed values, this is known as “missing not at random.” Here, methods such as pattern mixture modeling or random coefficient modeling may be more appropriate; however, their utility depends on how closely correlated drop-out and the variables of interest are (e.g., Schafer & Graham, 2002). Even though in most cases there is insufficient information about those who are missing to identify participation mechanisms empirically, analyzing patterns of drop-out can help researchers develop plausible hypotheses about these mechanisms. These kinds of analyses also have the potential to inform future study designs by providing a forecast of the profiles of individuals who may be most likely to drop-out. In future waves or studies, special strategies may need to be developed and/or additional resources channeled to their recruitment and retention (e.g., Eisner & Ribeaud, 2007). In this study, we therefore provide an analysis of participant factors predicting non-participation and attrition in seven waves of a longitudinal study containing two intervention arms: the Zurich Project on Social Development from Childhood to Adulthood (known as “z-proso”).
Method
z-proso
Z-proso is an ongoing multi-rater longitudinal study of child and adolescent development with a particular focus on the development of crime and aggression. The study began in 2004 when the participants were entering their first year of school, aged 7. Parents provided data at four waves of interviews, when the children were aged 7, 8, 9, and 10 (labeled “waves P1–P4”) and children provided self-report data when they were aged 7, 8, 9,10, 11, 13, 15, and 17 (labeled “waves Y1– Y7”). Additional information was provided by teachers when the children were aged 7, 8, 9, 10, 11, 13, and 15 (labeled “waves T1–T6”).
Sample
At baseline, a stratified random sampling approach was used to define the target sample with schools as the randomization units and stratification by school size and socioeconomic background. The target sample comprised all children entering first grade across 56 primary schools in the city of Zurich, Switzerland, corresponding to a total of 1675 children. Lower socioeconomic neighborhoods were slightly overrepresented. In 2004, when the study started, Zurich had a population of about 365,000, with a large proportion of immigrant-background residents. Zurich is an affluent city. The average GDP per capita was about USD 106,000 in 2004, and the unemployment rate was about 4%. Broadly representative of city demographics, the baseline target sample consisted of 39.3% German-speaking (mostly Swiss or German) primary caregivers. Over 60% of primary caregiver were not native German-speaking. The mean age of the target children at entry into primary school was 6.85 years, and the average number of siblings was 1.15.
Recruitment
Considerable efforts were employed in order to maximize participation of the baseline target sample, with a strong focus on recruiting caregivers with an immigrant background who may be less likely to agree to participate in research studies. Recruitment procedures are described in detail in Eisner & Ribeaud (2007). In brief, contact letters were written in the 10 most commonly spoken languages with native speakers of these languages taking on the role of recruiting and interviewing participants. Monetary incentives, translated support letters from school authorities, and the inclusion of community stakeholders were also used to maximize participation. Bilingual information packs with study information and consent forms (available in German, Albanian, Portuguese, Serbian/Bosnian, Spanish, Tamil, Turkish, English, Croatian, and Italian) were sent to all non-German-speaking primary caregivers. Prospective participants who did not respond to the initial information pack were contacted by phone. No upper limit on the number of trial calls to be made was imposed, and in some cases more than 20 attempts were necessary before contact was possible. Parents who could not be reached by phone were visited at home by a male and a female interviewer who explained the study in more detail. To further encourage participation, shopping vouchers worth 20 Swiss francs (CHF) were offered to parents for their participation. At the beginning of the interviews, parents were asked to sign an informed consent form for the participation of their child as well as the participation of the child’s teacher. Non-respondents were re-contacted and asked to consent to their child’s and his/her teacher’s participation only. Recruitment at waves 2 and 3 followed similar procedures with the informed consent obtained from parents at wave 1 covering the entire period from wave 1 to 3. Renewed consent, provided by the parents, was required at wave 4.
Several changes were made to the recruitment and assessment procedures in wave 5. First, parent interviews were no longer carried out. Second, at age 13, youth were able to actively consent to their own participation (Art. 16 of the Swiss Civil Code); however, parents were still provided the opportunity to opt their child out. Third, unlike in previous waves, the entire initial target sample defined at baseline could be re-contacted. Fourth, youth interviews could no longer be carried out during regular school hours and thus questionnaires were administered in classrooms outside of regular lesson times. In order to maximize participation, participants received monetary incentives worth 30 CHF and 50 CHF in waves 5 and 6, respectively. Wave 6 required renewed active youth consent. At this stage, the entire initial target sample could be re-contacted once again, and the monetary incentive increased to 60 CHF. The same recruitment procedure as described above and preceding wave 5 was followed.
Given that the times of renewal of consent represented key attrition points, four key outcomes can be defined with respect to non-random participation and attrition: baseline participation participation in wave 5 drop-out in the wave 1–3 period drop-out in the wave 5–7 period
We analyzed parent and child participation separately given the previous evidence that patterns of participation may differ across these groups (Asendorpf et al., 2014).
Measures and Statistical Procedure
We evaluated a range of predictors of attrition reflecting the core theoretical themes of z-proso as well as additional possible risk factors for non-participation that could inform recruitment and sampling design in future studies. For those who did not participate at all, the only information available was on gender, primary caregiver language, neighborhood social class, and neighborhood familialism.
Small (Special Needs) Class
The school system in the city of Zurich differentiates between regular and small classes. Small classes are intended to meet the specific needs of children with difficulties such as developmental delays, behavioral problems, language barriers, and/or learning difficulties. Typically, small classes have a size of 10 or fewer children, compared to around 20 in regular classes. The target sample comprised 9.1% of children attending a small class in year 1 of primary school.
Mother Tongue of Primary Caregiver
At the beginning of the study the City of Zurich’s School Department provided the z-proso team with a contact database of all the study participants and their parents. The most reliable proxy for the cultural background of the primary caregiver was the mother tongue as, unlike nationality, this remains unaffected by naturalization. Nonetheless, the mother tongue does not differentiate between, for example, caregivers of German or Swiss or of Portuguese or Brazilian background, and can thus be ambiguous to some extent. In the present analyses we distinguish nine groups, namely German or Swiss German (39.3%), Serbian/Bosnian/Croatian (10%), Albanian (9%), Portuguese (7%), Tamil (5.3%), Italian (5.3%), Spanish (5.1%), Turkish (4.5%), and “other” languages (14.5%).
Neighborhood Social Class and Familialism
Neighborhood characteristics were derived from census and other data that was systematically collected by the City of Zurich’s Office of Statistics. These data are aggregated at the level of the 212 statistical zones. Neighborhood social class was obtained as the factor score of three indicators, namely the unemployment rate (2002), the (inverted) percentage of self-owned households (2000), and the percentage of foreign nationals (2003). Similarly, mean household size (2000), the percentage of residents aged below 20 years (2002), and residential stability (measured as the percentage of households living in the same statistical zone as five years earlier) were used as the three indicators in order to obtain factor scores for neighborhood familialism. The residential address of each study participant was then assigned to its corresponding statistical zone and its related factor scores.
Parent Education Level and Family Composition
Parental education was measured using a dichotomous variable indexing whether the primary caregiver possessed a university education or not. Single parent status was measured using a dichotomous item measuring whether the second parent (usually the father) was living in the same household as the primary caregiver. Based on this, 29.4% of households were defined as single parent households.
Child Behavior
This was measured using the Social Behavior Questionnaire (SBQ; Tremblay, Loeber, Gagnon, Charlebois, Larivee, & LeBlanc, 1991), which captures prosocial behavior, aggression, anxiety, depression, and attention deficit hyperactivity disorder (ADHD). The z-proso study team developed a multi-informant version with matched items across a parent, a child, and a teacher version. The parent questionnaire contained all questions (55 items), and was administered in computer-assisted personal interviewing home interviews, offered in 10 different languages. Responses were given on a 5-point Likert scale (“never” to “very often”).
Teachers were surveyed by mail. The teacher version used essentially the same items and answer format as the parent version, with some adaptations to the school context and some items from the full 55-item version omitted.
For children, a specially adapted self-administered multimedia version with 54 items was used in wave 1. Based on the concept of the “Dominique interactif” (Valla, Bergeron, St. Georges, & Berthiaume, 2000), each behavior was depicted in a drawing representing either a boy or a girl, matched with the gender of the subject. A voice recorded on the laptop read out each item that was worded in an age-adequate language. The child could then answer the question by pushing a “yes” or a “no” button on the screen.
The SBQ distinguishes five major domains of children’s social behavior and scores were computed as averages of all items. Prosocial behavior (e.g., “shows sympathy to someone who has made a mistake”) was measured with 10 items in the parent (α = 0.77) version, seven items in the teacher version (α = 0.92), and 10 items in the child version (α = 0.59). Symptoms of Anxiety/Depression (e.g., “is too fearful or anxious,” “has trouble enjoying him/herself”) were measured by nine items in the parent (α = 0.71) version, by seven items in the teacher version (α = 0.90), and by nine items in the child version (α = 0.62). Symptoms of ADHD measured by nine items in the parent (α = 0.79) version, by eight items in the teacher version (α = 0.94) and by eight items in the child version (α = 0.58). The scale for non-aggressive conduct problems (e.g., “steals at home,” “tells lies and cheats”) comprised nine items in the parent (α = 0.68) version, six items in the teacher version (α = 0.81) and nine items in the child version (α = 0.60). Aggressive behavior was measured by 12 items in the parent (α = 0.79) version, by 11 items in the teacher version (α = 0.93), and by 12 items in the child version (α = 0.72). In terms of item-level missingness, prior to the receipt of the dataset, within each set of SBQ variables (e.g., all parent-reported items within a wave; all self-reported items within a wave etc.), missing item scores had been singly imputed using an expectation-maximization algorithm. The correlations among parent reports, youth self-reports, and teacher reports are provided in Supplementary Table S1. These were modest at best, ranging from 0.04 (teacher-reports and parent-reports of internalizing) up to 0.33 (teacher reports and parent reports of ADHD).
Statistical Procedure
For descriptive purposes, simple logistic regressions with listwise deletion were used to evaluate the relations between predictors and non-participation or drop-out without considering the effects of other predictors. Participation/retention was coded = 0 and non-participation/drop-out was coded = 1 such that odds ratios (ORs) > 1 reflect increased likelihood of non-participation or drop-out. Specifically, the ORs reflect the ratio of the odds of non-participation/drop-out at levels of the predictor separated by one unit. For example, an OR = 2 would indicate that the odds of dropping out double for each unit increase in the predictor. Associated (unadjusted) p values are reported for descriptive purposes. These analyses were conducted in R statistical software, using a logit link function in the glm function (R Core Team, 2016).
We then conducted a series of multiple regressions to evaluate the unique relations between each predictor and drop-out/attrition controlling for other predictors. These analyses were implemented in Lavaan, again in R Statistical Software (Rosseel, 2012), this time using probit regression. Probit and logistic regression can both be used to model the prediction of dichotomous outcomes and generally result in the same conclusions. Whereas logistic regression uses a logit function to model the probability that the outcome variable is equal to 1, probit regression uses an inverse standard normal cumulative distribution function. Probit regression coefficients can thus be interpreted as the difference in the cumulative normal probability of the outcome variable for a unit increase in the predictor. Here, probit regression was used for practical reasons, namely that it (but not logistic regression) can currently be combined with full information maximum likelihood (FIML) estimation to account for missingness in Lavaan. FIML provides unbiased parameter estimates provided data are missing at random (MAR). Predictors were entered using simultaneous entry.
To correct for multiple comparisons, we used the generalized Holm (1979) k-familywise error rate (FWER; Lehmano & Romano, 2012) method discussed by Keselman, Miller, & Holland (2011). This method was selected because it is less conservative than traditional FWER corrections that entail a substantial loss of statistical power when families of statistical tests are large. Although it is important to control type-1 errors, the current study is somewhat exploratory in nature, and it was judged more problematic to fail to identify predictors that were associated with attrition than to falsely conclude that a predictor was related to attrition when it is not. This viewpoint, in turn, comes from the importance of recognizing when and in what way attrition is non-random in order to guard against biases deriving from falsely assuming that attrition is random.
In the Holm k-FWER method, k-FWER is defined as the probability of rejecting at least k hypotheses Hi where i is a member of the set of true null hypotheses. Thus, when k is 1, this reduces to the traditional FWER correction, i.e., that which controls the probability of rejecting at least one true null hypothesis. 2-FWER controls the probability of rejecting two or more true null hypotheses (implicitly tolerating one false positive); 3-FWER, the probability of rejecting three or more true null hypotheses; and so on. Keselman et al. (2011) recommend selecting a value for k that is the nearest integer to mα where m is the number of tests conducted and α is the significance level. In total, 129 tests were conducted, giving a k value of 6. This was judged an acceptable level given the goals of the study.
The method involves considering the raw p values for all the hypotheses, ordered from smallest to largest and making a sequential adjustment to the alpha value for each or, equivalently, to the p value itself. We here report adjusted p values rather than adjusted critical values on the assumption that the former will be more informative for most readers. Both unadjusted and adjusted p values are reported later in Table 2 for information; however, all inferences were made on the basis of adjusted p values.
Results
Descriptive Statistics
Figure 1 shows the number of participating primary caregivers (subscript P) and youth (subscript Y) in each of the main data-collection waves. In wave 1, 1239 primary caregivers (74% of baseline target sample) participated and a further 121 parents provided consent for participation of the child only, meaning that 1360 young persons participated in wave 1. Between waves 1 and 2, attrition was low with 4.5% and 2.0% of primary caregivers and youth dropping out, respectively.
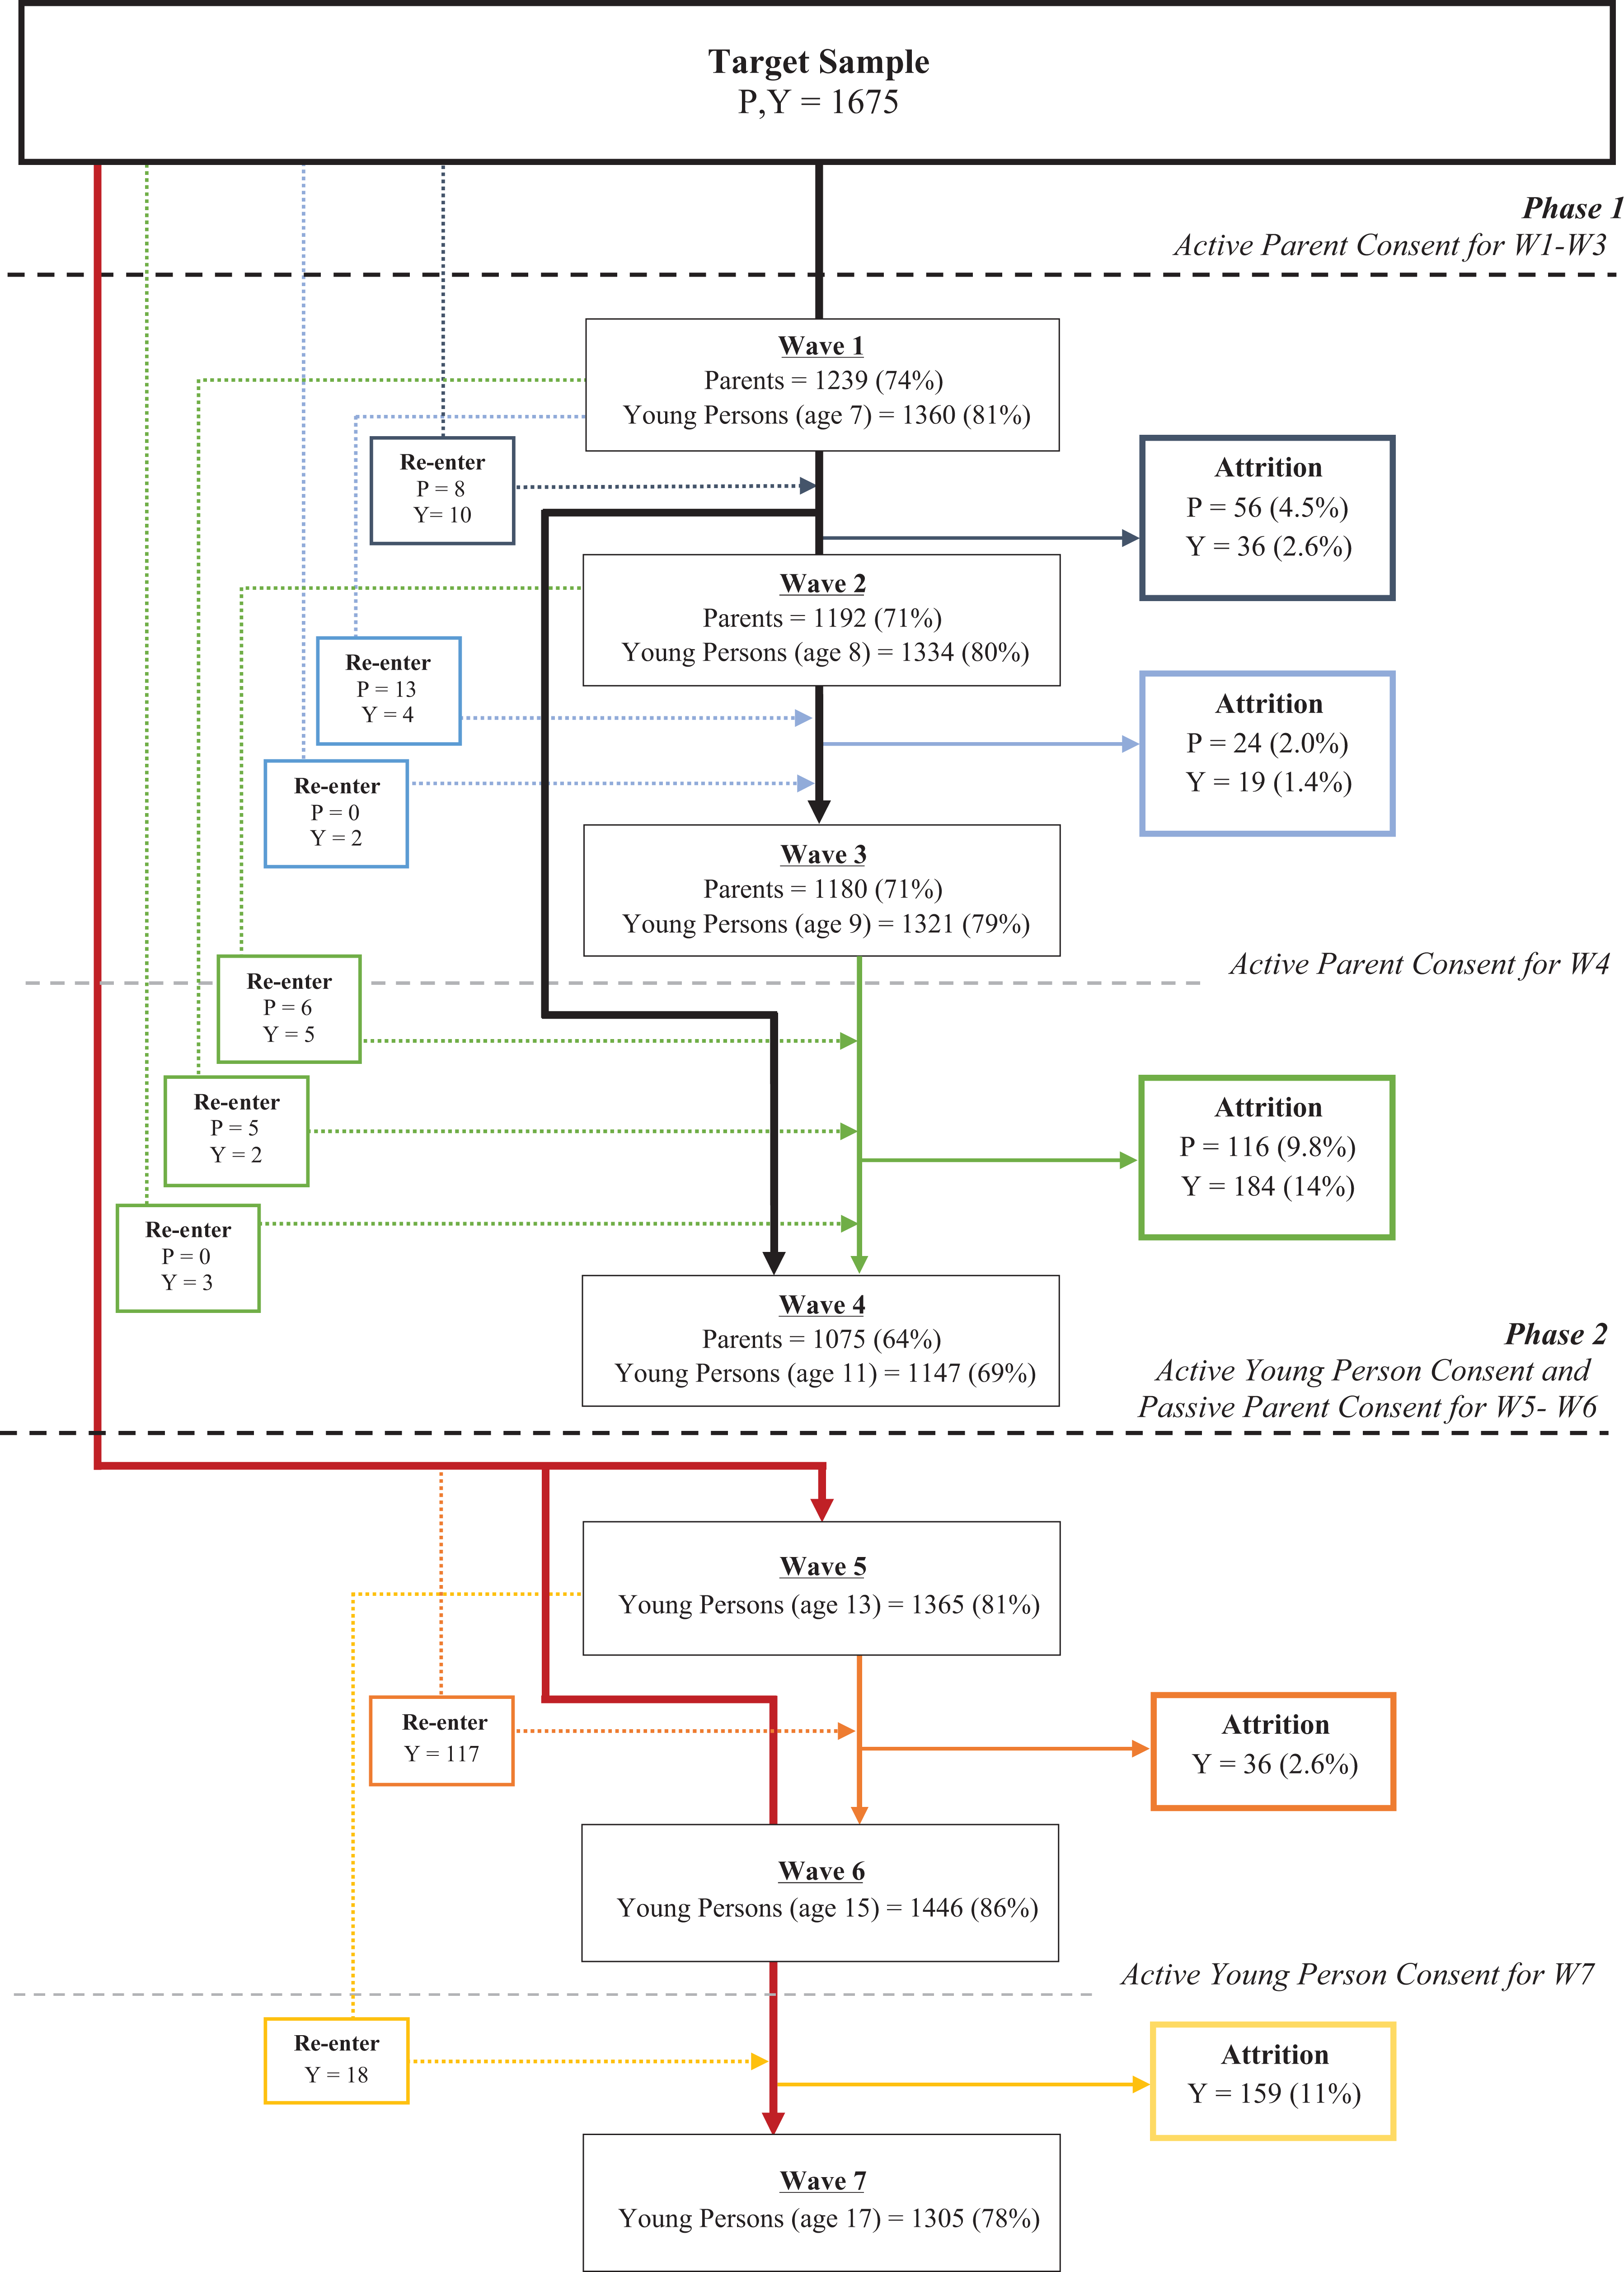
Flows of subjects across seven waves of interviews.
The bold arrows in Figure 1 show the pool of participants that could be re-contacted in each wave of the study, whereas the thin arrows highlight the number of subjects lost due to attrition between consecutive waves. In wave 4, for example, all participants that consented to participate in wave 1 could be re-contacted, resulting in a parent participation of NP = 1075 (64% of baseline target sample) and young person participation of NY = 1147 (69%). The number of parents and youth lost due to attrition between waves 3 and 4 was NP = 116 (9.8% of the parents in Wave 3) and NY = 184 (14%). Unlike in the initial recruitment into wave 1, where 121 youth participated even though their parents did not, the number of “youth-only” cases were small in wave 4. The total number of parents and youth who re-entered into wave 4 were NP = 11 and NY = 10, respectively. These participants missed one or more waves of data collection but subsequently continued to participate. This is depicted by dashed lines in Figure 1. The lowest participation rate occurred following the request for renewed parental consent in wave 4. The highest number of participation followed in wave 6, where the whole initial target sample was re-contacted, with NY = 1446 (86% of baseline target sample). Finally, after wave 7, one participant requested to be withdrawn from the study and have their data removed from the database. This participant is represented in subsequent analyses as if they did not participate at baseline and remained a non-participant thereafter. Omitting this participant, N = 1570, or 94% of the target sample participated in at least one of the seven waves.
Means/frequencies for each predictor of attrition, broken down by attrition status, are provided in Tables 1 –3. These tables also provide simple logistic regression analyses to test the unadjusted effects of each predictor prior to controlling for other predictors. The sample sizes in the table also illustrate the level of variablewise missingness at each wave.
Means/frequencies of participant background predictors and bivariate associations (ORs) with baseline response status.

Note. N = 1665–1675.
a Reference category.
b Significant at alpha < 0.05.
OR: Odds ratio.
Means/frequencies of participant background predictors and bivariate associations (ORs) with attrition status.

Note. a Reference category.
b Significant at alpha < 0.05.
OR: Odds ratio.
Means of participant behavioral predictors and bivariate associations (ORs) with attrition status.

Note. Range for all scales from ‘never’ = 0 to ‘always’ = 4.
a Significant at alpha < 0.05.
ADHD: Attention deficit hyperactivity disorder; OR: odds ratio.
Non-Participation
Results of the multiple probit regression models assessing predictors of parent and youth non-participation in wave 1 (average age 7) and wave 5 (average age 13) are provided in Table 4. After correction for multiple comparisons, parent non-participation in wave 1 was significantly predicted by neighborhood social class (b = −0.05) and several non-German first languages (ranging in effect from b = 0.18 for Portuguese to b = 0.30 for Tamil and Albanian). Youth non-participation in wave 1 was significantly predicted by the same non-German caregiver first language categories, except Tamil (ranging in effect from b = 0.17 for Portuguese, Serbian-Croatian, and Albanian up to b = 0.27 for Turkish). The only predictor with a significant unique effect on youth participation at wave 5 was membership in a small class, which was associated with a greater probability of non-participation (b = 0.12).
Multiple probit regression results predicting non-response by participant background.
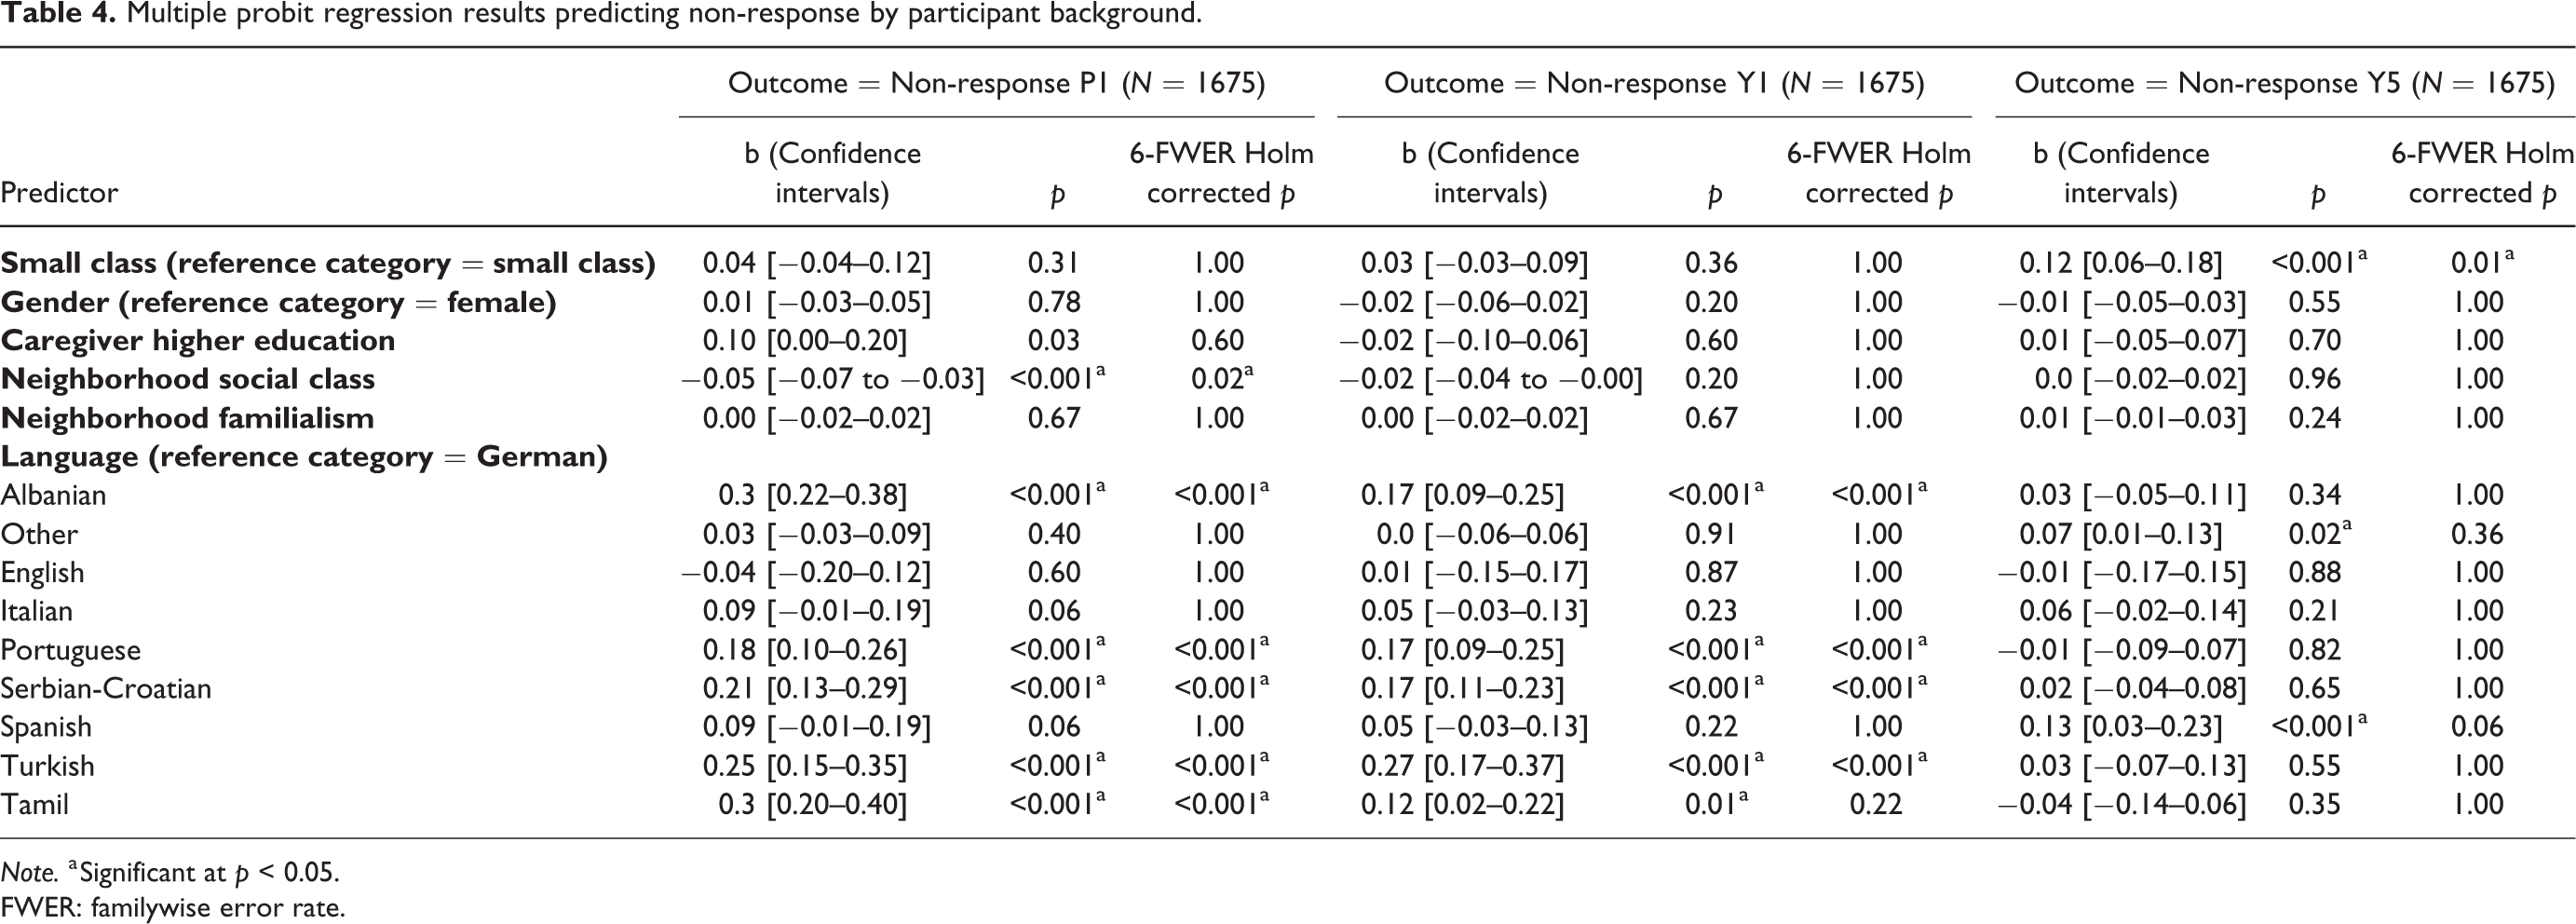
Note. a Significant at p < 0.05.
FWER: familywise error rate.
Results of the multiple probit regression models assessing predictors of dropping out are provided in Table 5. Although there were many significant effects on drop-out when considering bivariate models, there were few predictors that had significant unique effects on attrition in the multiple regression models after correcting for multiple comparisons. Being in the “Other” language category significantly predicted both parent (b = 0.13) and youth (b = 0.10) drop-out between waves 1 and 4, whereas being in the “Serbian-Croatian” category predicted youth drop-out between waves 5 and 7 (b = 0.10). As there were no strong a priori theoretical rationales for expecting higher-order effects, including interactions between predictors, these were not considered for any of the models.
Multiple probit regression results predicting attrition by participant background and behavior.
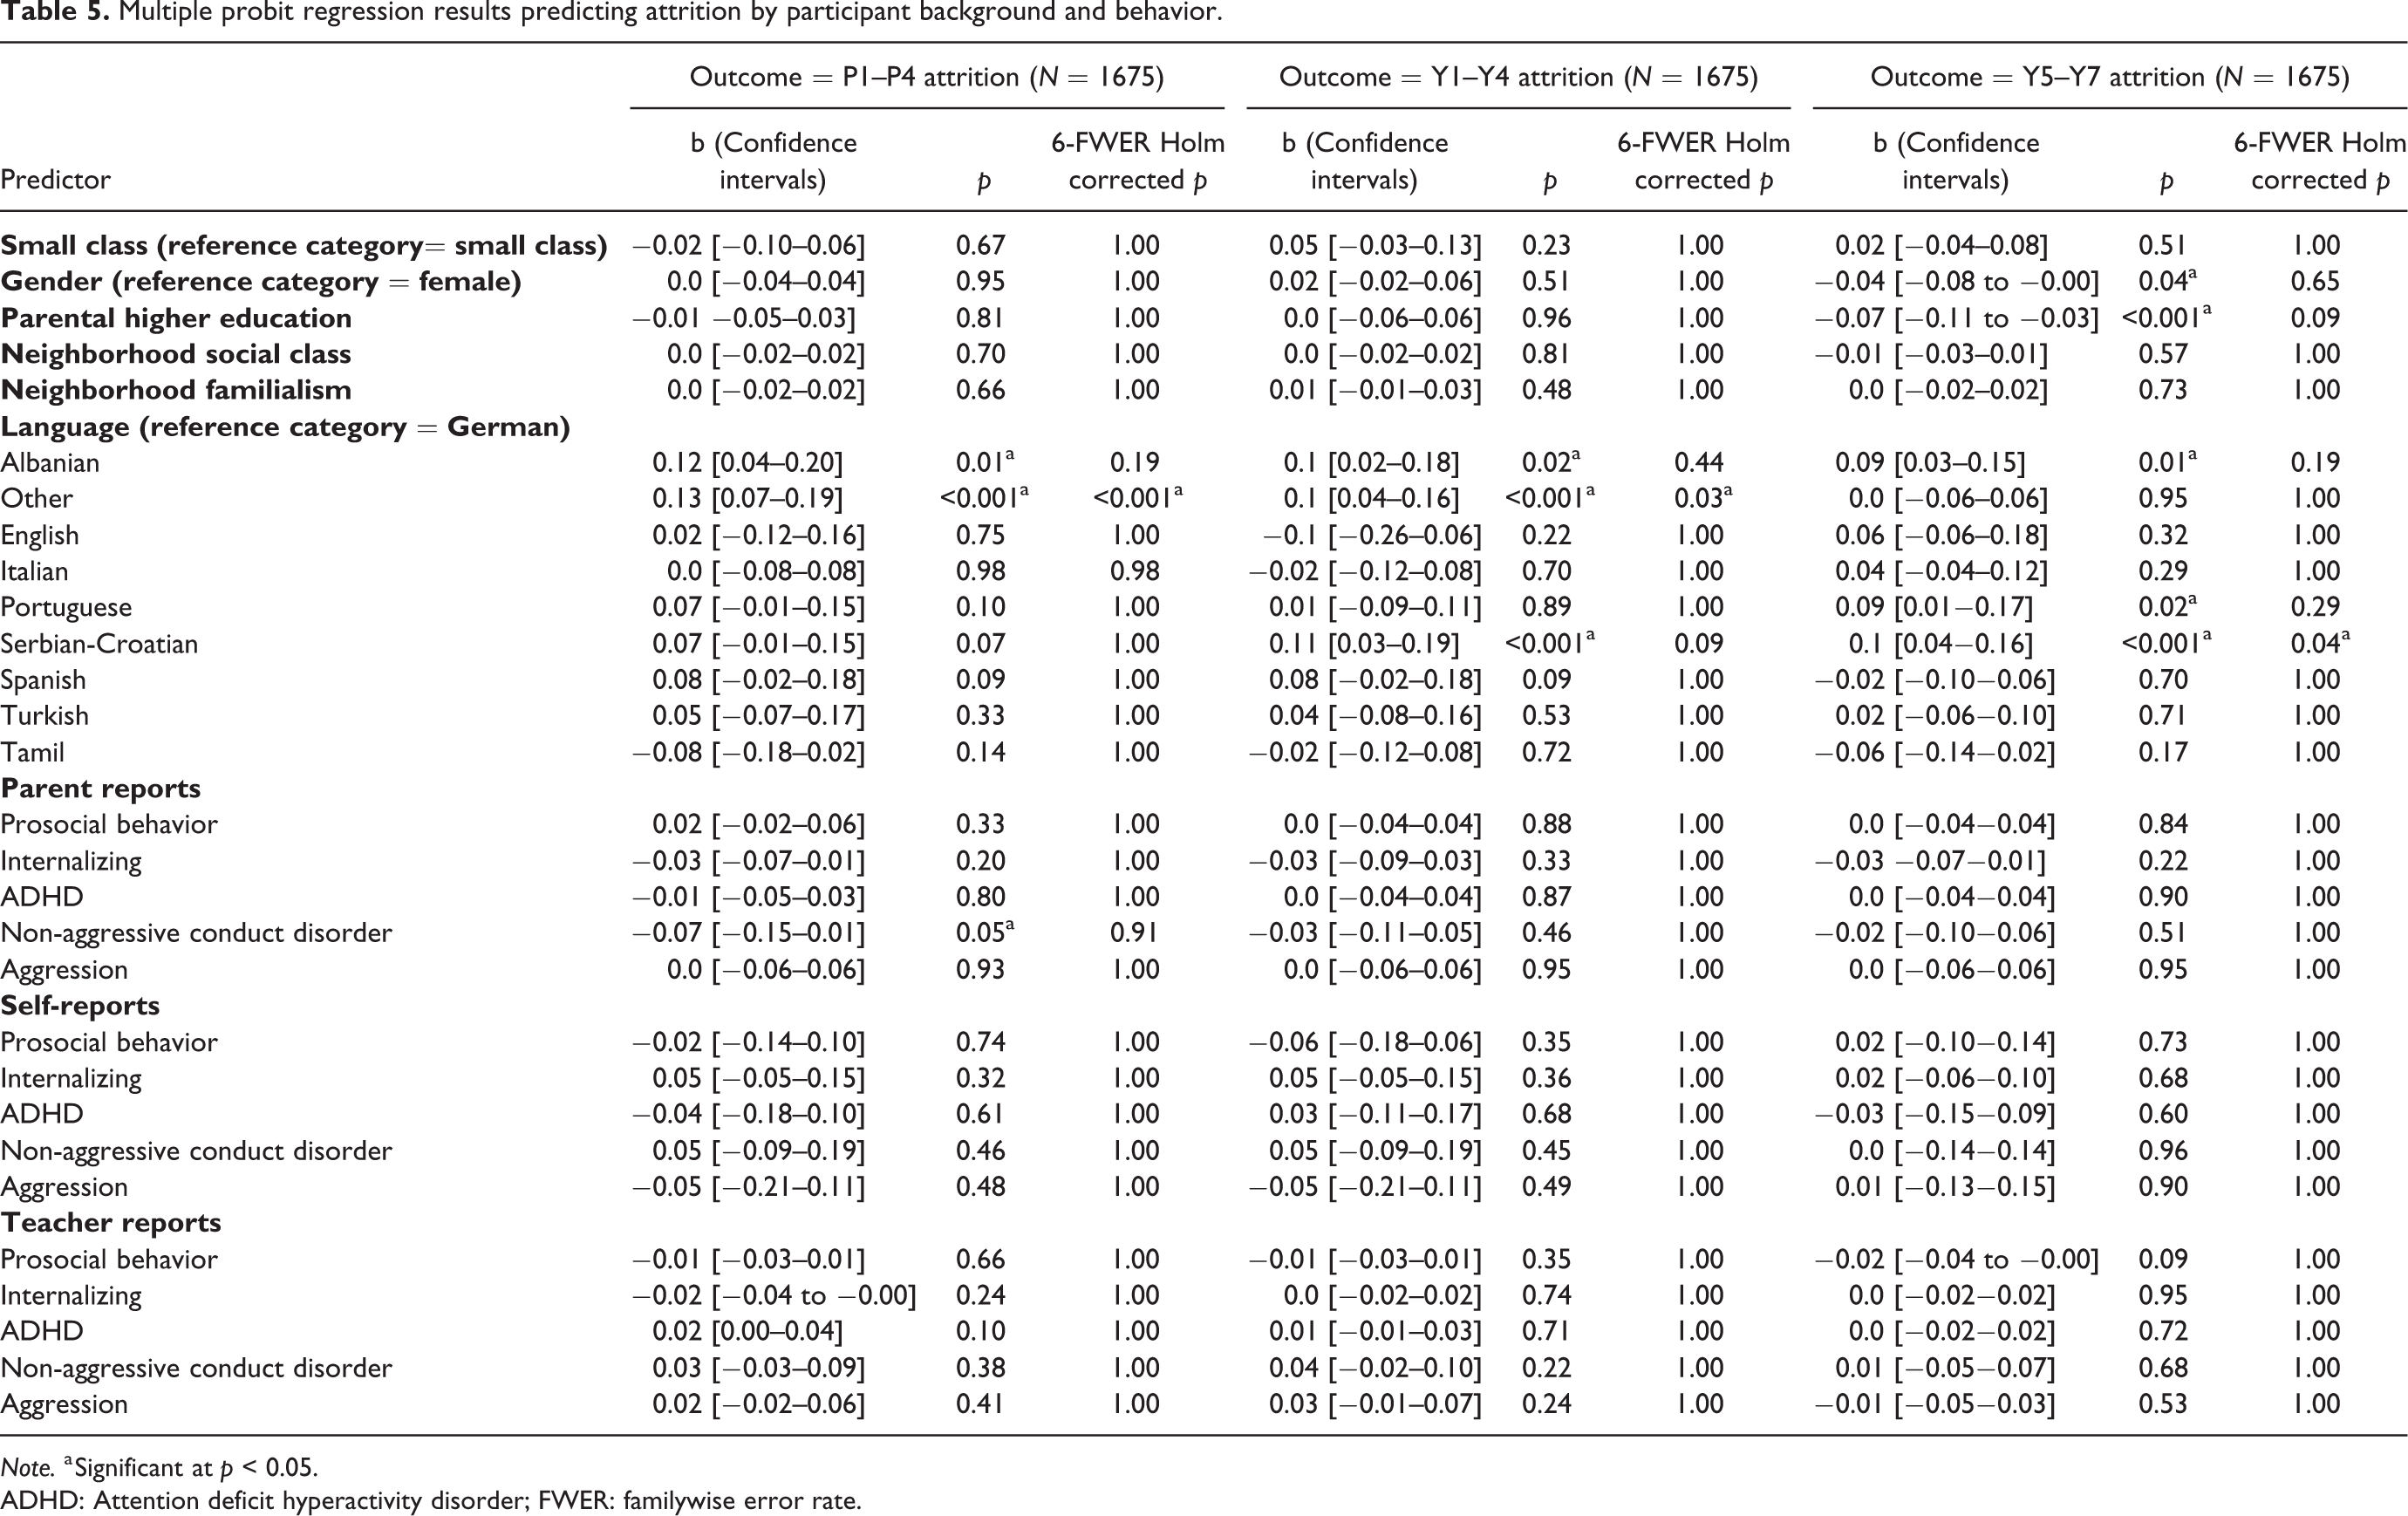
Note. a Significant at p < 0.05.
ADHD: Attention deficit hyperactivity disorder; FWER: familywise error rate.
Discussion
Longitudinal studies inevitably suffer from survey non-response and attrition. This not only results in a smaller dataset, thus reducing the power of the study, but also has the potential of introducing bias. We evaluated a number of different predictors of non-response and attrition, including characteristics of parents and children as rated by parents, children, and teachers.
We found that child and parent non-participation and drop-out were more likely among children with primary caregivers who spoke languages other than the official regional language. This was despite specific and intensive efforts to encourage participation among non-German speaking, immigrant background parents (e.g., Eisner & Ribeaud, 2007). With the exception of Italian-speaking respondents, over 90% of non-German speaking households had at least one first-generation immigrant parent. Thus, non-native speaking primary caregivers is likely to be a proxy for belonging to an immigrant minority. In this respect, our results are consistent with those from other European survey-based studies that suggest that immigrant minorities are generally more difficult to contact and are more likely to decline to participate (Couper & Leeuw, 2003; van Goor, Jamsma, & Veenstra, 2005; Kapteyn, Michaud, Smith, & van Soest, 2006).
Even though we were unable to collect data on reasons for non-participation among these individuals, it is possible to speculate as to its cause. First, some participants may have felt intimidated by the prospect of participating in an interview in a foreign country. Second, sociocultural minorities are often in a more vulnerable position. Amongst other factors, their legal residence status may still be undecided, they may have had adverse experiences with immigration authorities or they may have faced persecution in their home countries, which could generalize to a lack of trust in research studies. This may be exacerbated by study topics that could be considered sensitive. Third, immigrant minority caregivers have, on average, a more limited educational background and lower socio-economic status (Eisner & Denis, 2007). Multiple studies have shown that educational level is an important predictor of participation in research (e.g., Stoop, 2005; van Loon, Tijhuis, Picavet, Surtees, & Ormel, 2003; Korkeila, Suominen, Ahvenainen, Ojanlatva, Rautava, Helenius, & Koskenvuo, 2001; Curtin, Presser & Singer, 2000). In this study, the question of whether or not caregivers had a university education was not a significant predictor of parent or youth drop-out over the early waves. However, we did not have parental education data for parents who did not participate in the study at all, meaning that we could only indirectly test whether this was associated with participation at wave 1 based on FIML estimates.
Finally, cultural factors may have played a role. Whereas in many countries it is common custom to participate in surveys and answer personal questions, in other cultures giving personal information to a stranger is counter-normative (e.g., Johnson, O’Rourke, Burris, & Owens, 2002). Although we have no direct evidence that this was the case in z-proso, this could be one aspect to explore in future research. Overall, our results suggest that translation of invitation letters and additional efforts to contact immigrant background participants may be insufficient to mitigate the tendency to decline to participate and to drop-out. Differing cultural attitudes and sources of apprehension must also be addressed as part of recruitment strategies. That said, there is some indirect evidence that the additional efforts invested in recruiting individuals from an immigrant minority status helped mitigate under-representation of these individuals in the sample. For example, at baseline, a higher proportion of those from an immigrant minority background were recruited via more “active” methods (active telephone recruitment) than more “passive” methods (participants answering an invitation by response slip; Eisner & Ribeaud, 2007). Specifically, 28% of the target sample from non-German speaking minorities were recruited via the return of a response slip, whereas 33.7% were recruited by telephone. In contrast, among the target sample of German-speakers 63.8% were recruited by reply slip and 24% via telephone contact. As home visit recruitments were extremely rare, they were combined with the telephone recruitment category. This suggests that investing additional efforts in recruiting immigrant minorities can improve response rates and that, in fact, these additional efforts may produce greater returns in immigrant minority groups than in non-minority groups.
Although they had no unique significant effect on non-participation, it is also worth highlighting the bivariate association between child behavior and non-participation as an area for potential future investigation. Based on bivariate analyses and in accord with teacher reports of child behavior, child aggression, non-aggressive conduct problems, ADHD, internalizing, and prosociality predicted parental and youth drop-out during the wave 1–4 phase. Specifically, both parents and youth were more likely to drop-out if the child showed higher levels of psychopathology, whereas parents reported a greater likelihood of drop-out where their child showed lower levels of psychopathology. These results are consistent with past research, which suggests that children exhibiting disruptive behavior often show difficulties functioning within the school context (e.g., Barry, Lyman, & Klinger, 2002). Moreover, in terms of participation in research studies, by definition children with high levels of ADHD symptomology may avoid and find it very difficult to engage in tasks that include sustained attention (American Psychiatric Association, 2013). This will almost certainly include completing study measures. Further, it has been suggested that parents of children with conduct problems may have a tendency to “disengage” from the child and their problem behavior, an effect which would presumably carry over into participation in studies (e.g., Patterson, 1982). As such, studies seeking to retain the most disruptive children must take into account possible difficulties such as the child having a poor bond or negative associations with school context, difficulties completing measures, and parents who are avoidant of or psychologically disengaged from their child’s behavior. In these cases, measures such as offering assessments outside of the school setting and breaking up the assessment into multiple sessions may help mitigate the loss of participants with ADHD and/or disruptive behaviors.
Notably, despite positive correlations between parent and teacher reports on all behaviors, parent reports of child behavior suggested exactly the opposite pattern to that suggested by teachers. Parent-reports suggested that attrition was more likely when their child was well-adjusted. Although it is common for different raters to disagree on child behavior (e.g., De Los Reyes, 2011), that these two raters suggested completely contradictory results is striking. One possibility is that children show context-specific negative behavior and that negative behavior in the school environment is particularly undermining of tendencies to engage with research projects conducted in the school setting. Another possibility, however, is that socially desirable responding on the part of parents with children displaying disruptive behaviors accounts for the counterintuitive association between parent-reported child behavior and study participation (e.g., Johnson, Fenrich, & Mackesy-Amiti, 2012; Mundia, 2011; Eisner & Ribeaud, 2007). However, it is also important to emphasize that in the multiple regressions, neither teacher- nor parent-reported child behavior was uniquely associated with attrition. Thus, any effects of behavior cannot be easily disentangled from one another, nor from the effects of other factors that may affect non-participation, such as immigrant minority status discussed above.
Our result suggested that the dynamics of attrition and non-response changed once children/youths could provide their own active consent, highlighting the need for different retention methods based on the target sample. We found that being able to re-contact the entire initial target sample going into waves 5 and 6 greatly improved our overall participation, resulting in a highest-young-person–participation rate occurring in wave 6. We note that re-contacting entire target samples is not always a viable option, and regulations may vary depending on location; nonetheless, we emphasize the positive outcomes this can have on participation rates. Furthermore, it is important to identify more vulnerable samples in the early stages of the study, so that long-term retention plans can be implemented in order to retain or regain participants.
Collectively, our results suggested that participation and attrition in z-proso are related to characteristics of the children under study. As such, our data would not qualify as missing-completely-at-random, rendering analysis methods involving listwise or pairwise deletion inappropriate. Under the assumption of MAR, methods such as maximum likelihood estimation or multiple imputation could likely address parameter bias due to non-random attrition. The question of whether the data qualifies as MAR is more difficult to answer because this would require knowledge of unobserved data. However, given the comprehensiveness of the list of measures obtained in z-proso (see Ribeaud & Eisner, 2010) and the relatively low rates of attrition observed overall, we would argue that, provided a sufficient set of auxiliary variables is used, any additional attrition following a “not MAR” mechanism may have only a small effect. We, therefore, believe that users of the z-proso dataset could be justified in employing methods such as multiple imputation or maximum likelihood estimation, drawing on a range of auxiliary variables for testing developmental hypotheses. However, it is always best-practice to use a range of methods, especially those that make different assumptions about mechanisms of missingness (e.g., pattern mixture modeling versus FIML estimation) to evaluate the sensitivity of results to the chosen method of dealing with missing data. In addition, our goal here was not to provide an exhaustive analysis of all the factors that may predict attrition for the purposes of aiming to achieve MAR, but to focus on a smaller number of theoretically motivated predictors that may help researchers to understand why certain individuals may be more likely to drop-out than others. This in turn can help inform recruitment and retention in future studies and future waves of existing longitudinal studies. Thus, we would advise users of the dataset to consider an even broader range of predictors as auxiliary variables, as well as their non-linear effects and interactions.
Finally, it is important to consider the limitations of the current study. First, we did not ask participants to report on their reasons for non-response. This would have allowed us to understand proximal causes of non-participation. Second, we had only limited information on those who declined to participate at baseline. Third, we included a limited number of predictors of attrition, focusing specifically on those that represented the core themes of z-proso and/or which were predicted to show a relation to attrition based on past research. Future research will be valuable in identifying other variables that may be related to selective non-participation.
Conclusion
Studying patterns of attrition has the potential to inform future study design, as well as provide information pertinent to the interpretation or correction of statistical effects in studies affected by non-random participation. In this study, we evaluated the characteristics associated with non-participation and attrition in a 10-year longitudinal study of child development. The design of the study allowed for a unique comparison of factors associated with non-participation of parents and youths as well as attrition due to various phases of renewed consent. This is because during the initial waves of the study the decisions on study participation were made by the primary caregiver of the target subject, whereas in later waves the youths themselves were able to provide informed consent. We found several predictors of non-participation and attrition, including characteristics of both the parent and child.
Our results showed that non-response and attrition was highest among certain immigrant background, non-native speaking parents, despite the significant efforts made to recruit these subjects. This result is in agreement with previous findings (e.g., Couper & Leeuw, 2003) and could be due to a number of reasons, reviewed above.
Child behavior was also found to be a significant predictor of attrition in the bi-variate analyses. Between waves 1 and 4, aggression, non-aggressive conduct problems, ADHD, internalizing and prosociality, as rated by teachers were all predictors of child drop-out. This was in direct disagreement with the reporting of parents, which suggested that children with lower levels of problem behaviors were less likely to participate. A possible explanation for these contradictory results relates to social desirability bias, where parents of children with disruptive behavior are more likely to project a good image of themselves by responding in the “most desirable” way. A further explanation could be context specific behavior of the child, resulting in a disagreement between parents and teachers.
Supplementary Materials
JBD797004_supplementary_table_1 - A Practical Guide to the Analysis of Non-Response and Attrition in Longitudinal Research Using a Real Data Example
JBD797004_supplementary_table_1 for A Practical Guide to the Analysis of Non-Response and Attrition in Longitudinal Research Using a Real Data Example by Nora L. Eisner, Aja L. Murray, Manuel Eisner, and Denis Ribeaud in International Journal of Behavioral Development
Footnotes
Acknowledgements
We are grateful to the children, parents, and teachers who provided data for the z-proso study and the research assistants involved in its collection.
Funding
The authors disclosed receipt of the following financial support for the research, authorship, and/or publication of this article: Funding from the Jacobs Foundation (Grant 2010-888) and the Swiss National Science Foundation (Grants 100013_116829 and 100014_132124) is gratefully acknowledged.

Supplemental Materials
Supplemental material for this article is available online.
References
Supplementary Material
Please find the following supplemental material available below.
For Open Access articles published under a Creative Commons License, all supplemental material carries the same license as the article it is associated with.
For non-Open Access articles published, all supplemental material carries a non-exclusive license, and permission requests for re-use of supplemental material or any part of supplemental material shall be sent directly to the copyright owner as specified in the copyright notice associated with the article.
