
Abstract
Financial news plays a significant role with regard to predicting the behaviour of financial markets. However, the exponential growth of financial news on the Web has led to a need for new technologies that automatically collect and categorise large volumes of information in a fast and easy manner. Sentiment analysis, or opinion mining, is the field of study that analyses people’s opinions, moods and evaluations using written text on Web platforms. In recent research, a substantial effort has been made to develop sophisticated methods with which to classify sentiments in the financial domain. However, there is a lack of approaches that analyse the positive or negative orientation of each aspect contained in a document. In this respect, we propose a new sentiment analysis method for feature and news polarity classification. The method presented is based on an ontology-driven approach that makes it possible to semantically describe relations between concepts in the financial news domain. The polarity of the features in each document is also calculated by taking into account the words from around the linguistic expression of the feature. These words are obtained by using the ‘N_GRAM After’, ‘N_GRAM Before’, ‘N_GRAM Around’ and ‘All_Phrase’ methods. The effectiveness of our method has been proved by carrying out a set of experiments on a corpus of 1000 financial news items. Our proposal obtained encouraging results with an accuracy of 66.7% and an F-measure of 64.9% for feature polarity classification and an accuracy of 89.8% and an F-measure of 89.7% for news polarity classification. The experimental results additionally show that the N_GRAM Around method provides the best average results.
1. Introduction
Sentiment analysis, also known as opinion mining, has become a popular topic since it enables the study of unstructured Web data in order to understand public opinion. In this respect, sentiment analysis is employed to extract users’ opinions from textual data. Public opinion gathering is gaining momentum, particularly in terms of product preferences, marketing campaigns, political movements, financial aspects and company strategies. Opinions are very important when one person wishes to hear another’s views before making a decision. Several of the authors who have attempted to create an automated system that will perform an effective sentiment analysis have based their works on two main approaches: Semantic Orientation and Machine learning. The Semantic Orientation (SO) approach makes use of lexicons such as WordNet-Affect [1] and SentiWordNet [2], while the Machine learning (ML) methods often rely on supervised classification. This approach is based on using a collection of data to train classifiers. The machine learning techniques commonly used in sentiment polarity classification are Support Vector Machine (SVM) [3–6], Naive Bayes (NB) [7, 8] and Maximum Entropy (MaxEnt) [9], among others. Both approaches have their advantages and drawbacks. On the one hand, the machine learning approach depends on the availability of labelled datasets which are, in many cases, impossible or difficult to attain. On the other hand, the semantic orientation approach requires linguistic resources, which generally depend on the language. In this paper, we have based our proposal on the SO approach by using the SentiWordNet lexical resource, which assigns the following three sentiment scores to each synset of WordNet: positivity, negativity and objectivity. SentiwordNet has been widely used in recent semantic orientation based sentiment classification studies and has obtained encouraging results [10, 11].
Moreover, several pieces of research have been conducted in recent years in order to improve polarity classification. These approaches are based on three different levels: document level; sentence level; and feature level. In a document-level classification, the document is classified as a whole, as occurs in Moraes et al. [4]. In a sentence-level classification, the document is divided into sentences, each of which is classified, as occurs in Zhang and He [12] and Fu and Wang [13]. Finally, the feature-level classification aims to classify each feature detected in the document, as occurs in Peñalver-Martinez et al. [14], Erdmann et al. [15] and Mukherjee and Bhattacharyya [16]. However, classifying documents at the document or sentence level does not indicate what the user likes and dislikes. A positive document on an object does not necessarily mean that the user has positive opinions on all aspects or features of that object. Likewise, it is impossible to ensure that a negative document signifies that the user dislikes everything about the object. In a document (e.g. a news item), the user typically writes about both the positive and negative aspects of the object, although the general sentiment towards that object may be positive or negative. In order to obtain such detailed aspects, it is necessary to perform what is called ‘feature-based opinion mining’.
Thus, we propose a method for feature-based opinion mining that uses an ontology, with the objective of semantically describing relations between concepts in a specific domain. Ontologies allow static knowledge representation and enable knowledge sharing and reuse, thus reducing the effort needed to implement expert systems. Ontologies are currently being applied in several different domains, such as cloud computing [17, 18], natural language interfaces [19], recommender systems [20], search engines [21], human perception [22] or bioinformatics [23], among others. One of the reasons for the increasing popularity of this research field is the possibility of providing a shared and common understanding of a particular domain that can be communicated between people and software applications. In summary, the use of ontologies improves the chances of successfully performing any task related to knowledge and information management.
Sentiment classification has been investigated in various domains such as movie reviews, product reviews and financial news, among others. However, the financial news domain has been considered by very few works and no positive results have been obtained owing to the fact that financial texts often include more complex sentiment structures [24]. The news conveys information, which leads different investors to make decisions. For example, if the information is focused on a company’s losses and not its profits, this may influence the investors’ decision to buy shares in the company or the industry in which the company operates. It is for these reasons that the main motivation of this work is the financial news domain.
This paper is structured as follows: Section 2 presents the state of the art on opinion mining. Section 3 presents the architecture and functionality of our proposal. Section 4 shows a set of experiments carried out to validate the proposed method, along with a comparison of the results with related work. Finally, Section 5 describes our conclusions and future work.
2. Related works
Many researchers have recently developed relevant research in the area of opinion mining and have focused on two main research directions, i.e. the ML approach and the SO-based approach. Some proposals based on the SO approach make use of sentiment lexicons. For example, in Montejo-Ráez et al. [25], an unsupervised approach for polarity classification in Twitter is presented. The authors integrate SentiWordNet in order to compute the final value of polarity. The synset values are weighted with the PageRank scores obtained in the random walk process on WordNet. The work presented in Peñalver-Martinez et al. [14], meanwhile, proposes an innovative opinion mining methodology that takes advantage of new semantic Web-guided solutions to enhance the results obtained with traditional natural language processing techniques, sentiment analysis processes and Semantic Web technologies. This proposal is specifically based on three different stages: (1) an ontology-based mechanism for feature identification; (2) a technique with which to assign a polarity to each feature based on SentiWordNet; and (3) a new approach for opinion mining based on vector analysis. In Ghosh and Animesh [26], a rule-based method that can be used to identify the sentiment polarity of opinion sentences is presented. The authors use SentiWordNet to calculate the overall sentiment score of each sentence. The results obtained in this work indicate that SentiWordNet could be used as an important resource for sentiment classification tasks.
Some other more recent proposals are based on psycholinguistic tools for sentiment analysis such as LIWC [27–30]. LIWC provides a dictionary in several languages, such as Spanish, English, French and German, among others. The proposals construct a SO-based lexicon from two of the LIWC’s 76 categories (‘Positive emotion’ and ‘Negative emotion’) with words such as love, nice, good, great, hurt, ugly, sad, bad and worse, among others. The LIWC English dictionary is most frequently used in this type of study [27, 29, 30]. However, other languages in the LIWC dictionary, such as Portuguese [28] and Spanish [31], are also used in some proposals.
Furthermore, other proposals introduce methods based on machine learning. For example, Salas-Zárate et al. [32] examine how classifiers work while carrying out opinion mining of Spanish Twitter data. They explore how different settings (n-gram size, corpus size, the number of sentiment classes, balanced vs. unbalanced corpus, various domains) affect the precision of the machine learning algorithms and experiment with Naïve Bayes, Decision Tree and Support Vector Machines. Azmi and Alzanin [33] propose a system with which to detect the polarity of comments that users write anonymously in the online edition of Saudi newspapers. The authors use a naïve Bayes classifier with an n-gram approach to extract the public opinion polarity. Opinions are classified into four categories (strongly positive, positive, negative and strongly negative). The work presented by Mohammad et al. [34], meanwhile, proposes a basic automatic system that can be used to classify tweets and determine who is feeling what emotion and towards whom. This was done by training a Support Vector Machine (SVM) classifier. Onan and Korukoğlu [35] present a framework that obtains individual feature rankings with information gain, chi-square, gain ratio, symmetrical uncertainty, the Pearson correlation coefficient, the ReliefF algorithm and probabilistic significance measure-based feature selection methods. The individual lists obtained by the different feature selection methods are amalgamated into a single ranking list via a genetic algorithm. Their experimental results are evaluated on nine datasets from various domains. In the evaluation, Naïve Bayes and K-nearest neighbour algorithms are used as the learning algorithms.
Most of the experiments carried out in sentiment analysis proposals, however, take place in the movie domain [3, 4, 7, 14, 36]. Some other proposals use corpora that include topics such as music [35, 37], hotels [3, 38] and products [39]. Conversely, few proposals [40–42] have analysed the financial news domain and the complexity of this domain signifies that no positive results have been obtained to date.
We should state that our work differs from the existing works for several reasons: (1) most of the aforementioned proposals are based on a document-level or sentence-level approach for polarity identification, although both approaches have drawbacks since an entire document or a single sentence could contain different opinions about different features of the same product or service, which has prompted us to propose a method based on a feature-level approach in an attempt to detect entities contained in the news and then obtain the polarity of each one; (2) we attempt to improve feature-based opinion mining by including semantic and knowledge representation technologies, such as ontologies; (3) we consider the number of occurrences of each feature in the text in addition to the part of the text in which the feature was identified; and (4) we validate our system in a financial news domain, which has seldom been covered owing to the complexity of its terms.
3. Feature-based sentiment analysis
This section presents the architecture and functionality of our proposal. This architecture relies on four main components: (1) a pre-processing module; (2) a semantic annotation module; (3) feature polarity identification; and (4) document polarity classification. As will be shown in the following sections, the approach presented has been tested on the English language by using a corpus of news concerning the financial domain. Figure 1 shows the complete architecture of the system. The approach presented here requires a corpus as the input parameter in order to classify each document based on the features contained within it. This process involves the natural language processing of the corpus in order to obtain the syntactic structure of the documents, remove stop words and obtain the lemma of each word contained in the documents, among others. Once the corpus has been processed, the system detects features by means of the semantic annotation technique. The system then calculates the polarity of each feature found based on the SentiWordNet lexicon. Finally, the system classifies each document on the basis of the data obtained by the previous module. A detailed description of the modules contained in the architecture shown above is provided in the following sections.

System architecture.
3.1 Pre-processing module
The pre-processing module involves the use of NLP (Natural Language Processing) techniques in order to obtain the syntactic information from each document contained in the corpus. In this work, we have used Stanford CoreNLP, a Java annotation pipeline framework that integrates many NLP tools, including the part-of-speech (POS) tagger, the named entity recogniser (NER), the parser, the coreference resolution system and the bootstrapped pattern learning tools [43].
The system employs the following NLP techniques before extracting features from the document.
Tokenisation: The sentences are divided into words or tokens by removing white spaces and other symbols or special characters.
Sentence splitter: This process assembles the tokenised text into sentences.
POS tagging: This technique processes a sequence of words and assigns a lexical category to each word. Examples of these categories are: NNP (proper noun, singular); VBZ (verb, third person singular present); VBN (verb, past participle); and IN (preposition / subordinating conjunction), among others. The full list of categories is presented in Cunningham et al. [44].
Lemmatisation: This technique refers to the process of mapping words onto their base form. For example, the words ‘buys’ and ‘buying’ are mapped onto ‘buy’.
The removal of stop words: The first step needed to reduce the feature space is that of removing the stop words (connective words, such as ‘of’, ‘the’, ‘in’).
Figure 2 shows an example of an excerpt from financial news, while Figure 3 shows the NLP processing result obtained for this example. As can be seen: (1) the first part presents the raw word; (2) the second part represents the lexical category assigned to the word; and (3) the third part shows the lemma of the word.

Excerpt of a financial news item.
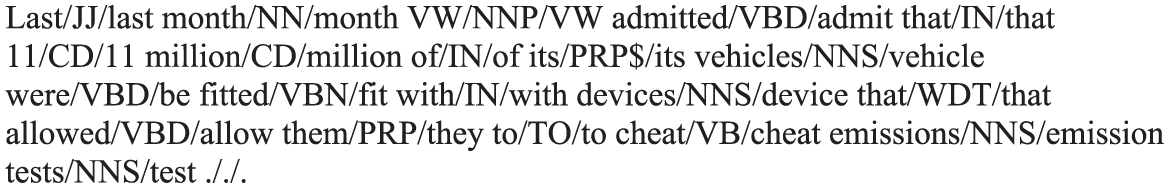
NLP techniques applied to an excerpt from a financial news item.
Finally, words that have little relevance to the context (stop words) are removed in order to decrease the text size of the news and analyse only the text that denotes a positive, neutral or negative sentiment.
3.2 Semantic annotation module
According to Power [45], semantic technologies are reaching a certain degree of maturity that allows them to be considered as a consistent and reliable basis for the handling and visualization of financial data [46]. Several ontologies in the financial context have been generated in the last few years. An example of this kind of ontologies is the BORO (Business Object Reference Ontology) ontology [47], which is intended to be suitable as a basis for facilitating, among other things, the semantic interoperability of enterprises’ operational systems. Furthermore, the TOVE (Toronto Virtual Enterprise) ontology [48], developed by the Enterprise Integration laboratory at Toronto University, describes a standard organisation company as the set of processes that compounds the organisation. A further example is the financial ontology developed by the DIP (Data Information and Process Integration) consortium, which is mainly focused on describing semantic web services in the stock market domain. Finally, the XBRL ontology Specification Group [49] developed a set of ontologies whose objective is to describe the financial and economic data in RDF in order to share and interchange data in different applications. It should be noted that this ontology is becoming an open standard means of electronically communicating information among business, banks and regulators.
Since our objective is to detect features concerning the financial domain, e.g. companies, products, CEOs, among others, included in news items, we have built a financial ontology based on the ontologies mentioned above. The main goal of this ontology is to provide a controlled vocabulary in order to semantically describe relations between concepts in the financial news domain. For example, when a user makes references to companies such as Apple or Microsoft, these are recognized as individuals belonging to the ‘Company’ concept included in the ontology proposed herein, while currencies such as the US dollar or the Euro will be considered as individuals of the ‘Currency’ concept.
The ontology proposed is described using the Web Ontology Language (OWL) 2. The ontology defines 247 classes, 86 subclass axioms, 34 data type properties, 38 object properties and 87 restrictions. An extract of the ontology built is shown in Figure 4. The three outstanding concepts of the ontology proposed are described below:
Financial market: This represents the mechanism that facilitates the purchase and sale of financial assets such as stocks, commodities and currencies, to mention but a few. The main stock markets (New York Stock Exchange, NASDAQ and London Stock Exchange) have been modelled in the ontology proposed as subclasses of the ‘Stock_market’ class.
Financial intermediary: This represents the entities that typically invest in financial markets, such as insurance companies, financial advisers and banks, among others.
Asset: This represents everything that can be the object of an investment, such as stock market indexes, commodities, companies, currencies, among others.

Financial domain ontology.
3.3. Feature polarity identification
In this module, the polarity of the features in each document is calculated. First, we take into account the position of the linguistic expression that represents the feature within the text. According to the idea described in Peñalver-Martinez et al. [14], a polarity score is calculated for each feature identified in the document, based on equation (1).

In the above equation used to calculate the score of a given feature in a news item, the position of the linguistic expression that represents the feature within the text is taken into consideration using the parameter Zj. This is done by dividing the text into three equal parts: (1) the beginning (Z1); (2) the middle (Z2); and (3) the end of the news item (Z3). The values for Z1, Z2 and Z3 will thus have an impact on the polarity of a feature in a news item and the global polarity of the news. These parameters can take three different values: ‘High (H)’, ‘Medium (M)’ or ‘Low (L)’, which have, for the purpose of this work, been mapped onto 100, 50 and 25, respectively. In the Evaluation and Results section (Section 4.2), the importance of these three parameters is proven by showing a comparison between the values of these three parameters and the accuracy of both the feature polarity and the global polarity of the news.
Furthermore, |Oj| is the number of occurrences of the feature f in the part of the text Zj of the doci. In order to clarify this, let us consider a case in which the feature ‘market’ is contained in the text five times: twice at the beginning, once in the middle and twice at the end, and the influence level of Zj is: Z1=M, Z2=L and Z3=H. Thus, the score of the feature ‘market’ is the following:

Second, we identified the words from around the linguistic expression of the feature f. This process has been carried out using the ‘N_GRAM After’, ‘N_GRAM Before’, ‘N_GRAM Around’ and ‘All_Phrase’ methods, which have already been studied in literature [14].
‘N_GRAM After’, ‘N_GRAM Before’ and ‘N_GRAM Around’ obtain the N_GRAM words after, before and around the linguistic expression of the feature in the document, while the ‘All_Phrase’ method obtains all the words in the same sentence as the linguistic expression of the feature in the document.
Third, the polarity of the closest words to the feature identified is calculated by using SentiWordNet (SWN) [50]. SWN is a lexical resource that associates three numeric values with each synset of WordNet: positivity, negativity and objectivity. The sum of all three values is equal to 1. Each entry in SWN has multiple senses. The positive (ScorePosSwn), negative (ScoreNegSwn) and neutral (ScoreNeuSwn) scores of each word are calculated as the average of the senses whose category corresponds to a POS-tag assigned to the word; e.g. the word ‘cheat’ has nine senses in SWN (five that belong to the category ‘noun’ and four that belong to the category ‘verb’). In accordance with the example presented in Figure 2, the word ‘cheat’ belongs to the category ‘verb’, since it was labelled as ‘VB (verb, base form)’. Hence, four senses belong to this word, thus allowing the following positive, negative and neutral average scores to be obtained: ScorePosSwn = 0, ScoreNegSwn = 0.156, and ScoreNeuSwn = 0.844.
The positive, negative and neutral scores of each feature are then calculated using the following equations:


where score(fi,doc) is the value obtained from equation (1). ScorePosSwn, ScoreNegSwn and ScoreNeuSwn are the positive, negative or neutral scores obtained by means of SWN for each word (w), which belongs to the set of words (wfi) obtained using the four N_GRAM methods, for each feature(fi).
A feature is therefore positive if ScorePos(fi) > ScoreNeg(fi) and ScorePos(fi) > ScoreNeu(fi). In contrast, it is negative if ScoreNeg(fi) > ScorePos(fi) and ScoreNeg(fi) > ScoreNeu(fi). Finally, it is defined as neutral if ScoreNeu(fi) > ScorePos(fi) and ScoreNeu(fi) > ScoreNeg(fi).
3.4. Document polarity classification
The global polarity of each document is obtained by using this module. Thus, a positive, negative and neutral score must be obtained for each document. These scores are obtained by using the following equations:


ScorePos(doc) is obtained by means of the sum of the feature scores (ScorePos), where f belongs to a set of positive features (Fpos), i.e. features with a positive score that is higher than its negative and neutral score.
ScoreNeg(doc) is obtained by means of the sum of the feature scores (ScoreNeg), where f belongs to a set of negative features (Fneg), i.e. features with a negative score that is higher than its positive and neutral score.
ScoreNeu(doc) is obtained by means of the sum of the feature scores (ScoreNeu), where f belongs to a set of neutral features (Fneu), i.e. features with a neutral score that is higher than its positive and negative score.
Hence, a document is positive if ScorePos(doci) > ScoreNeg(doci) and ScorePos(doci) > ScoreNeu(doci). In contrast, it is negative if ScoreNeg(doci) > ScorePos(doci) and ScoreNeg(doci) > ScoreNeu(doci). Finally, it is defined as neutral if ScoreNeu(doci) > ScorePos(doci) and ScoreNeu(doci) > ScoreNeg(doci).
4. Experiments
We carried out a set of experiments in order to measure the effectiveness of the approach as regards feature polarity identification and global polarity identification. A detailed description of these experiments is provided below.
4.1. Data
The experiments carried out in this work involved the following activities: (1) gathering a corpus of news in the English language with regard to the financial domain, which consists of 152,360 words distributed throughout 1000 news items that were obtained from the websites presented in Table 1; and (2) the manual assignment of sentiment orientation (positive, negative or neutral) of the financial news at feature level and document level. It should be mentioned that the aforementioned activities were performed in a period of 10 months by a group of five experts in order to ensure the quality of the corpus.
Websites with financial information

4.2. Evaluation and results
In order to evaluate the effectiveness of the method proposed for feature polarity identification and global polarity identification, we have employed the precision, recall, F-measure and accuracy metrics, which are commonly used in sentiment analysis research. Recall is the proportion of actual positive cases that were correctly predicted as such. Precision, meanwhile, represents the proportion of predicted positive cases that are real positives. The F-measure is the harmonic mean of precision and recall. Finally, the accuracy is a weighted arithmetic mean of precision and inverse precision (weighted by bias), in addition to being a weighted arithmetic mean of recall and inverse recall (weighted by prevalence) [51]. The precision, recall, F-measure and accuracy formulae are shown as follows (see equations (8), (9), (10) and (11)).


This study takes into account that the importance level of a feature varies according to the part of the document in which it appears, i.e. the importance level of a feature within a news item is higher or lower if it appears at the beginning, in the middle or at the end of the document. Thus, the variables Z1, Z2 and Z3 were used to represent the part of the document in which the feature appears (see section 3.3). We also use the following nomenclatures: ‘H’, which represents a high importance level, ‘M’, which represents a medium importance level, and finally ‘L’, which represents a low importance level of the feature. After taking into account all possible combinations of the aforementioned variables, 27 case studies were established.
We have also established values for the three N_GRAM methods (‘N_GRAM Before’, ‘N_GRAM After’ and ‘N_GRAM Around’), which are in the range of 2–6. In this respect, the experiment has been conducted in order to test all the possible combinations of the ‘Zj’ parameters and the N_GRAM methods with their corresponding values. A detailed description of the results obtained for feature polarity identification and global polarity classification is provided below.
4.2.1. Feature polarity identification and news polarity classification results
This section presents the feature and news polarity classification results in terms of accuracy, precision, recall and F-measure. These results are presented in tables as follows: accuracy (A), precision (P), recall (R) and F-measure (F).
Tables 2 and 3 show the feature and news polarity classification results obtained by means of the ‘N_GRAM Before’ method.
Feature polarity classification obtained with the ‘N_GRAM Before’ method in terms of accuracy (A), precision (P), recall (R) and F-measure (F)

News polarity classification obtained with the ‘N_GRAM Before’ method in terms of accuracy (A), precision (P), recall (R) and F-measure (F)

In the case of the feature polarity classification (see Table 2), the best result is obtained by case study number 8, which corresponds to the following combination of values: Z1 = H, Z2 = L, Z3 = M and N_GRAM = 3. With regard to the N_GRAM parameter, the best average rate is obtained with the N_GRAM = 3 value, with an accuracy of 60.7%, a precision of 59.7%, a recall of 60.7% and an F-measure of 59.3%. This means that the feature-based polarity obtains very good results when the three previous words are used to identify the polarity of the feature. Conversely, the experiments with N_GRAM = 2 obtain the worst average rate, with an accuracy of 51.7%, a precision of 51.0%, a recall of 51.7% and an F-measure of 51.1%. Moreover, with regard to the Z1, Z2 and Z3 parameters, the best results with N_GRAM = 3 are obtained by case study eight with the following configuration of parameters: Z1 = H, Z2 = L and Z3 = M, respectively, signifying that the beginning of the news is more relevant in the feature polarity classification. Finally, the global average of the accuracy, precision, recall and F-measure results obtained by the ‘N_GRAM Before’ method are 57.9%, 56.9%, 57.9% and 56.9%, respectively.
Table 3 shows the results for the polarity classification of the whole news item. As can be observed, the best result is obtained with a wide set of configurations, with an accuracy of 79.9%, a precision of 79.9%, a recall of 79.9% and an F-measure of 79.6%. In the case of the N_GRAM parameter, the best results are obtained by N_GRAM = 5 and N_GRAM = 6, which obtain an accuracy of 79.9, a precision of 79.9, a recall of 79.9 and an F-measure of 79.6. Furthermore, with regard to the Zj parameters, the best results (an accuracy of 79.9%, a precision of 79.9%, a recall of 79.9% and an F-measure of 79.6%) are obtained by case study numbers 21 to 27, which means that the polarity identified at the beginning of the news is not relevant as regards obtaining the whole polarity. Finally, it is worth noting that the global average of the accuracy, precision, recall and F-measure results obtained with the ‘N_GRAM Before’ method are 70.4%, 69.8%, 70.4% and 68.9%, respectively.
The feature and news polarity classification accuracy results obtained by means of the ‘N_GRAM After’ method are presented in Tables 4 and 5.
Feature polarity classification obtained with the ‘N_GRAM After’ method in terms of accuracy (A), precision (P), recall (R) and F-measure (F)

News polarity classification obtained with the ‘N_GRAM After’ method in terms of accuracy (A), precision (P), recall (R) and F-measure (F)

With regard to the feature polarity classification (see Table 4), the results are lower than those obtained using the ‘N_GRAM Before’ method. The best average rate (an accuracy of 60.0%, a precision of 59.0%, a recall of 59.9% and an F-measure of 58.7%) is obtained with an N_GRAM = 3, as occurred with the ‘N_GRAM Before’ method. Furthermore, the highest score (an accuracy of 61.4%, a precision of 60.4%, a recall of 61.4 and an F-measure of 59.7%) is obtained by case study number 10 with the following configuration: Z1 = M, Z2 = H, Z3 = H and N_GRAM = 3. With regard to Zj parameters, although the best rate (an accuracy of 61.4%, a precision of 60.4%, a recall of 61.4% and an F-measure of 59.7%) is obtained by case study number 10, which corresponds to the following combination of values: Z1 = M, Z2 = H, Z3 = H, case studies 8 and 9 obtain very similar results (an accuracy of 60.2%, a precision of 59.3%, a recall of 60.2% and an F-measure of 58.9%). Finally, the global average of the accuracy, precision, recall and F-measure results obtained with the ‘N_GRAM After’ method are 57.4%, 56.5%, 57.5% and 56.4%, respectively.
Some examples of the news contained in the corpus collected are the following: ‘The Ibex 35 has fallen back and has four consecutive corrections’, ‘Telefónica has lost 21.97% after Siterday announced that it will issue convertible bonds amounting to 1500 million euros’, and ‘Banco Sabadell has announced a quarterly net profit slightly worse than expected: 81.2M €’. In the sentences above, the positive or negative expressions appear after the entities described, namely, Ibex 35, Telefónica and Sabadell bank and the ‘N_GRAM After’ method therefore produces successful results.
In the case of the news polarity classification (see Table 5), the global average of the accuracy, precision, recall and F-measure results obtained with the ‘N_GRAM After’ method are 70.7%, 70.2%, 70.7% and 69.6%, respectively. This result is slightly better than that obtained with the ‘N_GRAM Before’ method (70.4%, 69.8%, 70.4% and 68.9%). Furthermore, a wide set of parameter configurations, specifically 58, obtained the best accuracy score of 79.9%. Finally, with regard to N_GRAM parameter, the best average rate (an accuracy of 74.3%, a precision of 74.1%, a recall of 74.4% and an F-measure of 73.6%) is obtained with an N_GRAM = 6 value. Regarding the Zj parameters, the best results are obtained for case studies 21 to 26, which again shows that the polarity identified in the beginning of the news is not relevant as regards obtaining the whole polarity.
Tables 6 and 7 show the feature and news polarity classification results obtained with the ‘N_GRAM Around’ method.
Feature polarity classification obtained with the ‘N_GRAM Around’ method in terms of accuracy (A), precision (P), recall (R) and F-measure (F)

News polarity classification obtained with the ‘N_GRAM Around’ method in terms of accuracy (A), precision (P), recall (R) and F-measure (F)

In the case of the feature polarity classification (see Table 6), this method provides better results than those obtained with the ‘N_GRAM Before’ and ‘N_GRAM After’ methods, signifying that it is important to take into account both the previous and next words of the feature identified. The best average rate (an accuracy of 61.2%, a precision of 60.1%, a recall of 61.2% and an F-measure of 59.6%) is obtained with an N_GRAM = 3. This means that the best results are obtained when taking into account the three words that precede and follow each feature contained in the news item. Furthermore, case study 10 obtained the highest values, with an accuracy of 62.5%, a precision of 60.9%, a recall of 62.5% and an F-measure of 60.7%, when the following configuration was employed: Z1 = M, Z2 = H, Z3 = H and N_GRAM = 3. It is worth noting that case studies 8 and 9 also obtain very similar results (an accuracy of 61.1%, a precision of 60.2%, a recall of 61.1% and an F-measure of 59.4%, and an accuracy of 62.1%, a precision of 60.8%, a recall of 62.1% and an F-measure of 60.7%, respectively), as occurs with the ‘N_GRAM Before’ and ‘N_GRAM after’ methods. Finally, the global average of the accuracy, precision, recall and F-measure results obtained with the ‘N_GRAM Around’ method are 59.6%, 58.7%, 59.6% and 58.4%, respectively.
With regard to the news polarity classification (see Table 7), the ‘N_GRAM Around’ method obtained a global average for the accuracy, precision, recall and F-measure results of 72.2%, 71.7%, 72.2% and 71.0%, respectively. This result is better than that obtained with the ‘N_GRAM Before’ method (an accuracy of 70.4%, a precision of 69.8%, a recall of 70.4% and an F-measure of 68.9%) and the ‘N_GRAM After’ method (an accuracy of 70.7%, a precision of 70.2%, a recall of 70.7% and an F-measure of 69.6%). Furthermore, the best average results are obtained by N_GRAM = 6 (accuracy = 76.9%, precision = 76.7%, recall = 77% and F-measure = 76.1%), as occurred with the ‘N_GRAM Before’ and ‘N_GRAM After’ methods. More concretely, the best result is obtained with case study 12 with Z1 = M, Z2 = H, Z3 = L (accuracy = 89.7%, precision = 89.9%, recall = 89.7% and F-measure = 89.6%). In this case, the results obtained are much better than in the other case studies. Hence, the ‘N_GRAM Around’ method represents an optimal way in which to carry out the sentiment analysis of news in the English language concerning the financial domain because it obtains the best results.
Table 8 shows the results obtained by means of the ‘All_Phrase’ method. In this method, the N_GRAM parameter is not used, since each news item is divided into phrases or sentences, each of which is analysed individually. For feature polarity classification, the global average of the accuracy, precision, recall and F-measure results obtained with this method are 60.8%, 59.8%, 60.8% and 59.2%, respectively. With regard to Zj parameters, the best result is obtained by case studies number 7, 8 and 9 with an accuracy of 62.0%, a precision of 60.7%, a recall of 62.0% and an F-measure of 60.4%. This again shows that the beginning of the news is more relevant for feature polarity classification.
Feature and news polarity classification obtained with the ‘All_Phrase’ method in terms of accuracy (A), precision (P), recall (R) and F-measure (F)

In the case of the news polarity classification, this method obtained average accuracy, precision, recall and F-measure results of 74.1%, 73.7%, 74.1% and 73.0%, respectively. These results are worse than those obtained by the ‘N_GRAM Around’ method. With respect to Zj parameters, the best result (accuracy of 81.5%, precision of 81.5%, recall of 81.5% and F-measure of 81.3%) is obtained by case study 7, which corresponds to the following combination of values: Z1 = H, Z2 = L, Z3 = H. Conversely, case studies 6 and 9 provide the worst result with the following configuration of parameters: Z1 = H, Z2 = M, Z3 = L and Z1 = H, Z2= L, Z3 = L, respectively.
4.3. Discussion of general results
The general results show that the methodology provides encouraging results for feature polarity identification and the general sentiment classification of financial news in the English language.
Specifically, the ‘N_GRAM Around’ method obtained the best results for both feature and news polarity classification. More concretely, for the feature polarity classifications of accuracy, precision, recall and F-measure it obtained an average of 61.2%, 60.1%, 61.2% and 59.6%, respectively (see Figure 5), and for the general polarity classification of accuracy, precision, recall and F-measure it obtained an average of 76.9%, 76.7%, 77.0% and 76.1%, respectively (see Figure 6). Thus, the ‘N_GRAM Around’ method represents an optimal means to carry out the sentiment analysis of news concerning the financial domain in the English language.

Feature polarity classification.

News polarity classification.
In most cases, the best results for feature polarity classification are achieved when the features located at the beginning of the news are weighted with higher values, i.e. when Z1 = M or Z1 = H. Hence, it is important to take into account not only the place in which a feature is used in a text but also its occurrences. The results also show that the polarity identified at the beginning of the news is not relevant as regards obtaining the whole polarity. However, we noticed that the best results are, in most cases, achieved when the end of the news is weighted with higher values, i.e. when Z3 = M or Z3 = H. The aforementioned corresponds with the findings of Moreno Ortiz et al. [52], who mention that the polarity of the end paragraph roughly coincides with the global polarity of the text.
The N_GRAM After, N_GRAM Before and N_GRAM Around methods obtained the best results with an N_GRAM = 3. This means that for N_GRAM Before, the best result is obtained when the three previous words are used to identify the polarity of the feature. Conversely, for N_GRAM After, the best result is obtained when the next three words are used to identify the polarity of the feature. Thus, in the case of N_GRAM Around, the best result is obtained when taking into account the three words that precede and follow each feature contained in the news item.
Furthermore, it is important to mention that all the methods (i.e. ‘N_GRAM Before’, ‘N_GRAM After’, ‘N_GRAM Around’ and ‘All Phrase’) generally achieve better results in the global polarity classification than in the features polarity identification process. We ascribe this to the following reasons:
Processing financial language is a complex procedure. Some news contains a lot of specific figures and percentages that determine whether a feature has a positive, neutral or negative polarity. For example, in the sentence ‘And is that the New York Stock Exchange corrected whenever the S&P 500 is about 2000 points’, there is a numerical figure that may be interpreted in different ways by different expert users. Another example is the sentence: ‘In Spain, the auto sales have improved but given the worst data since January’. In this example, an expert user might classify this sentence as positive based on the sentence extract ‘the auto sales have improved’. However, another expert user might classify this sentence as negative based on the sentence extract ‘the data are the worst since January’. These types of sentences are frequent in financial news, thus making the feature polarity identification process difficult.
The features in the financial domain are widely dispersed and delimited. This situation directly affects the features identification process, which is reflected in the results obtained for feature polarity identification.
4.4. Comparison of results with other works
In order to evaluate the added value of using ontologies for feature based opinion mining, we have compared our system with other well-known approaches that do not use any formal knowledge representation. For example, the experiments in Moraes et al. [4] were carried out on a movie domain in the English language and obtained results of 86.5%. In Azmi and Alzanin [33] and Mohammad et al. [34], the authors automatically analyse posts on platforms such as Twitter and obtained an accuracy of 82.0% and 73.9%, respectively. Onan and Korukoğlu [35] evaluated the effectiveness of their proposal through the use of nine datasets from different domains (Camera, Camp, Doctor, Drug, Laptop, Music, Lawyer, Radio and TV) and obtained an accuracy of 94.7% and an F-measure of 95%. The work presented in Molina-González et al. [36], meanwhile, proposed an approach for the Spanish language, which obtained an accuracy of 63.2% and an F-measure of 63.3%. On the other hand, in Montejo-Ráez [25], an unsupervised approach employed to tackle the problem of polarity classification based on the combined use of two knowledge resources: WordNet and SentiWordNet, is presented. This proposal obtained an accuracy of 86.3% with sentiment-topic features and 64.9% with unigrams. We have also compared our approach with the method proposed in Peñalver-Martinez et al. [14], which used the movie ontology MO with the aim of identifying features in movies reviews. This approach obtained an accuracy of 89.6%. Table 9 shows the results from those studies that have been evaluated in terms of accuracy, precision, recall and F-measure.
Comparison of related work with our proposal

As can be seen in Table 9, some proposals, such as Moraes et al. [4], Peñalver-Martinez et al. [14] and Onan and Korukoğlu [35], obtained very good results. Conversely, other proposals, such as Montejo-Ráez et al. [25], Mohammad et al. [34] and Molina-González et al. [36], obtained low results when compared to the results obtained with our proposal. However, it is difficult to establish whether a work is better or worse than the proposal established in this work for two principal reasons: the domain and the language used. On the one hand, the complexity of a domain may hinder the classification process and, therefore, be reflected in the results. For example, the contents of the financial domain are characterised by the abundance of specialised concepts and the limited use of affective words, unlike other domains such as music, movies and electronics. We therefore attribute this to the fact that proposals such as Onan and Korukoğlu [35] obtained better results. On the other hand, when classifying sentiment, the complexity of a language may have a strong impact on the final results. For example, the Spanish language has a much more complex syntax than many other languages, which may be why proposals such as Molina-González et al. [36] obtained low results.
Finally, financial language is inherently complex because financial terms refer to an underlying social, economic and legal context. The sentiment of news articles and their impact on stock price returns have been studied in the finance domain, but no particularly good results have been obtained until now owing to the complexity of the financial domain. In fact, not many sentiment analysis approaches have been validated in the financial domain. For example, the results obtained by the approaches presented in Van de Kauter et al. [41] and Malo et al. [42] are much worse than those obtained by our approach.
In this respect, we believe that comparing the different opinion mining approaches described in literature is difficult because none of the software applications are available. Indeed, the corpora used for each experiment differ significantly as regards content, size, topics and language. A fair comparison of two opinion mining methods would require the usage of the same testing corpus and it was for this reason that we carried out an exhaustive search for a standard corpus concerning sentiment analysis in the financial domain. This search was performed in well-known sentiment analysis task conferences and workshops, of which we can highlight the SemEval, CLEF and WASSA. Despite our efforts, we only found datasets concerning domains such as restaurants, electronics, hotels, telecom, museums, Kitchen, Books and DVDs. Although we found proposals based on the same domain, such as in Van de Kauter et al. and Malo et al. [41, 42], it is not possible to make a fair comparison with them for three main reasons: (1) the proposal presented in Van de Kauter et al. [41] is based on another language; (2) both proposals are based on a sentence-level approach, i.e. the annotated dataset is composed of a set of sentences rather than being focused at a document level and feature level, which is one of the main requirements of our approach; and (3) the corpora used for these experiments are not publicly available. Moreover, our approach requires an ontology that models the domain in order to identify the features or aspects. It is difficult to find either sentiment analysis datasets or ontologies concerning these domains in literature.
5. Conclusions
In this work, the problem of feature-based opinion mining has been addressed, achieving promising results. We have proposed a sentiment classification method, which uses an ontology that permits us to effectively detect features concerning financial news. We have also presented an experiment whose objective was to evaluate the proposed method. Our proposal obtained encouraging results, with an accuracy of 66.7%, a precision of 65.4%, a recall of 66.7% and an F-measure of 64.9% for feature polarity classification, and an accuracy of 89.8%, a precision of 90.0%, a recall of 89.8% and an F-measure of 89.7% for news polarity classification. Furthermore, the experimental results show that the ‘N_GRAM Around’ method obtained the best average results. Finally, with regard to the comparison with related work, our proposal obtained better results that those obtained by proposals by Van de Kauter et al. [41] and Malo et al. [42], which are based on the same domain. However, in the case of the other proposals, it is difficult to establish whether a work is better or worse that our proposal because the corpora used for each experiment differ significantly as regards content, size, topics and language.
In spite of all the advantages and possibilities of the proposed approach, it has several limitations that could be improved in future work. First, our approach requires an ontology that models the terms of a specific domain. Since the manual building of ontologies is extremely labour-intensive and time-consuming, we plan to adopt approaches such as those by Touma et al. and Küçük and Arslan [53,54] that allow the automatic or semi-automatic creation of ontologies, including the extraction of the corresponding domain terms and the relationships between those concepts from a corpus of natural language text. Furthermore, we plan to apply our approach to several corpora and ontologies of different domains with the objective of evaluating the effectiveness of the method and determining how dependent it is with regard to the domain’s ontology. Second, the proposed method is only able to deal with news expressed in English, which is a disadvantage owing to the vast amount of information available in other languages. We shall therefore attempt to apply this method to the Spanish language, since it has been studied less frequently in the opinion mining field. Furthermore, it should be mentioned that Spanish is the third most spoken language in the world, and we therefore firmly believe that the computerisation of Internet domains in this language is of the utmost importance.
We also plan to validate our approach with standard/benchmark corpora in other domains, such as product or hotel reviews, and an ontology that models the main domain concepts and features should therefore be developed for this purpose.
Finally, as future research, we are interested in using the corpus collected in this work to develop a supervised machine learning system for the automatic detection of positive, negative and neutral sentiment in financial news, and then comparing the results with those obtained in this work. We plan to do this by taking advantage of current and proven machine learning-based sentiment classification methods such as those presented in Cruz et al. [6] or Agarwal and Mittal [55].
Footnotes
Funding
This work is a result of the research stay (19592/EE/14) funded by the ‘Fundación Séneca-Agencia de Ciencia y Tecnología de la Región de Murcia’ under the ‘Jiménez de la Espada - Programa de Movilidad, Cooperación e Internacionalización’ program, within the II PCTIRM 2011–2014 framework. María del Pilar Salas-Zárate is also supported by the National Council of Science and Technology (CONACYT), the Public Education Secretary (SEP) and the Mexican government.