
Abstract
The most commonly used algorithm in recommendation systems is collaborative filtering. However, despite its wide use, the prediction accuracy of this algorithm is unexceptional. Furthermore, whether quantitative data such as product rating or purchase history reflect users’ actual taste is questionable. In this article, we propose a method to utilise user review data extracted with opinion mining for product recommendation systems. To evaluate the proposed method, we perform product recommendation test on Amazon product data, with and without the additional opinion mining result on Amazon purchase review data. The performances of these two variants are compared by means of precision, recall, true positive recommendation (TPR) and false positive recommendation (FPR). In this comparison, a large improvement in prediction accuracy was observed when the opinion mining data were taken into account. Based on these results, we answer two main questions: ‘Why is collaborative filtering algorithm not effective?’ and ‘Do quantitative data such as product rating or purchase history reflect users’ actual tastes?’
1. Introduction
Recently, advances in communication technology, habituation of the Internet through the dissemination of computers and smart phones and the creation of payment systems and logistic systems have developed e-commerce and created an environment in which one can easily consume a desired product anywhere and at anytime in an online environment [1,2]. Due to these changes in communication technology and the economic environment, the consumption patterns of consumers have rapidly changed, and online shopping has increased [3]. However, since it is not easy to find the desired product among a number of products, people have come to want an environment in which they can select from among many products the products most suitable to their personal tastes or needs [4]. Accordingly, there has been an increased interest in a personalised recommendation system that helps find the desired information quickly and easily [5].
A recommendation system analyses the user evaluation rating for the product or product-selection-information-data, and it recommends the products selected by neighbour users with similar tendencies or predicts the products a user might prefer [6]. Collaborative filtering (CF) is the algorithm most frequently used in the referral system. It is a technique that predicts preferences for non-experienced content for a target user from similar user searches based on the user’s content-preference history [7,8]. The CF technique is an algorithm that has been used successfully in various fields for personalised recommendations. However, the CF algorithm has a drawback that its predictive ability is not significantly high in terms of excellence [9]. In addition, a question has been raised whether quantitative data, such as the selected content or rating for the content that is mostly used in the existing CF techniques, can represent the preferences of users [10]. Therefore, in this study, in order to improve the predictive ability of the CF technique, we propose a recommendation system that utilises opinion mining based not only on quantitative data but also on reviews after a purchase. The contributions of this study are as follows. First, it can consider the user’s preferences objectively, compared with conventional recommendation methods, using purchase reviews in the recommendation system written by the user. Second, it shows that the performance of the recommendation system increased using reviews data extracted with opinion mining in the recommendation system.
Our article presents pertinent works in section 2, while section 3 outlines the proposed recommendation system, section 4 describes our experimental evaluation and section 5 details the results and discussions. Section 6 is the conclusion and future work.
2. Related research
2.1. Opinion mining
Opinion mining, also known as sentiment analysis, refers to the usage of natural language processing, text analysis and computational linguistics to identify subjective information in source materials. Generally, speaking opinion mining aims to determine the attitude of a speaker or a writer with respect to some topic or the overall contextual polarity of a document. The attitude may be his or her judgement or evaluation, or affective state. Opinion mining covers a range of topics, such as prediction of market size for certain services and products [11], consumer reaction [12], subjectivity or objectivity detection [13,14], classification of sentiment polarity at word level, sentence level or document level [15–17] as well as aspect–opinion pair extraction [18,19]. Generally, opinion mining is conducted in one of the following two ways: coarse-grained method or fine-grained method [20]. Coarse-grained sentiment analysis aims to judge the overall sentiment polarity of a document using unsupervised machine learning [21,22], semi-supervised machine learning [23] and supervised machine learning methods [24,25]. Fine-grained sentiment analysis is to detect the sentiment polarity and strength towards certain product aspects at word level [26].
As an example of opinion mining, Liu and Zhang [27], addressing sentiment analysis and opinion mining, produced a study on construction of the sentiment classifier that can identify positive, negative and neutral sentiments about an article through a corpus and Twitter. Abulaish et al. [28] pursued a study on the opinion mining system that identifies the function of the product and opinions in the review documents of product users.
In another study, Alrababah et al. [11] proposed a domain-independent approach for identifying explicit opinionated features and attributes that are strongly related to a specific domain product using lexicographer files in WordNet. In their approach, N-gram analysis and the SentiStrength opinion lexicon have been employed to support the extraction of opinionated features [12].
2.2. Collaborative Filtering
Recommender systems typically produce a list of recommendations in one of two ways – through collaborative or content-based filtering. CF approaches build a model from a user’s past behaviour (items previously purchased or selected and/or numerical ratings given to those items) as well as similar decisions made by others and then use the model to predict items (or ratings for items) that the user may have interested in. Content-based filtering approaches utilise a series of discrete characteristics of an item in order to recommend additional items with similar properties. In recent years, CF approaches have become extremely common and are applied in a variety of applications, such as movies, music, news, books, research articles, social tags and products in general [29]. CF approaches are divided into two basic types: item-based algorithms and user-based algorithms. The former is based on the similarity of products while the latter is based on the similarity of users. Both algorithms need to identify the user profiles [30]. The item-based algorithms are more widely used in e-commerce. Recommender systems employ rules to determine the relevance of items to users who do not have action on the items. CF approaches measure the user similarity from user’s past behaviour to generate his or her profile [31]. The experimental results indicate that CF algorithms can obtain a higher prediction when considering opinion-rich texts, and sentiment analysis thus enables the improvement of recommender systems [32]. However, these studies – compiling statistics and quantifying the sentiments presented on users’ reviews and utilising them to recommend contents for users – have thus far appeared to be insufficient in their results.
2.3. Combination of opinion mining and Collaborative Filtering
Only a few attempts are made combining CF methods with sentiment analysis. The combination is explored in two ways: considering the sentiment of users towards product aspects in the context where ratings are not available or modifying the existing CF algorithms to incorporate opinion similarities [33]. The findings suggest the applicability of that analytical framework to multi-domains where only a small number of labelled reviews (reviews with ratings) are available. The seminal work motivates our research of opinion-enhanced CF methods. Topic-based CF methods have been proposed in recent years. In practices, users often voice their preferences through online reviews, which are even more valuable than overall ratings [34]. Both user-level LDA CF (ULCF) and topic model–based CF (TMCF) are topic-based CF algorithms considering not only numerical ratings but also textual reviews. The average mean absolute error (MAE) values of TMCF are 0.571 and 0.833 for two data-sets, respectively, which are much better than the baseline. ULCF shows the same trend as TMCF. However, the topic model does not consider sentiment analysis, so it cannot incorporate the user opinions at the fine-grained level. It shows that combining user preferences and user opinions may generate accurate recommendation result (MAE with 1.19, while item-based CF with MAE 3.10 and user-based CF (UBCF) with MAE 2.96) [35]. Most of recommender systems are based on rating, and CF methods cannot work without overall scores. Alternatively, in such cases, textual reviews may serve as useful proxy, from which the overall rating can be measured through sentiment analysis [36]. Besides the overall ratings, users’ personality (e.g. pessimists and optimists) can be used to improve CF as well [31].
Furthermore, purchase review combining with sentiment analysis may generate more accurate recommendations, and this may be a promising direction [32,37]. Although past studies believe the helpfulness of sentiment analysis to CF performances [33], the ongoing researches are still insufficient. Accordingly, in this study, we aim to improve the performance of the recommendation system using hybrid CF which benefits from opinion mining.
3. Proposed recommendation system
3.1. Proposed recommendation system process
A suggested recommendation system proposed in this study shall be developed based on the purchase reviews written by users who bought products from e-commerce sites, with the assumption that those reviews represent users’ preferences. In the existing recommendation systems (see Figure 1), recommendations are performed only with an evaluation score between 1 and 5 points that users indicated through a product evaluation process. However, the recommendation system proposed in this study makes recommendations by applying a text score Text_Score = (TS1, TS2, TS3, …, TSN) together, which collects statistics and gives the quantified score of not only the existing evaluation score Score = (S1, S2, S3, …, SN) but also the user’s purchase review Text = (T1, T2, T3, …, TN) based on the opinion mining process.
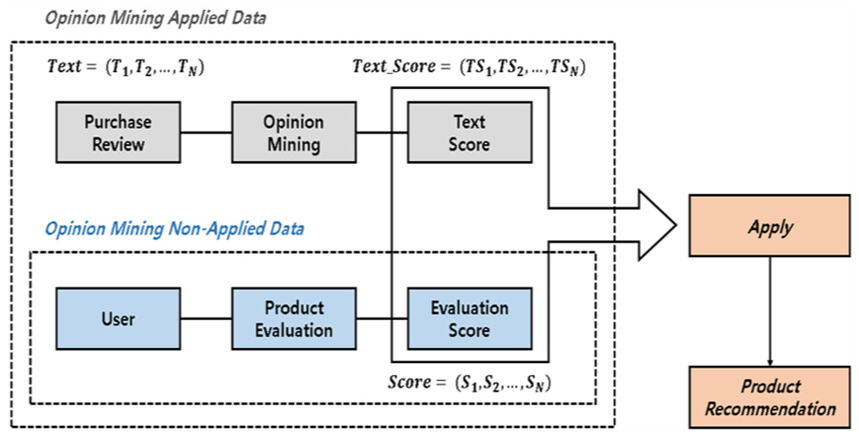
The proposed recommendation process.
3.2. Proposed recommendation system method
In this study, an analysis for the recommendation accuracy has been performed based on six models. Among them, the first model, which gives the existing data to which opinion mining is not applied, becomes the basis to analyse the recommendation accuracy. This model makes recommendations through data consisting of the evaluation score (Score) only and shall be referred to as OMNAD (opinion mining non-applied data).
The remaining five models are the ones applied to the text score, which is the result of opinion mining, or OMNAD. The first model applies opinion mining, but it performs recommendations through data separated into ‘Score’ and ‘Text Score’. It shall be referred to as OMAD (opinion mining applied data). The second model performs recommendations through data consisting of a value that is derived after adding up ‘Score’ and ‘Text Score’ as in formula (1). This model shall be referred to as AS_OMAD (addition score opinion mining applied data)

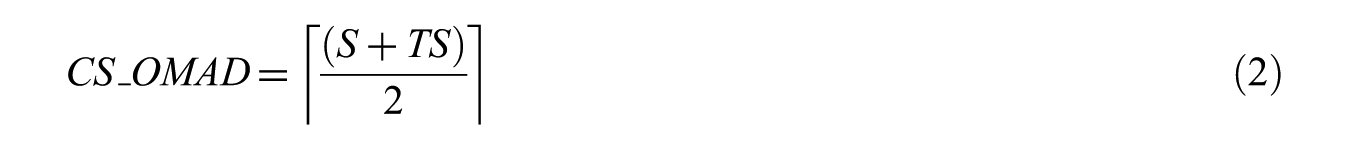
The third model performs recommendations through data consisting of a value that is derived after applying a ceiling function to the average figure of ‘Score’ and ‘Text Score’ as shown in formula (2). This model shall be referred to as CS_OMAD (ceiling score opinion mining applied data)
The fourth model performs recommendations through data consisting of a value that is derived through a normalisation process by figures between 1 and 100 because the range of ‘Score’ and ‘Text Score’ is different as in formula (3). This model shall be referred to as NS_OMAD (normalisation score opinion mining applied data)

The fifth model performs recommendations through data consisting of a value that is derived after adding up ‘Score’ and ‘Text Score’, which undergoes a normalisation process like NS_OMAD as in the following formula (4). This model shall be referred to as NAS_OMAD (normalisation addition score opinion mining applied data)

4. Experimental evaluation
4.1. Data set
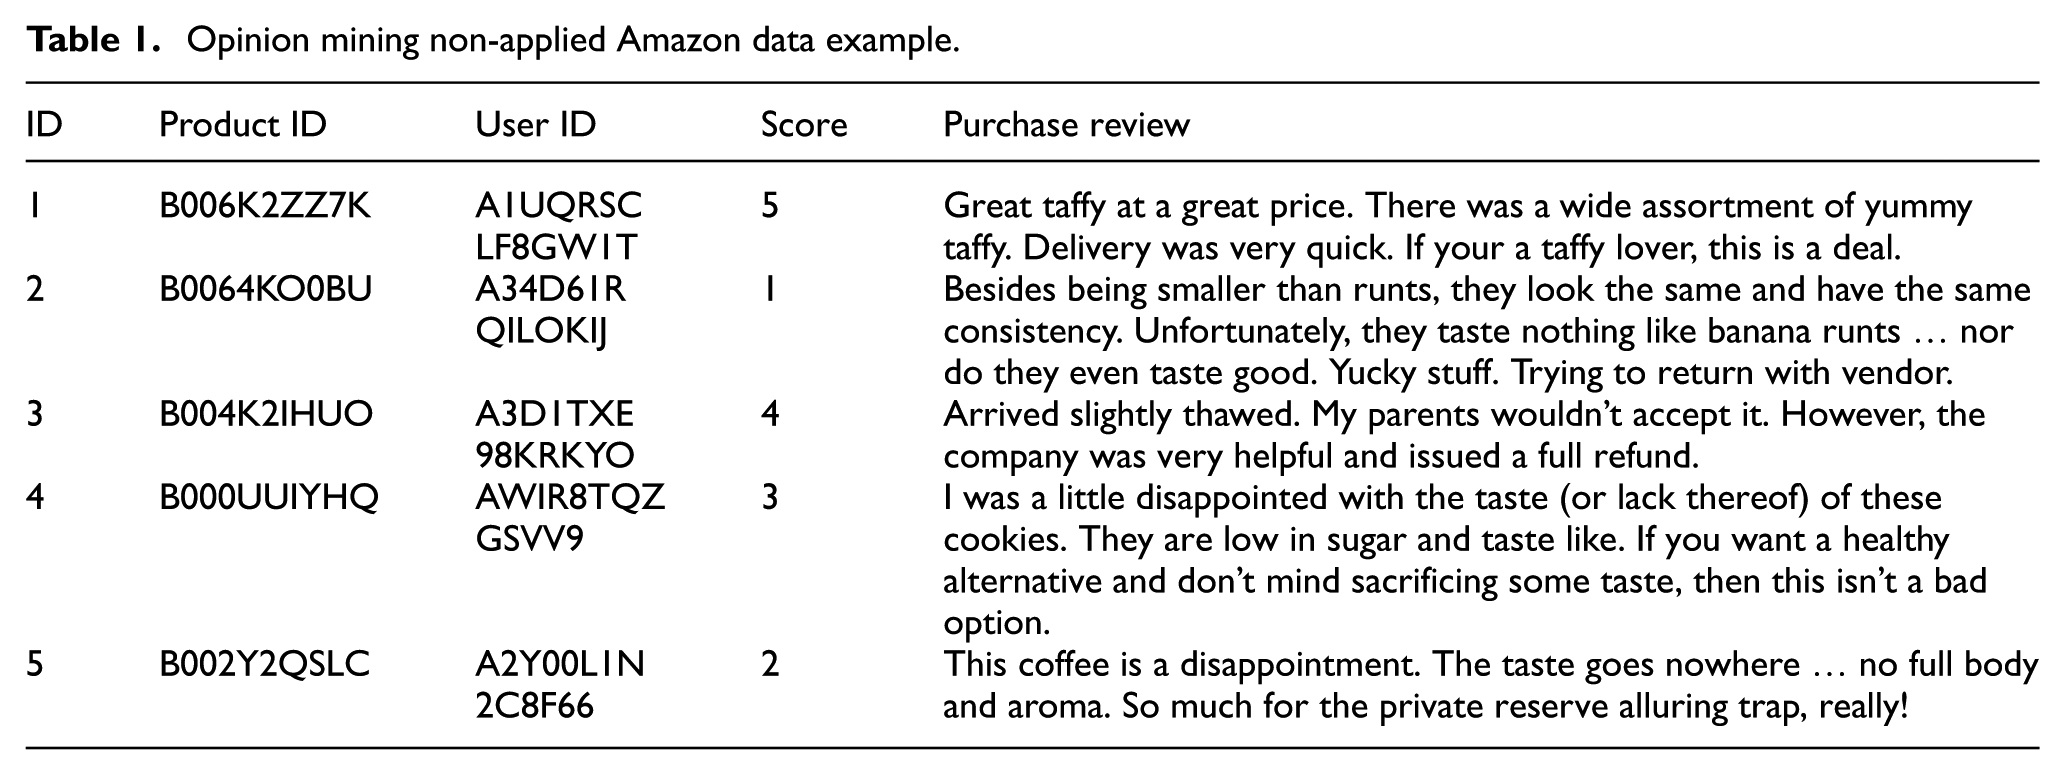
This study performs an analysis on opinion mining and recommendation accuracy based on Amazon users’ purchase histories and after-purchase reviews. Amazon data are composed as illustrated in Table 1. Opinion mining was carried out based on 120 K of ‘Amazon find food reviews data (October, 2012)’.
Opinion mining non-applied Amazon data example.
4.2. Opinion mining
Opinion mining fulfilled in this study shall be seen as a series of processes to analyse a text and determine what type of opinion it holds among a positive, negative or neutral tendency; it is performed based on the emotional polarity of vocabularies, which are the minimum units of the document [38,39]. Opinion mining analyses the polarity in the text by matching it with the pre-built emotion dictionaries and users’ after-purchase reviews. For this reason, it is necessary to use a pre-validated emotion dictionary because the results of opinion mining shall vary depending on the type of emotion dictionary [40].
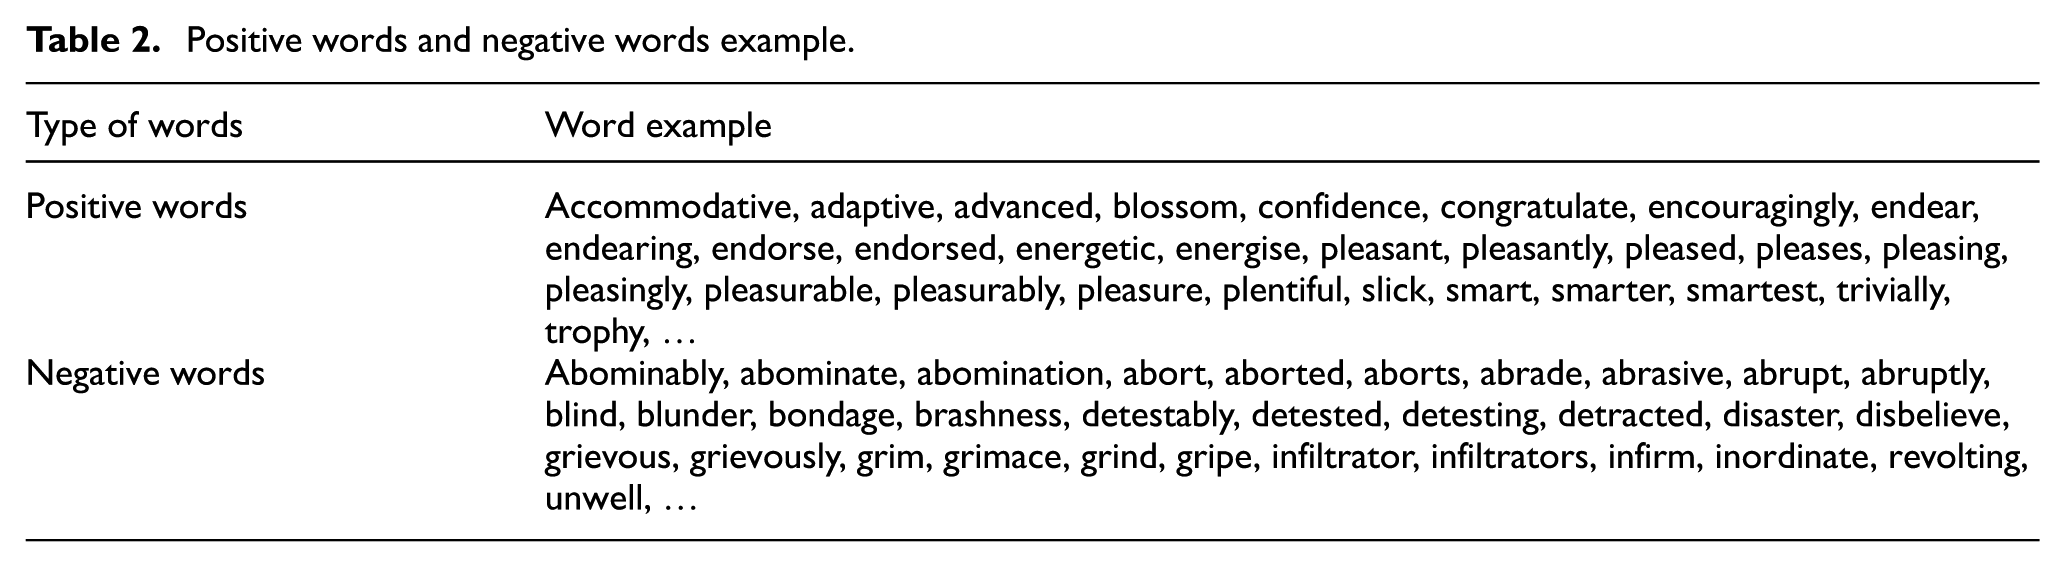
The emotion dictionary used in this study is the Sentiment Lexicon Consisting of Lists of Strings by Liu et al. [41]. This dictionary consists of 2006 positive words and 4783 negative words. It shows examples for the positive and negative words (see Table 2).
Positive words and negative words example.
4.3. User-Based Collaborative Filtering
The UBCF method, among CF methods, calculates the similarity between users in the user’s profile history to find the most similar neighbours; it then recommends the items that neighbours gave good reviews [42,43].
4.3.1. Standard analysis set-up
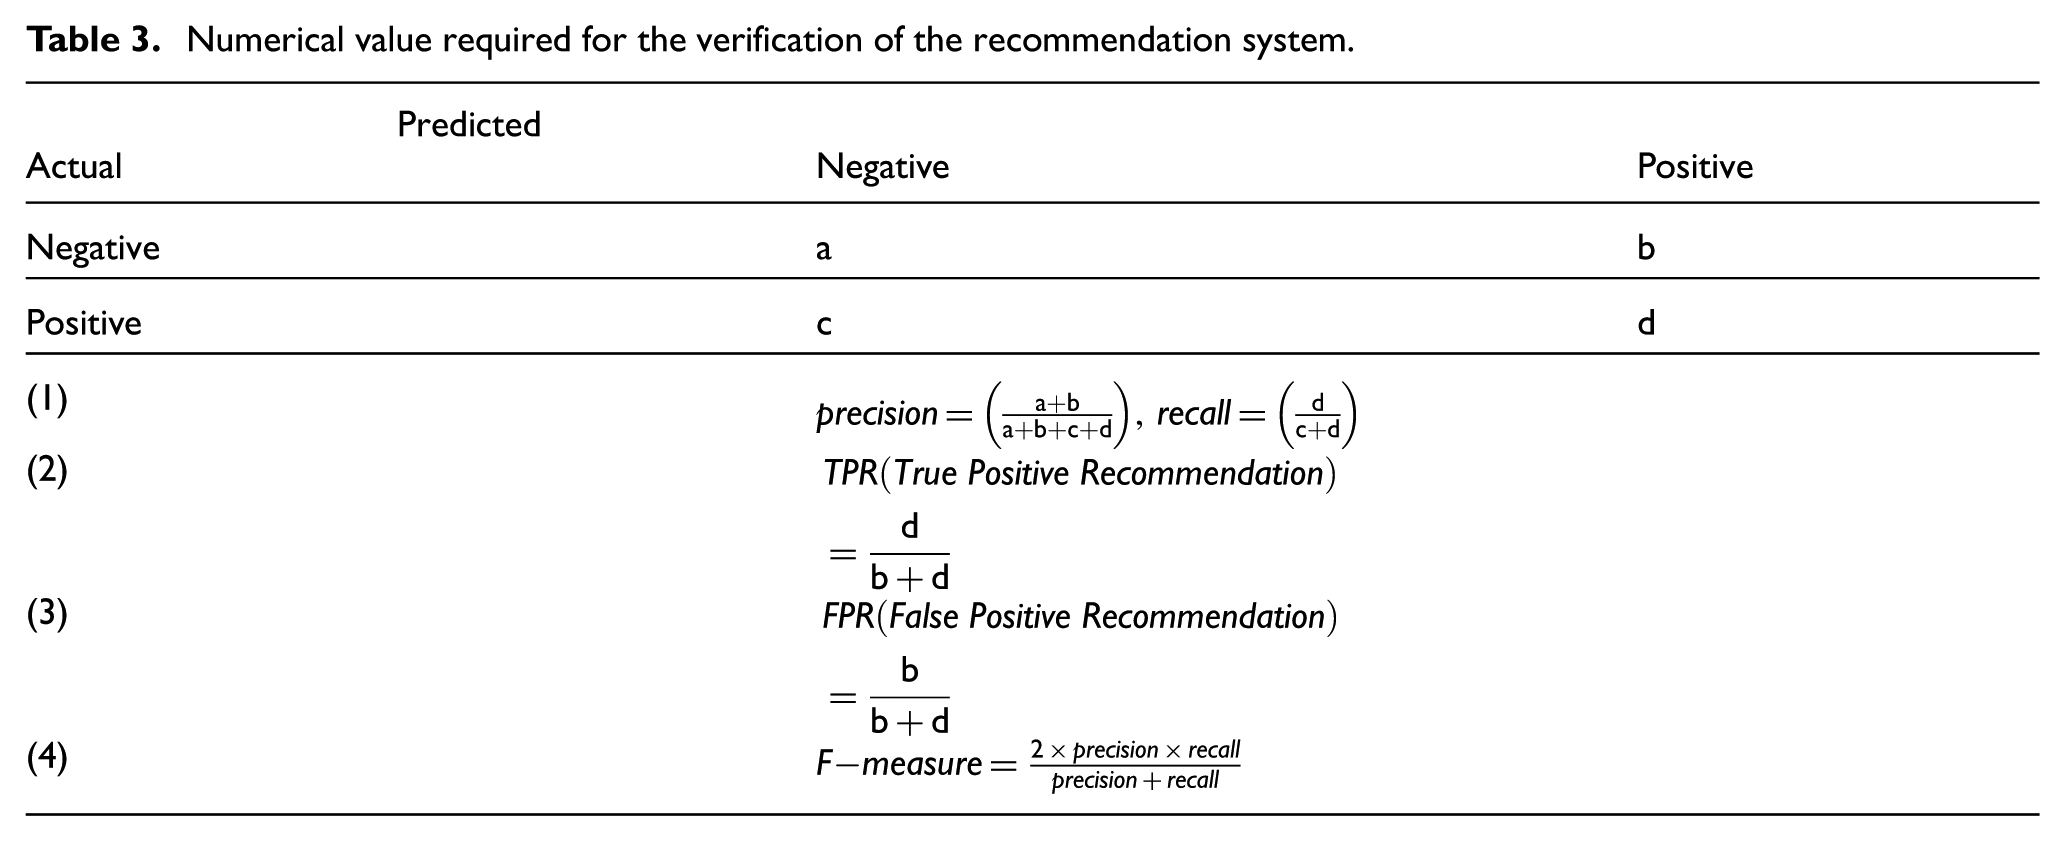
In this study, for comparative analysis through performance verification of data that did and did not apply the results of opinion mining analysis, we used figures of precision and recall and true positive recommendation (TPR) and false positive recommendation (FPR). Precision means the percentage of the contents an actual user likes among the contents recommended by the recommendation system, and recall indicates the number of contents provided accurately that a user actually likes. TPR means the percentage of the contents selected by a user among recommended contents by the system. FPR means the contents not selected by a user among recommended contents by the system. Furthermore, in a UBCF method, to find the most appropriate number of neighbours one must use an F-measure calculated on accuracy and reproducibility [36]. In this study, more information on the numerical value required for the verification of the recommendation system is shown in Table 3. Also, we predicted that the recommendation accuracy will increase as the number of recommended items increases. Therefore, the number of recommendation items to be generated for each user is divided into various categories (one, three, five items), and the analysis results are compared. Preliminary experiments showed that if the number of recommended items exceeds five, it has no effect on the accuracy, and therefore it is not included in the graph.
Numerical value required for the verification of the recommendation system.
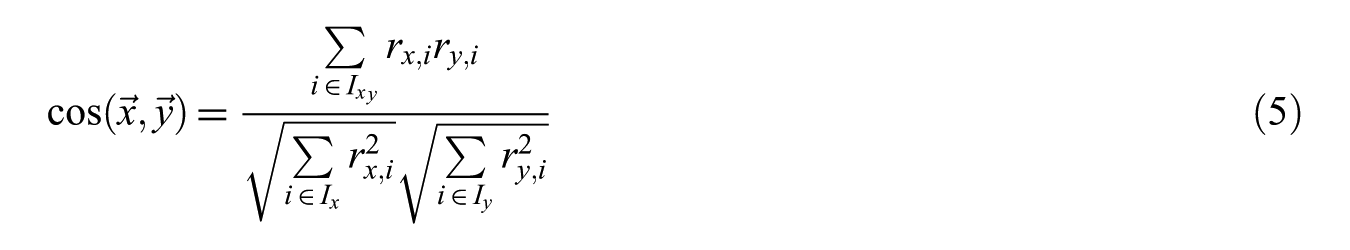
In this study, 80% of the data are designated as training data. In addition, it performed the analysis only on products that were purchased more than three times to prevent the degradation of the performance that may occur because of the small number of items included in the formula designed for recommendation. Moreover, in order to measure the similarity between users, it used the cosine similarity measurement algorithm like formula (5). For UBCF,
5. Result and discussion
5.1. Opinion mining
In this study, the opinion mining used is based on Amazon’s purchase-review-text data and compiled statistics, quantified as to whether those summarised data have positive (+), negative (−) or neutral opinions, and then presented as objective information.
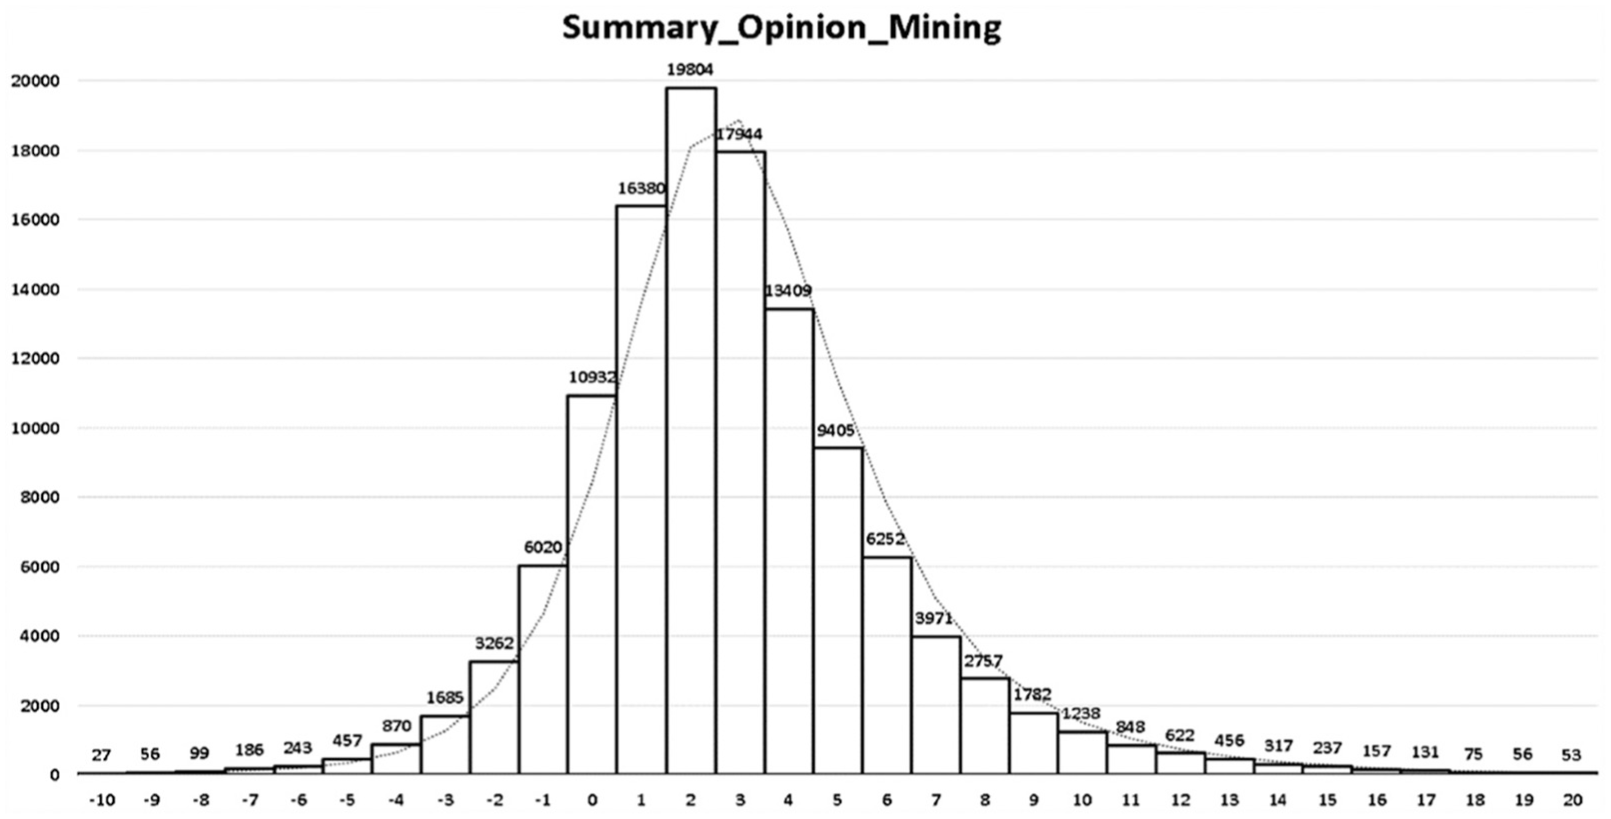
In opinion mining, the positive opinion appears as a positive number, and as the degree of positivity gets stronger, the number increases. On the other hand, the negative opinion appears as a negative number, and as the degree of negativity gets stronger, the number decreases. As a result, various opinions between −21 and 56 points appeared; however, some comments showed excessively low or high scores. For this reason, as shown in Figure 2, 269 data entries with excessively high or low scores were classified as noise and deleted, and a total of 119,731 opinions only between −10 points and 20 points were used.
The opinion mining results.
In opinion data, two pointed opinions appeared most frequently with 19,804 times (16.54%), and three pointed opinions appeared 17,944 times (14.99%). Moreover, one pointed opinions, four pointed opinions and neutral opinions appeared in order as the next largest with 16,380 times (13.68%), 13,409 times (11.20%) and 10,932 times (9.13%), respectively.
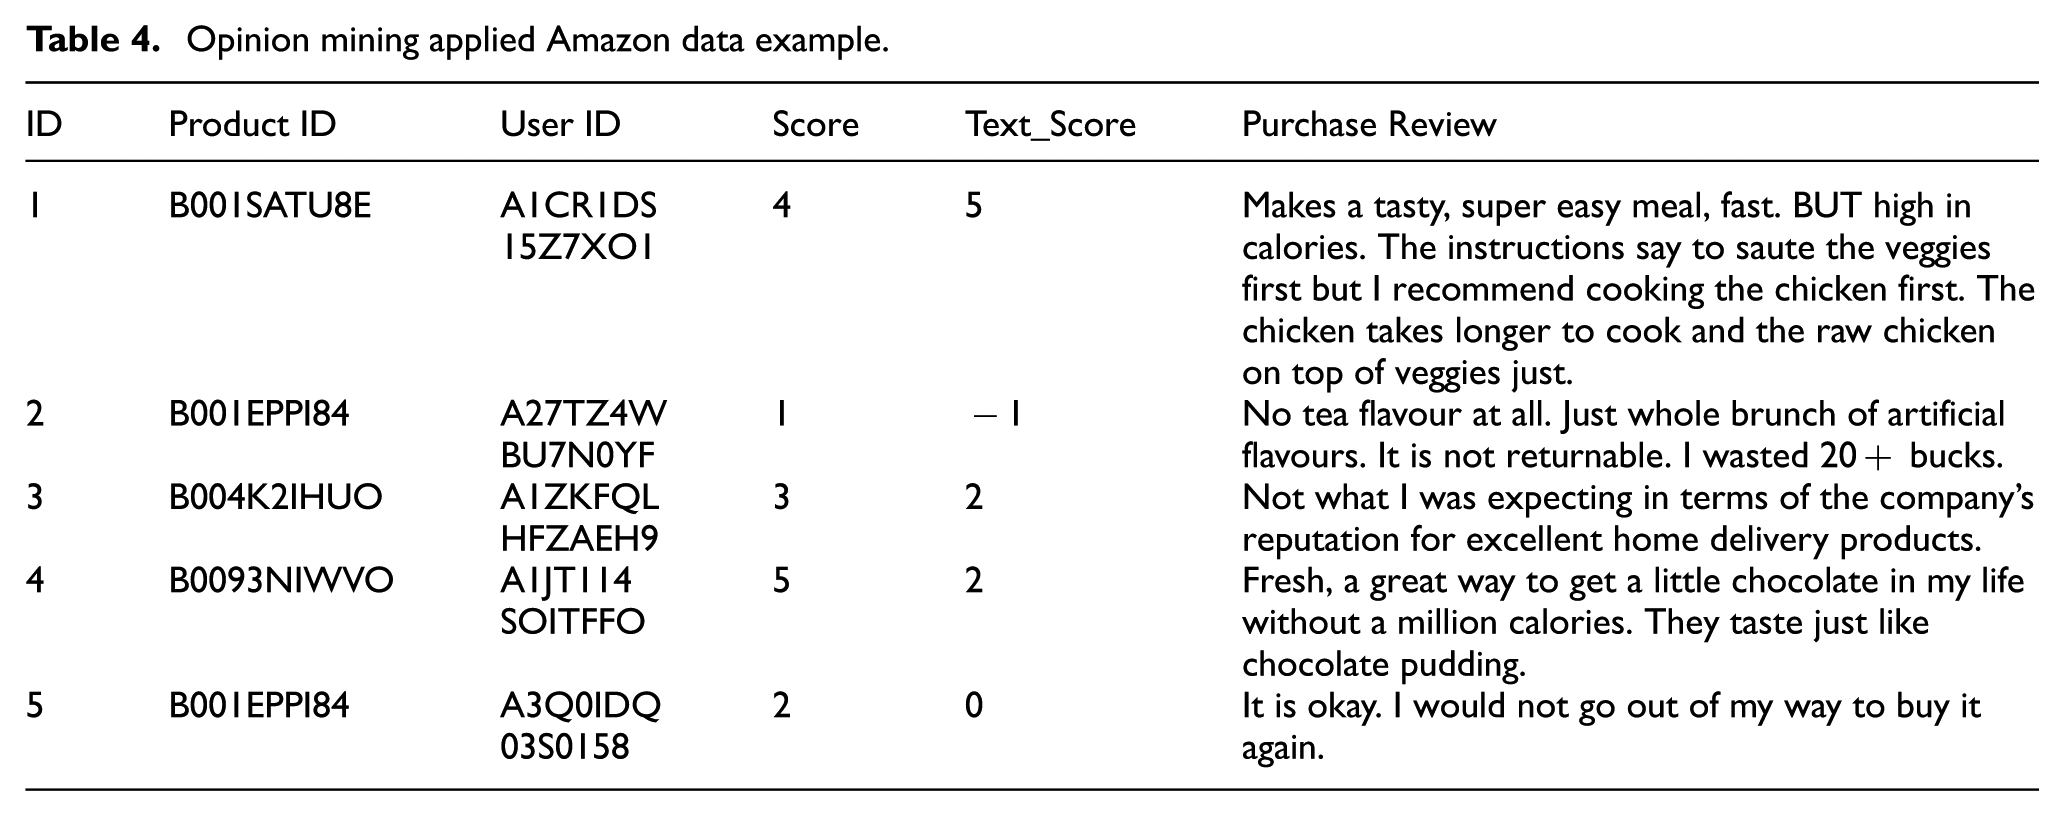
The value that is derived based on the results of opinion mining is called the ‘Text Score’. Sometimes, the results appeared that differ from the evaluation scores for the contents. Examples of data derived by the opinion mining results are shown in Table 4.
Opinion mining applied Amazon data example.
5.2. User-Based Collaborative Filtering
In this study, we compared and analysed the results by applying UBCF to OMNAD and OMAD based on Amazon data. Figure 3 shows the result of the analysis to find the number of the most suitable neighbours through the F measuring value of OMNAD and the suggested five models. As a result of the analysis, in OMNAD, the F-measure appeared highest for 10 neighbours (F = 0.0425), and in OMAD, the F-measure appeared the highest for 10 neighbours (F = 0.039174). In AS_OMAD, the F-measure appeared the highest for 10 neighbours (F = 0.0655), and in CS_OMAD, the F-measure appeared the highest for 20 neighbours (F = 0.0672). In NS_OMAD, the F-measure appeared the highest for 40 neighbours (F = 0.2007), and in NAS_OMAD, the F-measure appeared the highest for 20 neighbours (F = 0.2417). In other words, OMNAD, OMAD and AS_OMAD described that the most appropriate number of neighbours is 10 people; in CS_OMAD and NAS_OMAD, it is 20 people, and 40 people in NS_OMAD.
The F-measure for each model.
5.2.1. OMNAD
The analysis results of recall and precision in Figure 4 vary depending on the number of recommended items (one, three or five items) that would be produced per user. However, in OMNAD, when it set 10 people as the number of neighbours, each of the recall values showed the best results as 0.0368, 0.0488 and 0.0543, and precision values showed the best results as 0.0732, 0.0385 and 0.0265, respectively, according to the number of recommended products.
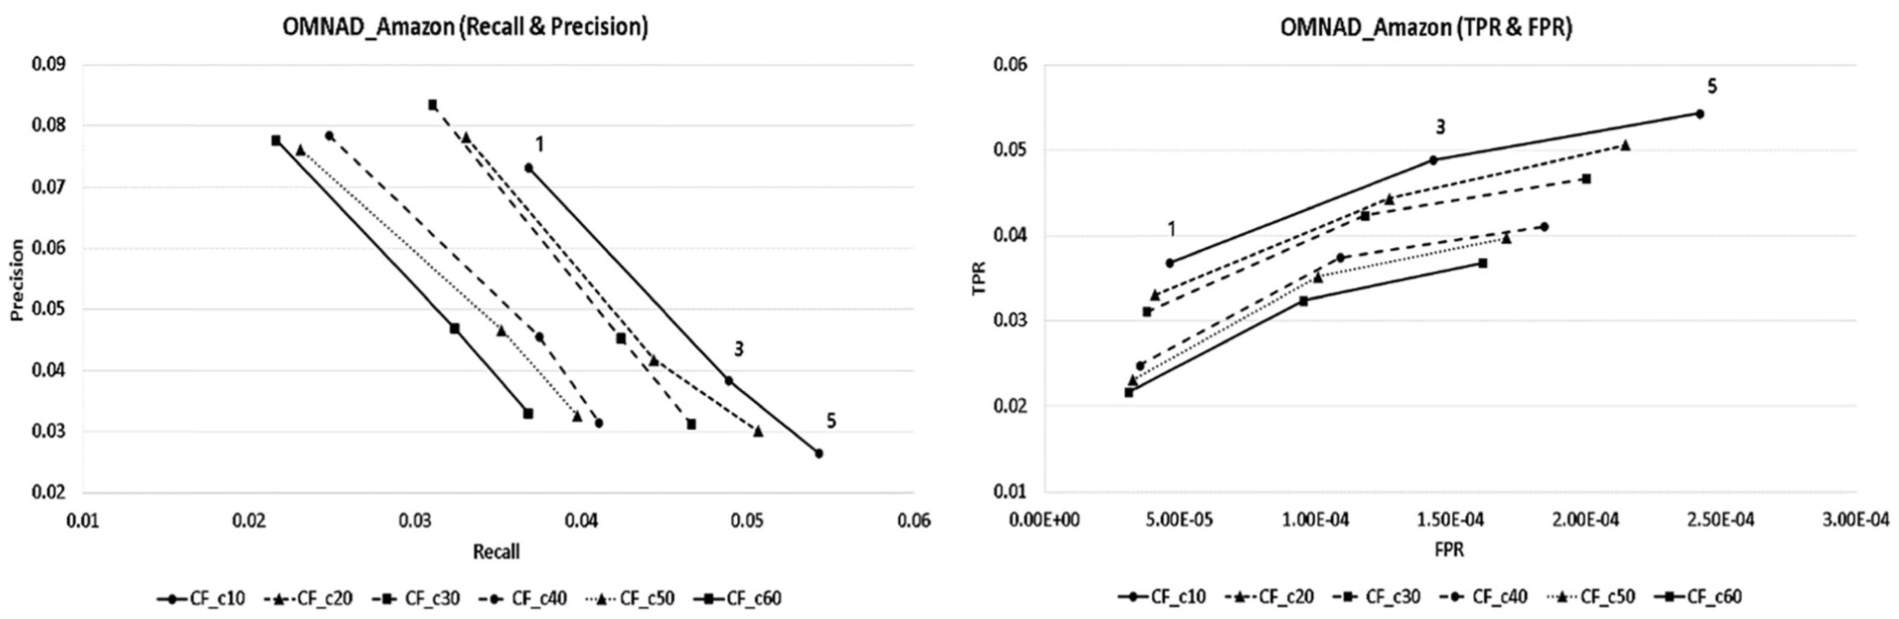
The OMNAD recall and precision and TPR and FPR graph.
As for the results of TPR and FPR analyses, for 10 people as neighbours that showed the highest performance in the recommendation system, the values of TPR appeared as 0.0368, 0.0488 and 0.0543 and of FPR appeared as 0.0000460, 0.0001434 and 0.0002420, respectively, according to the number of recommended products.
5.2.2. OMAD
The analysis results of recall and precision appeared in OMAD as shown in Figure 5. When it set 10 people as the number of neighbours, each of the recall values showed the best results as 0.0328, 0.0469 and 0.0502, and precision values showed the best results as 0.0662, 0.0365 and 0.0242, respectively, according to the number of recommended products.
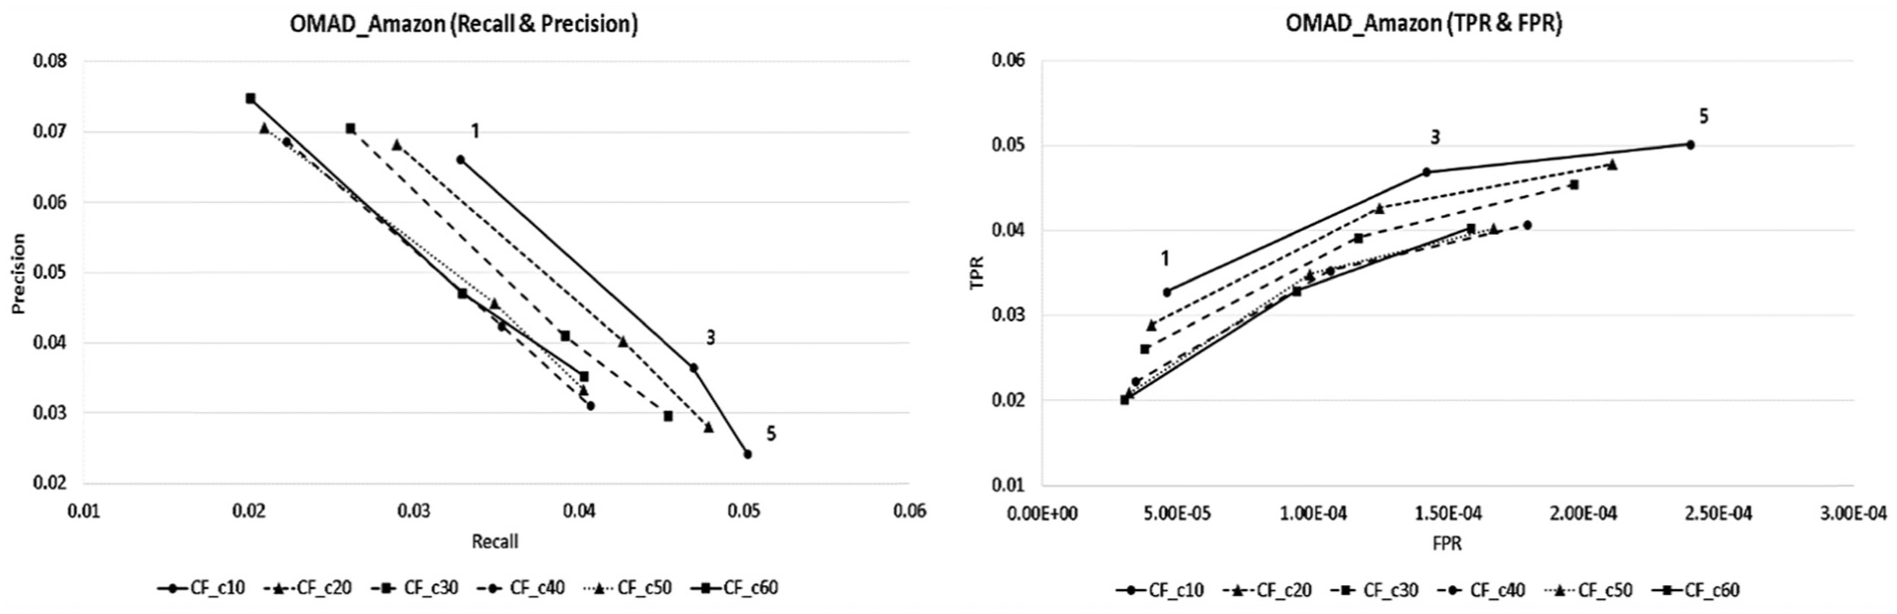
The OMAD recall and precision and TPR and FPR graph.
As for the results of TPR and FPR analyses, for 10 people as neighbours that showed the highest performance in the recommendation system, the values of TPR appeared as 0.0328, 0.0469 and 0.0502 and of FPR appeared as 0.0000458, 0.0001419 and 0.0002395, respectively, according to the number of recommended products.
5.2.3. AS_OMAD
The analysis results of recall and precision appeared in AS_OMAD as shown in Figure 6. When it set 10 people as the number of neighbours, each of the recall values showed the best results as 0.0516, 0.0702 and 0.0803, and precision values showed the best results as 0.1165, 0.0635 and 0.0459, respectively, according to the number of recommended products.
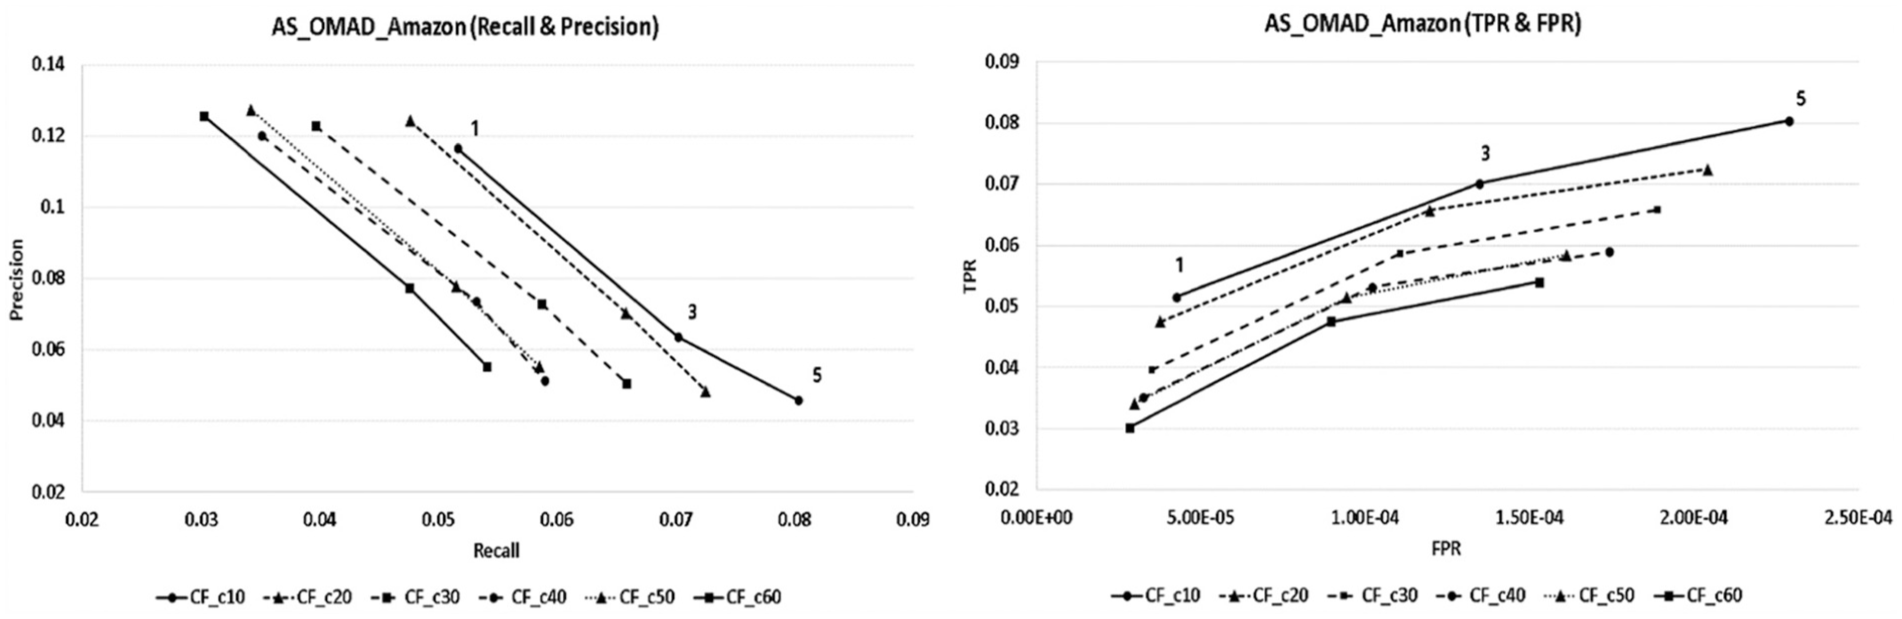
The AS_OMAD recall and precision and TPR and FPR graph.
As for the results of TPR and FPR analyses, for 10 people as neighbours that showed the highest performance in the recommendation system, the values of TPR appeared as 0.0516, 0.0702 and 0.0803 and of FPR appeared as 0.0000423, 0.0001347 and 0.0002288, respectively, according to the number of recommended products.
5.2.4. CS_OMAD
The analysis results of recall and precision appeared in CS_OMAD as shown in Figure 7. When it set 20 people as the number of neighbours, each of the recall values showed the best results as 0.0598, 0.0834 and 0.0923, and precision values showed the best results as 0.1048, 0.0588 and 0.0408, respectively, according to the number of recommended products.
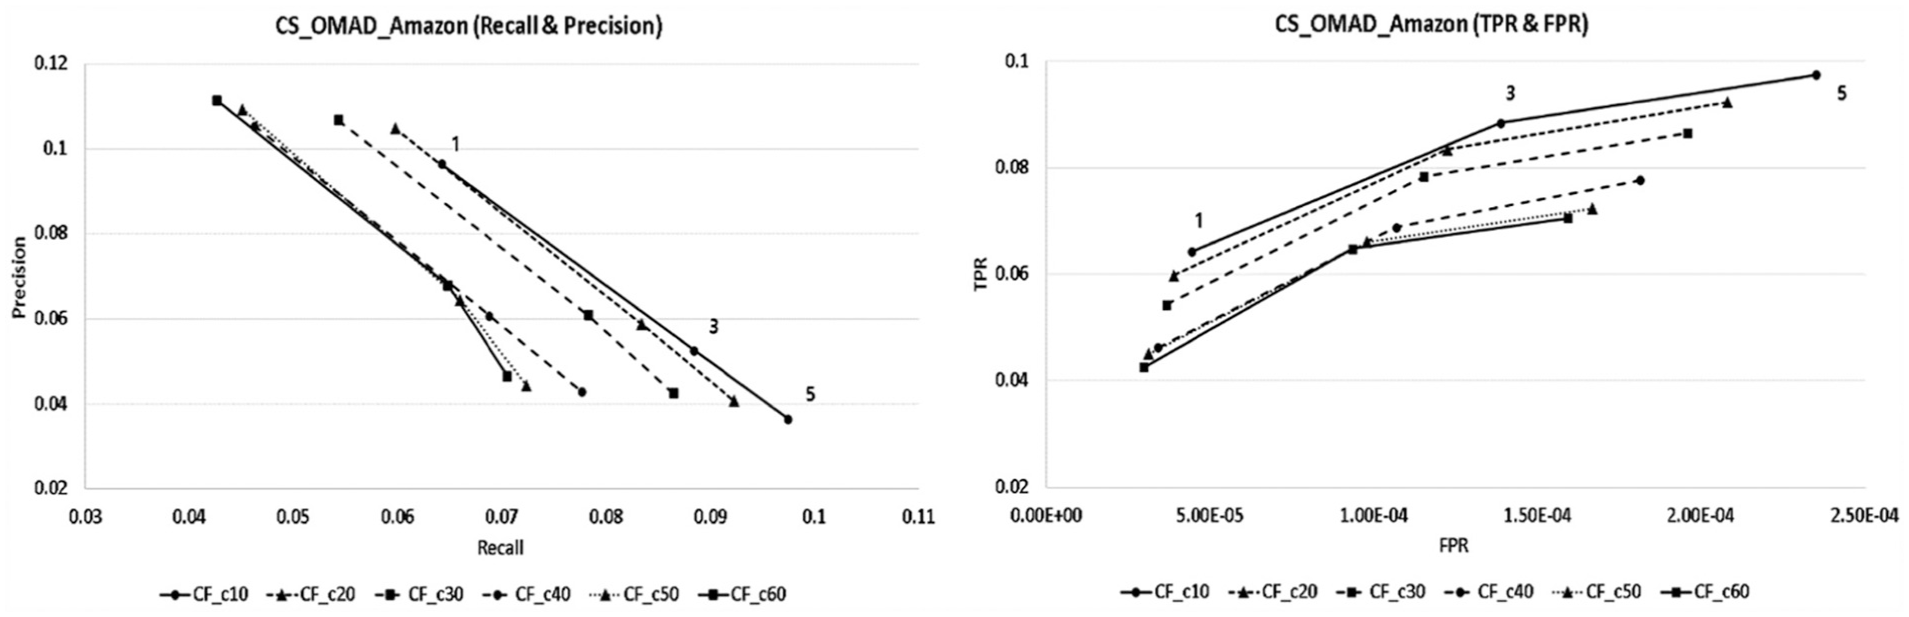
The CS_OMAD recall and precision and TPR and FPR graph.
As for the results of TPR and FPR analyses, for 20 people as neighbours that showed the highest performance in the recommendation system, the values of TPR appeared as 0.0598, 0.0834 and 0.0923 and of FPR appeared as 0.0000388, 0.0001225 and 0.0002081, respectively, according to the number of recommended products.
5.2.5. NS_OMAD
The analysis results of recall and precision appeared in NS_OMAD as shown in Figure 8. When it set 40 people as the number of neighbours, each of the recall values showed the best results as 0.1529, 0.1906 and 0.1955, and precision values showed the best results as 0.4601, 0.2289 and 0.1451, respectively, according to the number of recommended products.
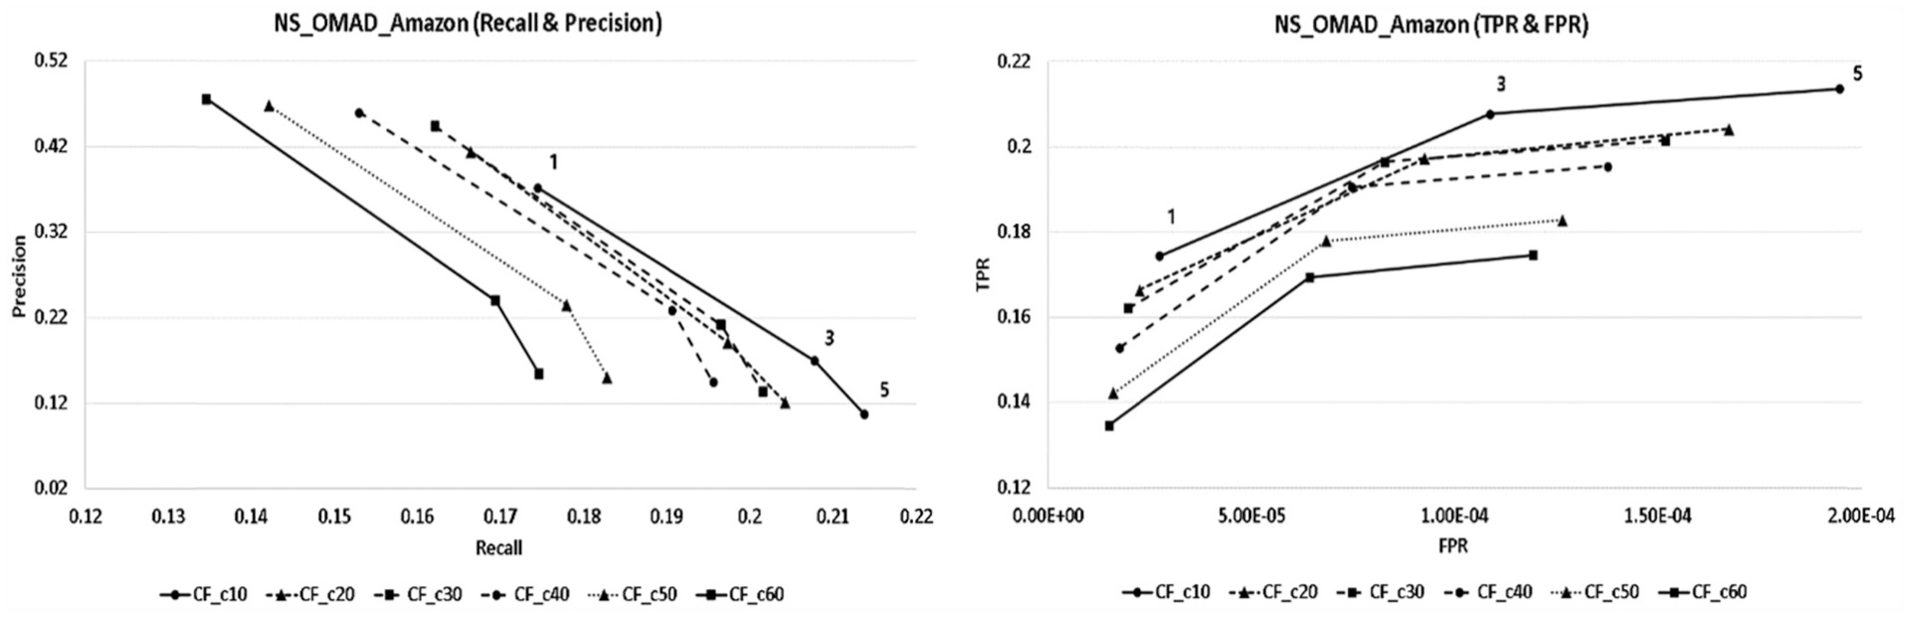
The NS_OMAD recall and precision and TPR and FPR graph.
As for the results of TPR and FPR analyses, for 40 people as neighbours that showed the highest performance in the recommendation system, the values of TPR appeared as 0.1529, 0.1906 and 0.1955 and of FPR appeared as 0.0000174, 0.0000744 and 0.0001375, respectively, according to the number of recommended products.
5.2.6. NAS_OMAD
The analysis results of recall and precision appeared in NAS_OMAD as shown in Figure 9. When it set 20 people as the number of neighbours, each of the recall values showed the best results as 0.2039, 0.2500 and 0.2572, and precision values showed the best results as 0.5093, 0.2383 and 0.1503, respectively, according to the number of recommended products.
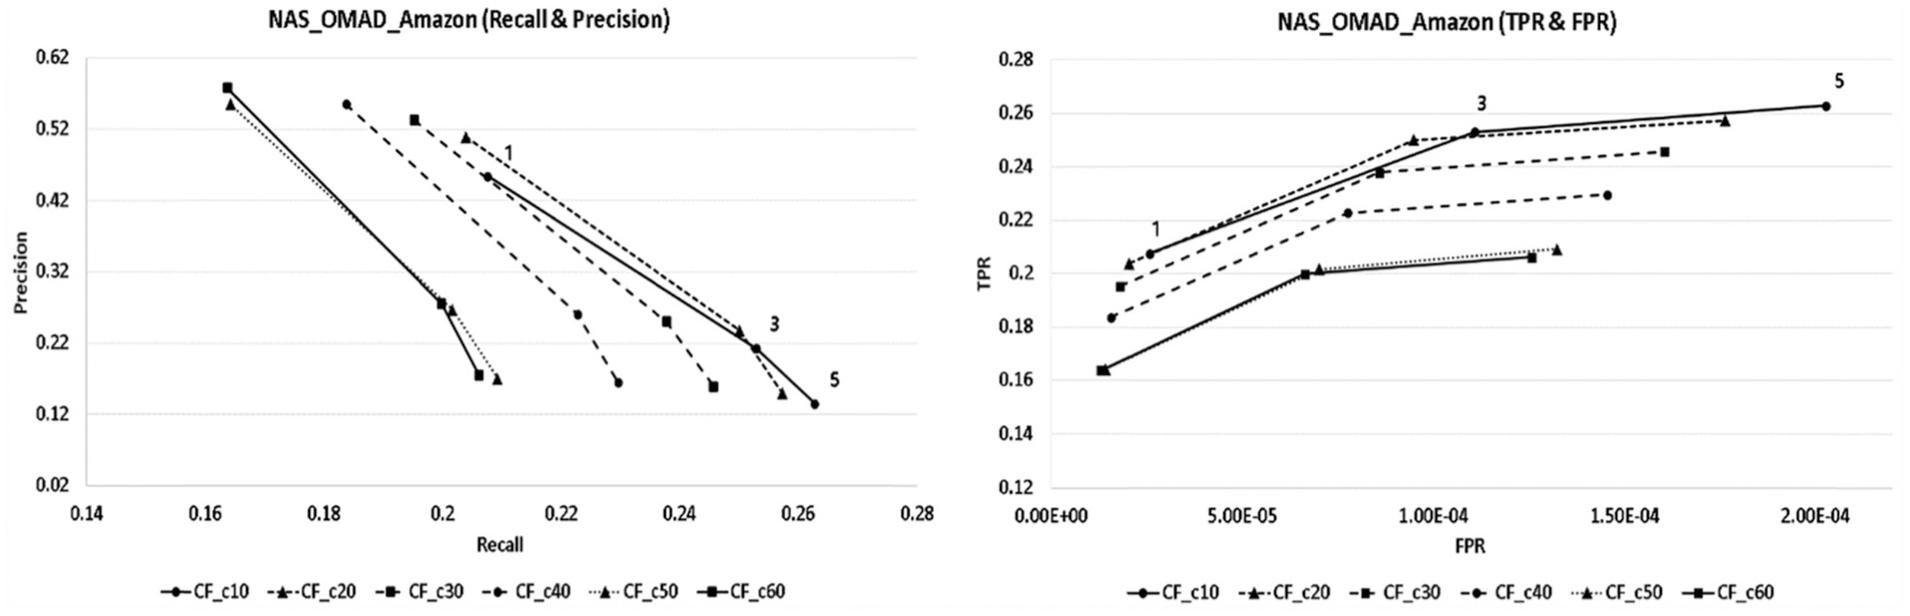
The NAS_OMAD recall and precision and TPR and FPR graph.
As for the results of TPR and FPR analyses, for 20 people as neighbours that showed the highest performance in the recommendation system, the values of TPR appeared as 0.2039, 0.2500 and 0.2572 and of FPR appeared as 0.0000203, 0.0000948 and 0.0001763, respectively, according to the number of recommended products. Furthermore, in all models, the more the number of neighbours increased, the values of recall and TPR decreased.
Further analysis on the number of recommended items showed that the precision decreased while the recall increased, and both TPR and FPR values increased. In other words, although the probability that an item recommended by the recommendation system being a favourite item of the user decreases, the probability of recommending the item from a user’s favourite item is increased. Also, as the number of recommended items increases, the ratio of recommended items which were user-selected items also increases. However, the proportion of items that users did not select also increased.
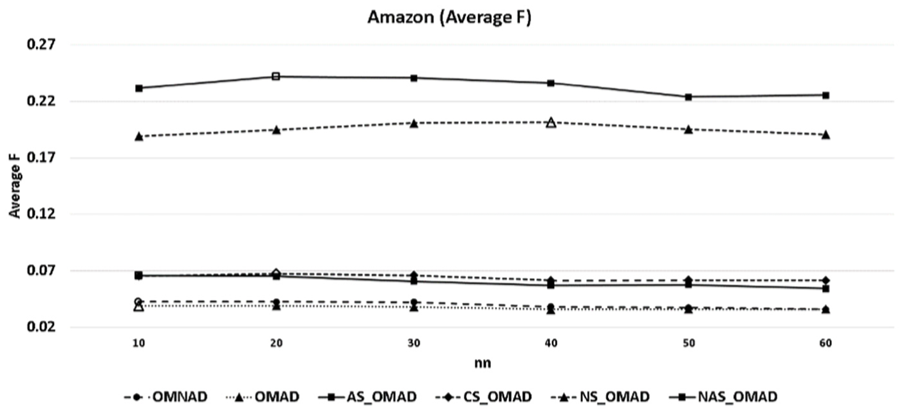
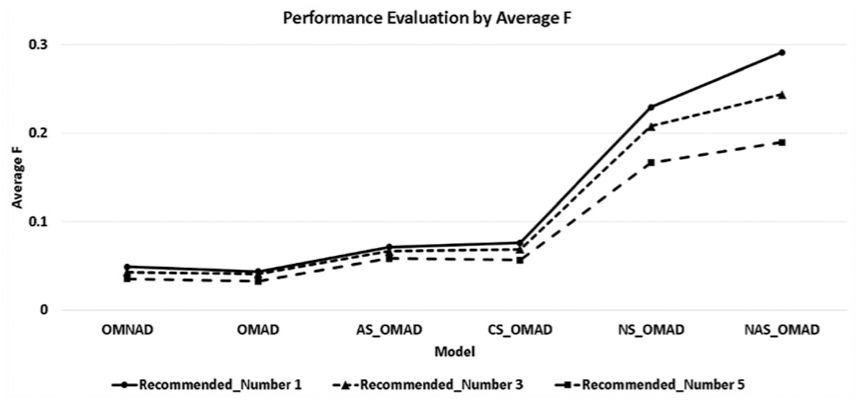
Except for the OMAD model, all four models showed increased performance compared with OMNAD. In other words, through the application of opinion mining, it was demonstrated that the performance of the recommendation system can be improved. However, among the proposed models, two models (NS_OMAD and NAS_OMAD) that applied normalisation in particular showed the greatest improvement in performance. As illustrated in Table 5, the numbers regarding recall, precision, TPR and FPR confirm how significantly the performance was improved on models that applied normalisation compared with the initial proposed OMAD model. Also, Table 6 shows the summarisation of how the F-measure changes according to the recommended number in the existing OMNAD model and the proposed five models. According to these tables, the performance decreased a little in OMAD compared with OMNAD; however, the remaining five models demonstrated an improvement in performance. In particular, two models (NS_OMAD and NAS_OMAD) that applied normalisation showed three times greater improvement in performance than the previous two models. Figure 10 illustrates a comparison of each model’s F-measure. Through the comparison figure of F-measure analysis, the improvement of the performance of the proposed models can be confirmed.
Model-specific performance evaluation measure comparison.
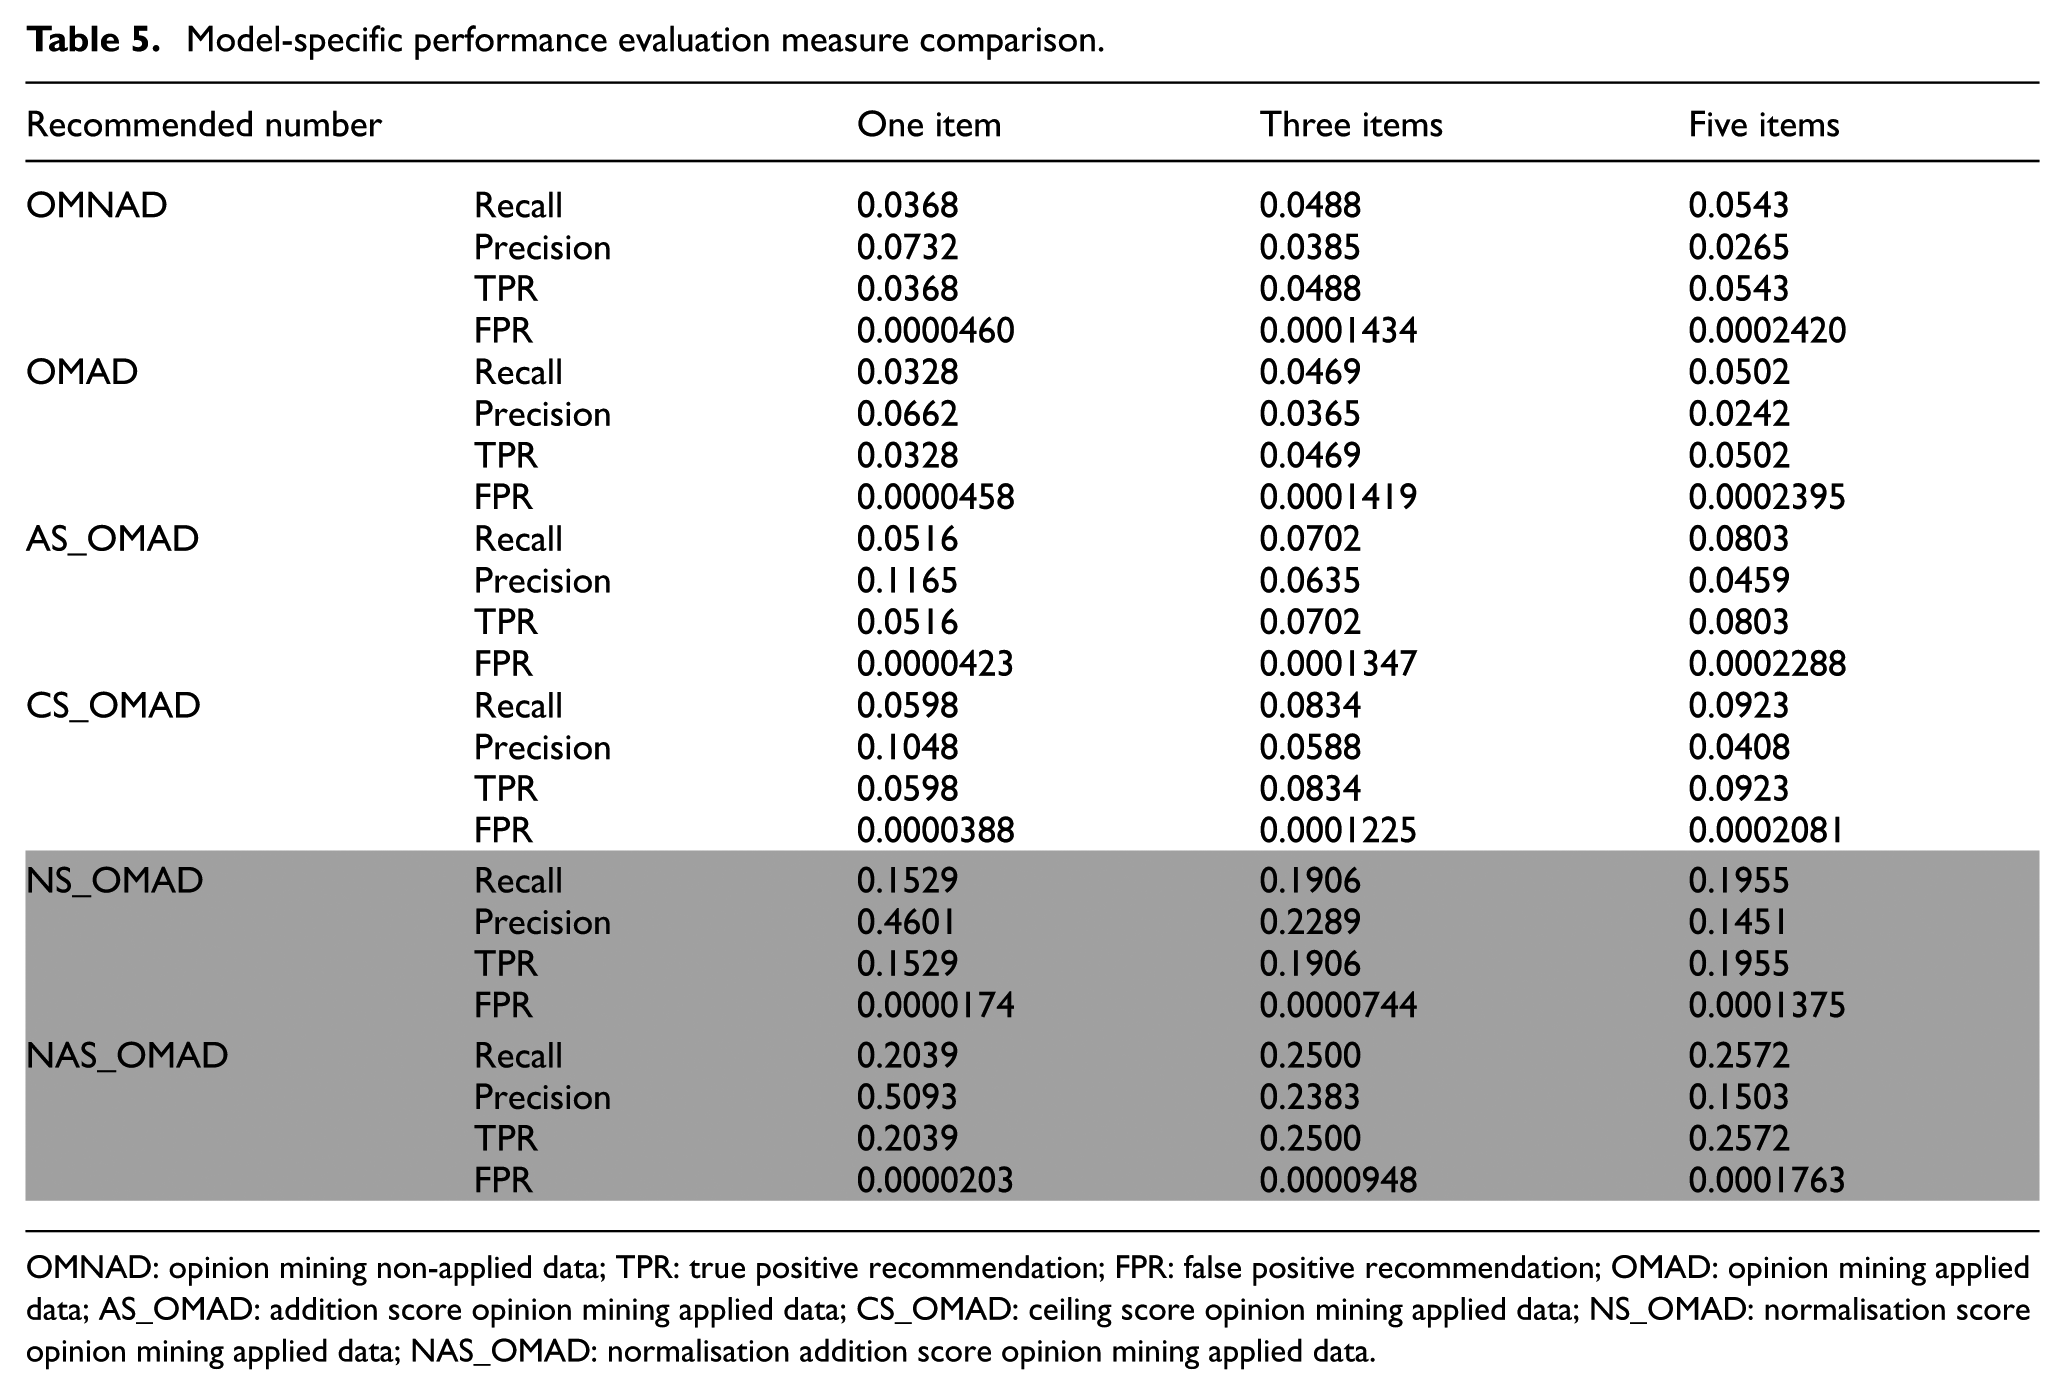
OMNAD: opinion mining non-applied data; TPR: true positive recommendation; FPR: false positive recommendation; OMAD: opinion mining applied data; AS_OMAD: addition score opinion mining applied data; CS_OMAD: ceiling score opinion mining applied data; NS_OMAD: normalisation score opinion mining applied data; NAS_OMAD: normalisation addition score opinion mining applied data.
Model-specific F-measure comparison.
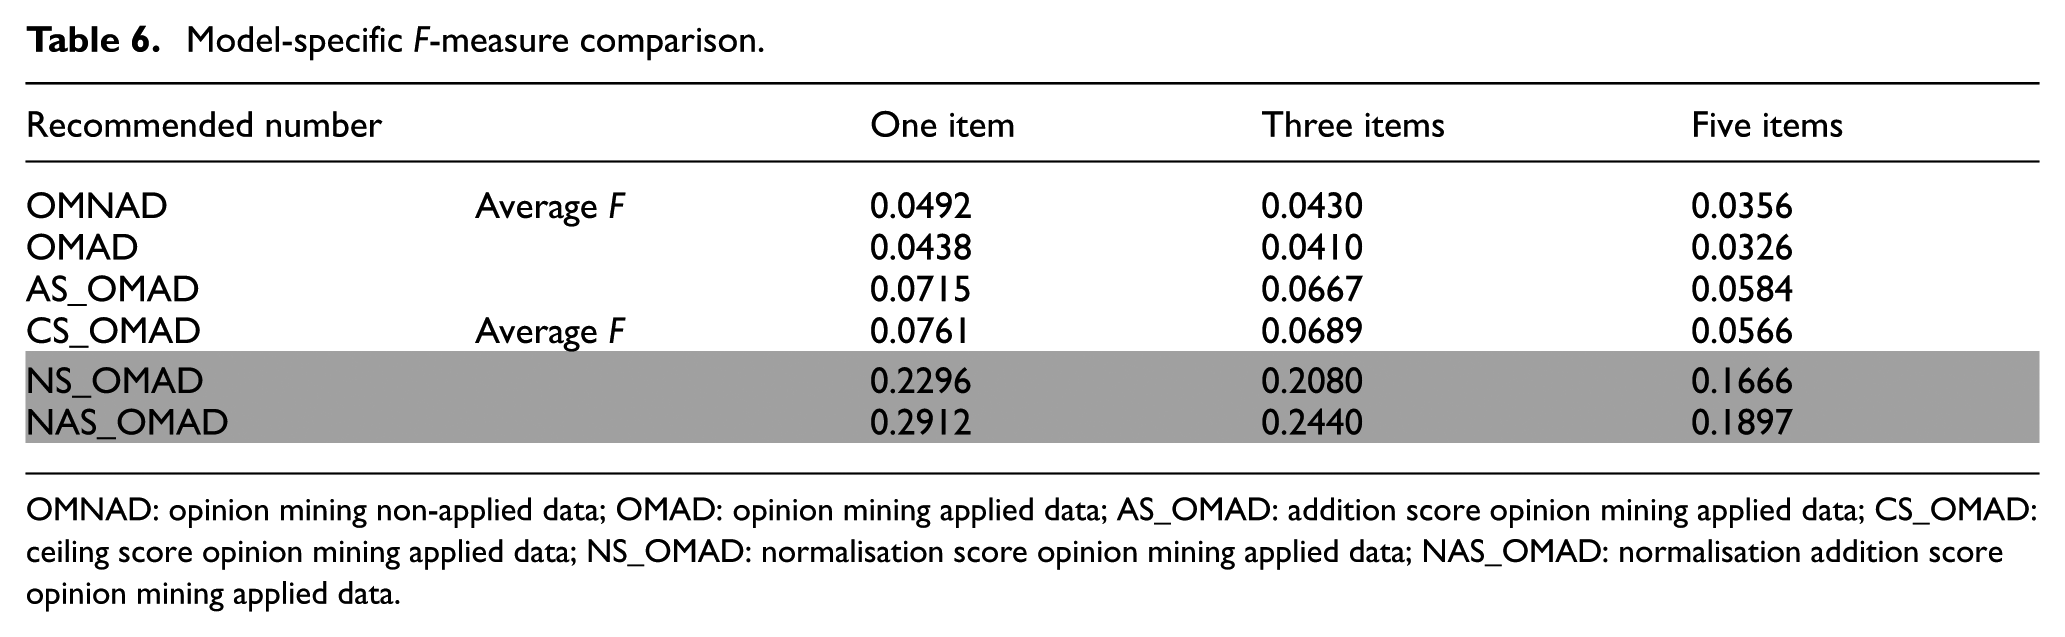
OMNAD: opinion mining non-applied data; OMAD: opinion mining applied data; AS_OMAD: addition score opinion mining applied data; CS_OMAD: ceiling score opinion mining applied data; NS_OMAD: normalisation score opinion mining applied data; NAS_OMAD: normalisation addition score opinion mining applied data.
The model-specific F-measure comparison.
6. Conclusion and future work
In the previously conducted recommendation study based on the CF algorithm, the following concerns were raised. First, compared with the superiority of the CF algorithm, its predictive ability is not high. Second, it was questioned whether quantitative data, such as evaluation scores and selected contents, can represent the preferences of users. Therefore, in this study, we proposed a recommendation system based on opinion mining utilising after-purchase reviews. The system makes recommendations through two steps. First, it conducts opinion mining utilising summarised data of after-purchase reviews. Second, it recommends contents by applying the results of opinion mining to the existing data. Therefore, the recommendation method being proposed in this study, based on text mining and using users’ after-purchase reviews, reaches two conclusions: (1) with regard to product recommendation, using after-purchase reviews that users wrote after experiencing the contents directly (in addition to the quantitative data used in the existing recommendation method), it can consider users’ preferences objectively. (2) It demonstrated that such a recommendation system’s predictability increases through the use of after-purchase reviews written by users when recommending the products.
This study proves that the application of opinion mining leads to performance improvement; however, a problem in interpreting reviews has also been found. For instance, in an after-purchase review containing more than two negative words that says ‘NOT GOOD’, the recommendation system cognised ‘Not’ and ‘Good’ separately and thus may not interpret the meaning correctly. Also, there is the problem that not every user writes a purchase review. This problem can be an obstacle to the application of the recommendation system proposed by this study. In future work, we shall prepare the solutions for the problem mentioned above, and at the same time, we shall also prepare methods that can apply the proposed methods to actual situations effectively.
Footnotes
Declaration of conflicting interests
The author(s) declared no potential conflicts of interest with respect to the research, authorship and/or publication of this article.
Funding
This work is supported by the ICT R&D programme of MSIP/IITP (Development of distribution and diffusion service technology through individual and collective intelligence to digital contents, 2016) and the National Research Foundation of Korea (NRF) grant funded by the Korea government (MSIP; no. R1610941).