
Abstract
Recently, the ceaseless rise in the global average temperature has led to extreme climates in which natural disasters, such as droughts, hurricanes, earthquakes and floods, are becoming increasingly serious. Recent research has found that social media typically reflects disasters earlier than official communication channels. In this study, the idea of collecting information on flood disasters caused during the periods of typhoons and heavy rains for a city from the plain text messages released by social media by means of a term frequency (TF) and sliding window approach is proposed. The dataset analysed here contains a total of 292 articles and 12,484 tweets. This research determines how to establish a warning mechanism, with an added notification time for flooding disasters, and it shows how to provide relevant disaster relief personnel with references. This article contributes by combining social media data with emergency management information cloud (EMIC) data, especially in the context of having a mechanism for warning about flooding disasters. According to the experimental results, a sliding window of 90 min and a sliding gap of 10 min obtained the best F-measure value (F = 0.315). The event studied was Typhoon Megi (September 2016), which caused major flooding in Tainan. For the Typhoon Megi event, the flood disaster location database had 161 streets available for matching. Based on the experimental results, it is possible to obtain a high-precision (90% or higher) accuracy rate from real-time tweet data by exploiting a social media dataset.
1. Introduction
In recent years, due to the impact of global climate change, the frequency of extreme weather and natural disasters has increased. Social media can play a critical role in propagating disaster information that can be leveraged for disaster relief [1]. Increasing research literature has solved crisis problems through social media information [2]. Among them, the application of social media in natural disasters has begun to attract the attention of researchers [3]. Social media plays an important role in coordinating relief [4]. With the popularity of smartphones, people can post microblogs, images and videos on social media sites in real time. This information can provide people with more useful instant information, especially in relation to natural disasters such as earthquakes, floods and tornadoes [5]. For example, in the Haiti earthquake on 12 January 2010, people posted text and photos of earthquake experiences through social media sites [1]. Therefore, increasing technologies, such as crowdsourcing, are applied to flood disaster risk reduction (DRR). In addition, social media services, such as Twitter and Facebook, are often used for flood, earthquake and fire applications [6].
Today, social media has become an important channel for information dissemination, even replacing the role of traditional media. Elsewhere, social media can also support raising awareness and coordinating relief efforts such as in earthquakes [7], flood [4,5], and droughts [8].
Droughts have the greatest impact among the world’s natural disasters such as floods and storms [6]. An example is Hurricane Sandy that occurred on 22–29 October 2012 with at least 147 direct deaths, with initial losses estimated to be close to US$50 billion, making Sandy the second most costly hurricane since 1900 [9]. Another example is the Typhoon Haiyan on 8 November 2013, which caused serious damage to the infrastructure of the Philippines, causing heavy casualties [10]. If the reaction to these disasters can be activated as early as possible, more people are likely to be rescued.
Through the social media platform, users can understand the behaviour of other users and the content they are currently publishing, and users repeatedly return relevant information and see what others are doing. In other words, an important characteristic of social media is its real-time nature, and it is increasingly used for emergency communications and help-related requests [11].
Scientific data on earthquakes, floods and other phenomena can increase user data integration models to predict the timing and location of future requests and requirements [1]. Deep learning technology can be used to classify the topic of upcoming events [12], and it can also be applied to image classification from social media pictures [13]. However, during a flood event, the location of the flood event is often mentioned in social media messages, but only approximately 1% of tweets in social media contain a geographic tag [5]. To improve this problem, this study will extract the flooding locations on the streets from the text content. In this article, three modules were designed. First, corpora were crawled from a large number of tweets related to the target events during flooding disasters. Second, the term frequency (TF, the number of times a word appears in a document) and time-series sliding window method were used to extract the event attributes and event locations. Finally, this research developed a method for establishing a warning mechanism that extracts notification times for flooding disasters from tweets.
The first module extracts the tweets related to the target event collected by event-related terms. The proposed method applies semantic analysis to analyse tweet content. For example, users might make tweets such as ‘is there flooding on Yunong Road and Yongda Road ?’ (裕農路跟永大路有淹水嗎) or ‘extremely heavy rain causing flooding of four thousand homes’ 豪雨成災 台南逾四千戶淹水) for which ‘flooding’ (淹水) or ‘extremely heavy rain’ (豪雨) could be keywords, and ‘Yunong Rd’ (裕農路) and ‘Yongda Rd’ (永大路) could be the locations.
The principle of this approach is to assign a weight to the related terms; the weight represents the appropriateness of the target event and uses the TF and sliding window approach to compute the term. In this study, if the matching position and notification time are the same as the emergency management information cloud (EMIC) label, it is considered true positive. We calculate the accuracy, recall and F1 measurements to assess the overall accuracy of our method. In addition to well-known social platforms such as Facebook and Twitter, similar social platforms in Taiwan are also popular among local people. There are millions of registered users and tens of thousands of people publishing and browsing articles and tweets online at the same time. A bulletin board system (BBS) was established by National Taiwan University. The BBS is called PTT1 (批踢踢). The BBS platform has features such as Twitter issues or articles and tweets to update responses (see https://en.wikipedia.org/wiki/PTT_Bulletin_Board_System).
The data corpus used in this research was chosen from PTT (https://www.ptt.cc/bbs/hotboards.html) in Taiwan as the largest BBS (electronic bulletin board service) forum. This article uses data from the Tainan board text message (tweet) in the PTT platform and the EMIC disaster report data for further analysis.
According to the 2005 World Bank Hazard Management Unit publication on natural disaster hotspots, Taiwan has more than 95% of the regions with a relatively high total population, and there are two or more risks of natural disasters [14]. Taiwan has the highest economic exposure to natural hazards [15]. For example, Morakot was one of the most serious typhoons that hit Taiwan in 2009. The Typhoon Morakot caused severe floods and very large mudslides in southern Taiwan, causing many deaths and considerable property damage [16]. To reduce the risk, this research chooses flooding in Tainan as the target event for establishing a flooding warning mechanism in flooding-prone regions. During a disaster, it is important to make the right decisions to help the affected people meet their needs. Due to the lack of direct communication with the victims, the disaster management team relies on incomplete or incorrect information most of the time [11]. In this case, information from social media can help the rescue team take the best action [11]. This research analyses community information during disasters and helps build early warning models based on people’s disaster information. The proposed model can help rescuers understand the disaster situation.
The disaster warning system should be developed to prioritise rescue time and obtain disaster locations to improve rescue efficiency. In recent years, there have been few studies on the application of text exploration technology to natural disaster early warning. Middleton et al. [5] indicated that only approximately 1% of tweets in social media contain geographic tags of disaster events. The existing research does not use this information although it is very important for understanding the impact of disasters [17]. Therefore, this research proposes a simple and fast warning mechanism that is more suitable for natural disasters, and extracts the locations of floods on streets from the text content to improve the efficiency of disaster relief.
The goals of this article are listed as follows:
Building a flooding disaster notification and warning system. This article presents the idea of how to establish a warning mechanism with notification time for flooding disasters and provides relevant disaster relief personnel with references.
Prioritise rescue time and obtain disaster locations to improve rescue efficiency.
2. Related work
In this article, several key factors for building a disaster warning systems are of concern, namely, the data stream capturing speed and the represented keywords. In this article, the sliding window and TF are adopted and discussed below.
2.1. Sliding window
Online news in social media is constantly updated, providing valuable knowledge through data analysis [18]. After an incident, a large number of relevant text information is usually released in a short period of time. Therefore, how much information should be used for analysis is an important question. Many studies have focused on the improvement of efficiency to obtain good performance in time-series data mining [19], that is, by employing sliding window [20–22] and deep learning [13,23] approaches. Deep learning models can take into account the characteristics of time-series data for prediction [23], but training deep networks is usually a very time-consuming task [24]. However, the time-series segmentation-sliding window method divides a long time series into several short sub-sequences [25], which is effective for processing data streams [20–22]. Therefore, this study divides tweets into slices with a fixed time window size. By scanning all sliding windows, a series of new word frequency datasets can be identified.
2.2. Term frequency
The term-weighting scheme was a way to describe the relevance of term and documents. The frequency of terms in documents (e.g. term occurrence frequency, TF) and term relevance (e.g. term frequency–inverse document frequency, TF-IDF) information was quite common [26]. TF-IDF filters out frequently occurring term and keeps important term words. However, TF-IDF emphasised the importance of terms in the document, and text-specific topic words were likely to be given a lower TF-IDF weight than rare words [27]. The TF factor was usually used to measure the frequency of terms in query text [28], which can improve text clustering [29,30]. When a disaster event occurs, to find the subject terms or keywords of a specific disaster event, the TF weight was more suitable than the TF-IDF weight. It also had a good effect in fake news detection application [31].
2.3. Warning system
In this section, the application of text mining in early warning scenarios is reviewed. Examples include the notification from the earthquake reporting system developed using social media data that is faster than that from the Japan Meteorological Agency [7]; the prediction or early warning of student performance [32]; the use of social media data and probabilistic weather forecasts for early flood detection [33]; and topic analysis of the coronavirus literature that proposed a framework method for scientific foresight analysis [34]. These studies were utilised for early warning systems and extracted useful information.
Many researchers have published their studies of analysing social media (e.g. Twitter) content. Most studies are applied to event detection [13], geographic coordinates to identify disaster locations [12,13,35], and emotion and topic analysis [3], but few studies have been conducted on natural disaster early warning mechanisms and the locations of such disasters. Some of these studies use deep learning for model training [12,13,17,35]. In practice, most of the deep learning process requires manual preparation of a large amount of data in order to train the deep learning model, and the model training process is a very time-consuming task [24,36]. Therefore, this application of natural disaster events in the real world will be greatly restricted. To improve upon these limitations, the sliding window and TF methods used in this study are implemented because they are simpler, faster, and more suitable for natural disaster warning mechanisms.
3. Methodology
This section describes the module methods used in the proposed system.
3.1. Research architecture
Our approach further analyses the relationship between flood information and official rescue time from social media data and official flood disaster notification data. The goal of this article is to analyse social media text to warn of and identify flooding disaster locations. Figure 1 shows the system architecture for the text mining process used in our study:
In the preprocessing module, the raw data were processed mainly by word segmentation, filtering stop words and assigning attributes. The feature extraction is driven by a web crawler tasked with a set of keywords.
This article used TF and a sliding window to identify the disaster trends and to find appropriate parameters from those tweets and to predict the locations of the events.
Finally, we used statistical analysis techniques to alarm the disaster location by evaluating the threshold of the warning mechanism for the government office.
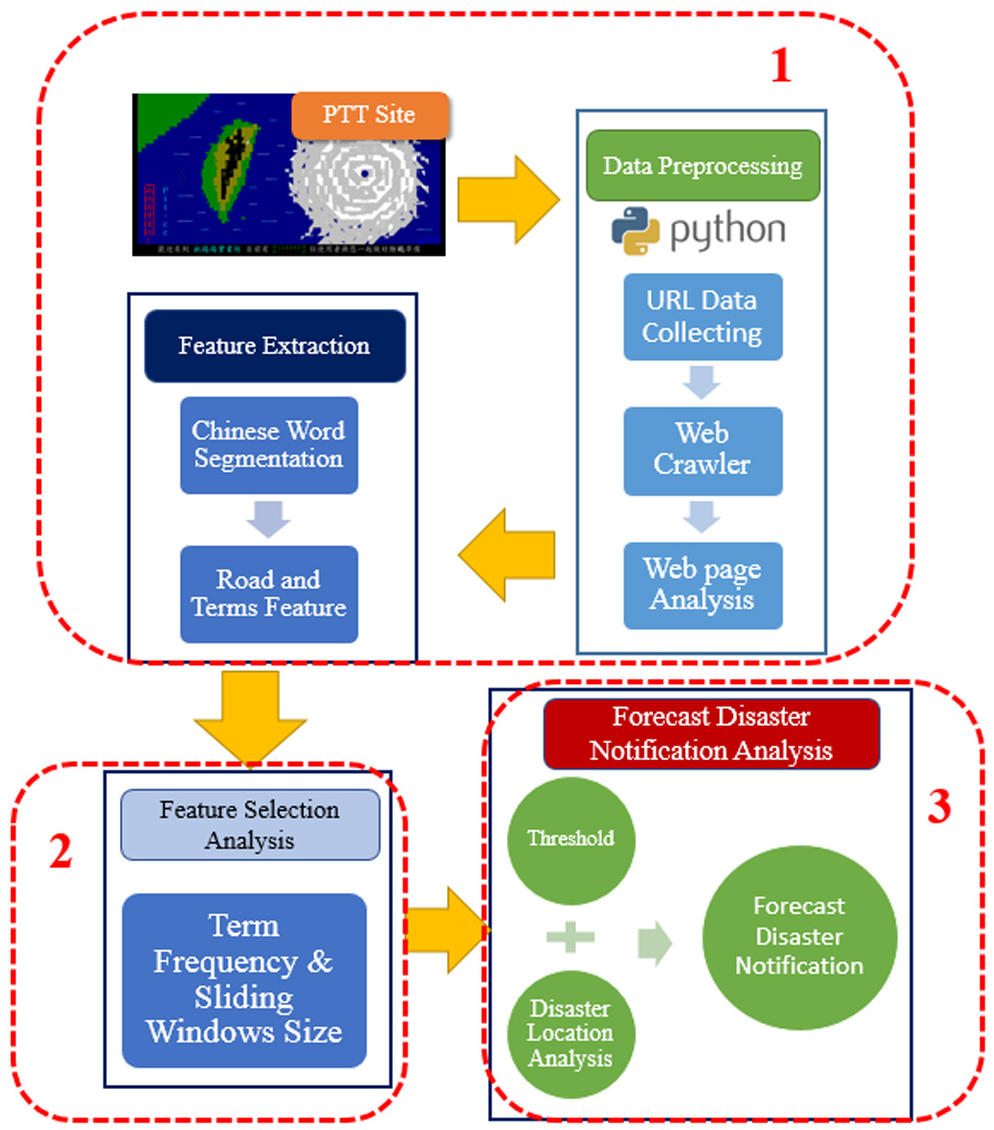
System architecture and information flow.
3.2. Data preparation
The system starts by transforming raw data into a usable format, mainly by word segmentation, stop-word filtering and feature selections. To identify messages that contain relevant information, this article retrieved the messages that referred to the flooding event. In this research, a web crawler was used to collect the flooding tweets from the government EMIC. Figure 2 shows how to extract the candidate terms from our example. In the segmentation step, the content utilised the Chinese Knowledge Information Processing Group (CKIP) system, which was constructed by Academia Sinica, to break up the text into terms. After that, high-frequency composition words of the article were selected after removing the noise words and stop words (such as is, are, you and I). Finally, the dataset information data were stored in a database for analysis and visualisation.
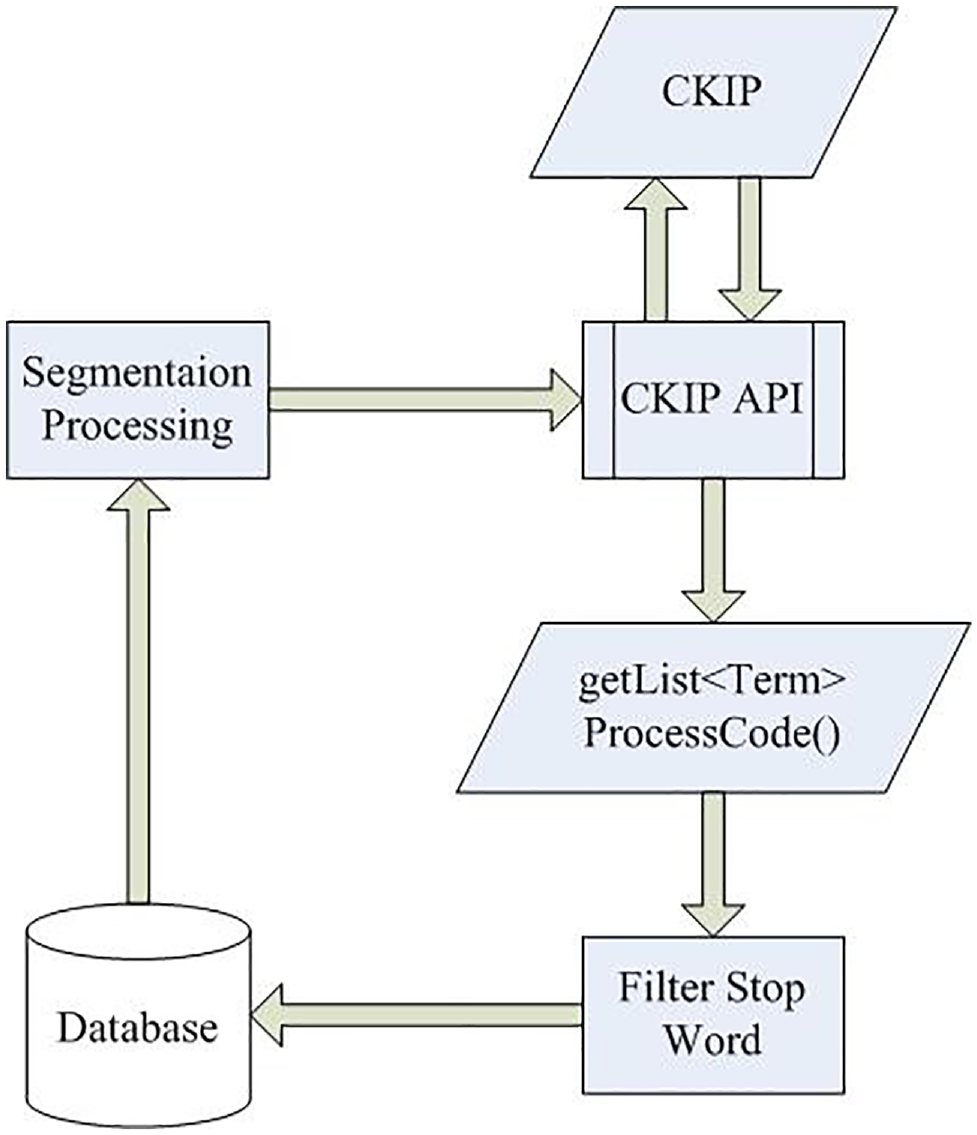
Extraction of the candidate terms with CKIP.
During the process, each article is an ∈ article set A and yields the obtained article
Each actual flooding disaster notification d∈ actual flooding disaster set D from EMIC and yields the obtained actual flooding disaster notification
3.3. Sliding window and term frequency
In this module, the temporal series of documents are grouped to calculate the term weight to evaluate each term’s importance for each time slot. The sliding window is used to calculate the frequency of each keyword in the tweet and sort the frequency of the term to identify each flood disaster event [25]. Keywords are related to disaster events, expressed in high-frequency terms and terms. After identifying the terms of each flooding disaster, the possible location and flooding disaster time are estimated. In this model, the variables include the event time t, sliding window k and sliding interval s. The total sliding window Ns = (t − k)/s + 1. The concept is shown in Figure 3.
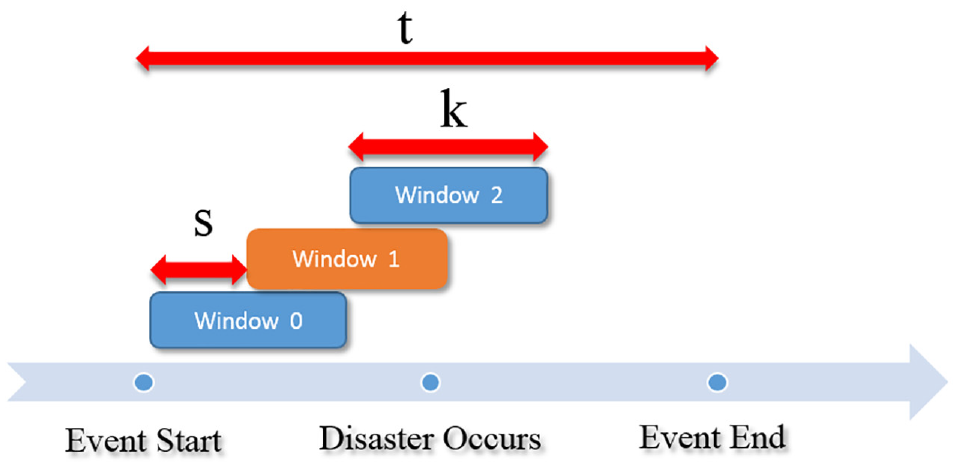
Sliding window.
Some studies [28–30] suggested that a term’s importance can be evaluated by measuring the frequency of occurrence of the terms in the document or query texts. To process the Chinese text, we used CKIP to divide the sentence and analyse its parts of speech. This article applied standard stop-word elimination and sort for TF. The example 0809 illustrates an extremely heavy rain in 2014. This research uses a set of keywords for the flood event feature to record them, as shown in Figure 4 (e.g. keyword set W is ‘flood’, ‘water’, ‘rain’ and ‘flooding’, which in Chinese means ‘淹’, ‘水’, ‘雨’ and ‘淹水’). Among these, 永康 (Yongkang), 東區 (East Dist.), 仁德 (Rende), 南區 (South Dist.) and 安平 (Anping) are location names in Tainan.
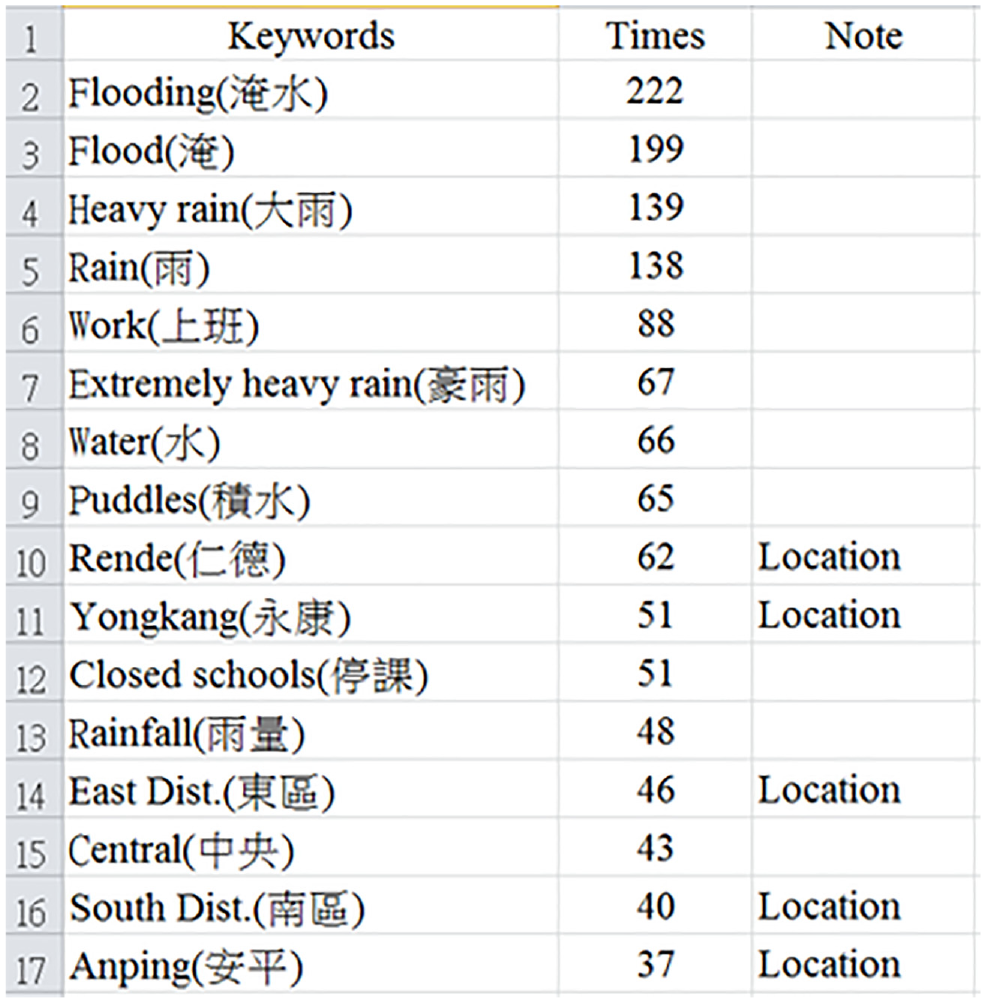
Keyword set of example 0809 of extremely heavy rain in 2014.
Figure 5 shows the number of corresponding tweets for the target event, flooding, and each tweet has its own publishing time. Figure 5 shows the actual data for the 0906 example of extremely heavy rain in 2016, for which we made a breakdown of tweets recorded during the 48 h of the flooding event using our web crawler.
Example 0906 of extremely heavy rain in 2016. The figure shows the number of keywords and the actual flooding disaster notification of the disaster statistics.
Among the tweets from the PTT platform are firsthand users’ posting information, retweets and comments. In this study, from the tweet keyword dataset and the EMIC notification dataset captured, it was observed that people posted tweets about flood disasters at specific locations, roads and geographies. Finally, keywords and window sizes used as thresholds are suggested after the experiments.
4. Experiments and results
The results of this study are presented in the following sections. These experiments also suggest parameter values for the proposed model.
4.1. Dataset collection
Social media can be an important resource for information. In this experiment, PTT, the largest Taiwan-based BBS forum, was selected. PTT has many boards that cover a multitude of topics, and many articles and comments are posted each day. According to the report in 2014 by the Market Intelligence & Consulting Institute [4], most users prefer to use multimedia to share information, followed by Taiwanese users who often use online forums. Among them, PTT is one of the network forums in Taiwan [25]. Therefore, this article chose PTT–Tainan Board as the scope of this research data and flooding disaster information for the event goals. Based on a textual social networking service, we use PTT community data because of its popularity and quantity of data, and it represents local social media.
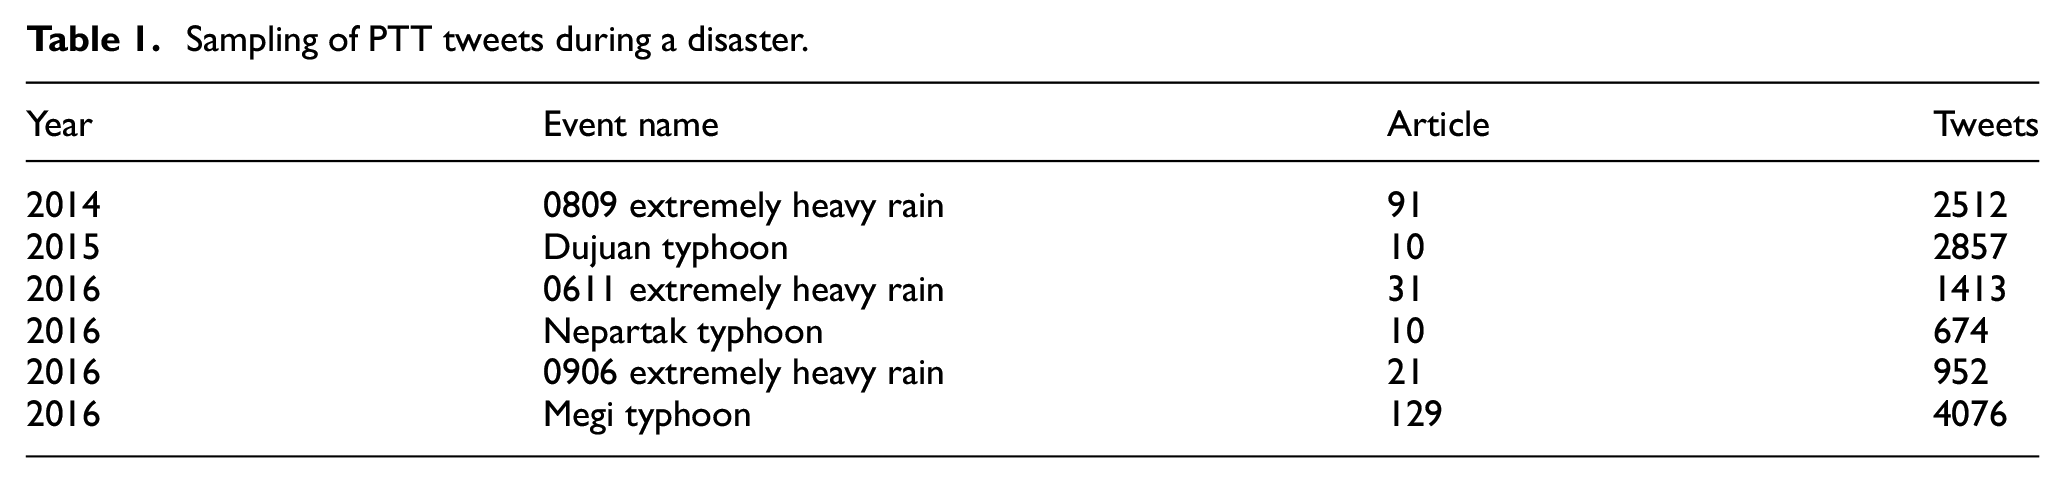
This article analysed six events of typhoon disaster information from a total collection of 292 articles and 12,484 tweets (see Table 1). The data collection was accomplished using the Python web crawler from the Taiwan social media PTT Tainan Board. Tweets were collected based on the flood theme mentioned in the title or tweet.
Sampling of PTT tweets during a disaster.
PTT does not have the geographic location (i.e. geotag) and hashtags (i.e. keywords preceded by #). This research collected a transportation road network digital atlas from the Ministry of Transportation and Communications (MOTC) to identify flooding roads (see Figure 6). Each tweet contains the time, content, subject, URL and user information tweet when the tweet was created, as shown in Figure 7. The official disaster event is referred to as the National Fire Agency of Taiwan’s Ministry of the Interior for EMIC datasets, with which people can post notification content about flooding disasters during events. The EMIC datasets had a total collection of 3598 flooding disaster notifications (see Table 2). Recall, precision and the F-measure are used to evaluate the reliability of the system


where tp is the true positive, fp is the false positive, tn is the true negative and fn is the false negative.
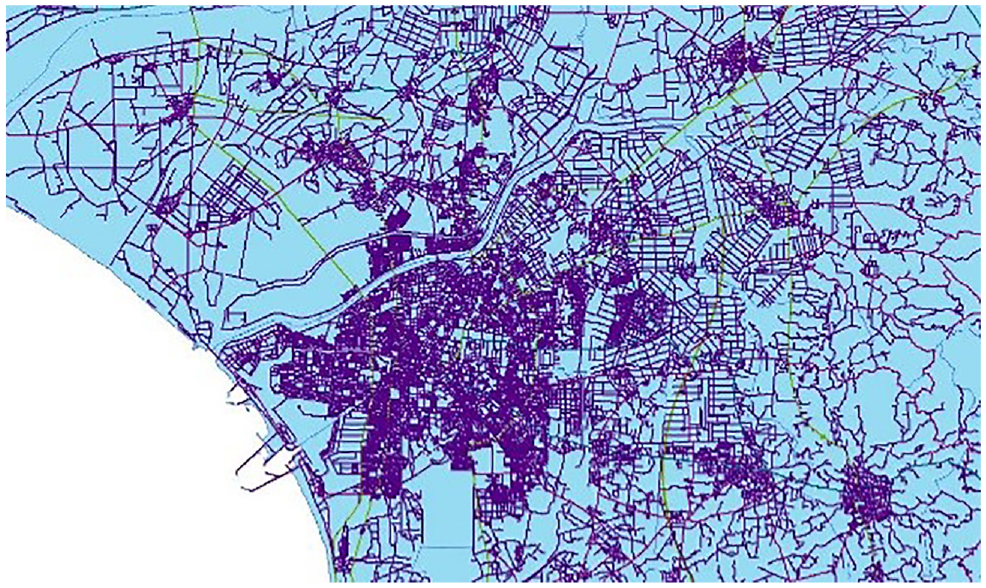
Tainan transportation road network.
Tainan flooding disaster article and tweet of PTT (resource: https://www.ptt.cc).
EMIC flooding disasters notification.

4.2. Flood disaster prediction based on keyword frequencies
In this research, we prepared 3598 flooding disaster notification positive examples that report flooding occurrences as a training set. This part extracts the candidate terms. It must choose the most appropriate term for the flood disaster area, and it is important to sort it. For this purpose, this research selected TF measures to perform the ranking. In addition to using the flooding feature dataset, this section combines flooding disasters with the geoparsing of locations in Tainan, as shown in Figure 8. Figure 9 shows and compares the extraction results of the candidate terms with the best ranking measurements.
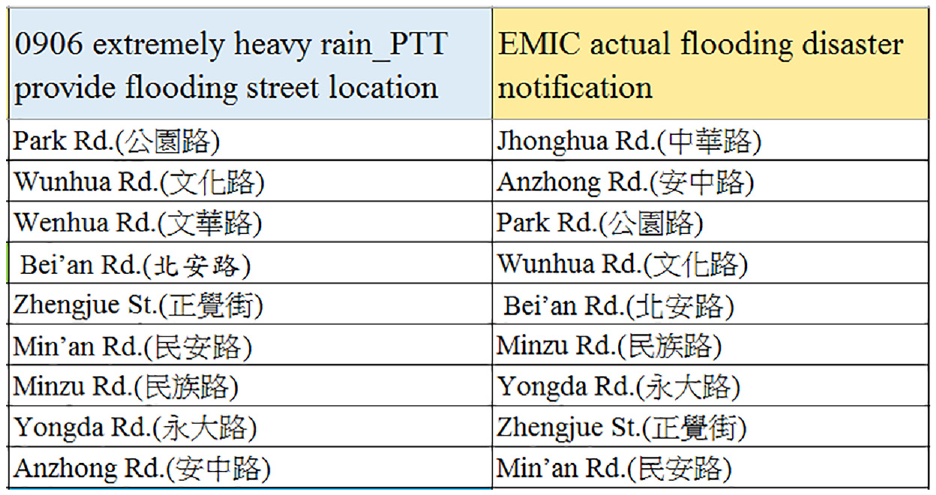
PTT dataset of flooding location information for at-flood areas and EMIC actual flooding disaster notification. The words are written in Chinese.
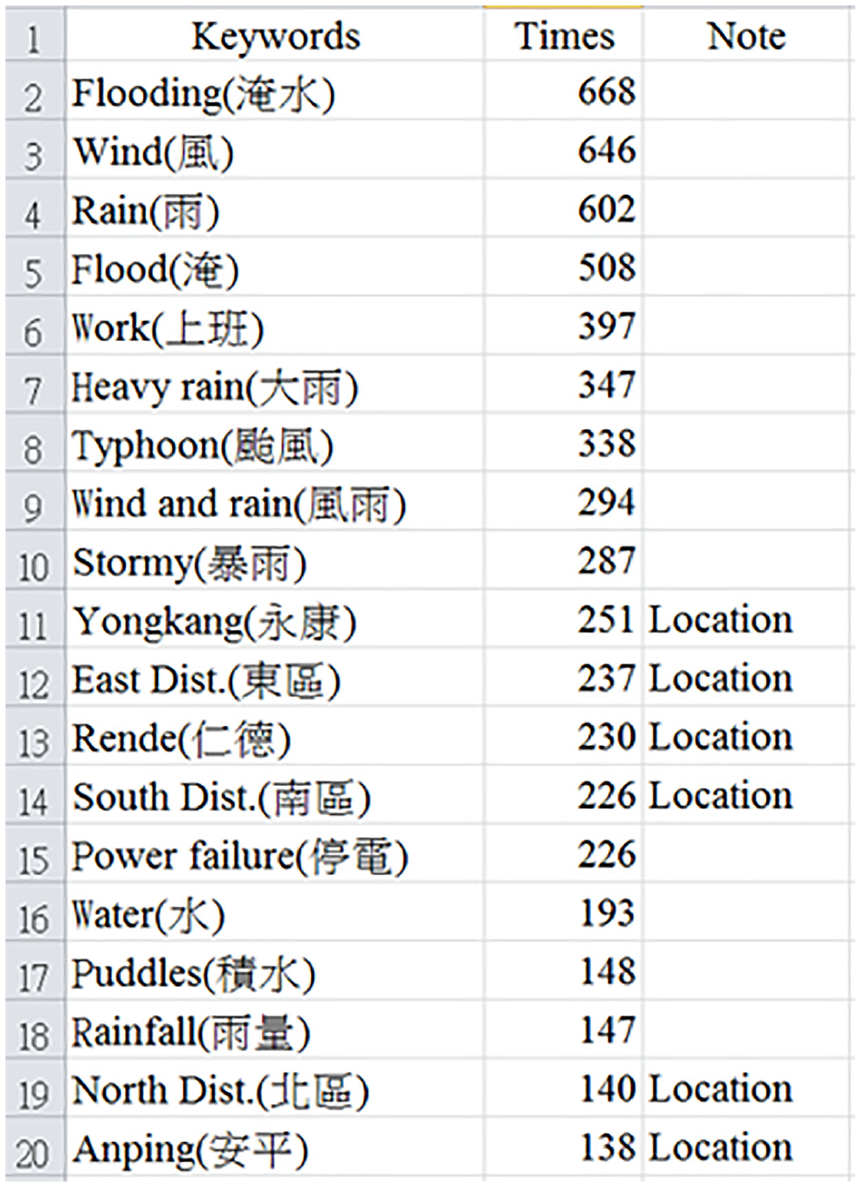
Keyword set.
To ensure the keyword dataset availability, this article verified the experiments of Typhoon Megi and the 0906 example of extremely heavy rain, and the results of the experiments are shown in Figures 10 and 11.
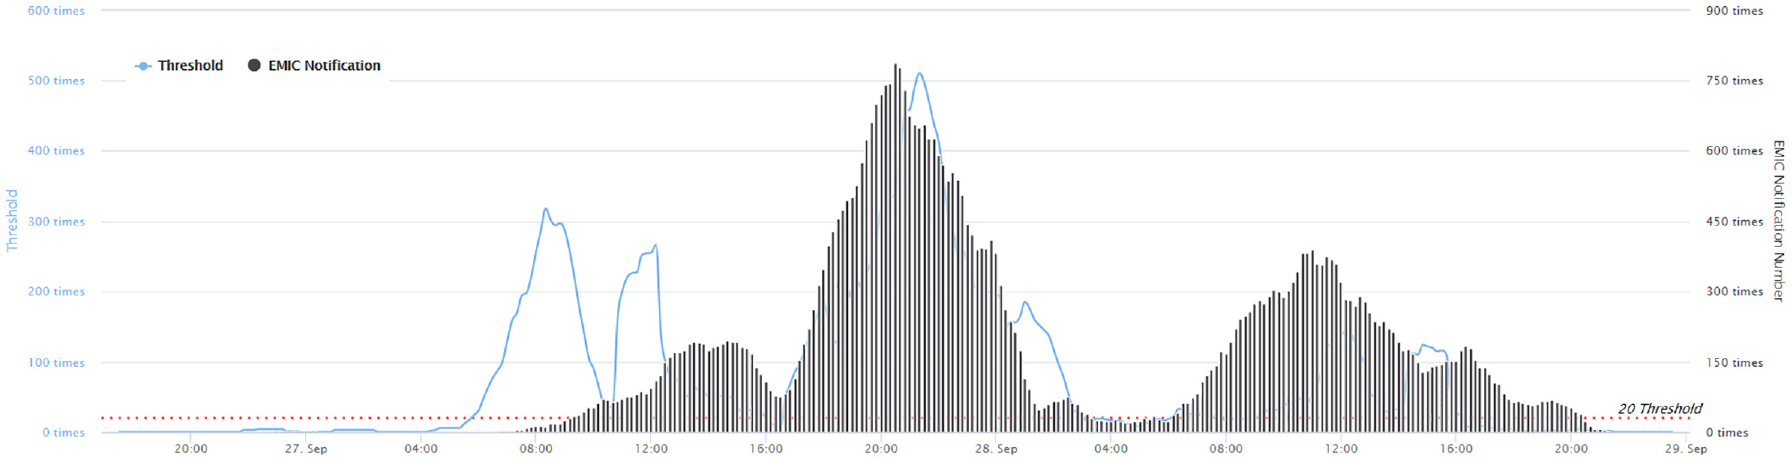
Typhoon Megi in 2016. The figure shows the number of keywords and the actual flooding disaster notification of the disaster statistics.
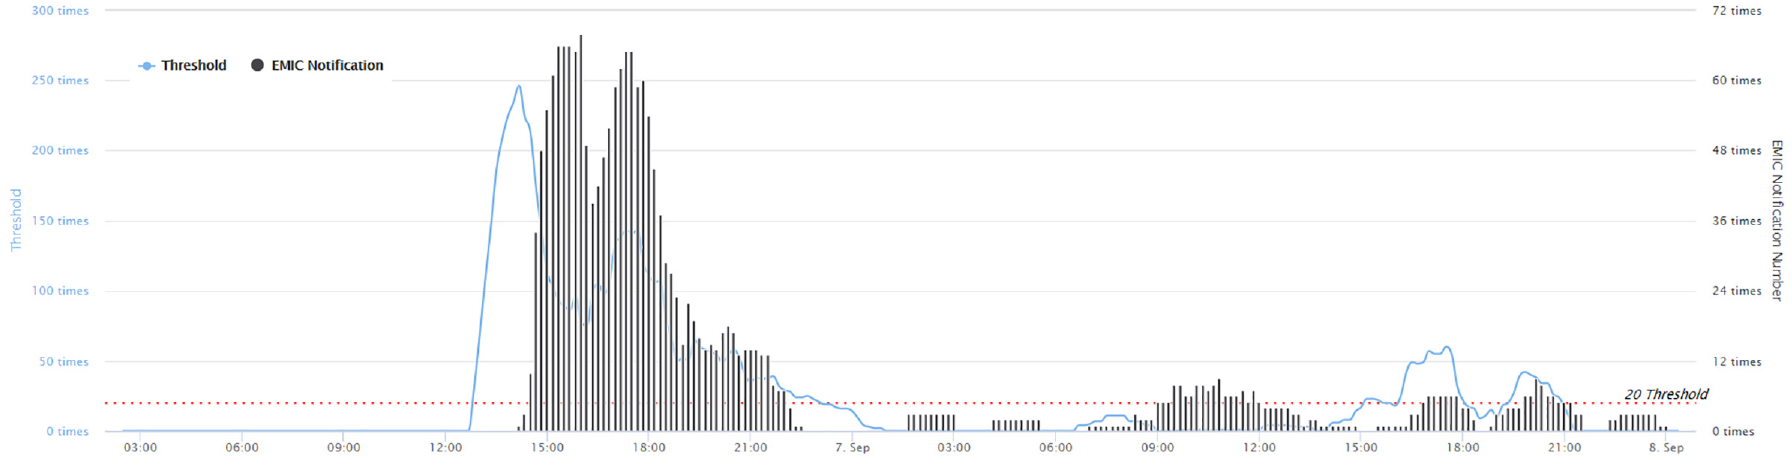
Example 0906 of extremely heavy rain in 2016. The figure shows the number of keywords and the actual flooding disaster notifications of the disaster statistics.
The results show that the keywords had almost zero occurrences before the flooding disasters occurred. When this article found that the number of keywords increased faster, it was observed that there was an actual disaster notification to EMIC in the next 2–3 h.
4.3. Evaluation results of the flood disaster warning
In this section, by comparing and analysing the pattern generation results for each window size, better metrics are identified and suggested thresholds are proposed.
We calculate different cases for each flooding location and sliding window separately so that we can calculate the threshold level of the tweet. We calculate accuracy, recall and F-measure through parameters such as the sliding gap (e.g. 10 min) and the time window size (e.g. 30 min).
In this experiment, to analyse flooding disasters and flooding roads for different cases, we evaluated the relationship of the time interval (time interval) and sliding window size (window size) for the precision, recall and F-measure, with a time interval of 10 min and different threshold levels of 30, 60 and 90 min, in the flooding disaster notification.
According to the feature data on the five flooding events, the flooding disasters evaluated by the precision, recall and F-measure are shown in Figure 12.

Flooding disasters evaluated by of metrics in the next 30, 60 and 90 min.
In the network tweet crawl from PTT, to assess the accuracy of the location of the flooded street from the PTT users, we compare the city street data with the EMIC notification street to obtain the tweet dataset of the disaster area in Tainan. We evaluate the flooding roads for precision, recall and F-measure, as shown in Figure 13.

Flooding roads with metrics in the next 30, 60 and 90 min.
According to the results of the accidents shown in Figure 12, we found that in the three window size analysis results, when the window size is 90 min, the threshold increases to 20, and the F-measure shows an increasing trend (better). This combination obtains the best F-measure value. In the next section, this research uses a window size of 90 min and a threshold of 20 parameters for the case study.
4.4. Case study
In this section, the above parameters derived from through actual cases are used, to assess more information on disaster relief through the PTT community media information. The event studied was Typhoon Megi (September 2016), which caused major flooding in Tainan. For the Tainan flooding event, this article applied the sliding window approach with a sample window of 30, 60 and 90 min and a sampling rate of 10 min. The tweet dataset contained 4076 tweets, of which 161 mentioned streets. Our Tainan location database has 2040 streets available for matching.
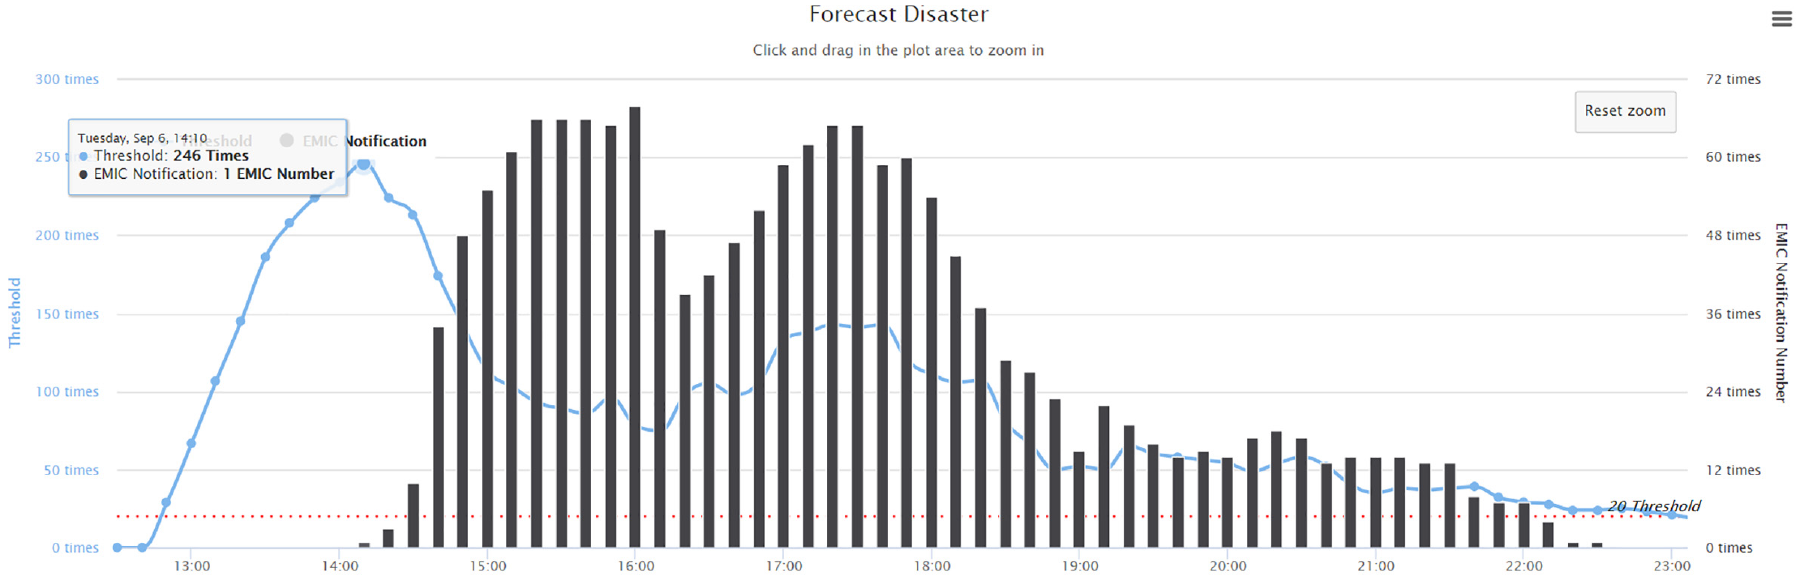
This research compared each flooding disaster with actual disaster notifications from the official EMIC by the National Fire Agency. Figure 14 shows the threshold and number of disaster road times for effective prediction. Most flood disaster messages occur where tweets occur, and some flood hazard notifications also occur at EMIC.
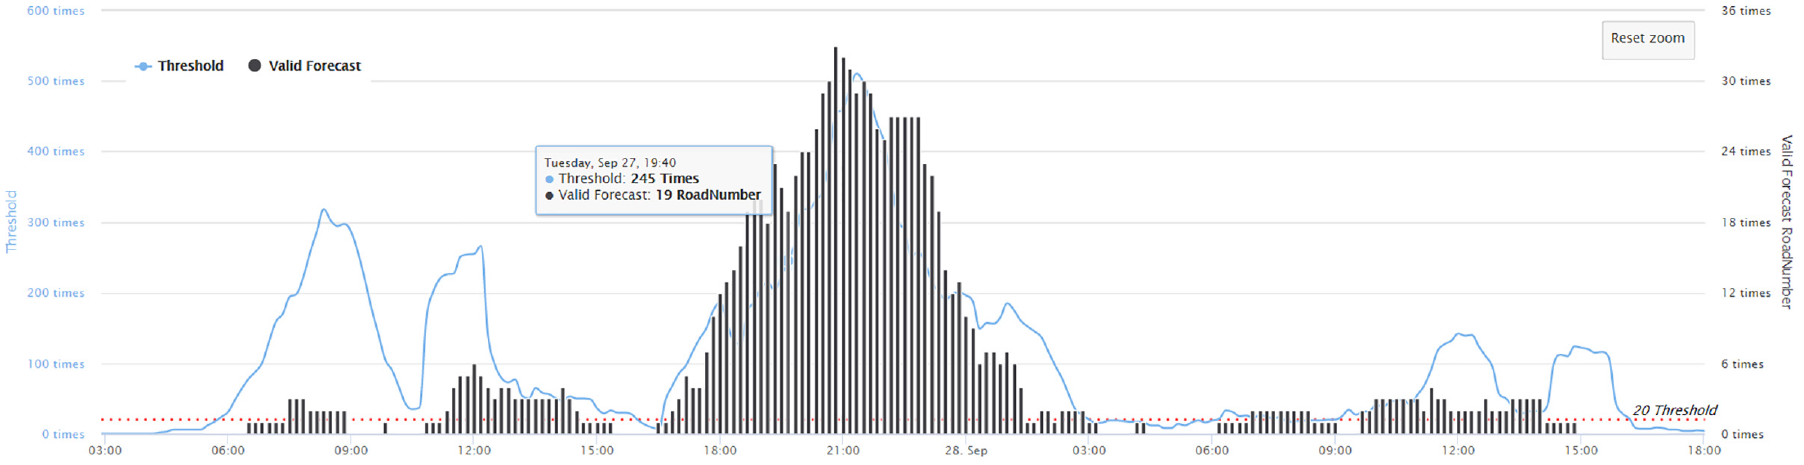
Typhoon Megi in 2016. The figure shows the threshold and number of disaster road times for effective prediction.
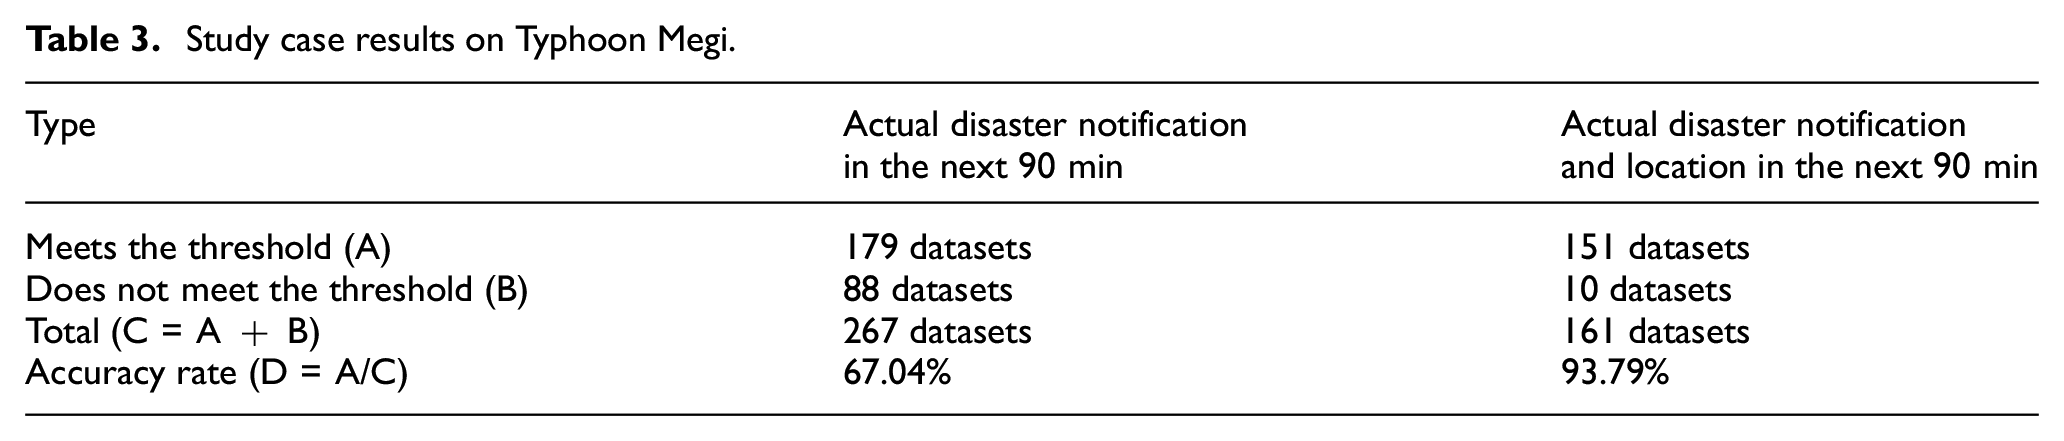
Experimental results show that 50 alarm areas that received warnings by the system did not receive reports in the official system, but 161 appeared on the official reports. Table 3 presents the results of meeting the threshold value for the actual disaster notification and actual disaster location in the next 90 min. Compared with the official report, the accuracy rates are 67.04% and 93.79%. Based on the experimental results, we show that the PTT Tainan Board provided reliability for the information. The case results show that high-precision (90% or higher) geographic areas (flooding locations) can be obtained from real-time PTT data in combination with existing urban road data and flood zone information. The results show that severely flooded areas have more posts about floods.
Study case results on Typhoon Megi.
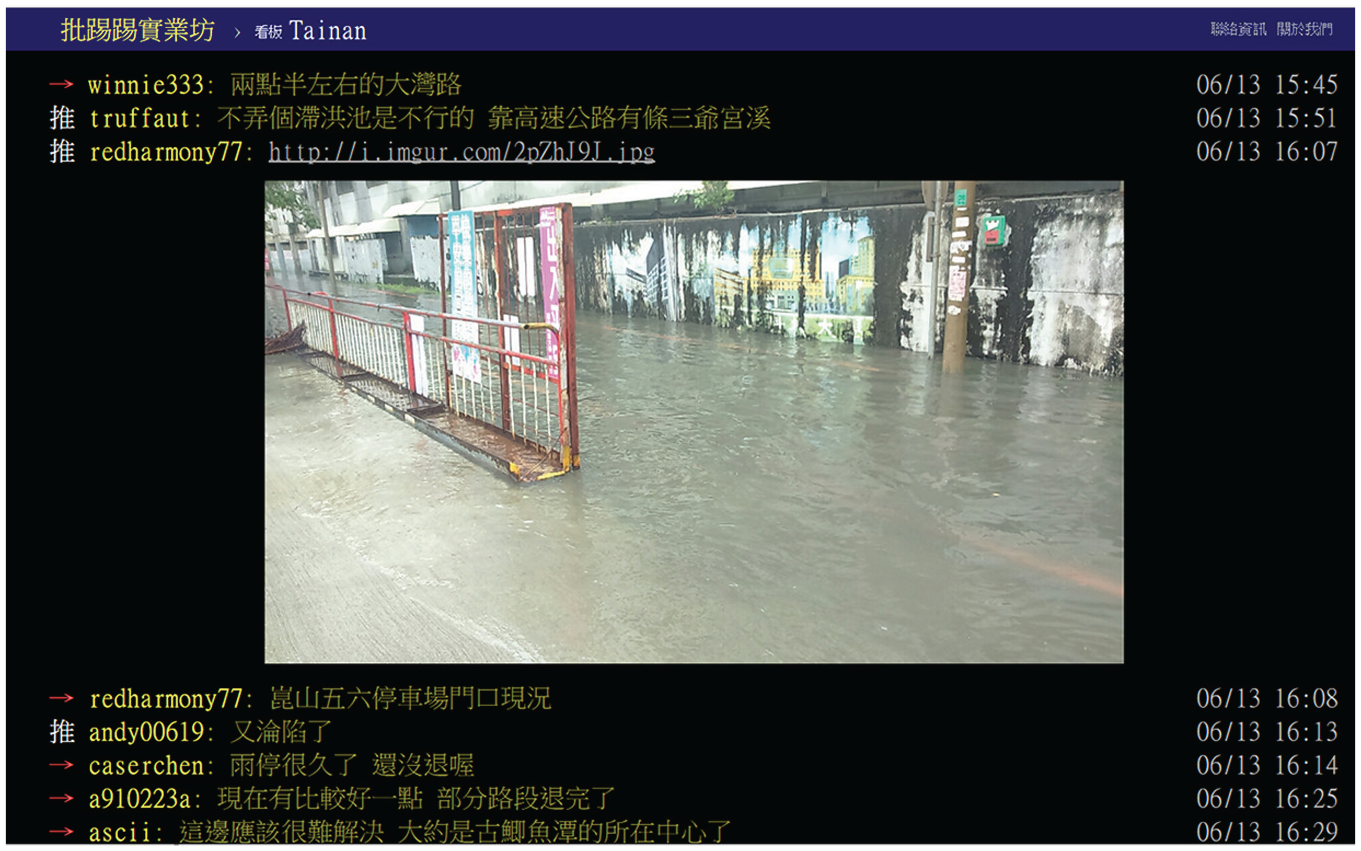
Examining the tweet volumes over time highlighted important trends. Figure 14 shows that the disaster notification trend contributed to the increase in volume, while there was an increase in keyword statistics from 18:10 to 19:40. The keyword frequency increased by up to 245 times. The experimental results show that a disaster alert occurred on 27 September 2016 at 18:10:00. In fact, the social media PTT Tainan Board information shows that the Tainan City Anping District canal river overflowed at 19:49:56 (see Figure 15), but the Anping District canal overflow on the official report was recorded at 21:22:27 from EMIC. This finding means that the proposed system automatically captured the disaster location and can be used as a warning system.
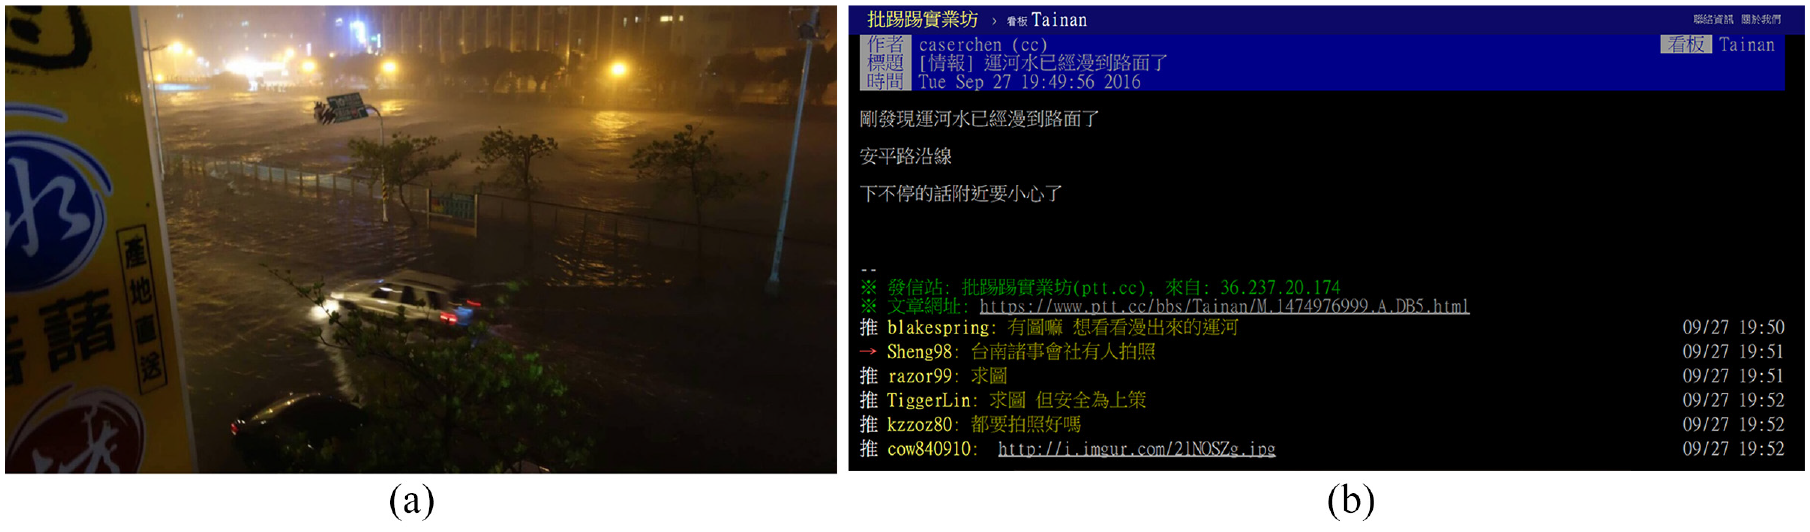
Typhoon Megi in 2016: (a) social media flooding pictures and (b) PTT Tainan Board of flooding information (data resource: PTT).
5. Discussion
When applying this method, it is important to consider where the flood disaster occurs because the number of people who publish information about the disaster area is directly related to accuracy. This research selected Tainan as the target area because Taiwan has the highest economic exposure to natural hazards. This article adopted the local popular social media PTT as the object of data collection, and we determined the relevance of the actual disaster situation from plain text messages released by the official government.
This method can extract useful information that helps provide such information to relevant disaster relief personnel in flood disasters. The results show that our arguments are acceptable. This research uses official geographical data, which allowed us to identify streets that could be flooded.
In this study, we used EMIC dataset verification on flooding from social media PTT text messages. Figure 8 shows the results of the representative keyword set on flooding disasters. In this study, we collected PTT messages that only involved flood disasters, and not any other natural disasters. The entire collection of tweets during the flooding event period was used for comparison with the EMIC data. This study did not consider the degree of flooding or other factors. For further work, the strength of the disaster could be considered using opinion mining.
According to the statistics on the five flooding events, the highest average F-values were 0.315, 0.257 and 0.126 for geoparsing of the flooding locations, using different window sizes. The highest average F-value was 0.315 under a window size of 90 min with a TF threshold of 20 times. Therefore, we suggest that the recommended threshold could be 20 times and the window size 90 min.
According to Section 4.3 on the experimental results, this article found that the F-measure increases when the window size increases (the larger the size of the sliding window, the better the performance). This research used the same time interval and different window sizes for the conditions, and the metrics had significant differences for the precision, recall and F-measure for the flood disaster and flood road experiments (see Figures 11 and 13). Based on the experimental results, the disaster road experiment had a relatively high accuracy rate result. The flooding road information provided by the PTT social media was a reliable source for the information.
In summary, this study revealed that (1) community data can be used for natural disaster early warnings; (2) the system can automatically capture disaster locations; and (3) the official notification is approximately 30 min later than that identified by the public. In other words, this discovery helps the government improve the efficiency of disaster relief. Moreover, social media makes information dissemination faster, less expensive and more convenient. This also brings disadvantages such as fake news produced by social media users [31]. The convenience of social media to spread information has led to the prevalence of fake news. Many studies have been conducted on the application of fake news prediction [37] and detection [31,38], in which the main goal is to prevent fake news from having a significant impact on society. False phenomena spread farther, faster, deeper and more broadly than the truth, and such influences are more obvious for false political news [39]. In particular, social media (i.e., Facebook and Twitter) is an important channel for fake news websites [40]. The reliability of community information and the acceptance of information by government agencies can thus become challenged. Therefore, this study assumes that there is no falsified information.
6. Conclusion
Based on the observations in the experiments, this study revealed that social media trends can be used as an alert to disasters earlier than the official communication channel. In this research, a warning mechanism was established by text mining [41]. However, an ever-increasing number of politicians often act as spokespersons for the occurrence and development of disasters [42]. Fake news is also becoming increasingly popular, which may damage the credibility of information [40]. Many studies [31,37,38] have discussed and analysed the reliability of social media data (such as filtering or detecting fake news). However, this research does not currently address this type of information. In the future, we can build a predictive fake news model [37] or promote misinformation containment policies [39] by referring to more social information (such as online photos and videos) to improve the reliability of information.
Footnotes
Declaration of conflicting interests
The author(s) declared no potential conflicts of interest with respect to the research, authorship and/or publication of this article.
Funding
The author(s) disclosed receipt of the following financial support for the research, authorship and/or publication of this article: The research is based on work supported by the Taiwan Ministry of Science and Technology under Grant No. MOST 107- 2410-H-006 040-MY3 and MOST 108-2511-H-0 06-0 09. We would like to thank the Center of Innovative Fintech Business Models, Taiwan for a research grant to support this research.