



Abstract
The article demonstrates that: (i) the main countries of East Africa (Uganda, Kenya, and Tanzania) have not escaped the Malthusian trap yet, (ii) these countries are not likely to follow the “North African path” and are likely to encounter serious social problems before they achieve success in making a transition in their fertility rates, and (iii) East Africa is unlikely to achieve this escape if it does not follow the “Bangladeshi path” and will not achieve substantial fertility declines in the foreseeable future. The Bangladeshi path implies the introduction of compulsory universal secondary education, serious family planning programs, and a rise in the legal age for marriage with parental consent. Such measures should of course be accompanied by the substantial increases in agricultural labor productivity concomitant with a decline in the percentage of the population employed in agriculture.
Introduction
The so-called Malthusian trap 1 is typical for preindustrial societies in situations when the growth in production output (usually accompanied by demographic growth) does not also produce a positive long-range expectation for significant increases in per capita output. Attendant to such per capita increases is the expectation of improvements in the living conditions of the majority of a nation’s population, which, in the African context, remains close to the basic survival levels (see, e.g., Artzrouni & Komlos, 1985; Clark, 2007; Conley, McCord, & Sachs, 2007; Kögel & Prskawetz, 2001; Komlos & Artzrouni, 1990; Korotayev & Khaltourina, 2006; Korotayev, Malkov, & Khaltourina, 2006b; Korotayev et al., 2011; Korotayev, Malkov, & Grinin, 2014; Malthus, 1978 [1798]; Steinmann & Komlos, 1988; Steinmann, Prskawetz, & Feichtinger, 1998; Wood, 1998).
In complex preindustrial societies, the Malthusian trap was one of the main generators of state breakdowns and sociopolitical collapse. Such collapses were frequently accompanied with millions of deaths (see, e.g., Chu & Lee, 1994; Korotayev & Khaltourina, 2006; Korotayev, Malkov, & Khaltourina, 2006b; Korotayev et al., 2011; Korotayev, Malkov, & Grinin, 2014; Nefedov, 2004; Turchin, 2003, 2005a, 2005b; Turchin & Korotayev, 2006; Turchin & Nefedov, 2009; Usher, 1989; van Kessel-Hagesteijn, 2009; for a recent case in East Africa, see André & Platteau, 1998). 2
With the global process of modernization, the increase in per capita productivity due to major technological advances secured the systematic excess of output growth rates over population growth rates, which allowed most societies to escape the Malthusian trap (see, e.g., Artzrouni & Komlos, 1985; Galor & Weil, 1999; Kögel & Prskawetz, 2001; Korotayev, Malkov, & Khaltourina, 2006a; Lucas, 1998; Pereira, 2006).
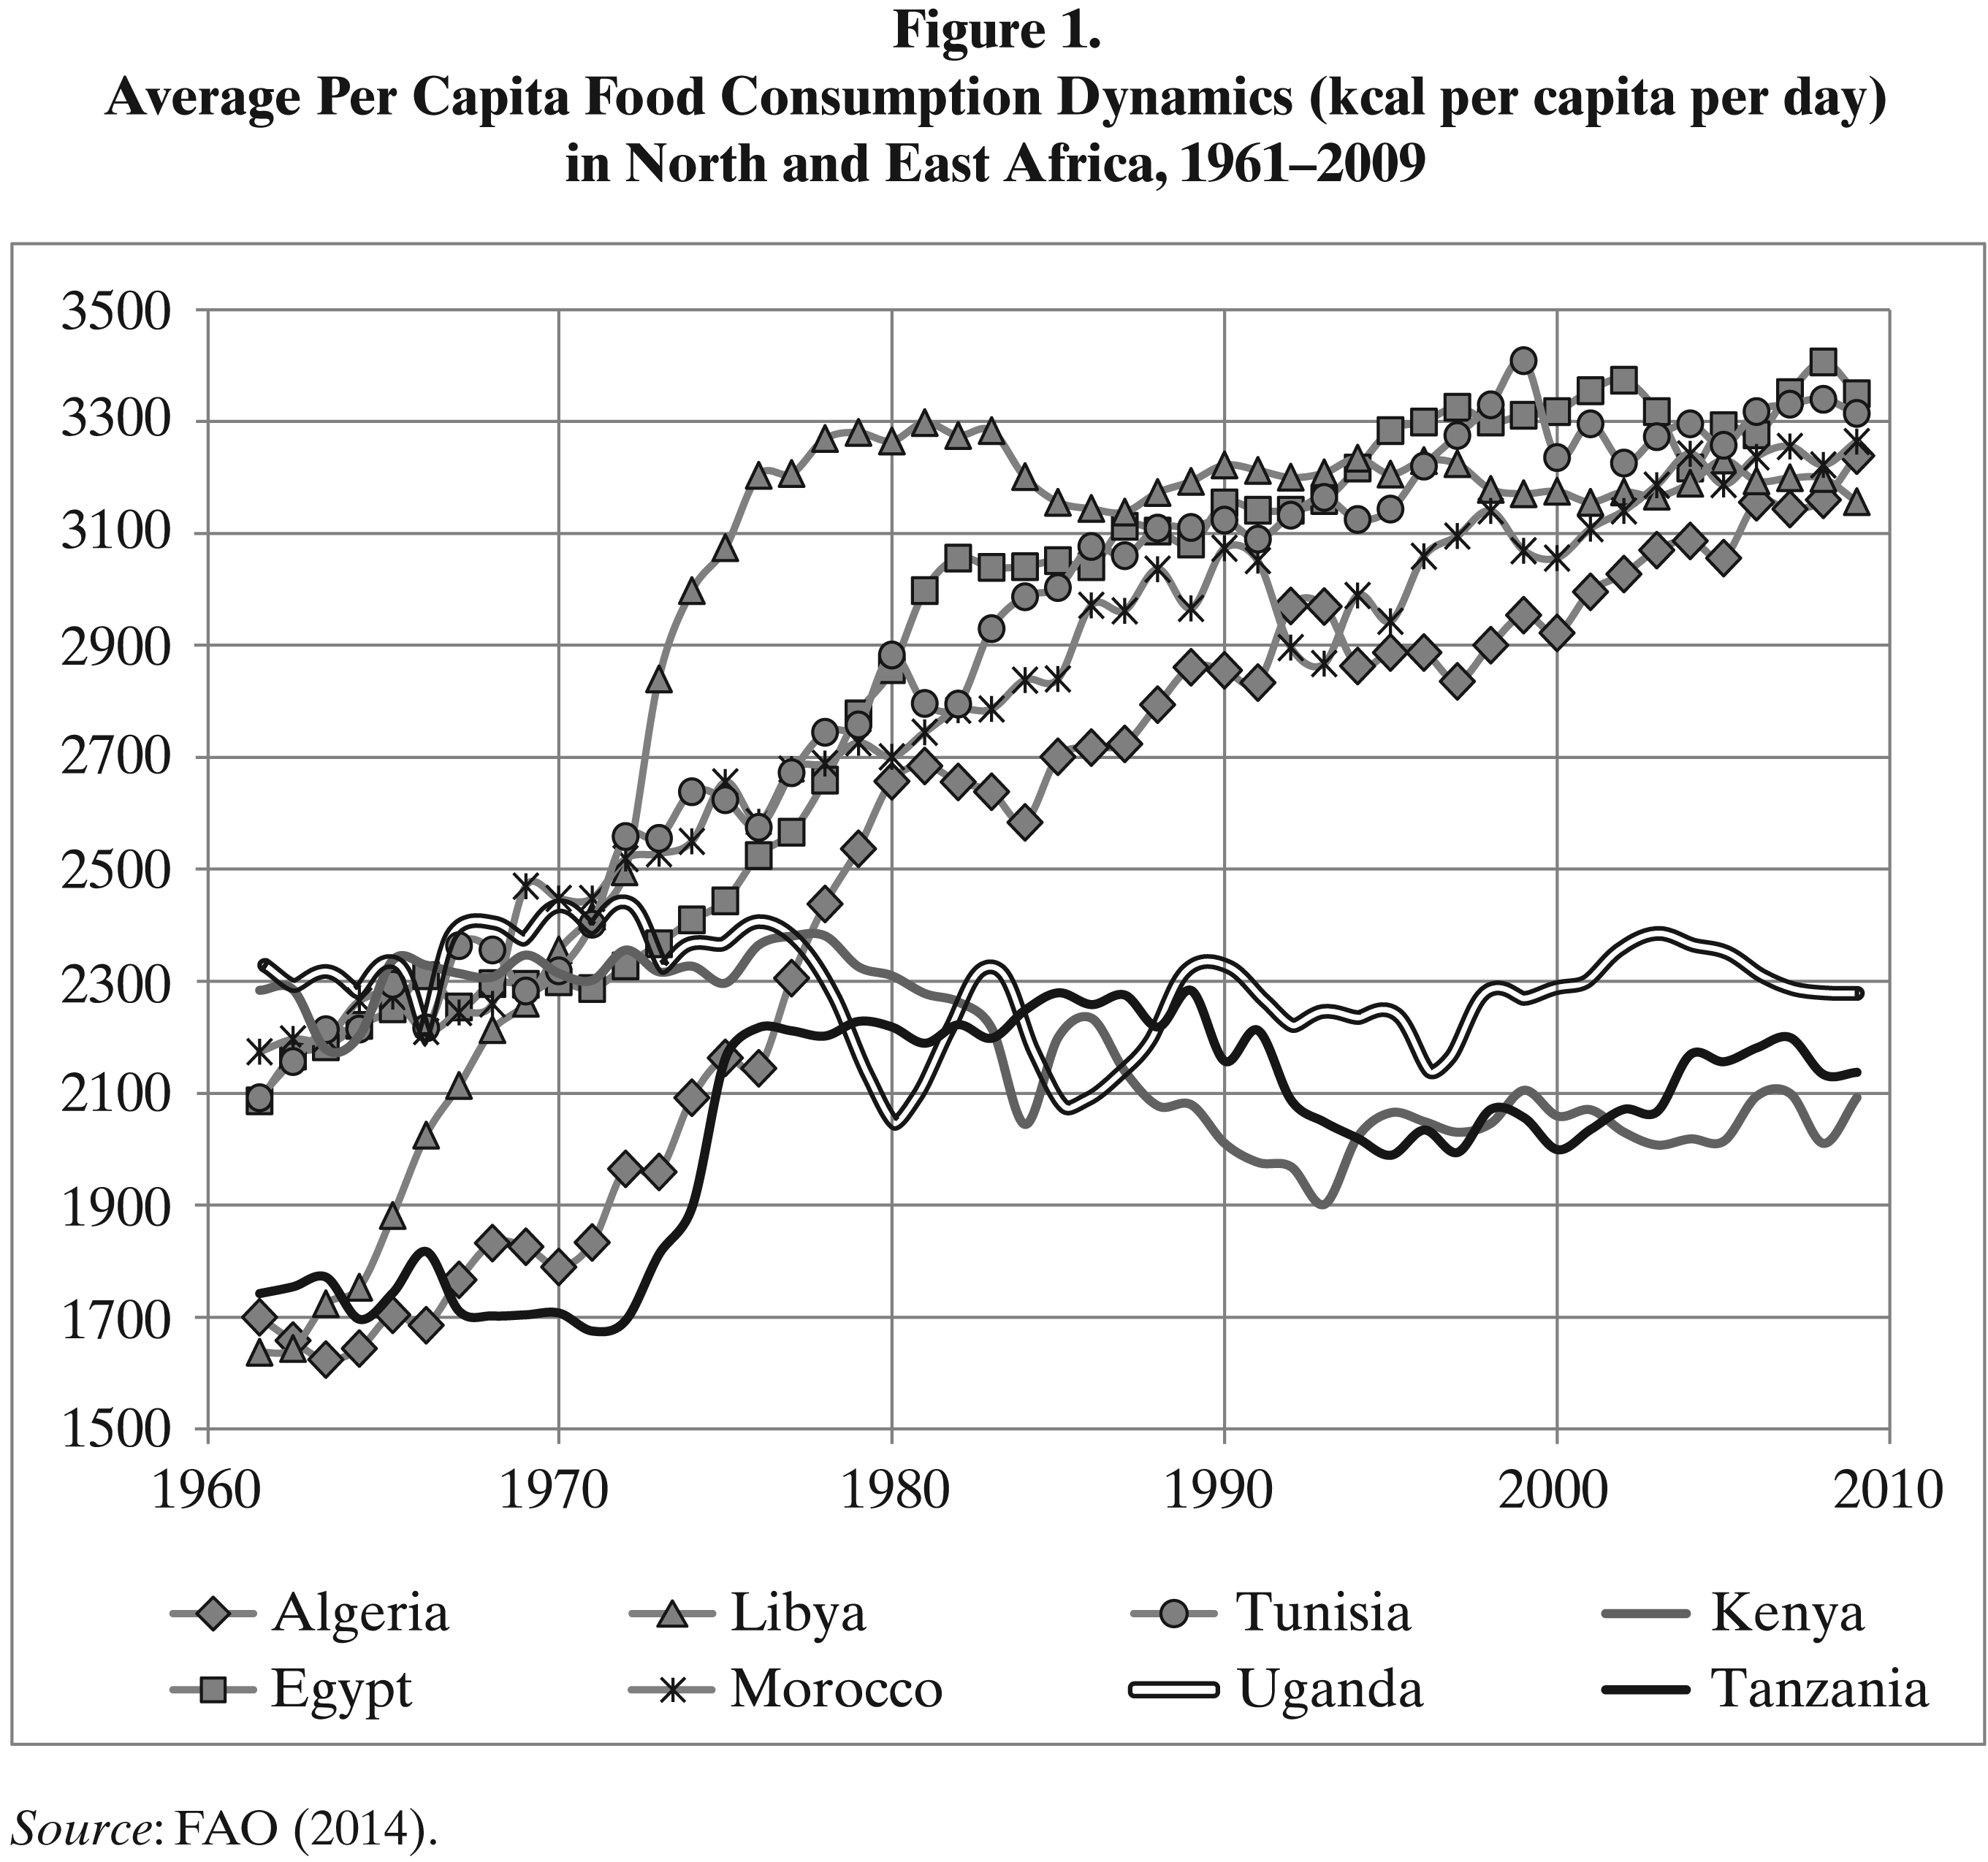
These modernization processes started later in Sub-Saharan Africa than in the rest of the world; even in the recent decades the Malthusian trap tended to produce state breakdowns in this region (see, e.g., André & Platteau, 1998). Further, some parts of Tropical Africa (primarily in East Africa) appear to be caught in the Malthusian trap to the present day. Kenny (2010) has expressed a contrary view but we will provide substantial data to prove that he is wrong. This situation is especially salient if we compare the long-term per capita food consumption rates of North Africa on the one hand, and the three main countries of East Africa (Kenya, Tanzania, and Uganda) on the other hand (see Figure 1).
The World Health Organization (WHO) recommended norm of daily per capita calorie consumption is generally between 2,300 and 2,400 kcal (Naiken, 2002), with 2,100 kcal considered to be the minimum daily requirement (FAO, 2009, p. 24; Joint FAO/WHO/UNU Expert Consultation, 1985). Note also that according to Clark (2007), the average per capita calorie intake of about 2,300 kcal/person/day or less is typical for those social systems that have not escaped the Malthusian trap. Around 1800 (at the dawn of the industrial age), such a level was observed in England and Belgium. That is at the time just before those countries started their escape from the Malthusian trap. According to Clark (2007, p. 50), the average kilocalorie consumption in Britain was 2,322 kcal and 2,248 kcal in Belgium. In the 1960s, all the countries of North and East Africa appear to have been in the Malthusian trap with the majority of their population remaining close to bare survival level. Consequently, as one would expect, there were serious problems of malnutrition in those countries. The situation was particularly bad in Libya, Tanzania, and Algeria, where the average per capita food consumption was even lower than the minimum daily requirement levels. It was somehow better in Kenya, Uganda, Egypt, Morocco, and Tunisia. 3 However, these countries could hardly be called free of the Malthusian trap. The average per capita food consumption was still below the recommended level and it was too close to the minimum daily requirement – which implied that a very substantial proportion of their respective populations consumed below minimal requirements. 4
Source: FAO (2014).
However, in the 1970s to early 1980s, all the countries of North Africa escaped the Malthusian trap rather successfully and now these countries struggle more against overeating problems than with problems of undernourishment. 5 This escape was due to the fact that during this period, all the countries of this region managed to achieve very high gross domestic product (GDP) growth rates which exceeded significantly the population growth rates. This then translated into personal gain as indicated by the very substantial increases in per capita GDP 6 (see Figure 2).

Source: Maddison (2010).
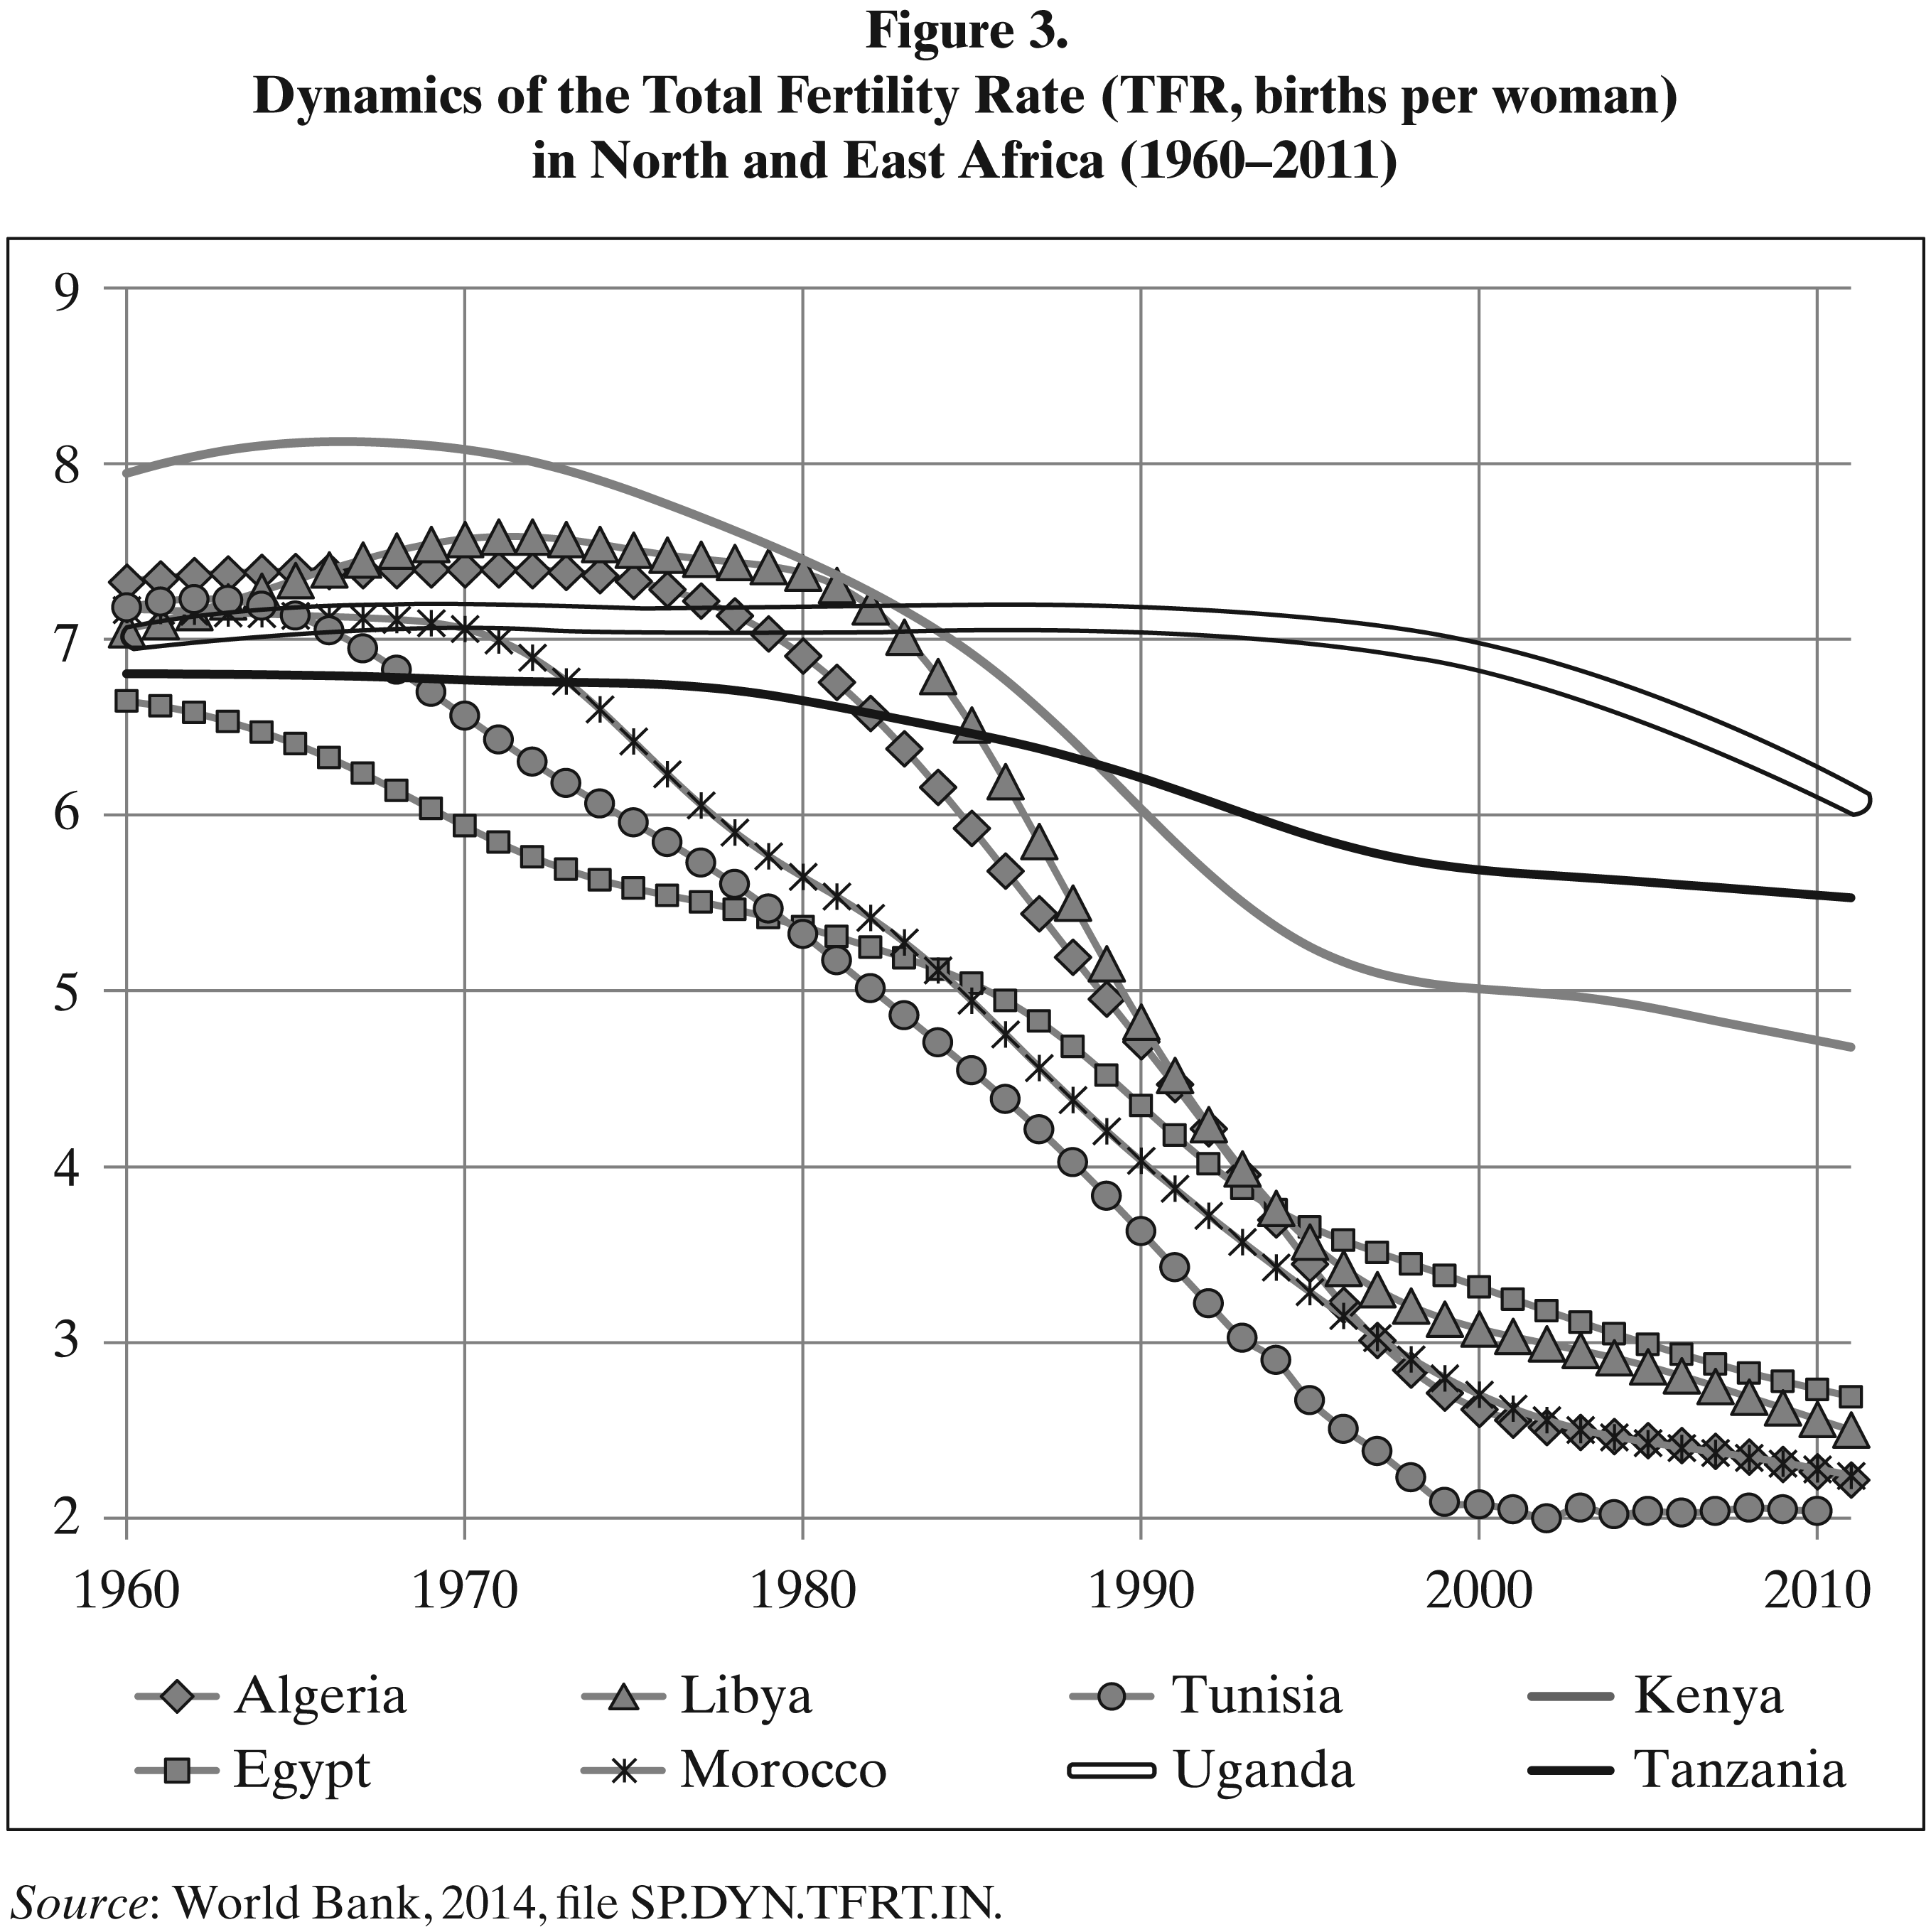
This escape was further supported by a decrease in the fertility rates (see Figure 3).
Source: World Bank, 2014, file SP.DYN.TFRT.IN.
As we see, in this respect, North Africa also stands in sharp contrast with East Africa, where the total fertility rate (TFR) remains very high.
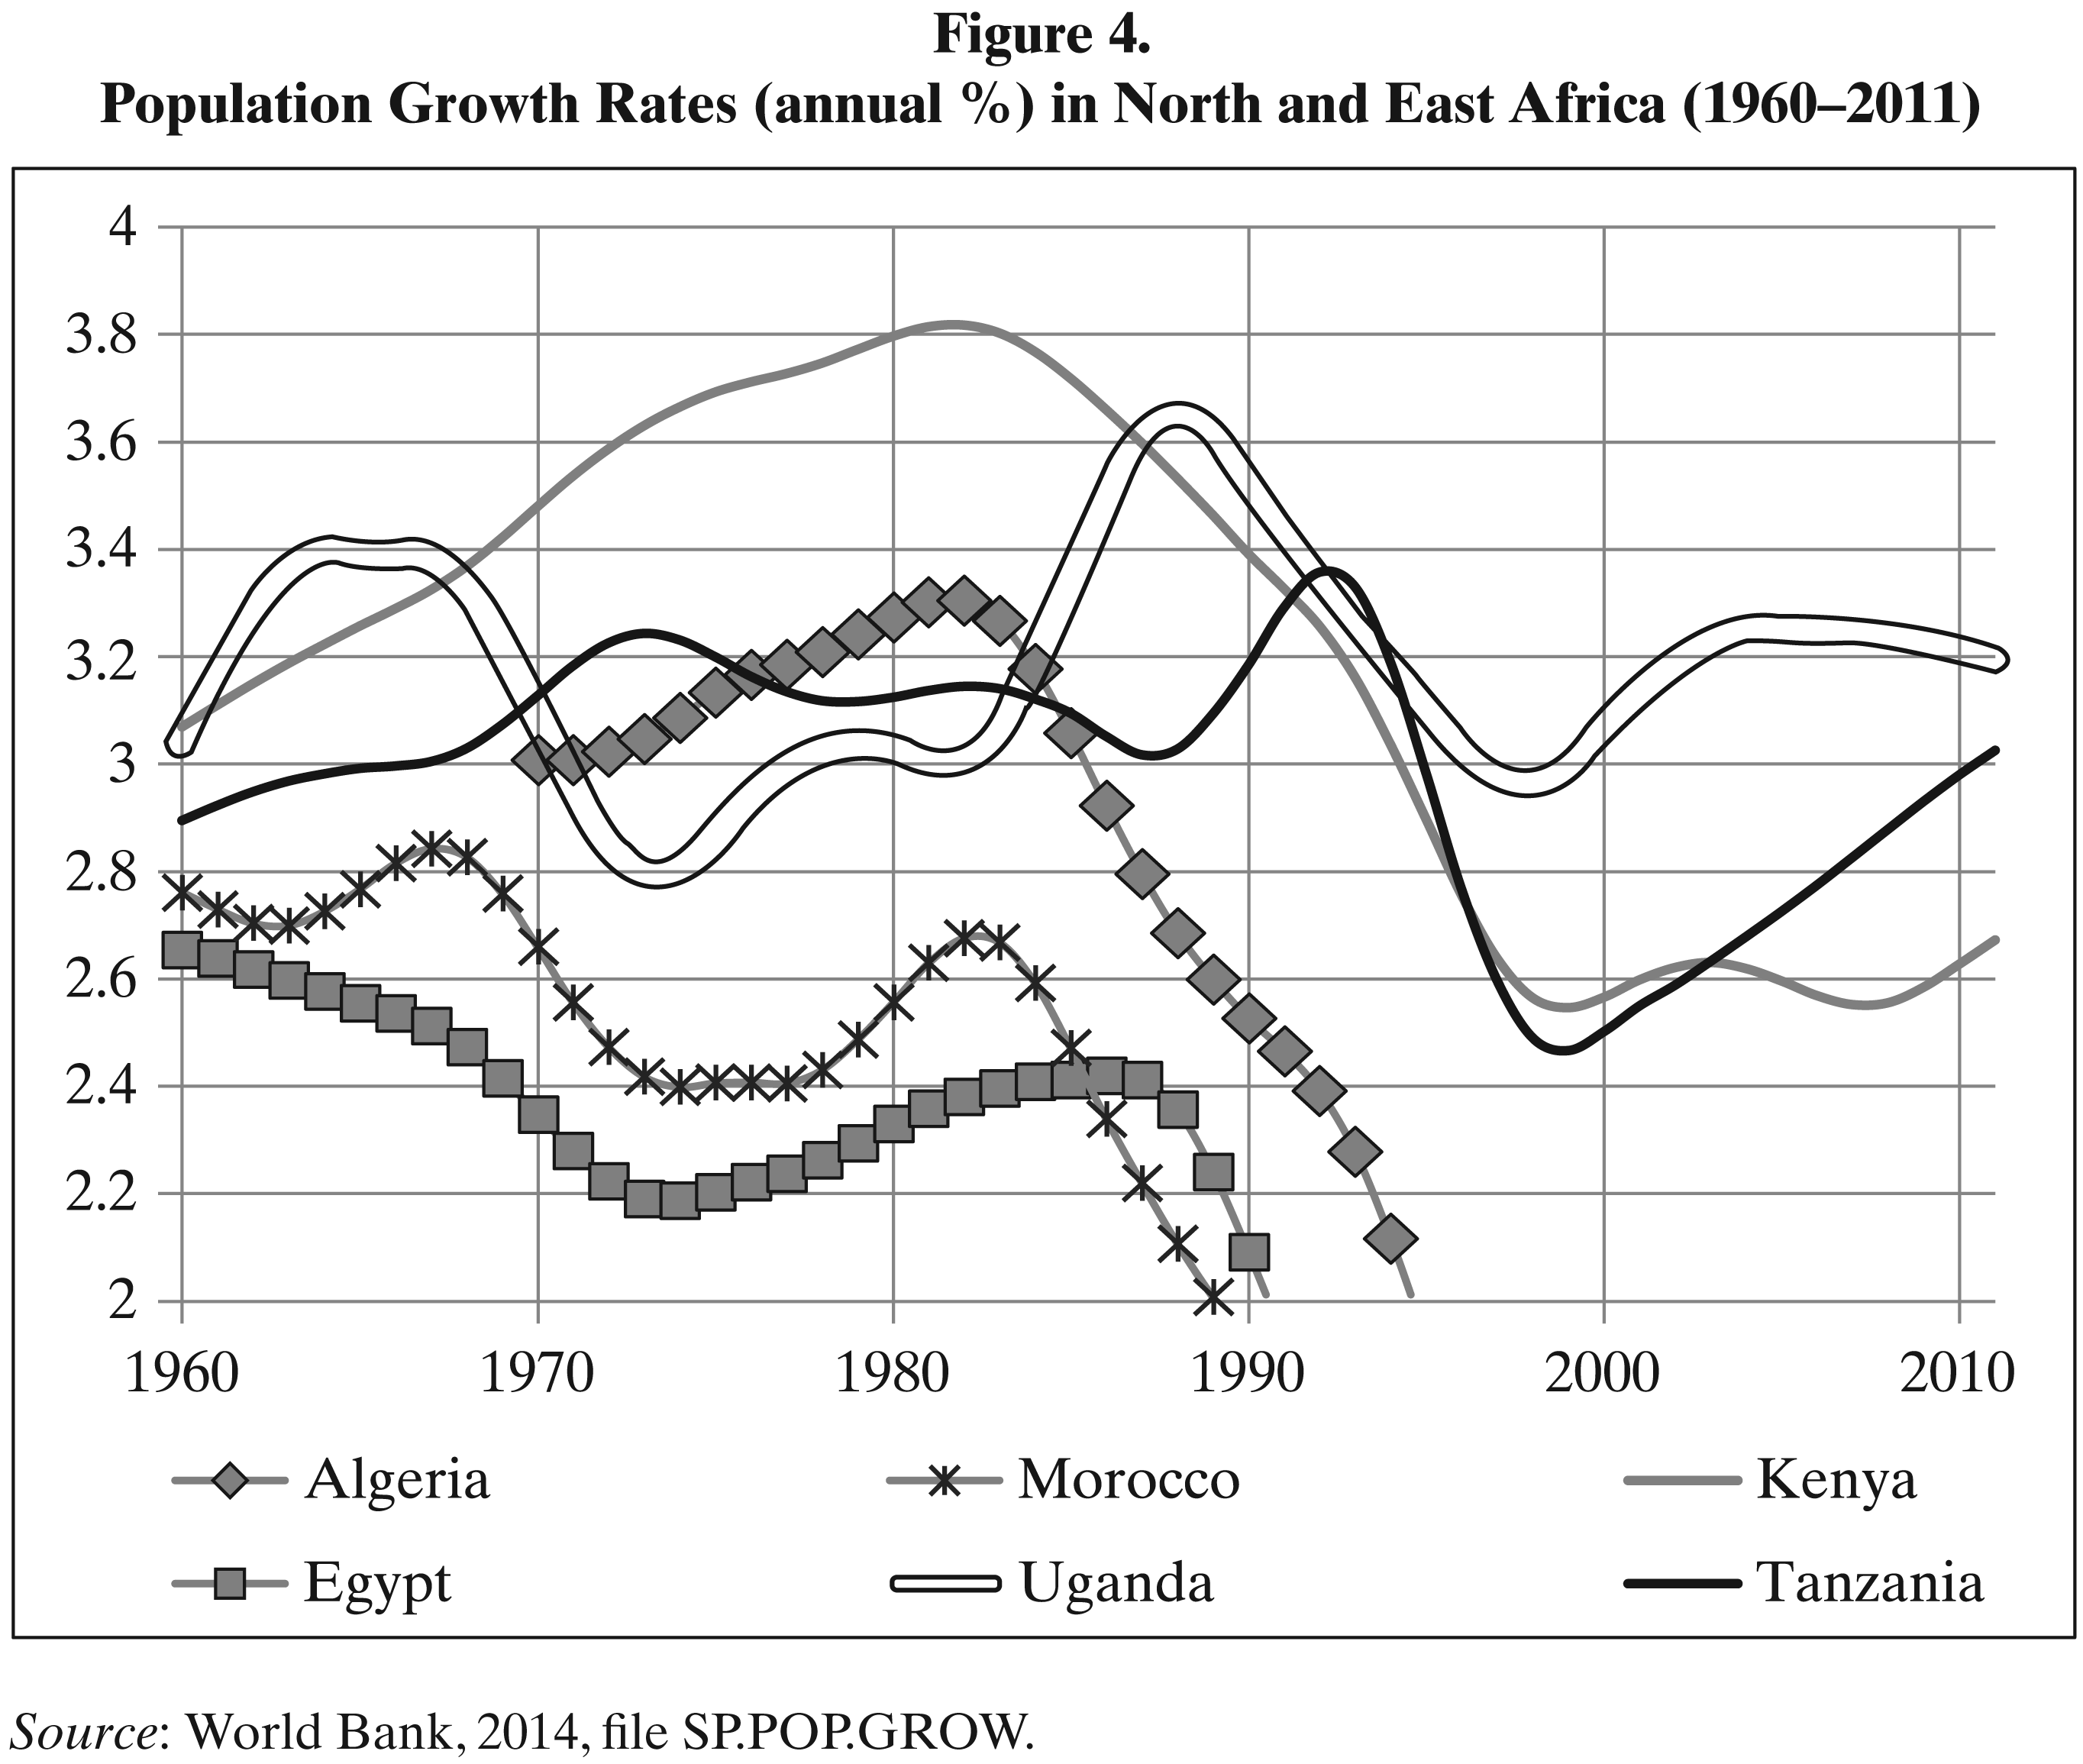
Of course, in recent decades the TFR somehow declined in East Africa too, but the extent of this decrease was rather small, and it was mostly compensated for by the decrease of the death rate (which was interrupted somehow by the human immunodeficiency virus (HIV)/acquired immune deficiency syndrome (AIDS) epidemic, but resumed its decline) (see, e.g., Bicego & Kichamu 1999; Bureau of Statistics [Tanzania] & Macro International Inc., 1997, pp. 97–104; Kaijuka et al., 1989, pp. 53–66; Kenya National Bureau of Statistics, 2010, pp. 103–112; Kichamu, 1999; Korotayev & Zinkina, 2014; Muindi & Bicego 1999; National Bureau of Statistics [Tanzania], 2000, pp. 85–92; 2005, pp. 123–130; 2011, pp. 117–126; National Council for Population and Development et al., 1989, pp. 55–72; 1994, pp. 83–92; Ngallaba et al., 1993, pp. 71–78; Opiyo, Omolo, & Imbwaga, 2010; Otieno & Omolo 2004; Shishkina et al., 2014; Statistics Department [Uganda] & Macro International Inc., 1996, pp. 97–104; Uganda Bureau of Statistics, 2001, pp. 97–108; 2007, pp. 109–118; 2012, pp. 98–104; World Bank, 2014, files SP.DYN.LE00.IN, SP.DYN.IMRT.IN, SH.DYN.MORT, SP.DYN.CDRT.IN; Zinkina & Korotayev, 2014a, 2014b). As a result, in a contrast with North Africa which observed a very significant decline of the population growth rates in the 1980s and 1990s, East African population growth rates remained mostly at such levels that were typical for North African countries before the start of the fertility decline in this part of the world (see Figure 4).
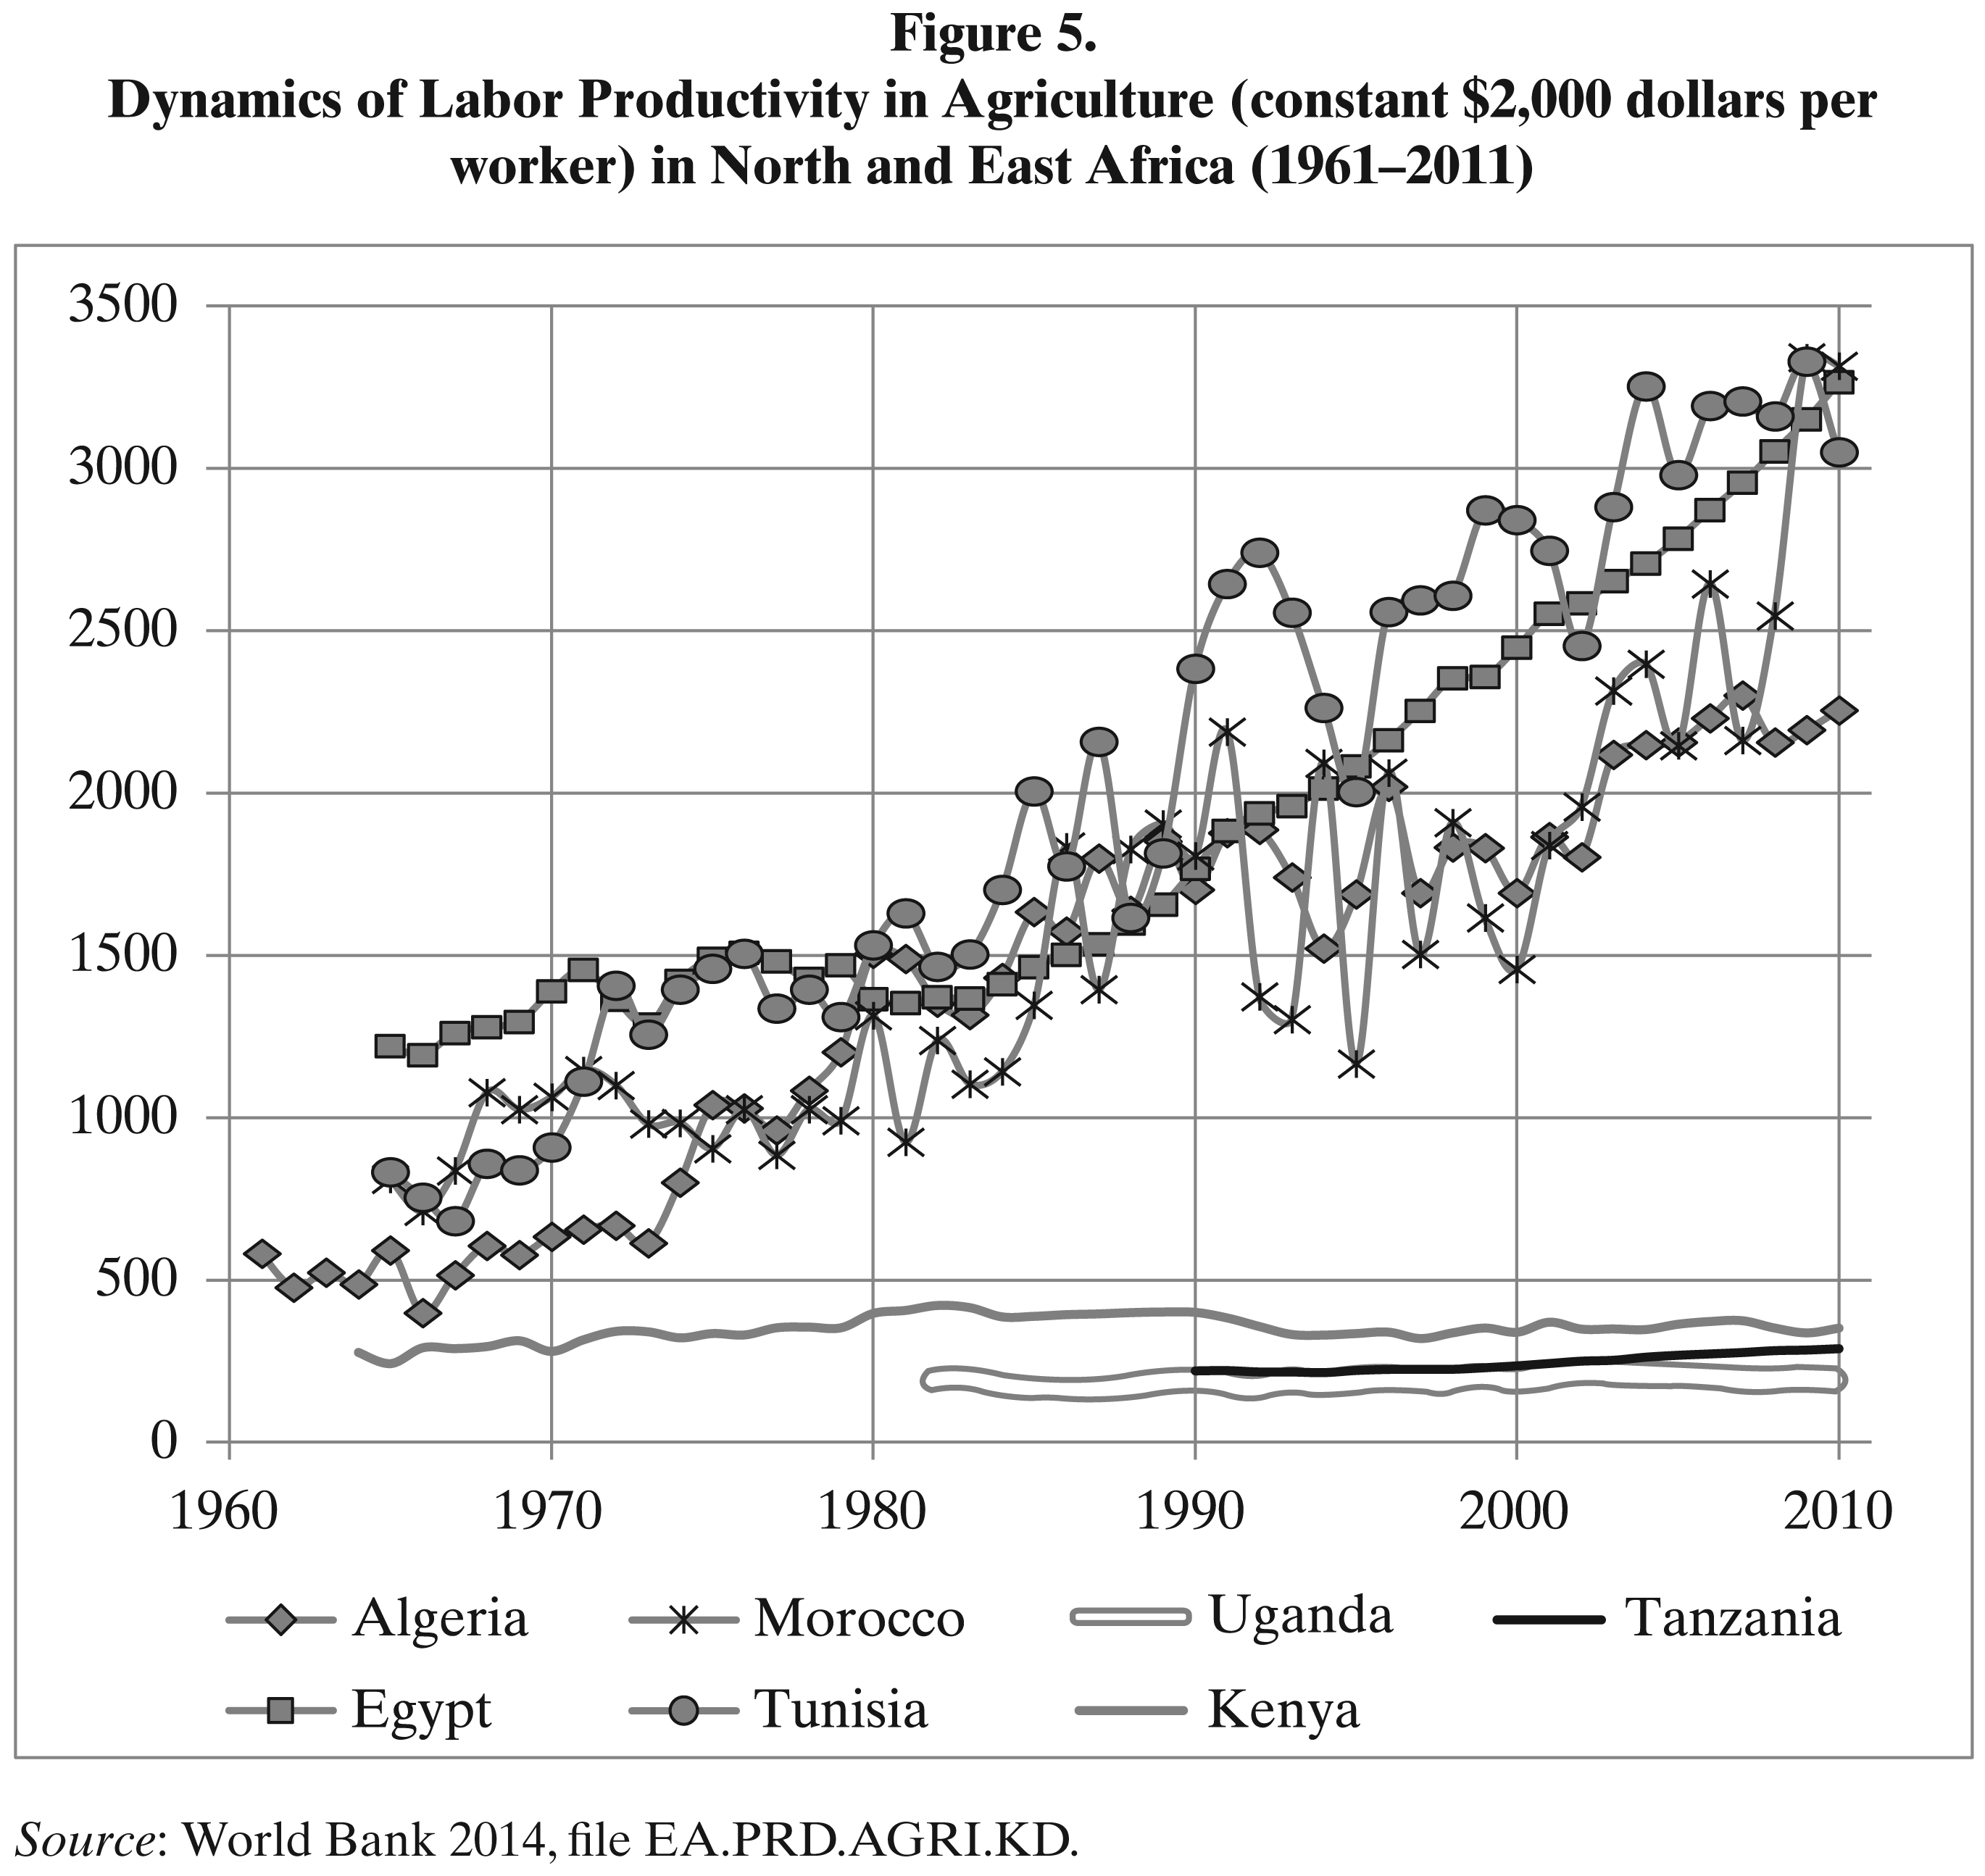
It appears important to note that the escape from the Malthusian trap was accompanied in North Africa by a fast increase of the productivity of labor in agriculture (see Figure 5).
Source: World Bank, 2014, file SP.POP.GROW.
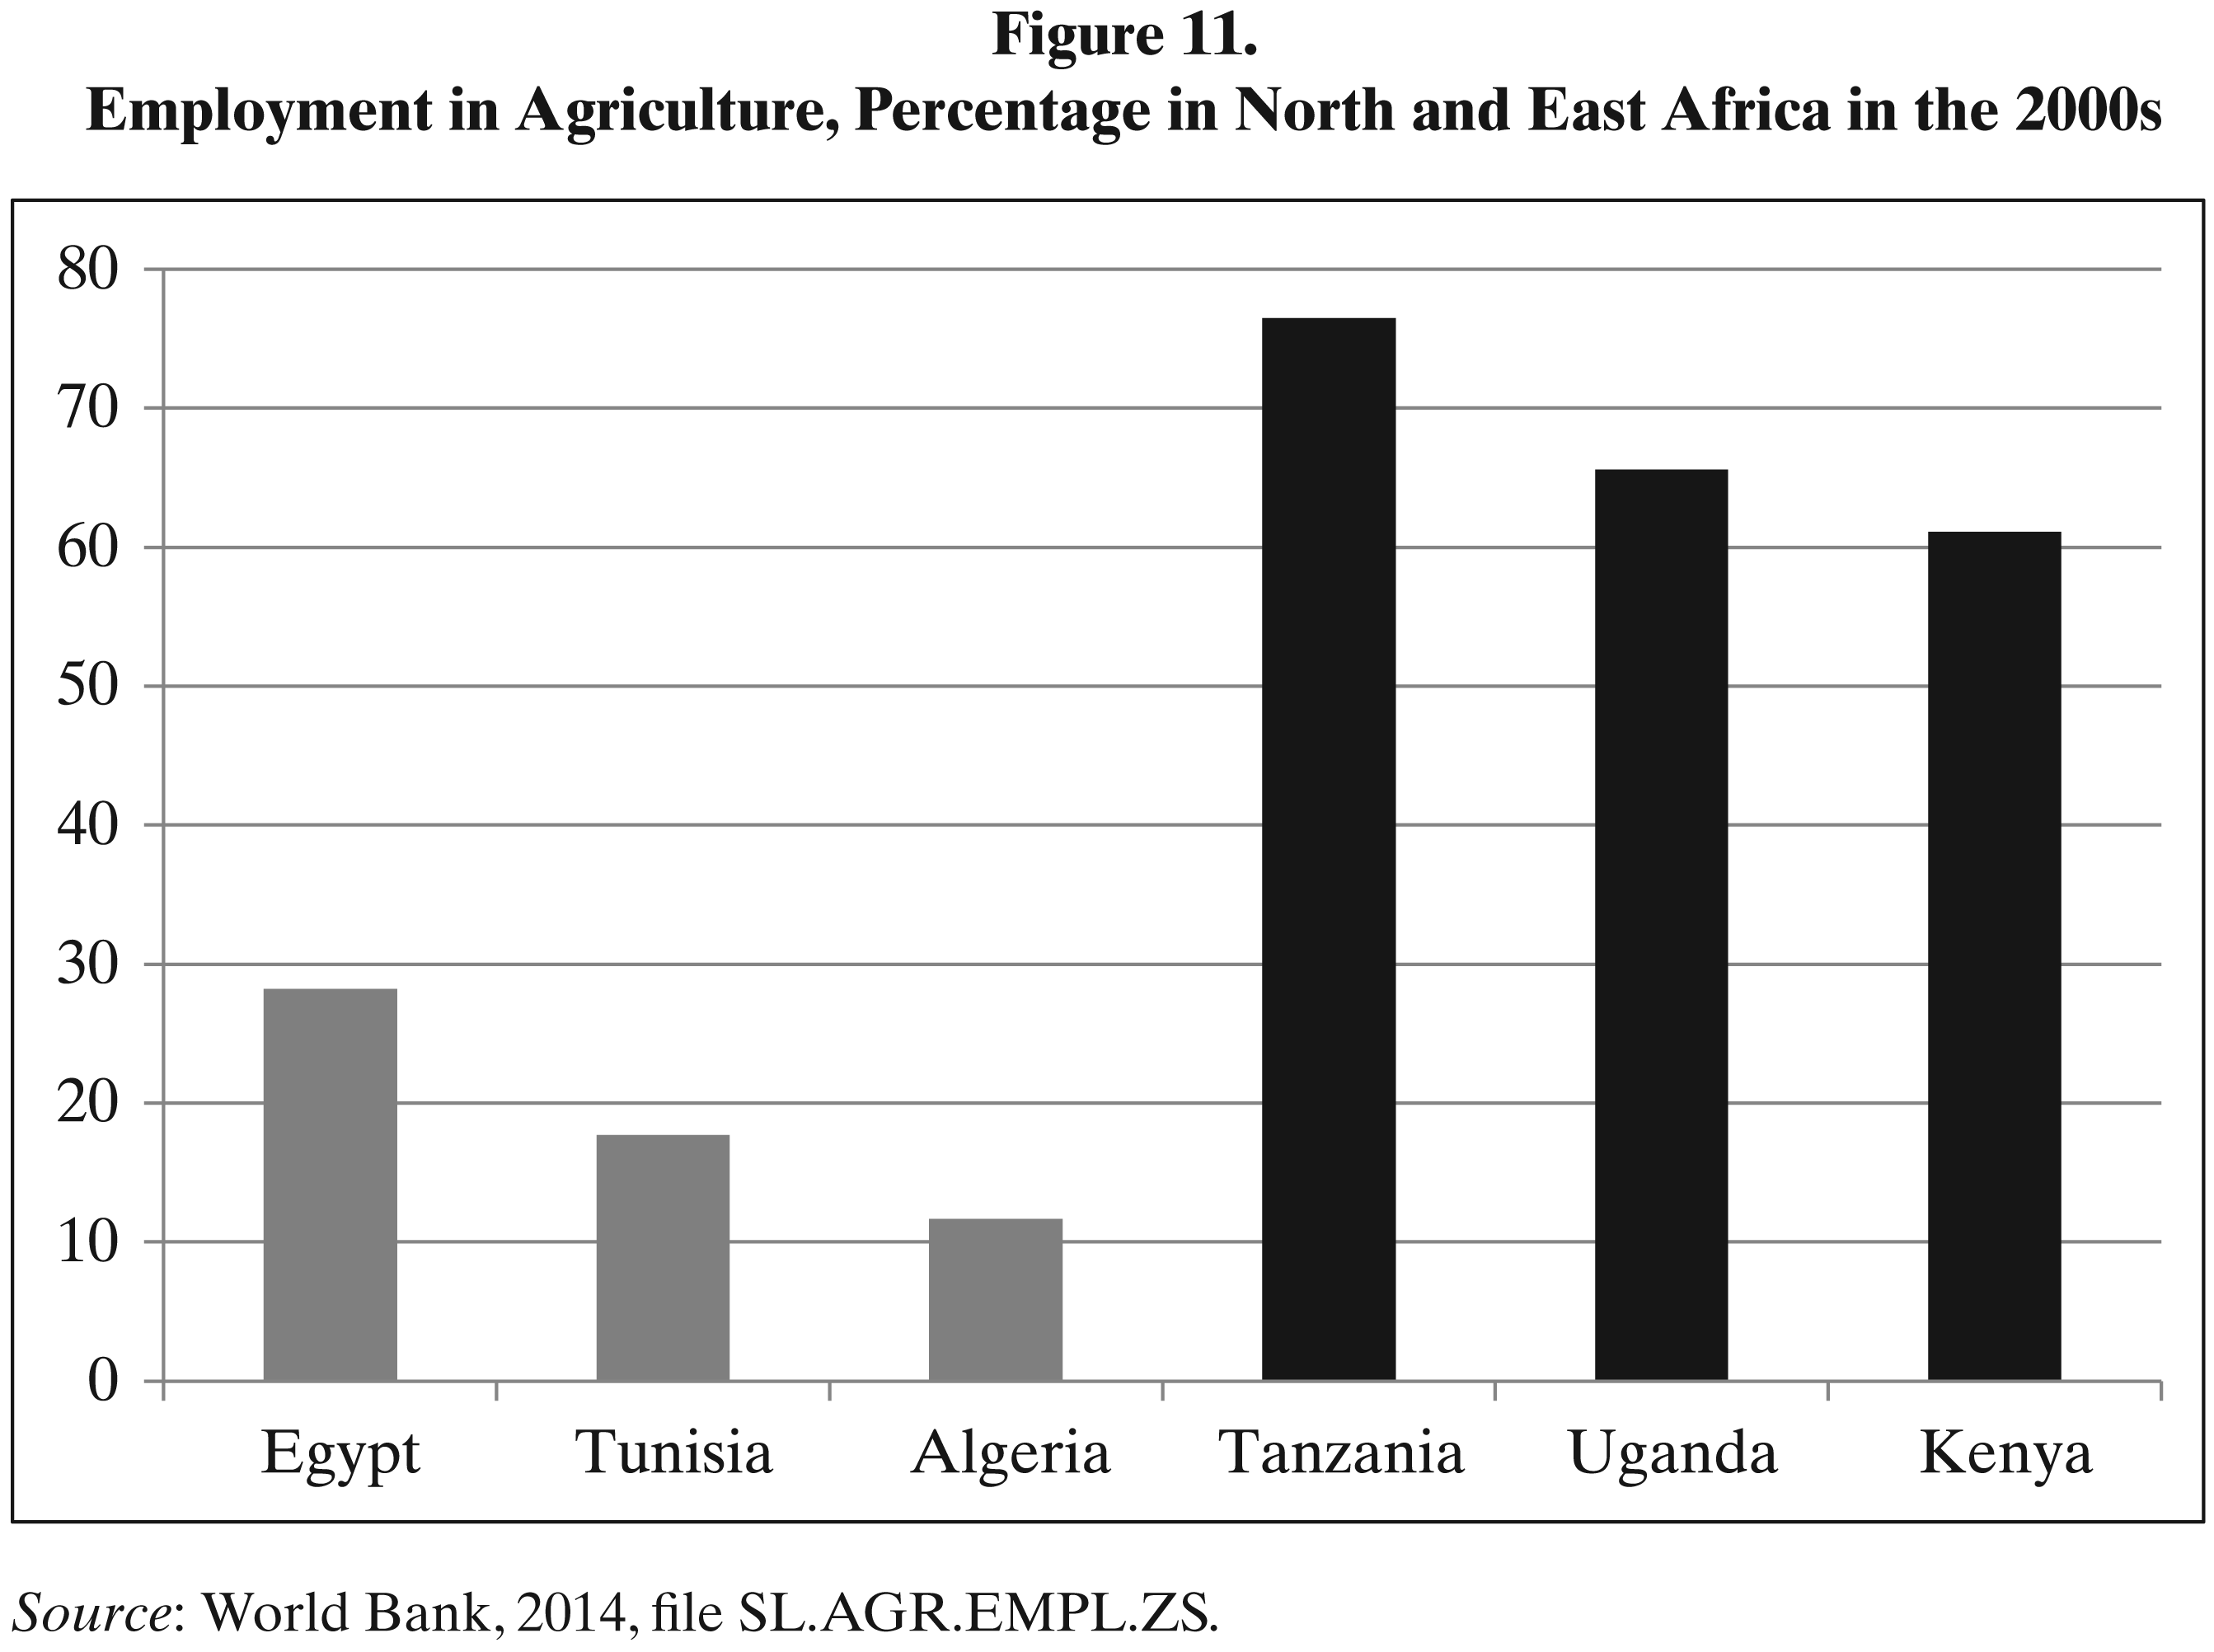
Quite predictably, this was also accompanied by a sharp decline of the percentage of economically active people employed in agriculture and now it constitutes 28.2 percent in Egypt, 17.7 percent in Tunisia, and 11.7 percent in Algeria (World Bank, 2014, file SL.AGR.EMPL.ZS). 7
Source: World Bank 2014, file EA.PRD.AGRI.KD.
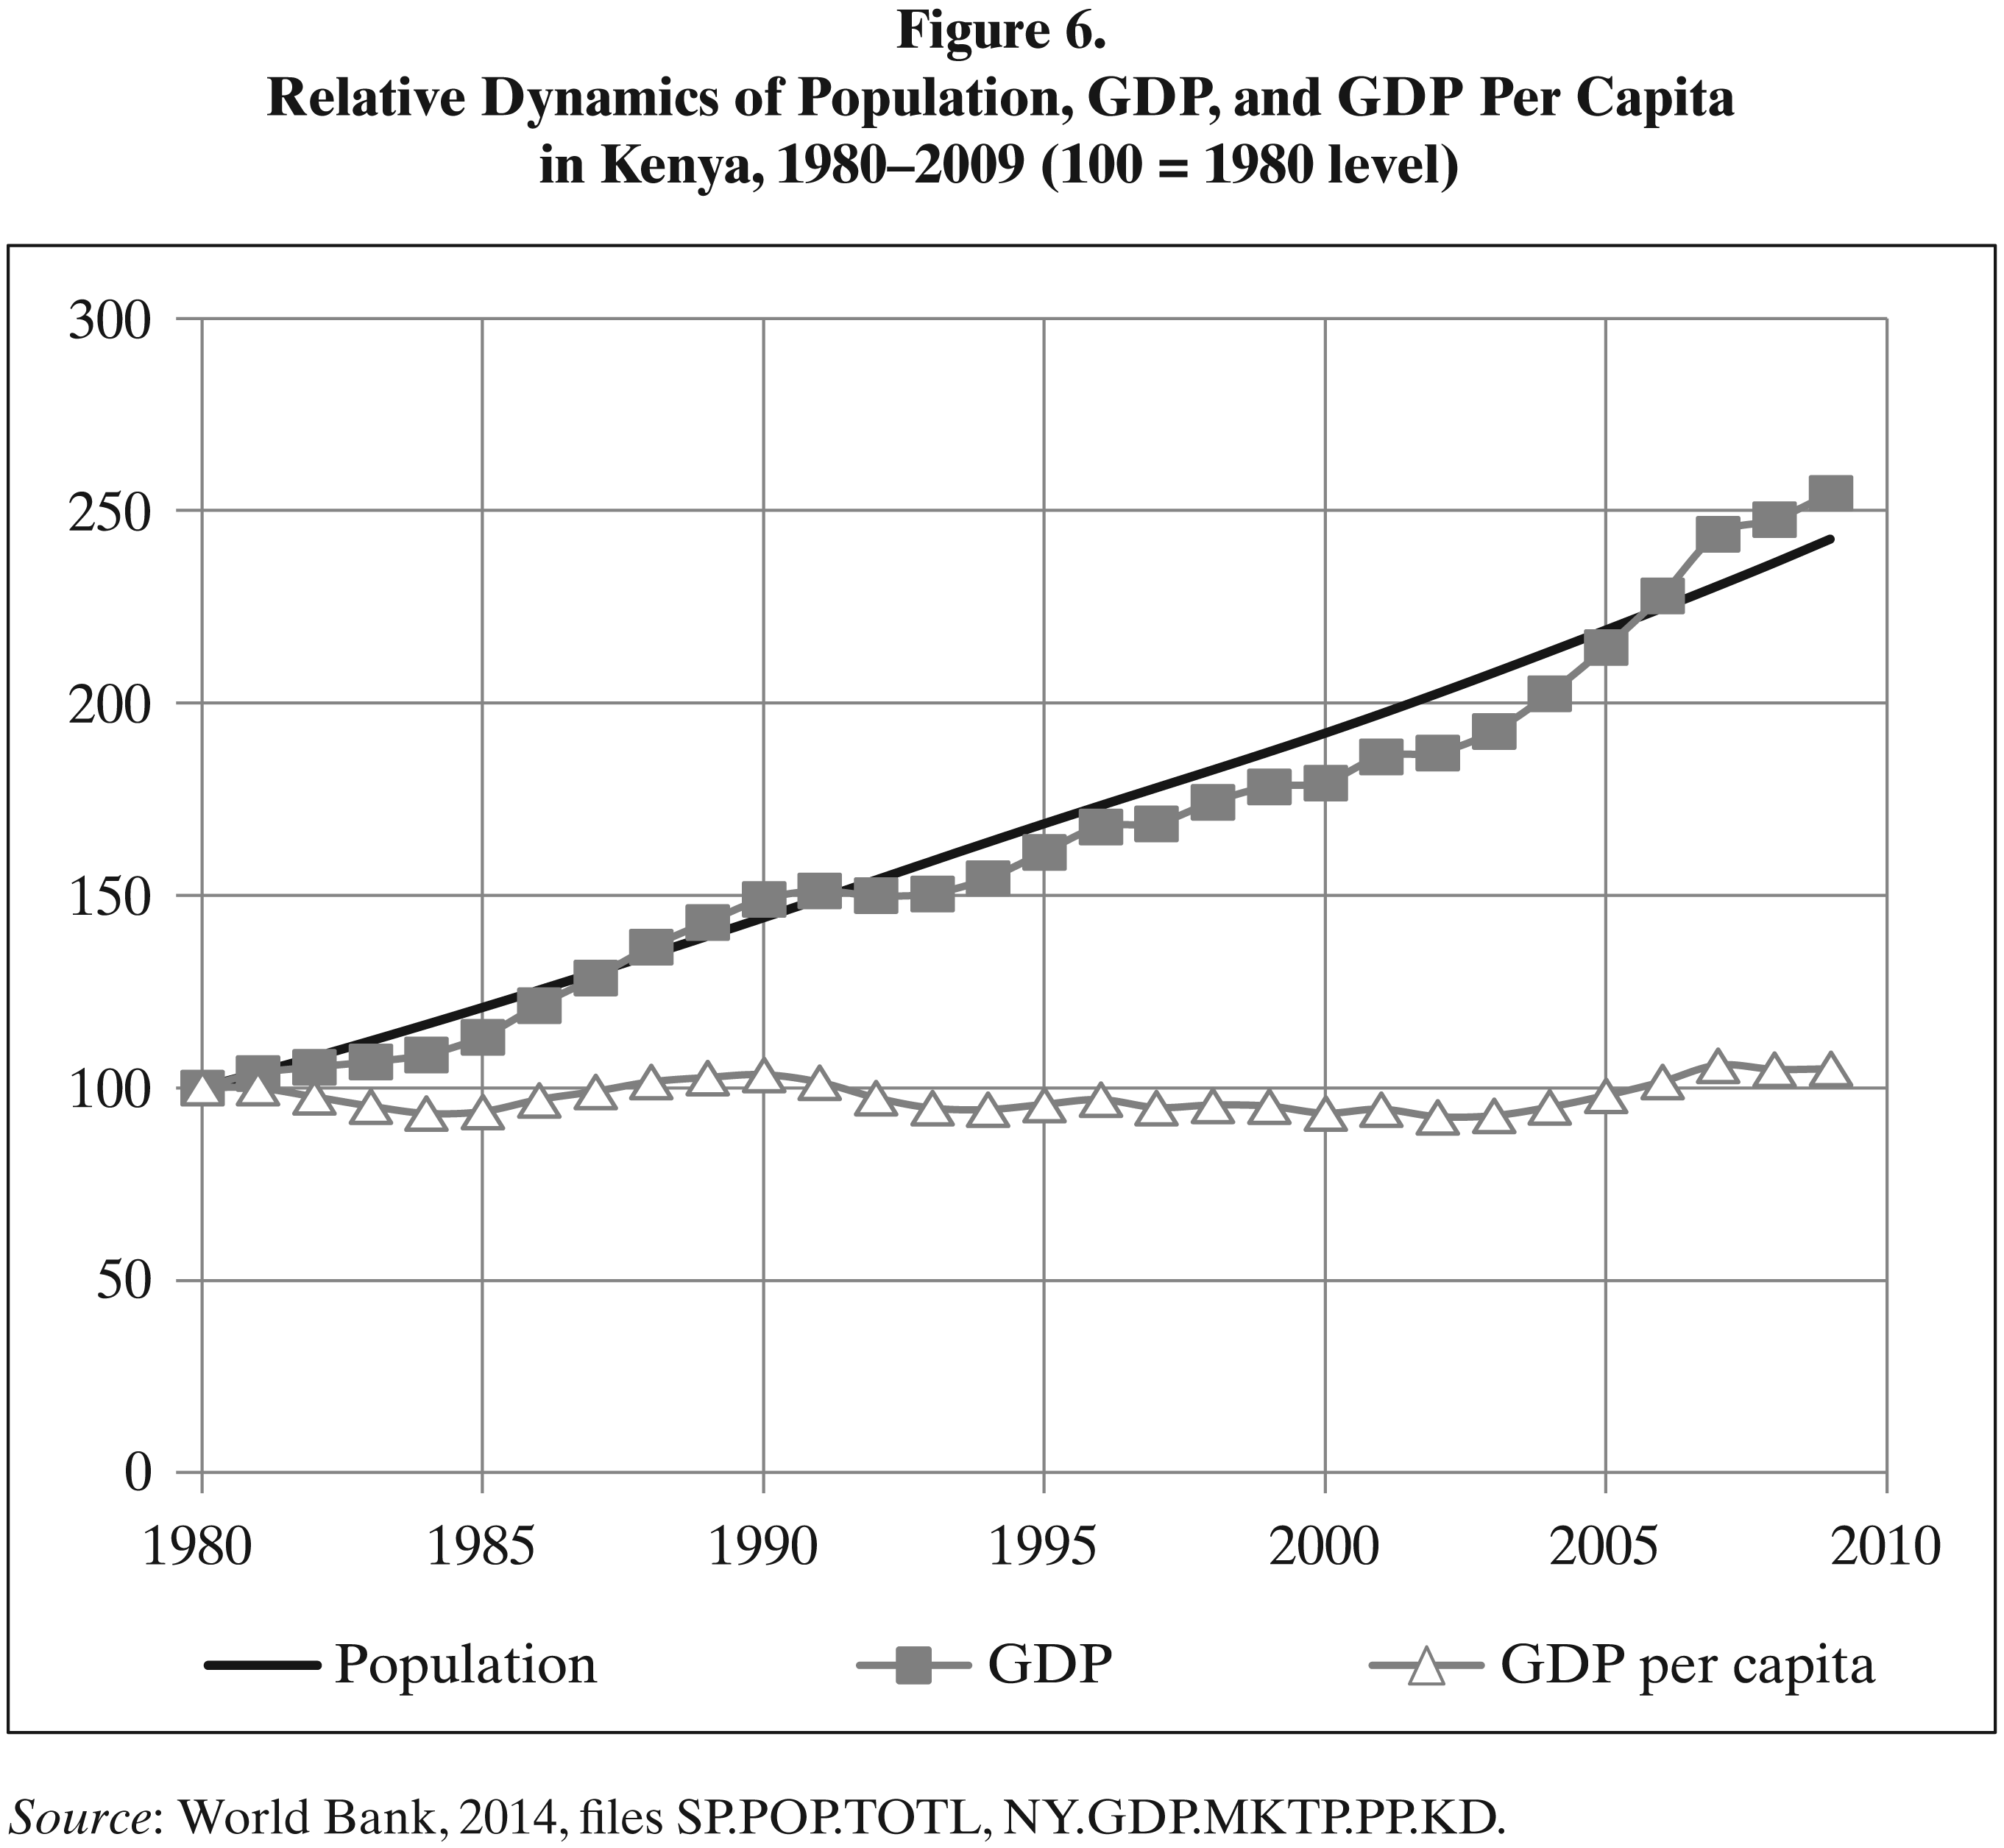
East Africa stands in sharp contrast to these North African figures. The clearest Malthusian economic–demographic dynamics are observed in the recent decades in Kenya (see Figure 6).
As we see, between 1980 and 2009 the Kenyan economy grew rather substantially, by about 150 percent. But the Kenyan population in those years grew as substantially – and, as a result, per capita GDP in Kenya in 2009 was almost the same as in 1980.
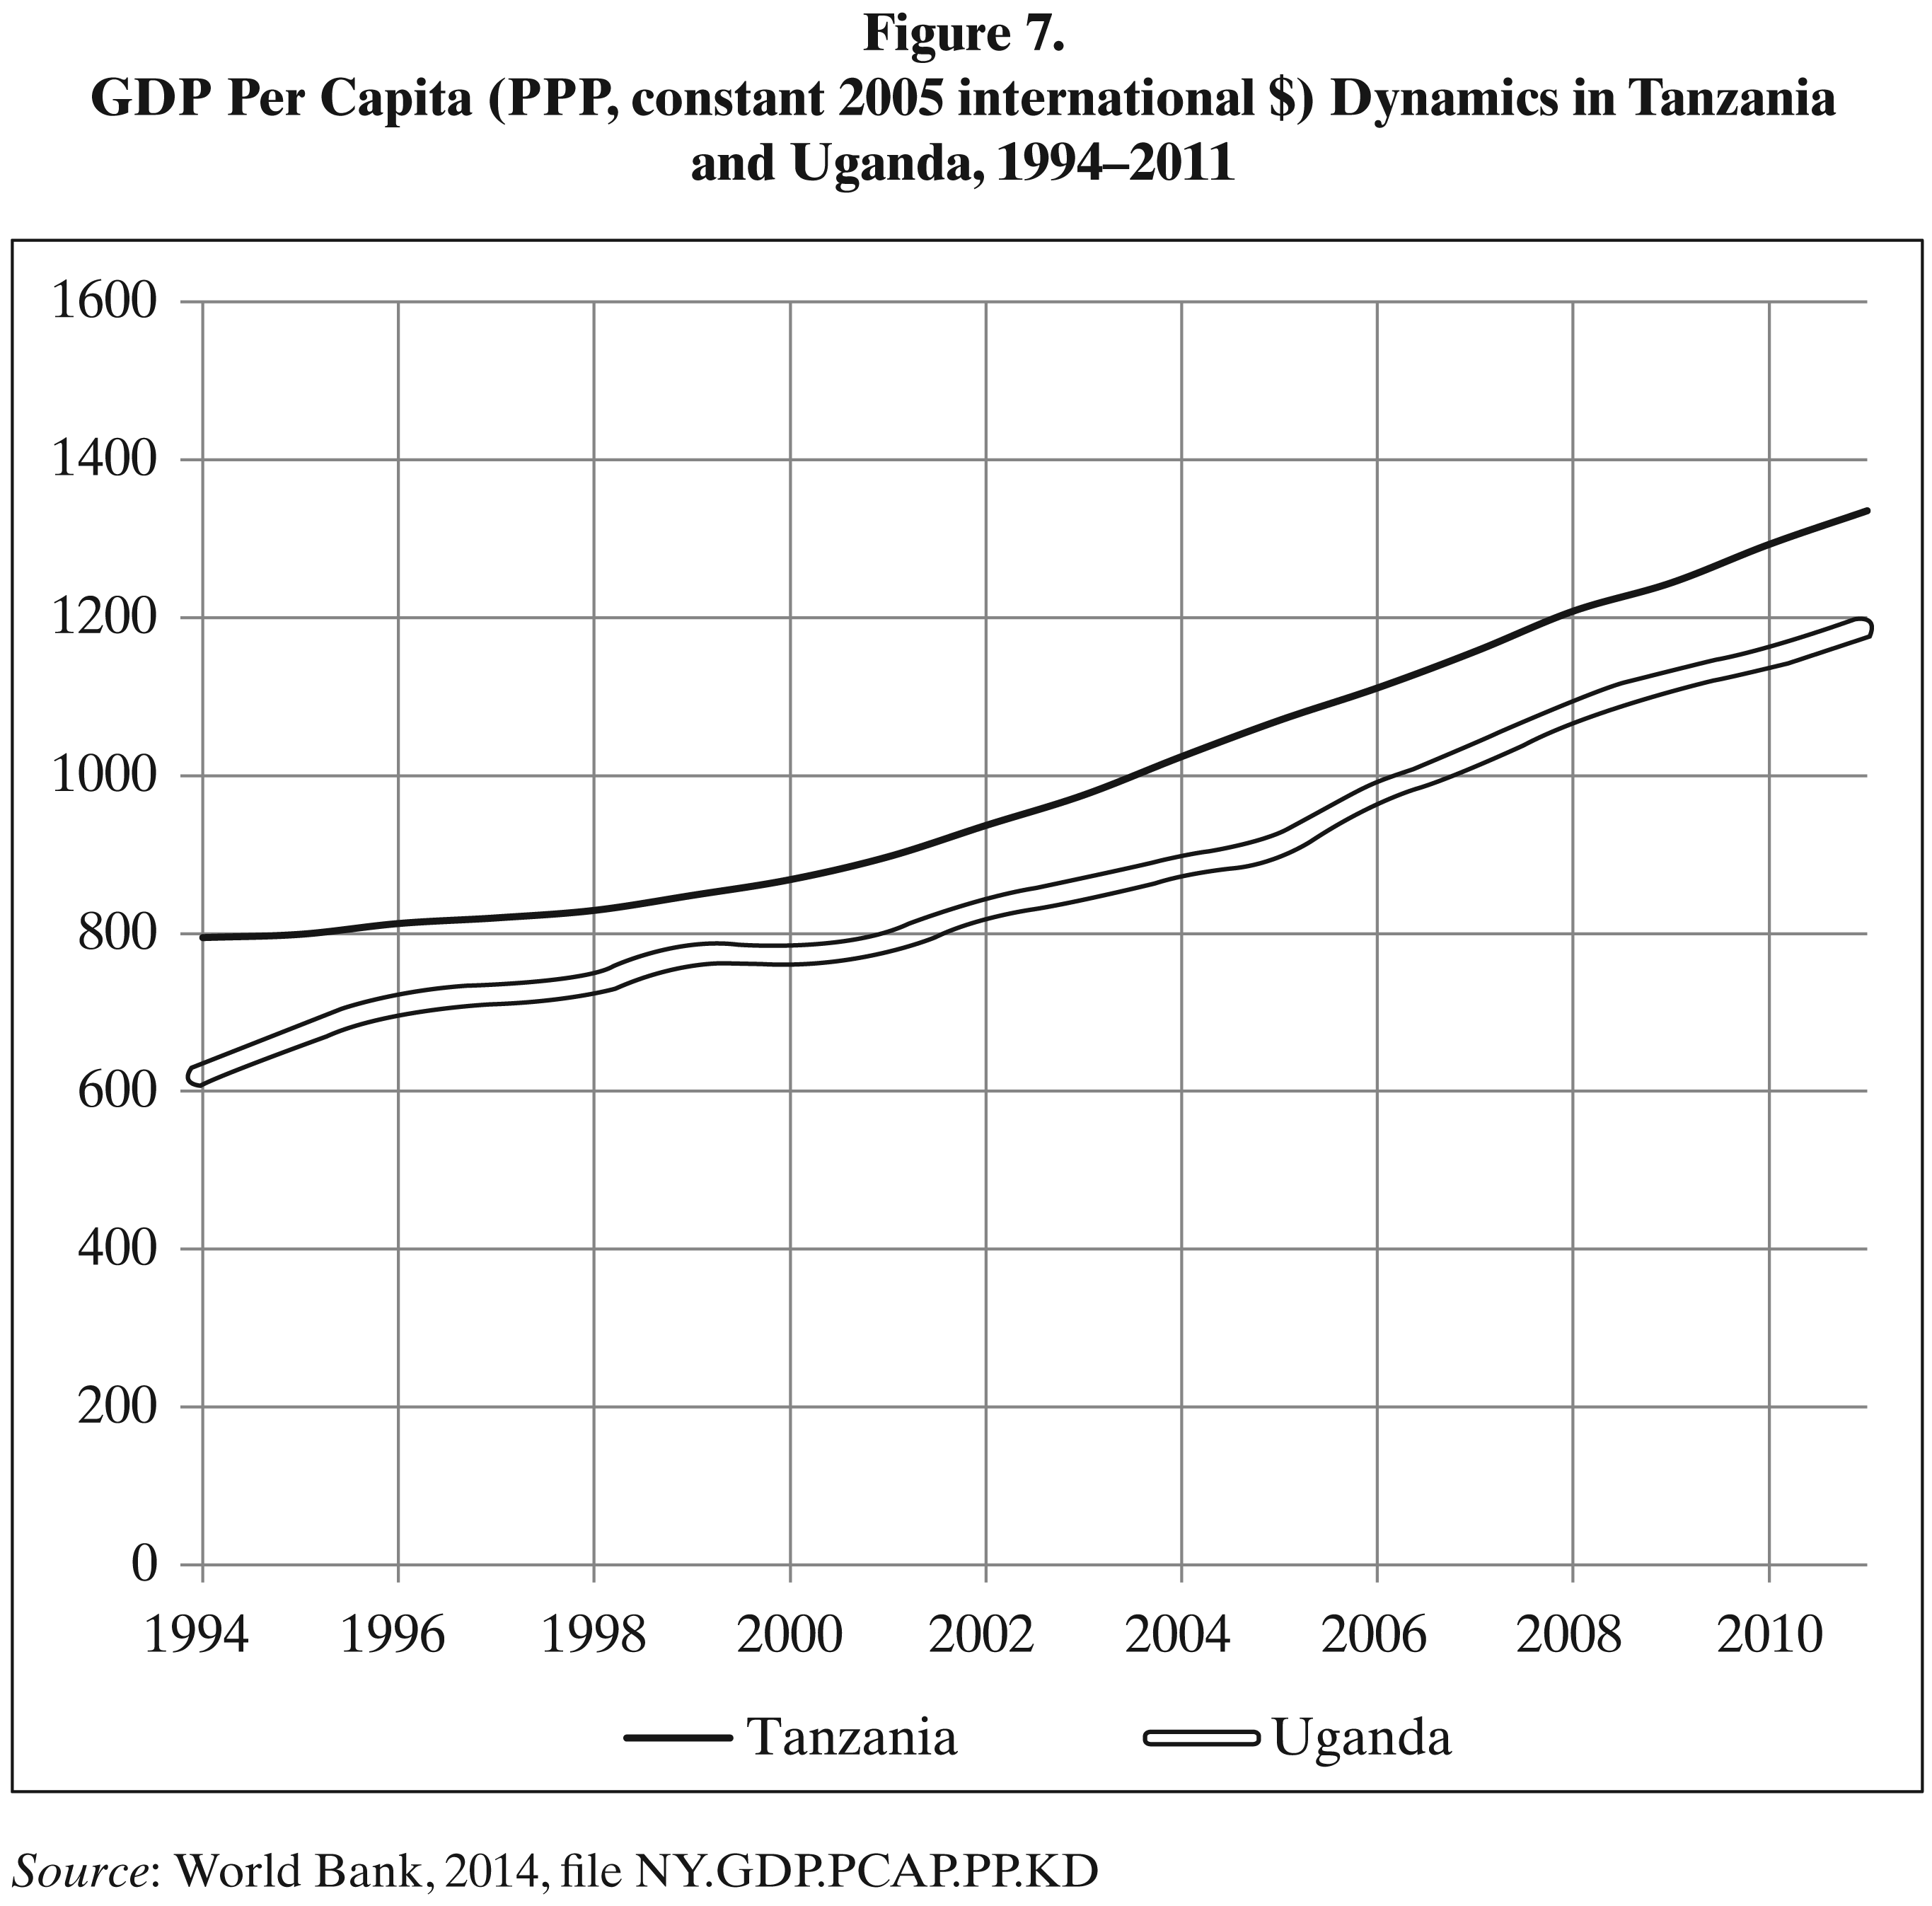
However, the situation in Uganda and Tanzania does not appear as simple. In both countries in recent years, one could observe a rather substantial growth of per capita GDP (see Figure 7).
Why was this not converted into the growth of per capita food consumption? It appears very important to answer this question, as the positive values of per capita GDP growth rates observed recently in most countries of Tropical Africa have made some experts believe that “(almost) the whole World – including most IF NOT ALL of Africa – shares features of Malthus’ vision for escaping the trap he outlined” (Kenny, 2010, p. 192, our emphasis).
Source: World Bank, 2014, files SP.POP.TOTL, NY.GDP.MKTP.PP.KD.
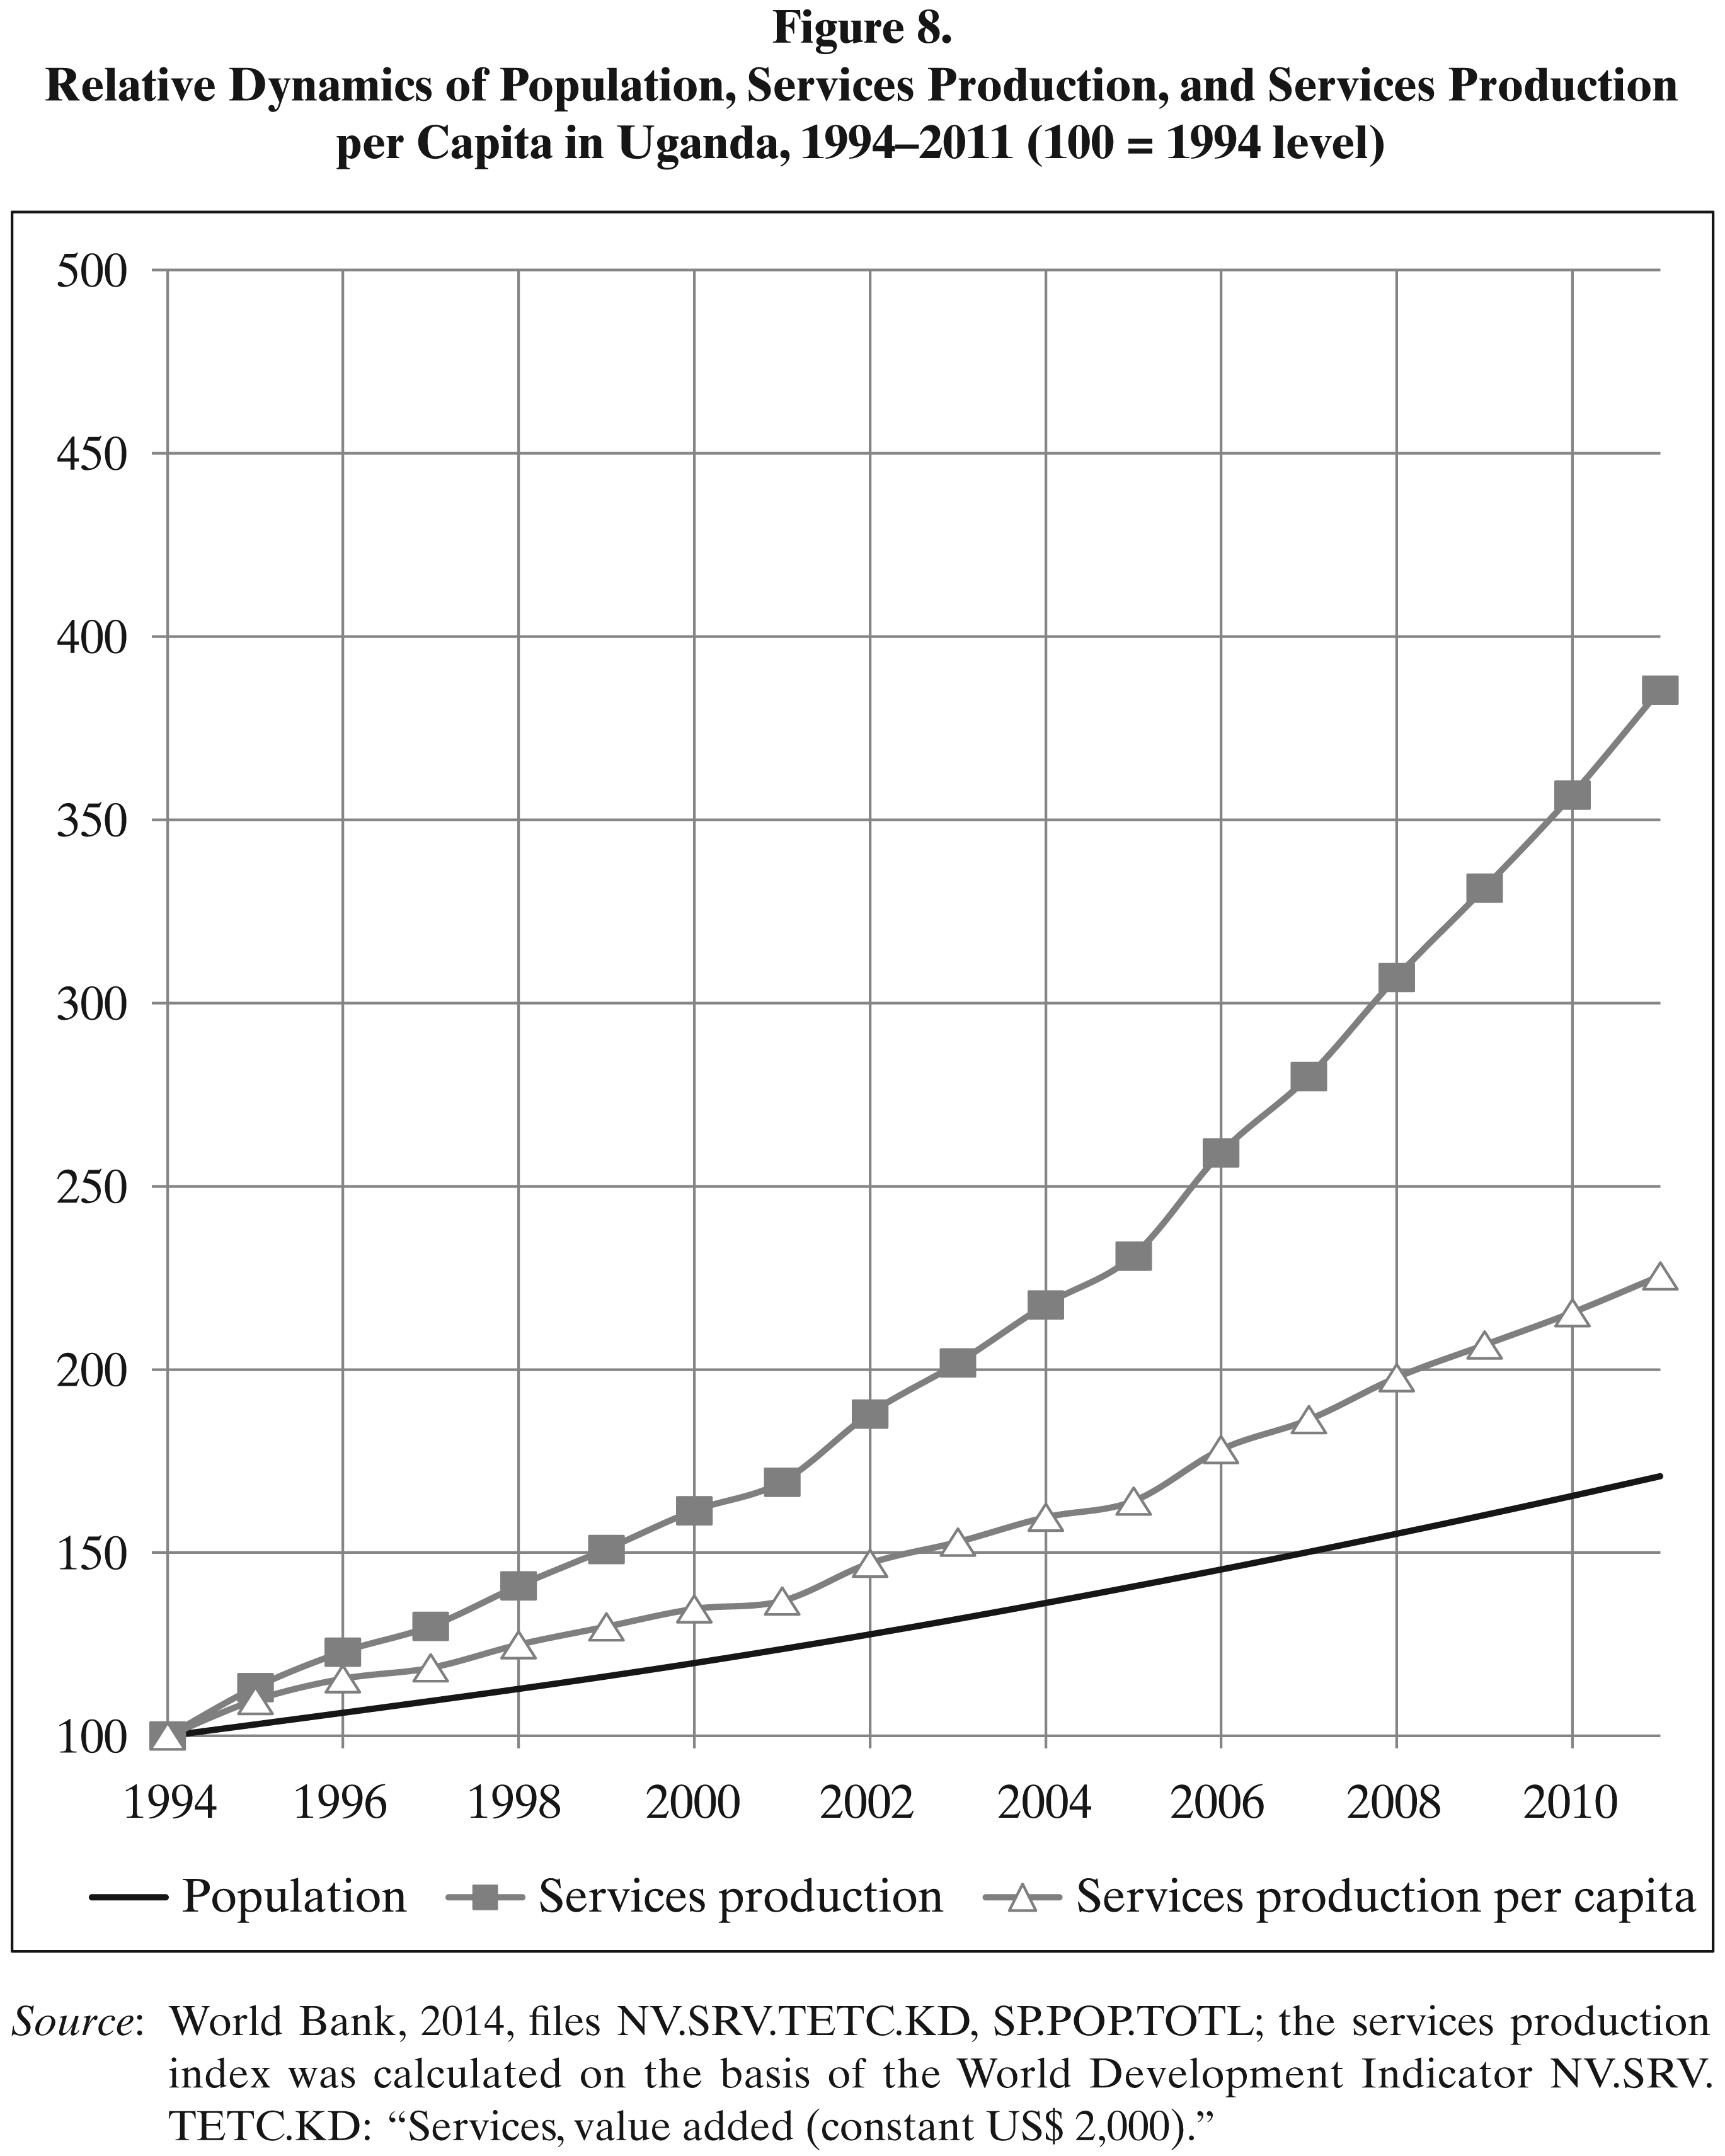
To answer this question, it appears necessary to consider the recent economic growth in East Africa by sector. Let us start with the dynamics of the production of services in Uganda (see Figure 8).
As we see, in these years Ugandan successes in this sector of its economy were really spectacular. Between 1994 and 2011, the Ugandan population almost doubled. But growth rates in the service sector by far outpaced the population growth rate – production in this sector quadrupled, and per capita production of services increased more than twice.
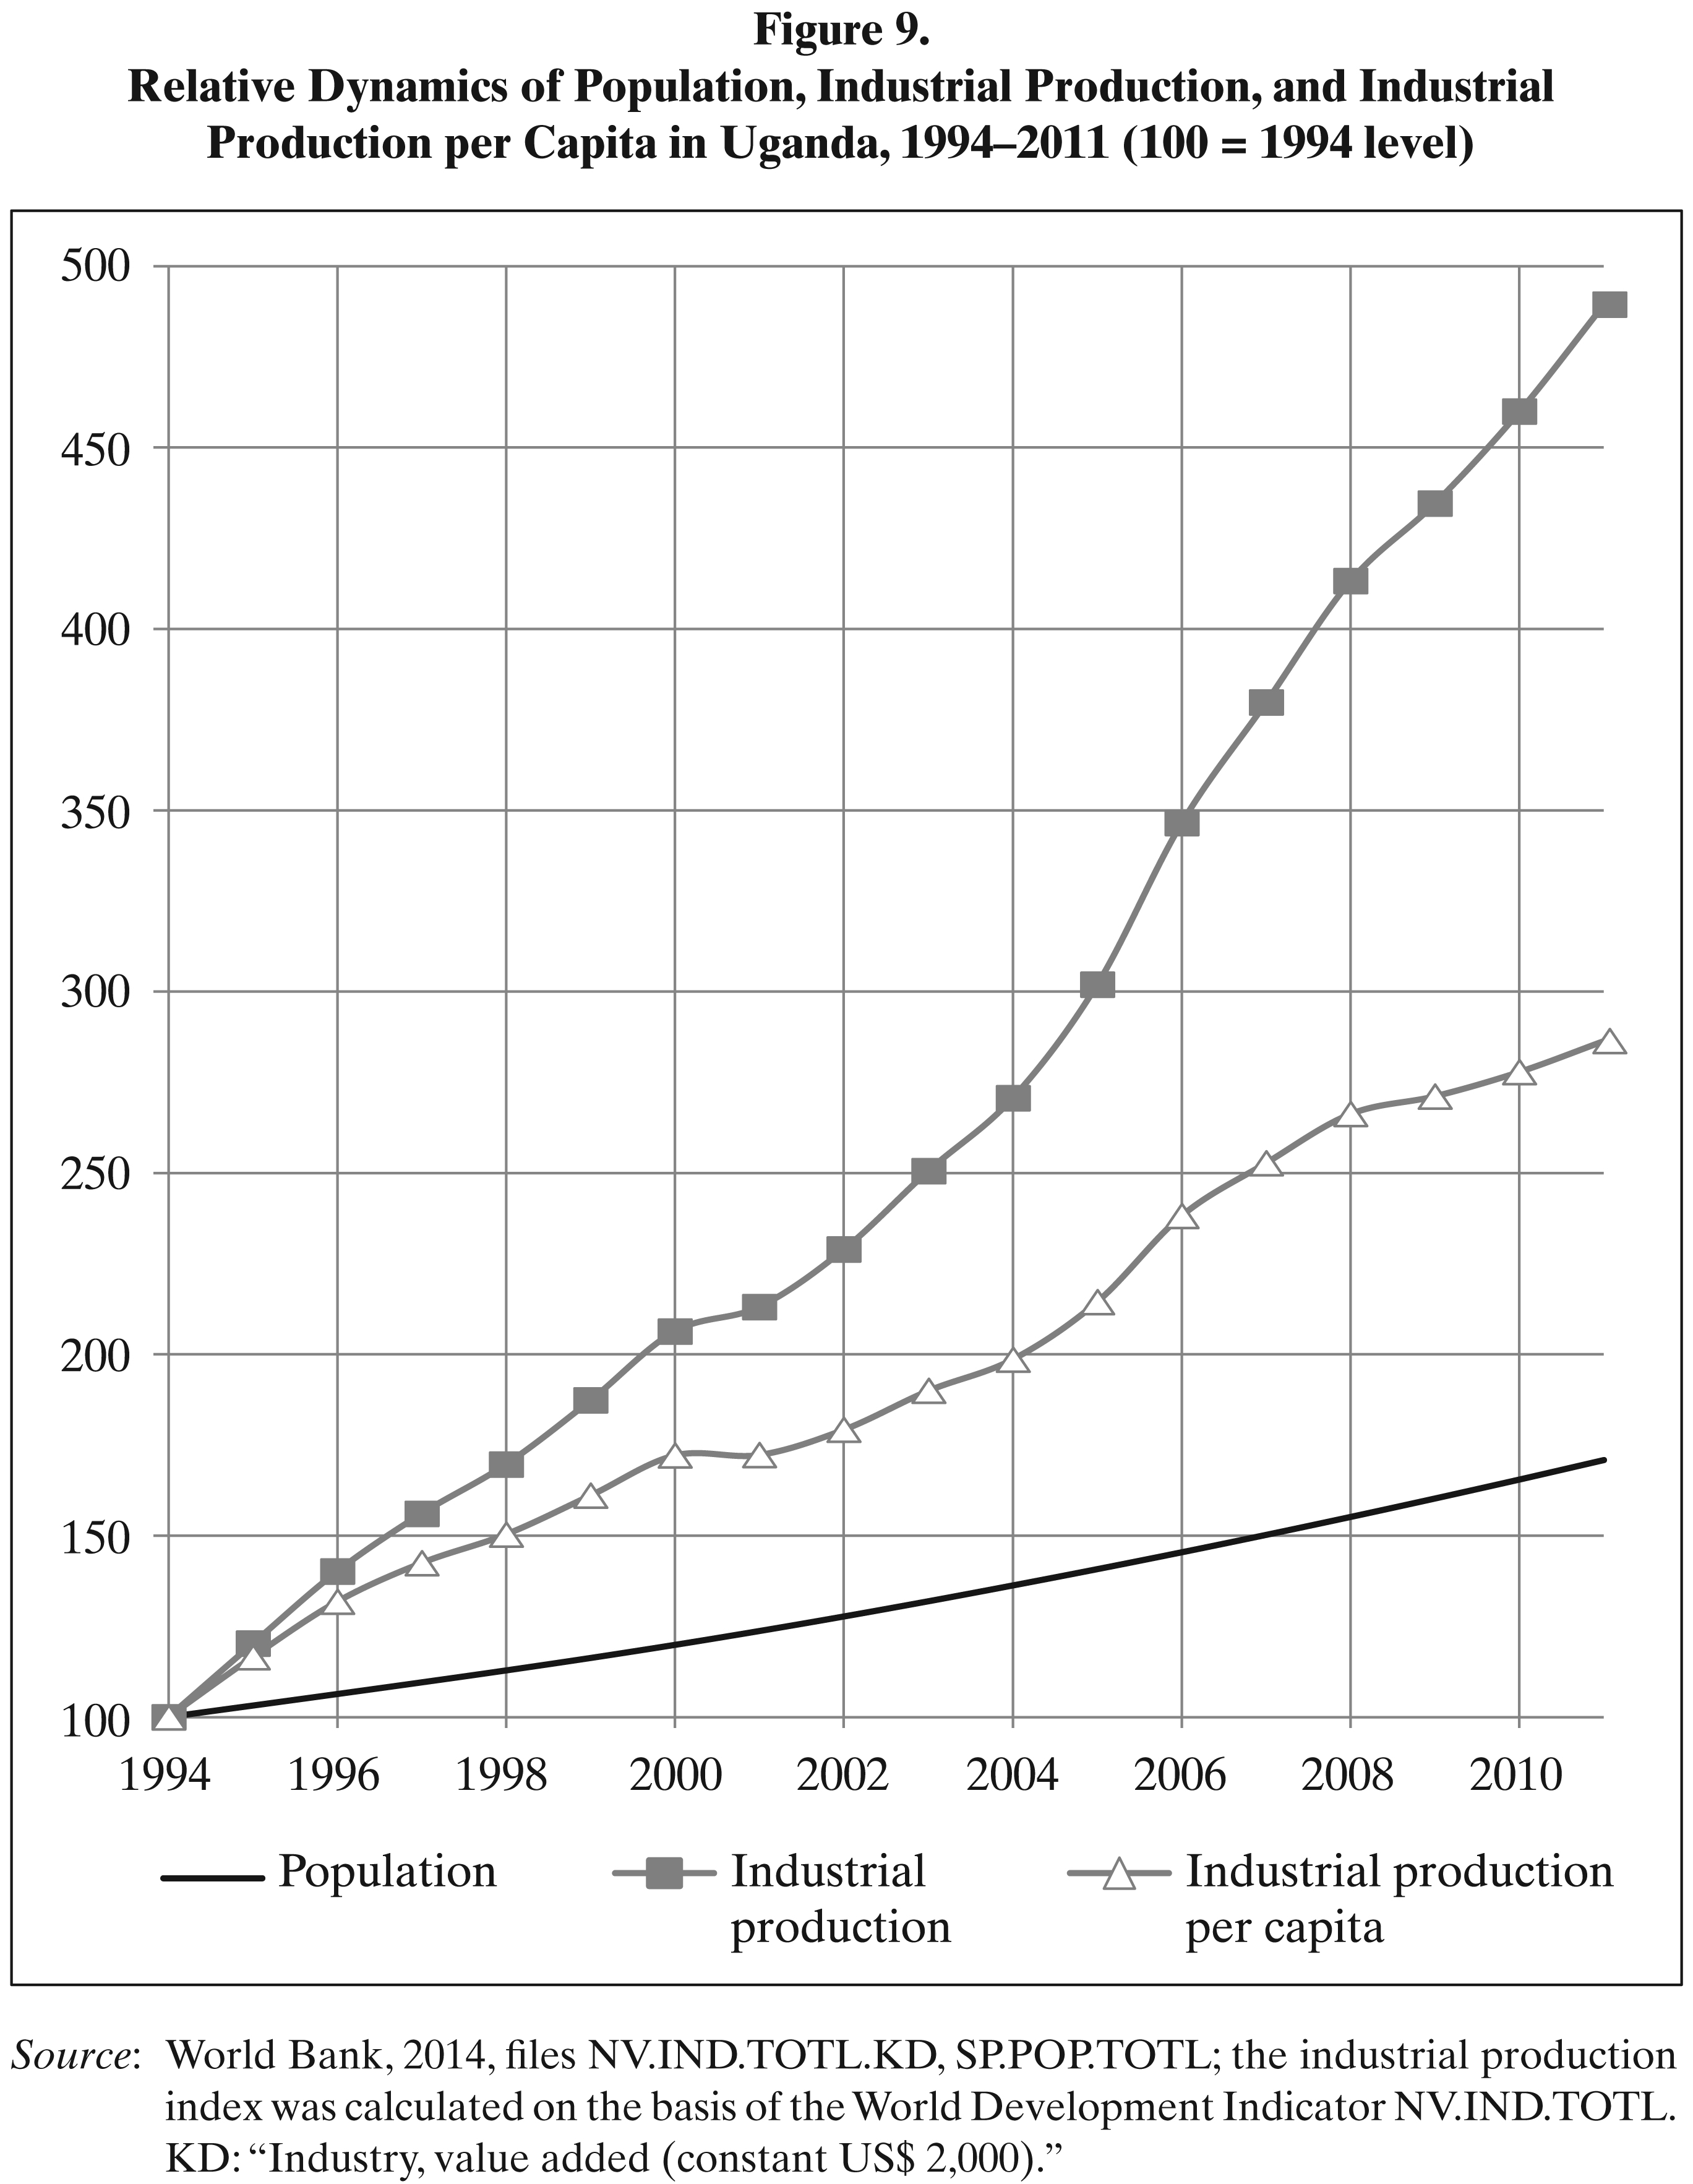
Successes of industrial development in Uganda in these years were even more spectacular – between 1994 and 2011, industrial output grew fivefold in this country (see Figure 9).
Source: World Bank, 2014, file NY.GDP.PCAP.PP.KD
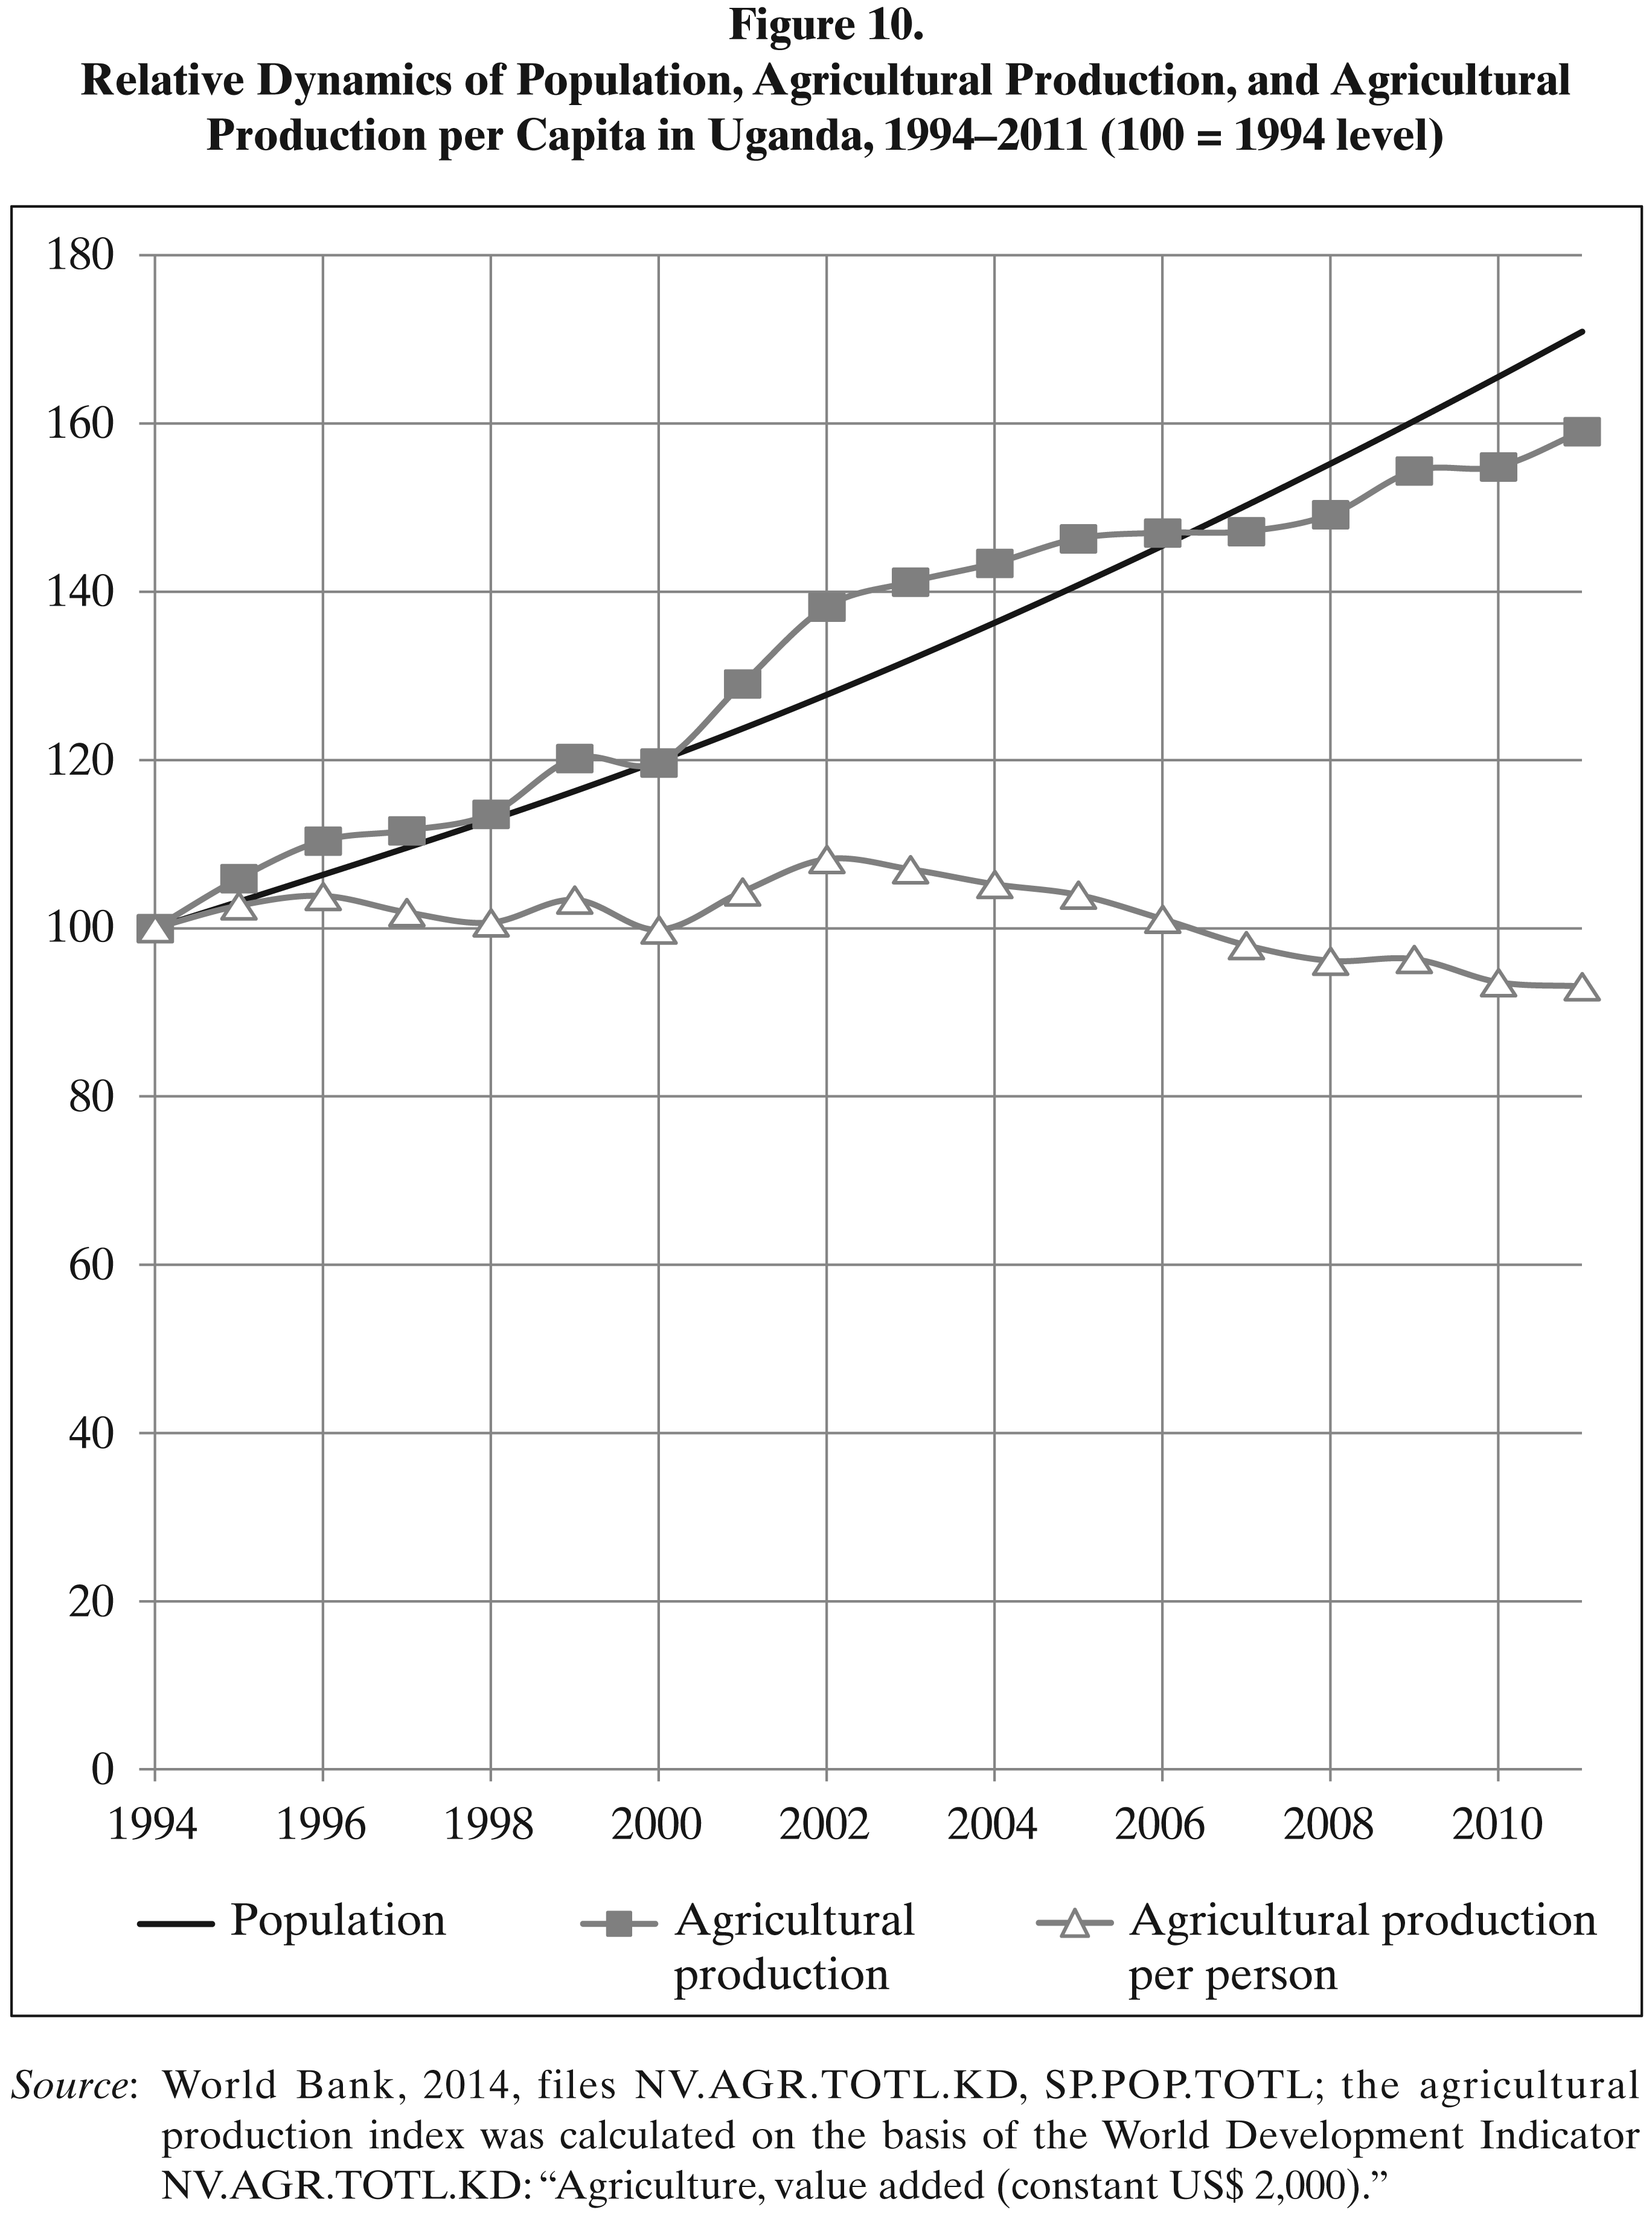
But what about the sector where the majority of the Ugandan working population is still employed? Unfortunately, the situation in this sector is strikingly different from the success stories of the Ugandan nonagricultural enterprises (see Figure 10).
As we see, between 1994 and 2011, the growth of agricultural production in Uganda was still quite substantial (60 percent). But the population growth in Uganda in those years was even higher. And as a result, the agricultural production per capita in Uganda declined. Note that this correlates rather well with data showing almost perfect stagnation of agricultural labor productivity in Uganda in recent years 8 (see Figure 5).
Source: World Bank, 2014, files NV.SRV.TETC.KD, SP.POP.TOTL; the services production index was calculated on the basis of the World Development Indicator NV.SRV. TETC.KD: “Services, value added (constant US$ 2,000).”
Actually one of the most important differences between contemporary North and East Africa is that in North Africa, a rather small proportion of the population is employed in agriculture, whereas in East Africa this represents the overwhelming majority of the population (see Figure 11).
Hence, the majority of the population of the East African countries will remain in the Malthusian trap even against the background of an overall growth of GDP per capita if this growth is achieved through the productivity growth in nonagricultural sectors only, with the agricultural labor productivity of the majority of rural population stagnating or declining.
Source: World Bank, 2014, files NV.IND.TOTL.KD, SP.POP.TOTL; the industrial production index was calculated on the basis of the World Development Indicator NV.IND.TOTL.KD: “Industry, value added (constant US$ 2,000).”
Hence, a sustainable escape from the Malthusian trap can hardly be achieved in East Africa without a substantial increase in the productivity of labor by most of the agricultural population. However, one of the main obstacles for this is just that the rural overpopulation effectively blocks such increases.
Source: World Bank, 2014, files NV.AGR.TOTL.KD, SP.POP.TOTL; the agricultural production index was calculated on the basis of the World Development Indicator NV.AGR.TOTL.KD: “Agriculture, value added (constant US$ 2,000).”
As Roth and Fratkin (2005, p. 6) note, in East Africa “rapid population growth has affected rural and urban areas, where farmers increasingly move onto less productive lands to raise their crops and families.” Population pressure leads to the reduction of fallow periods. 9 As a result, soil fertility fails to return to original levels and frequently various innovations (like fertilizers) just serve to partly prevent a steeper decline in (the already low) agricultural labor productivity instead of increasing it (see, e.g., Bigsten & Kayizzi-Mugarewa, 1999, p. 80).
Source: World Bank, 2014, file SL.AGR.EMPL.ZS.
An unavoidable conclusion of the above data is that the countries of East Africa will not be able to achieve a sustainable escape from the Malthusian trap unless they first achieve a serious decline in fertility (see, also, e.g., Korotayev & Zinkina, 2014; Zinkina & Korotayev, 2014a, 2014b). However, why could not East Africa follow the “North African” path – that is, first achieve the escape from the Malthusian trap and then accomplish a decline in fertility?
One point is that North Africa escaped from the Malthusian trap just one to two decades after the population growth rates exceeded 2.5 percent per year levels (implying the population doubling just within 30 years), whereas in East Africa such a growth continues for many decades and with any new decade, the escape from the Malthusian trap before the fertility decline becomes less and less likely.
One might ask, looking at the successes in productivity in urban sectors, why not just move the majority of the population from stagnant villages to vibrant cities?
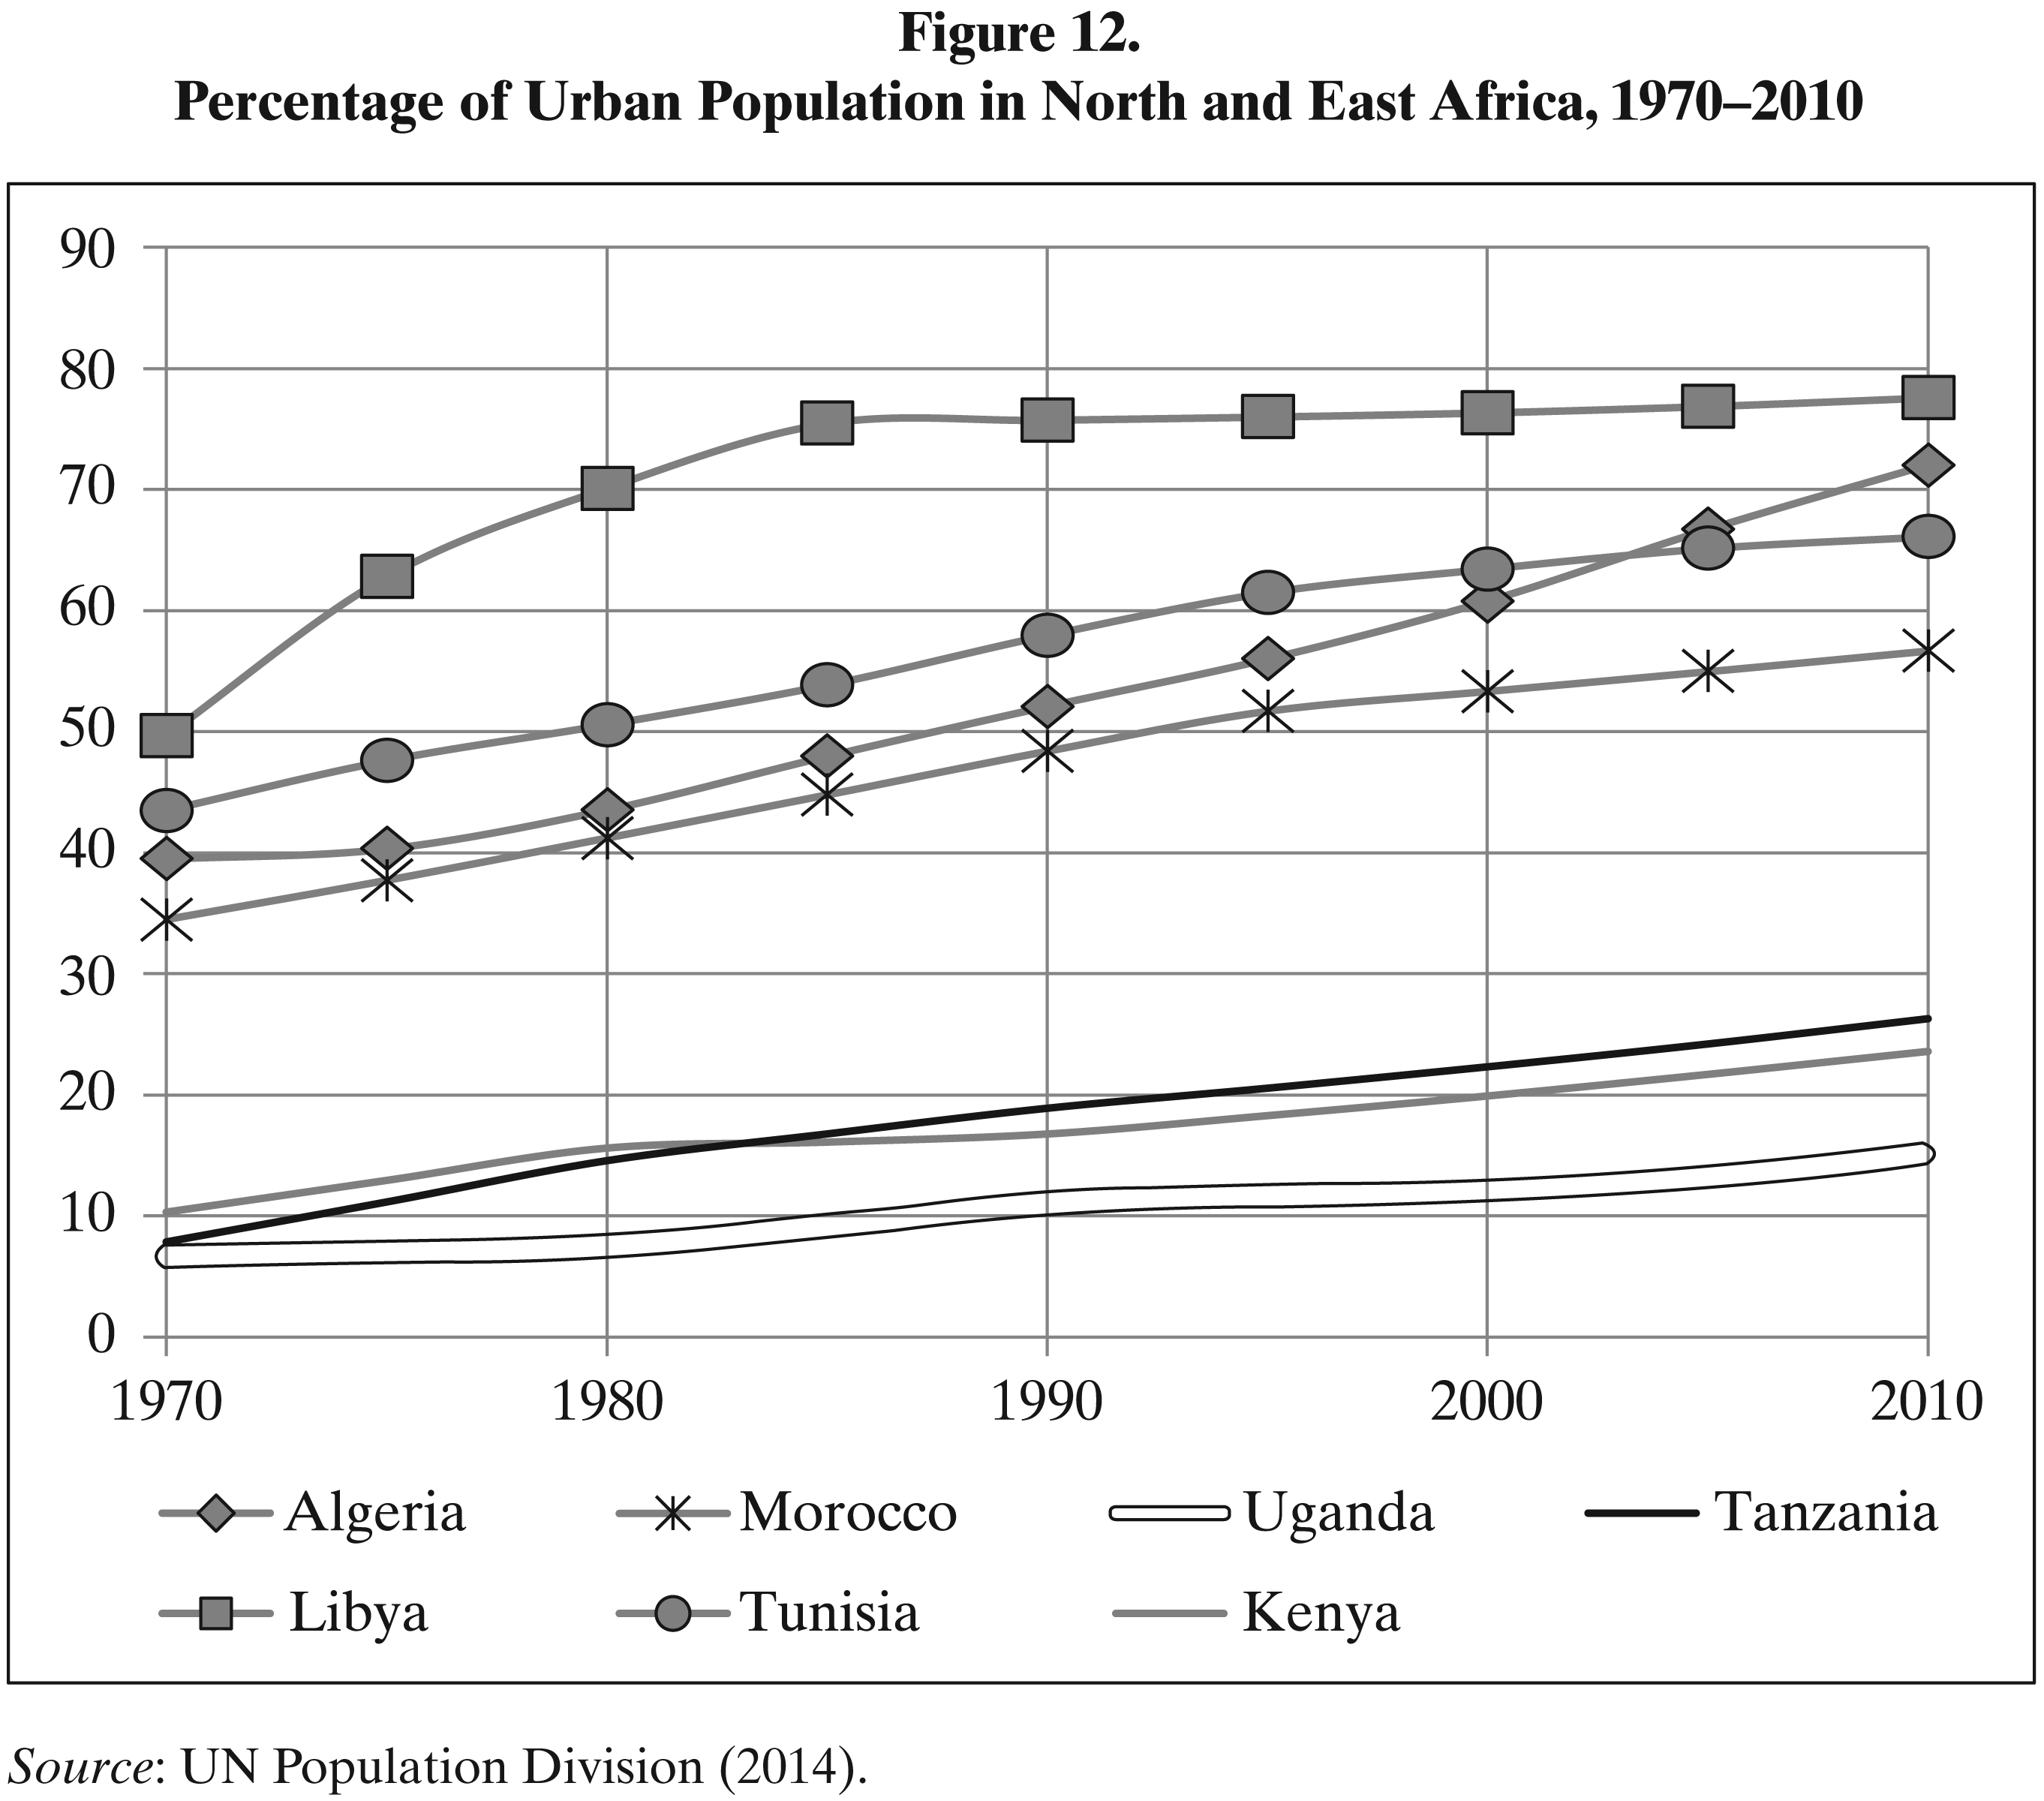
To answer this question, it makes sense to consider the urban population dynamics in North and East Africa (see Figure 12 10 ).
Source: UN Population Division (2014).
As we see, even now the proportion of urban population in East Africa is substantially lower than it was in North Africa at the start of its escape from the Malthusian trap. If the recent urban population percentage growth rate, say, in Uganda continues, this country will only reach the 1970 level of the least urbanized North African country, Morocco, in the late 2050s.
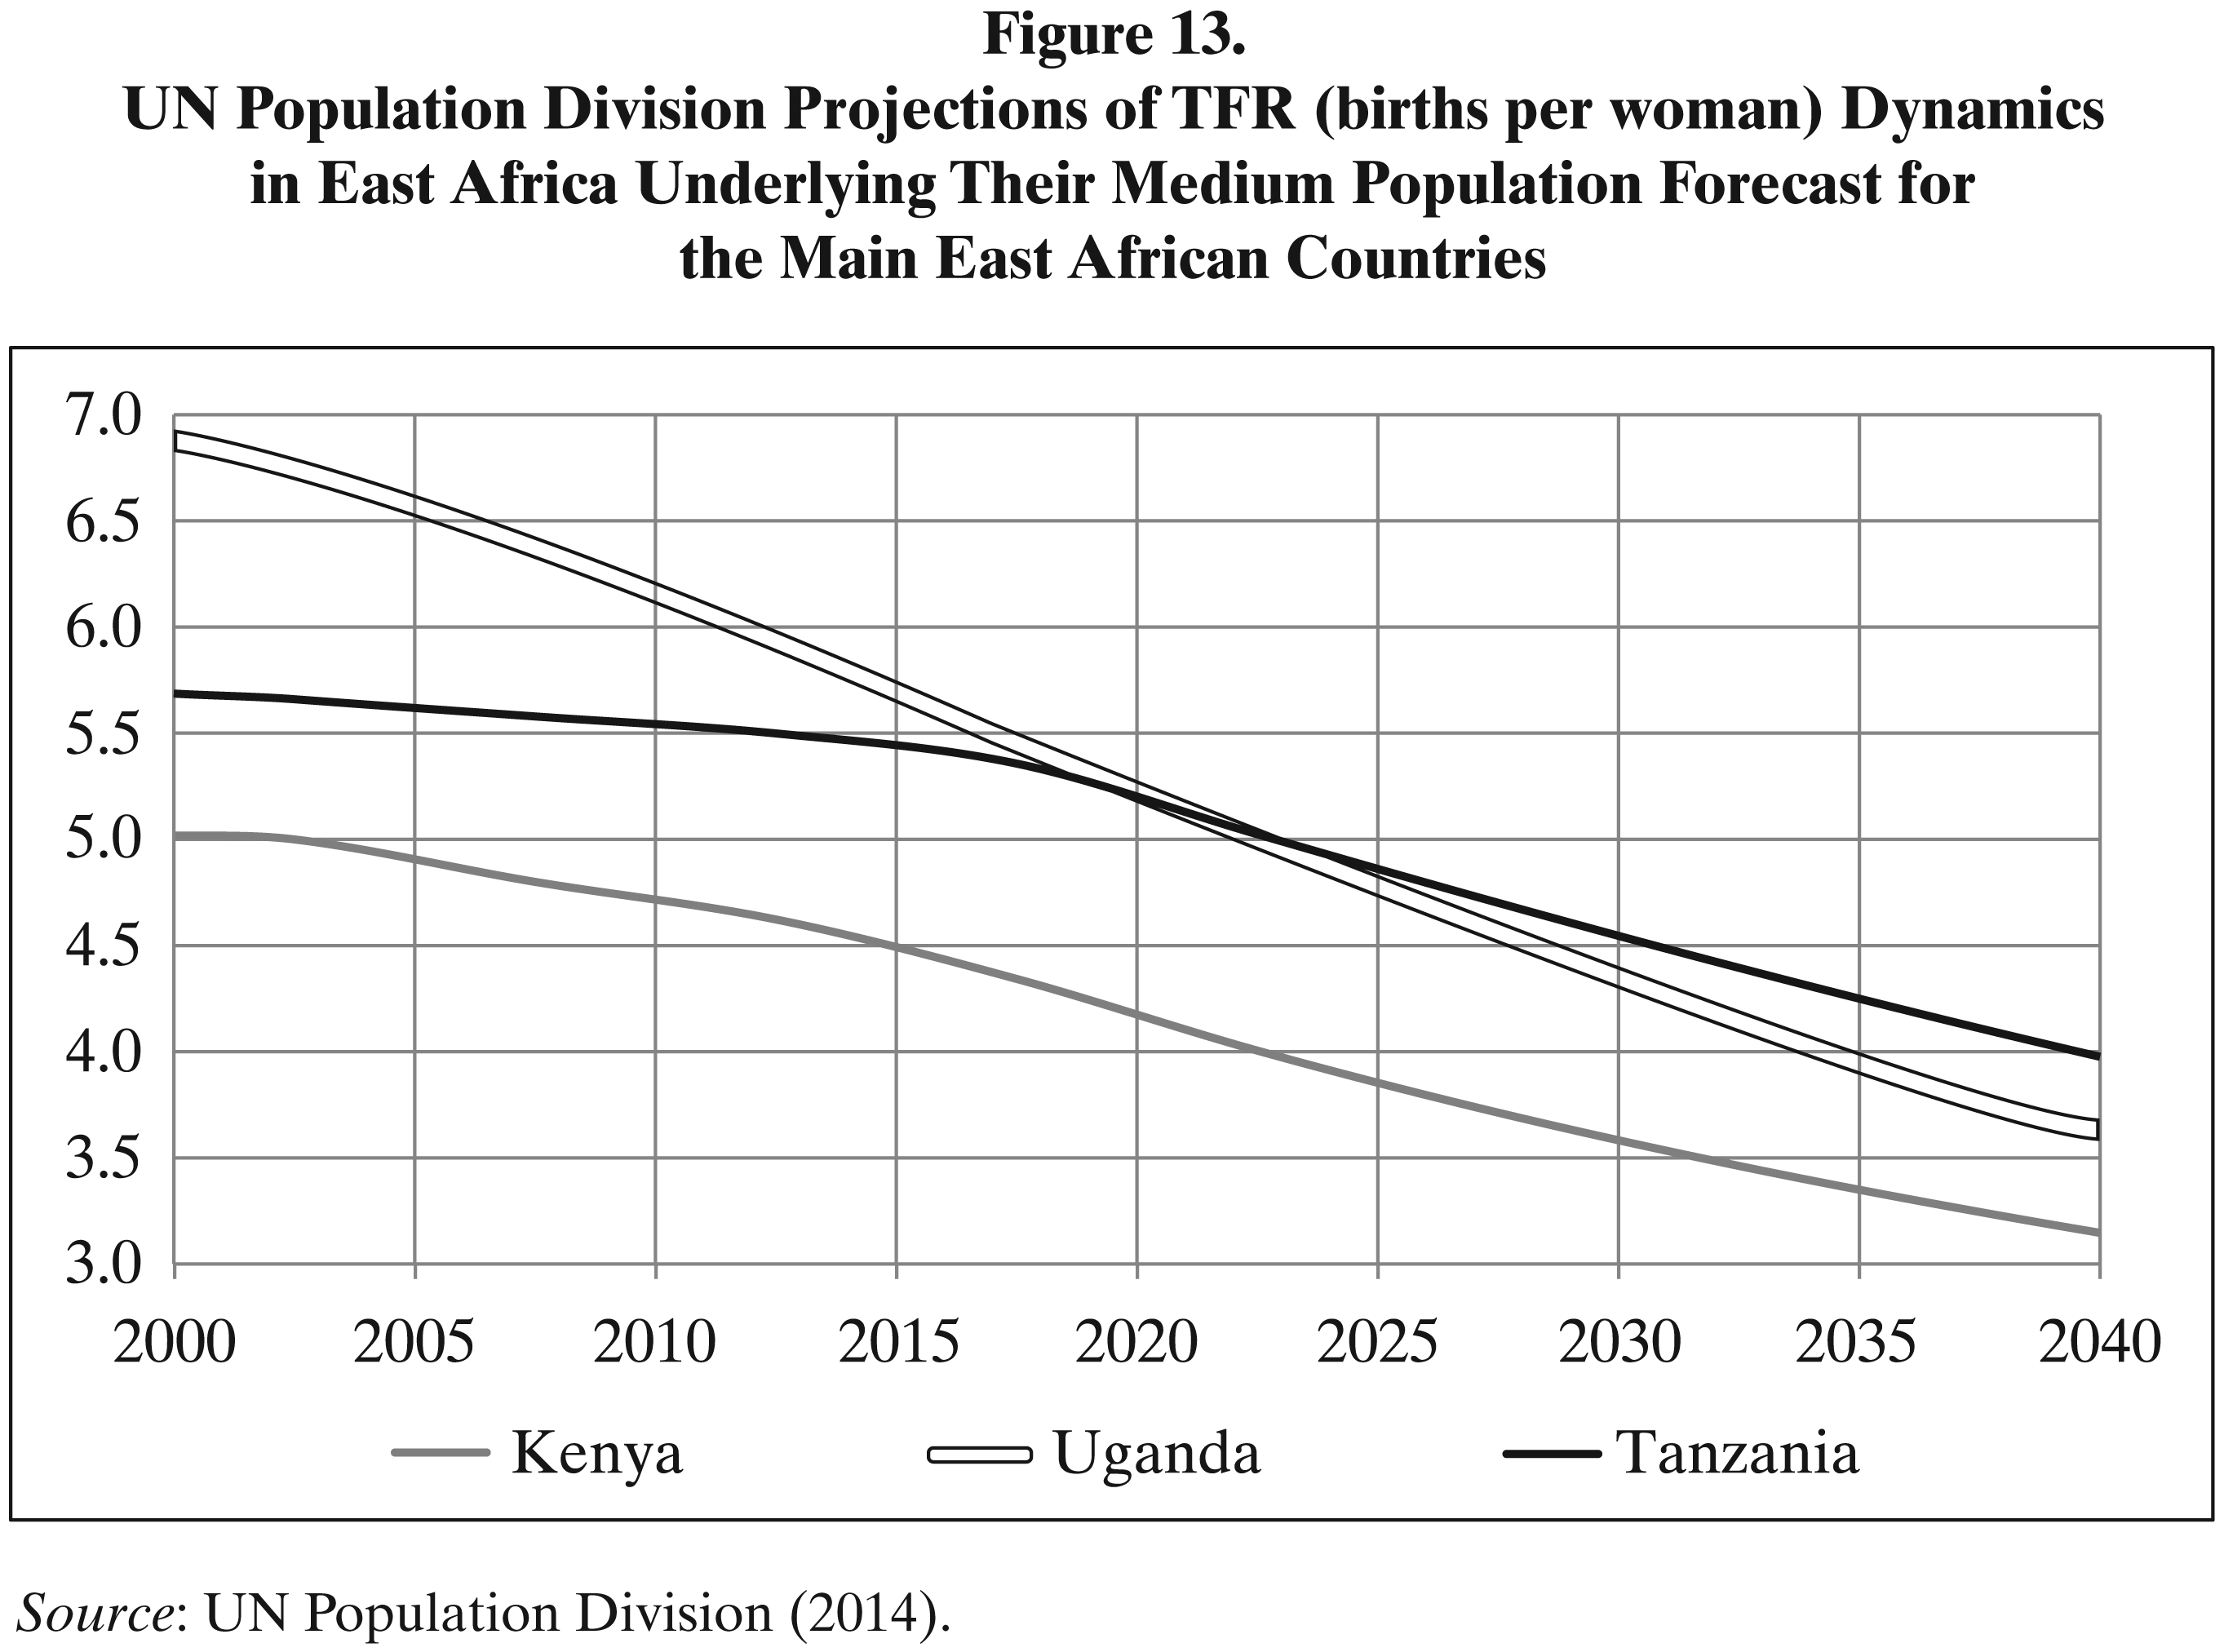
It appears also relevant to consider the recent United Nations (UN) Population Division medium projections for the three main countries of East Africa. Note that those projections are based on the assumption that the fertility decline in East Africa will accelerate in the forthcoming decades (see Figure 13).
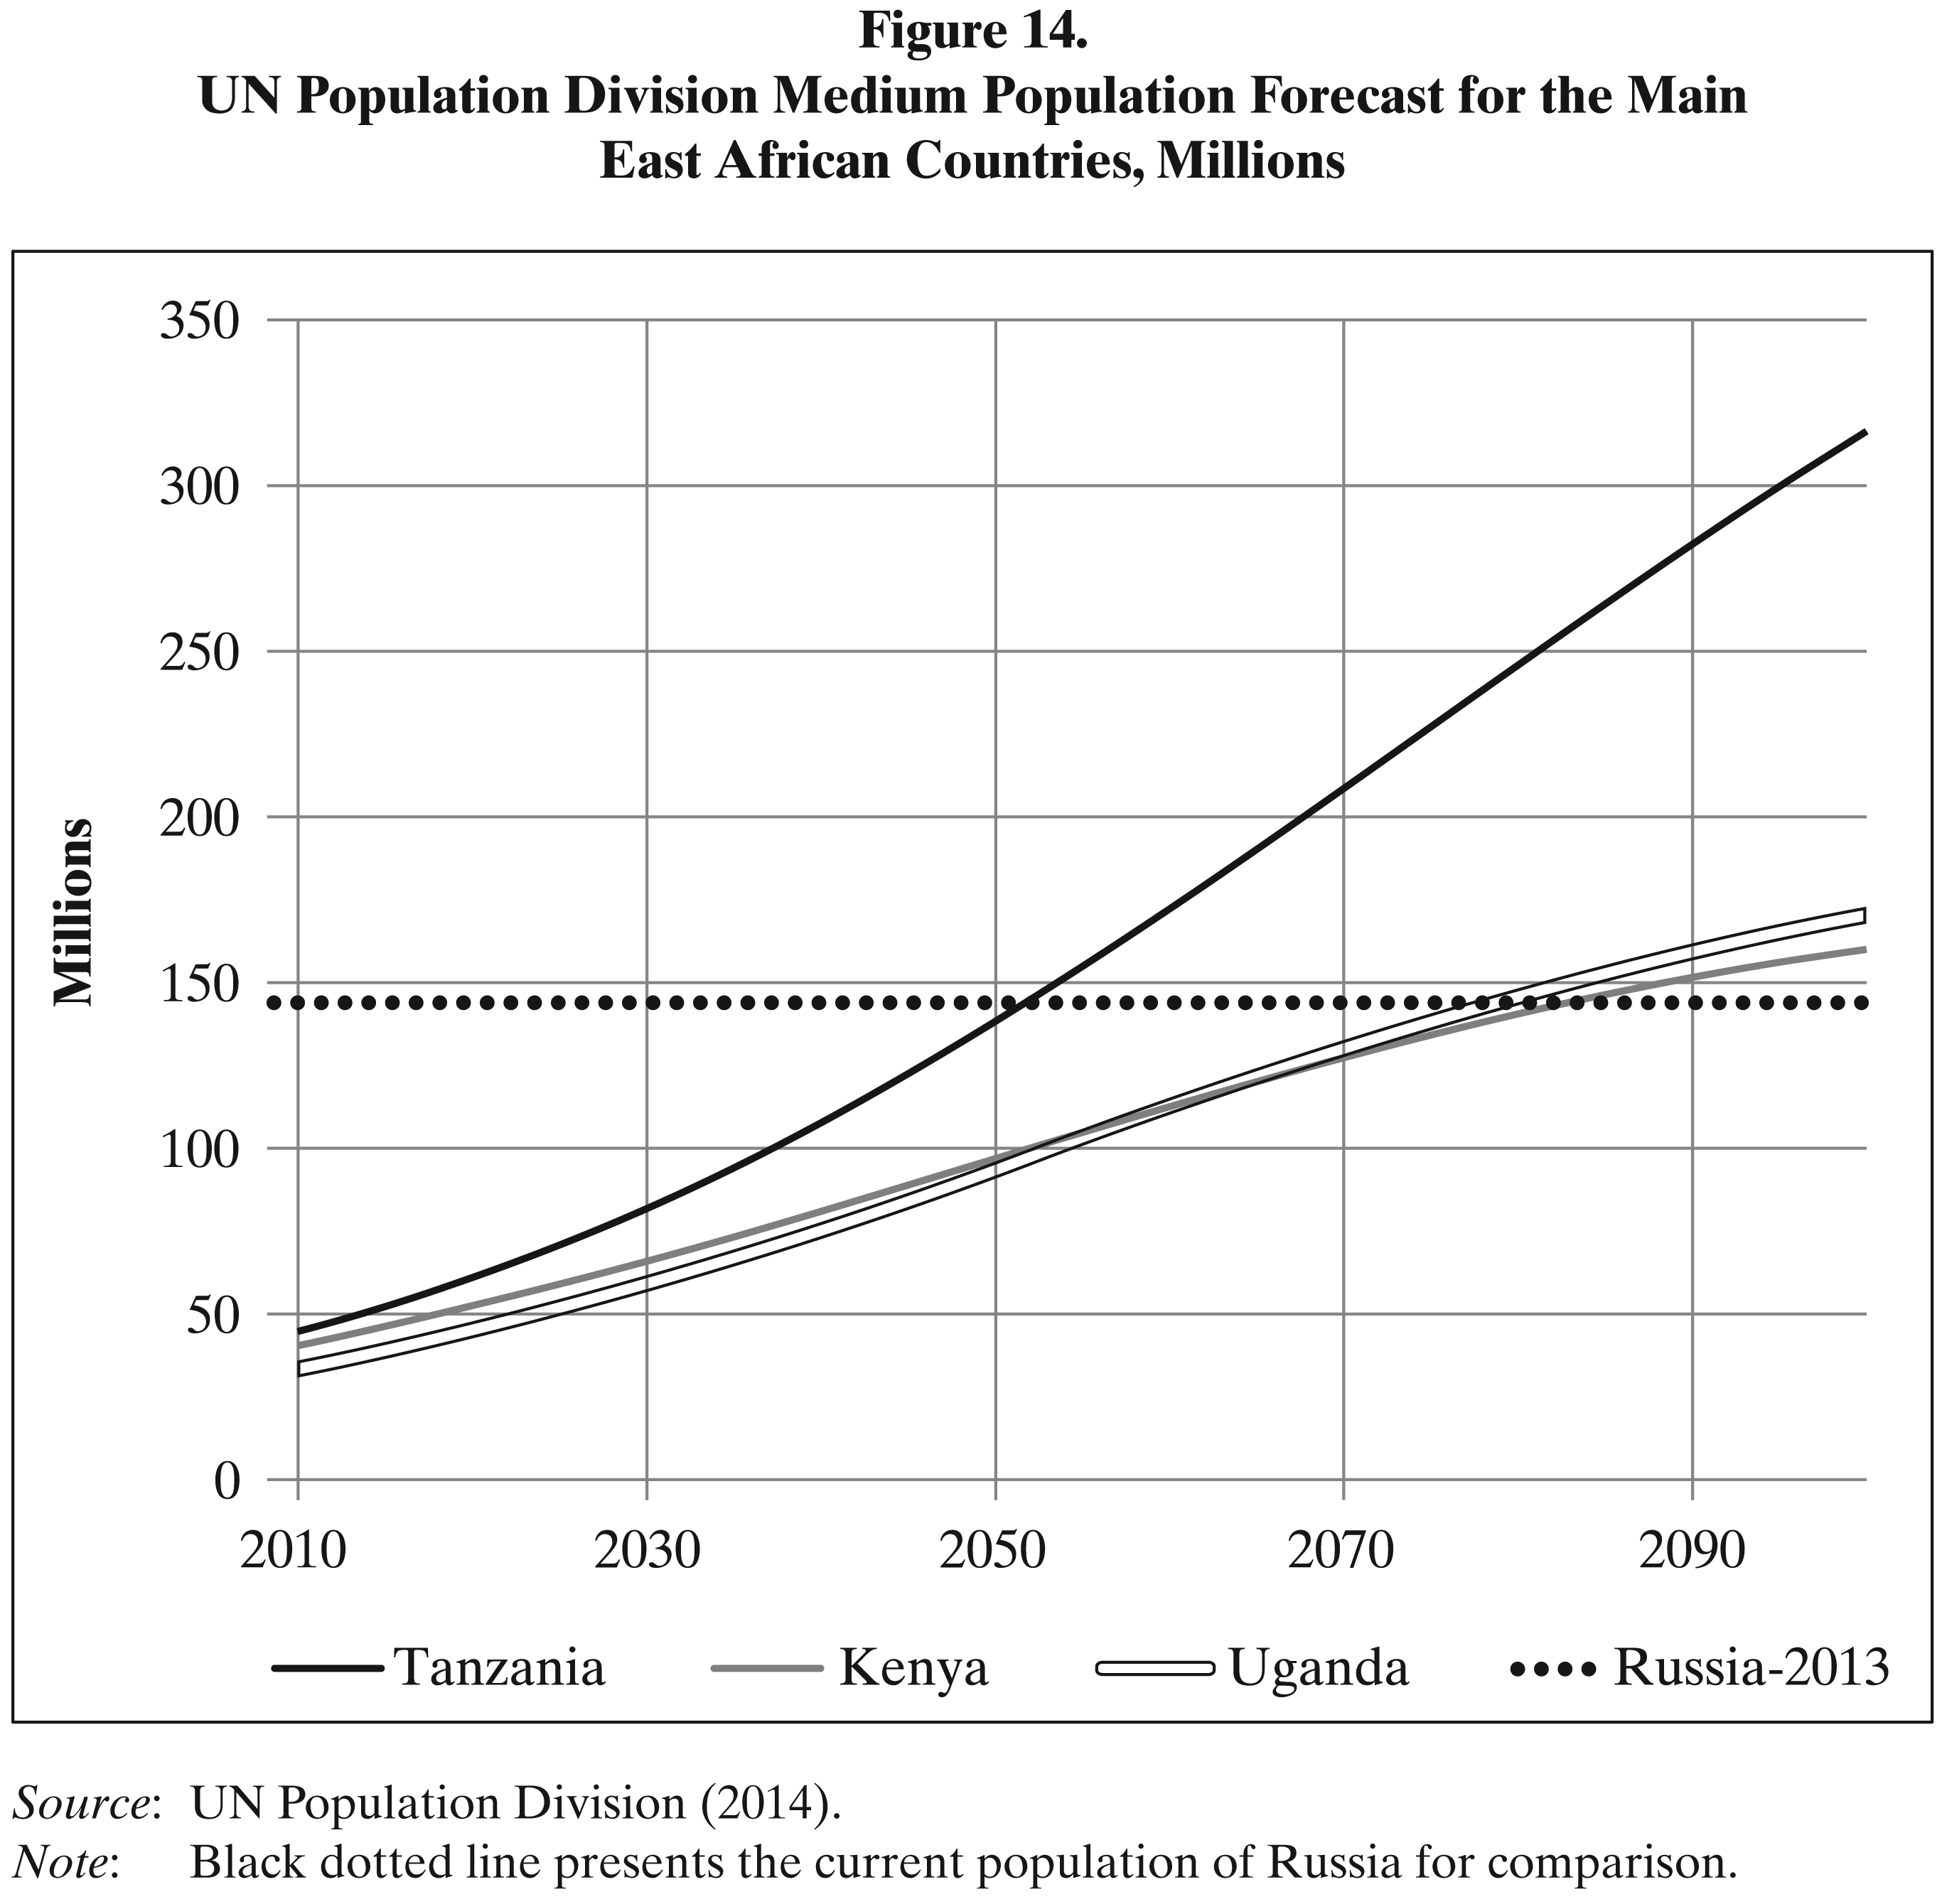
Still these projections forecast the following population dynamics for East Africa (see Figure 14).
As we see, even with the acceleration of fertility decline forecasted by the UN Population Division, the population of Kenya and Uganda will exceed the population of Russia in the second half of the century (for more details on the population forecasts for East Africa, see Zinkina & Korotayev, 2014a, 2014b). Tanzania will reach Russia in terms of population by 2050 and is projected to have twice the Russian population by 2100. Tanzania is almost bound to have the population of Russia, as, according to the estimates of the UN Population Division (2014), the number of children below 5 years of age in Tanzania is already almost the same as in Russia.
Source: UN Population Division (2014).
Note that without more substantial fertility declines (which would imply the introduction of compulsory universal secondary education, serious family planning programs of the Rwandan type [see, e.g., Kinzer, 2007; Lu et al., 2012; WHO, 2008]), and the rise in the legal age for marriage with parent consent), East Africa is likely to face two options if it would like to escape the Malthusian trap:
The first is to move no less than 50 percent of its rural populations to dynamically growing urban sectors (i.e., to increase the urban population proportion growth rate substantially in comparison with what was observed in recent years [see Figure 12]). Note that in conjunction with the UN Population Division projections, this would imply the growth of the urban population in East Africa by about 80 million people by 2050 and by around 160 million people at the end of this century. This would be tantamount to the creation of about 80 new cities each with a population of one million over the next few decades. Most likely, such a scenario would produce an explosive growth of slums, urban overpopulation, social explosions, and so on (cf. Korotayev et al., 2011; Korotayev, Malkov, & Grinin, 2014).
Source: UN Population Division (2014). On the other hand, if in East Africa the current (rather slow) trend of the urban population percentage growth continues, this would imply that the rural population of East Africa (Tanzania + Kenya + Uganda) would be fairly soon five times higher than now. Hence, it appears that it has lost the historical moment when it could follow the “North African” model for escaping the Malthusian trap. Note also that in the most important country of North Africa, in Egypt, the escape from the Malthusian trap did not lead to fertility decline automatically; rather it was furthered through a rather extensive national family planning effort.
Mubarak’s administration was well aware of the threat hidden in the growing gap between declining death rate and high birth rates, and almost from the beginning of Mubarak’s reign (1981) the government started taking measures aimed at bringing down the birth rate (see, e.g., Fargues, 1997, pp. 117–118). However, only in the second half of the 1980s did the government manage to develop a really efficient planned parenthood program. This program was administered by the Egyptian government in collaboration with a United States Agency for International Development (USAID) program aimed at wide-scale introduction and distribution of family planning (Moreland, 2006). Religious leaders (from al-Azhar sheikhs to local imams) were involved in the program to disseminate (in their fatwahs and sermons) the idea that family planning was not adverse to al-Qur’an; on the contrary, it is good, as having less children makes it easier for the parents to give them a happy childhood and good education (Ali, 1997). This strategy proved essentially effective, as during 5 years (1988–1992) total fertility rate in Egypt fell from five to four children per woman.
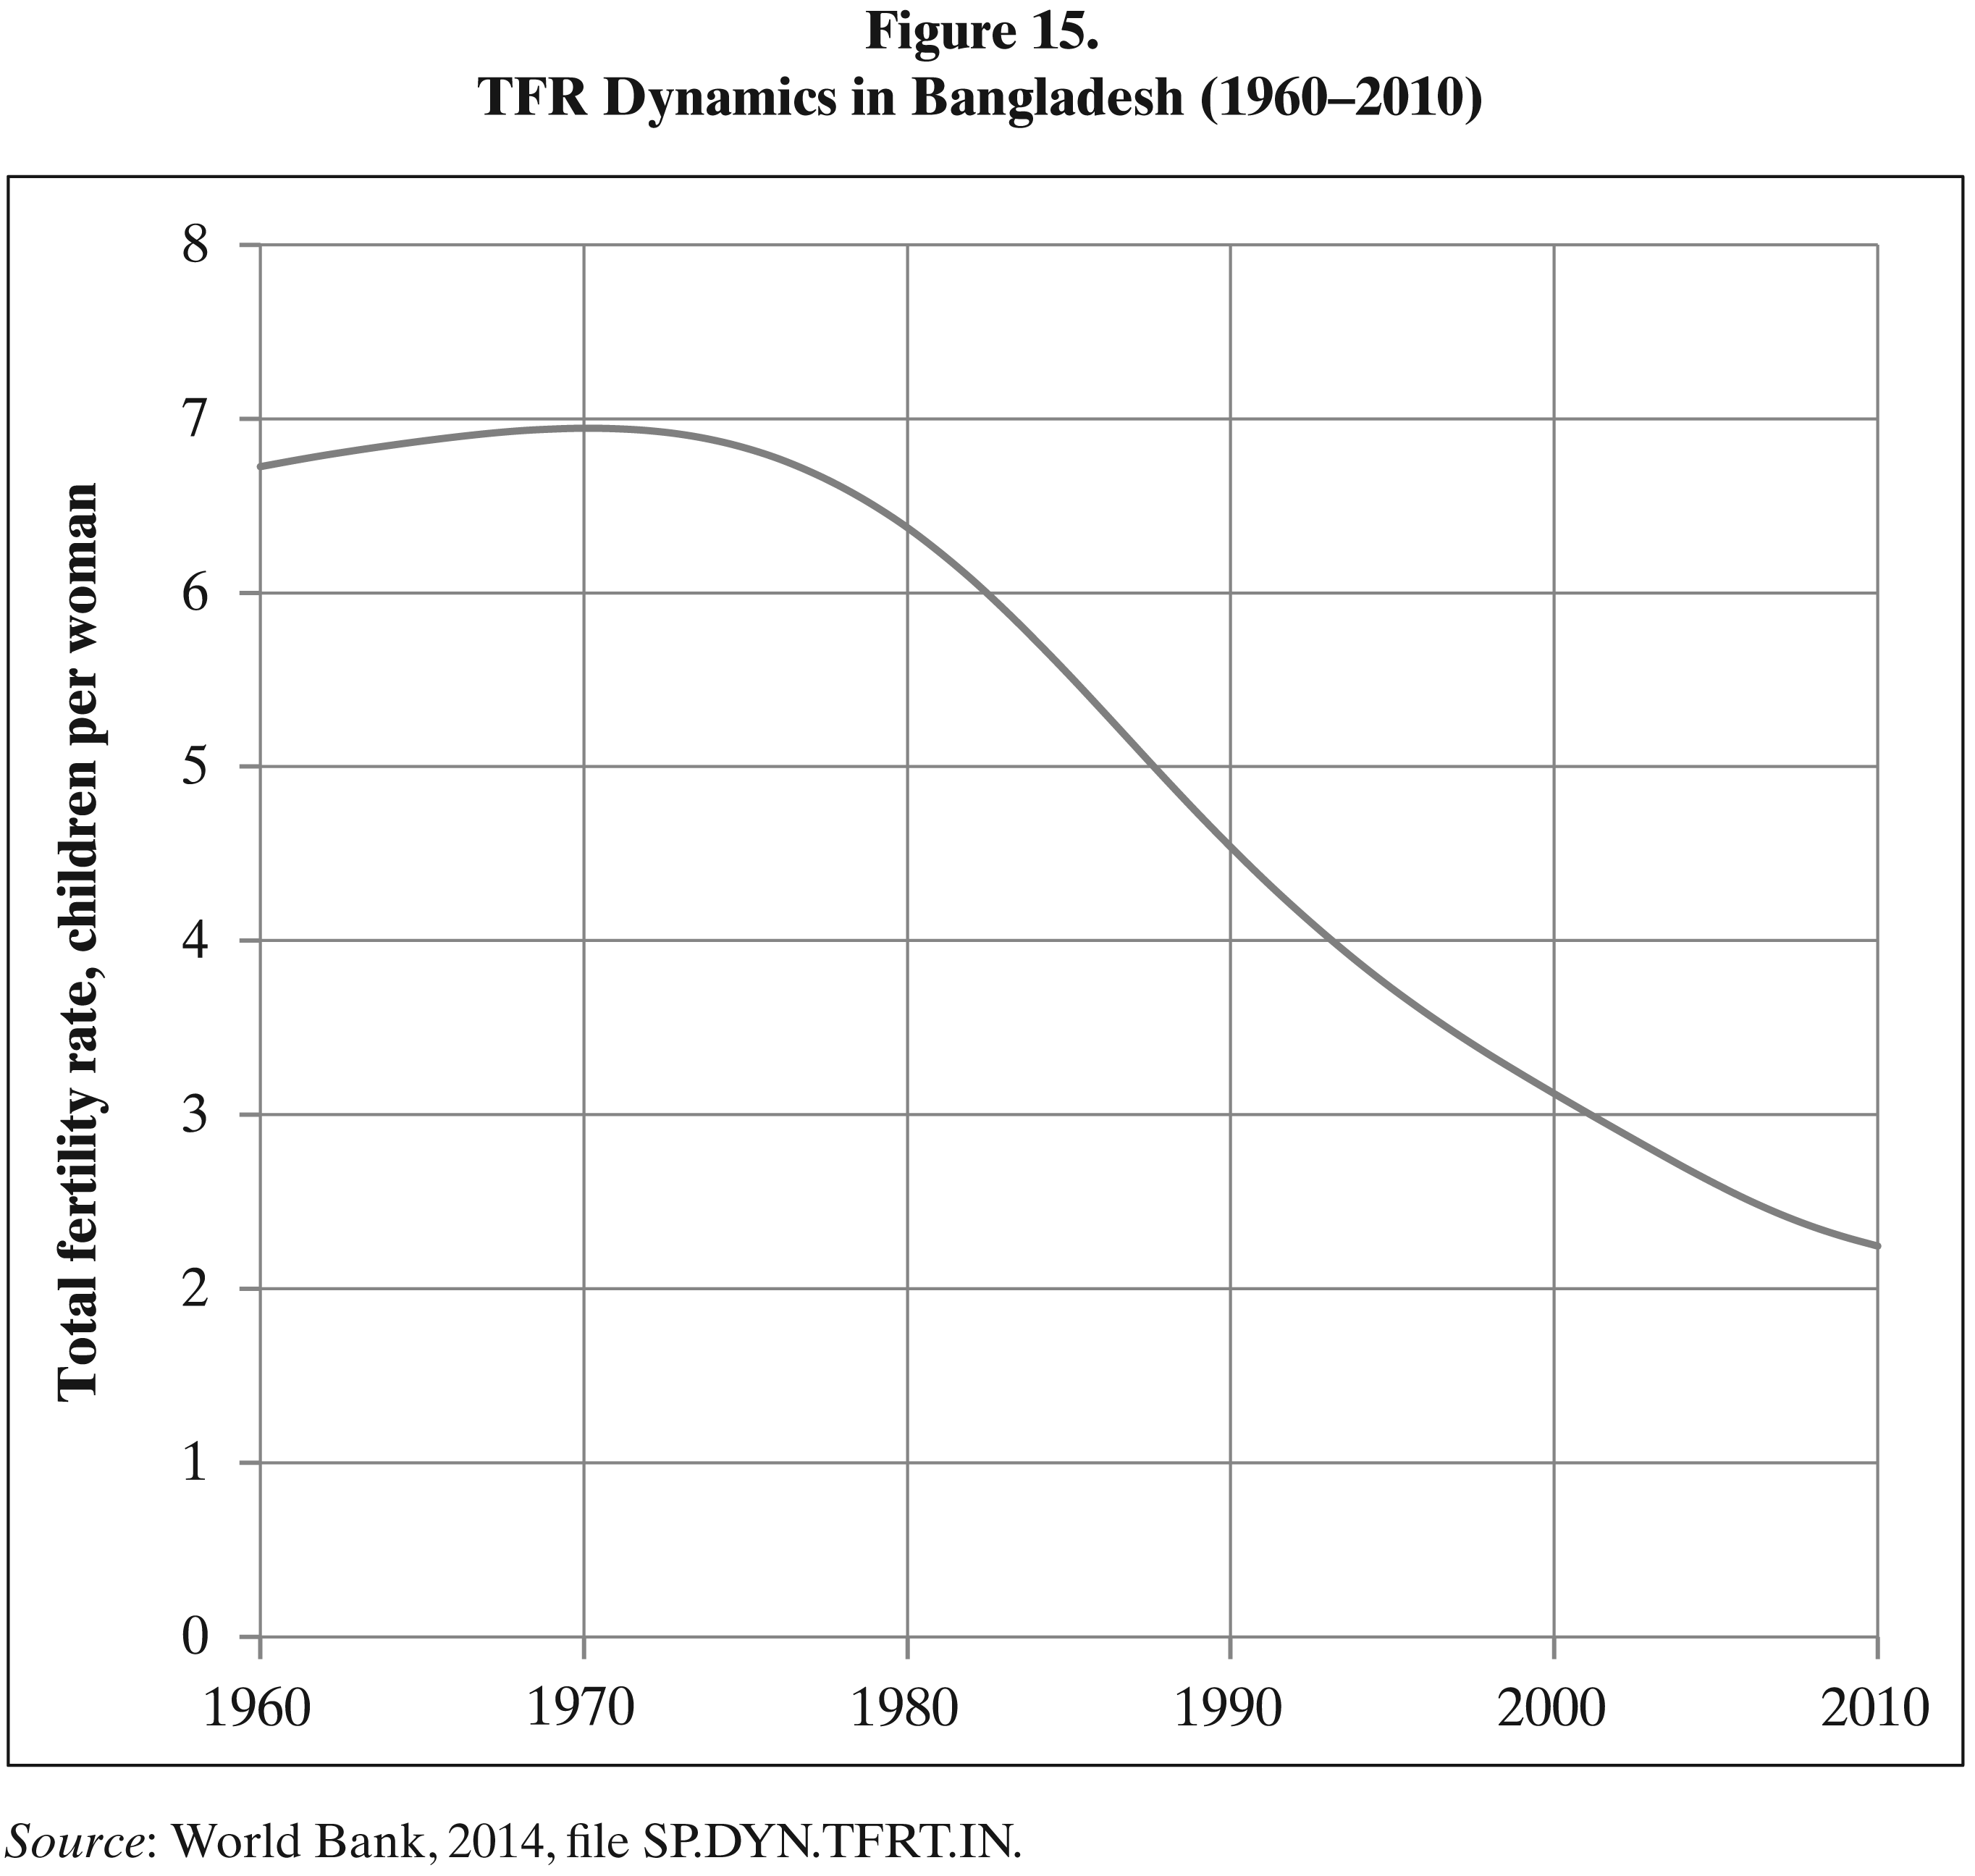
One may wonder if East Africa should instead follow the “Bangladeshi scenario.” In Bangladesh, the fertility decline “preceded” the start of successful development. Successful development only started when, in the 1990s, Bangladeshi TFR fell below four children per woman (due to implementation of rather effective family planning programs [see, e.g., Bongaarts & Sinding, 2009; Phillips et al., 1982]). Before that Bangladesh followed the “East African path” – very fast population growth “ate” almost all the GDP growth. Note that while the Bangladeshi GDP doubled between 1970 and 1995 (i.e., a 25-year period), per capita GDP remained almost the same. By contrast, after Bangladesh had managed to bring TFR below 4, the per capita GDP in this country increased in 15 years by about 100 percent (see Figures 15 and 16).
Source: World Bank, 2014, file SP.DYN.TFRT.IN.
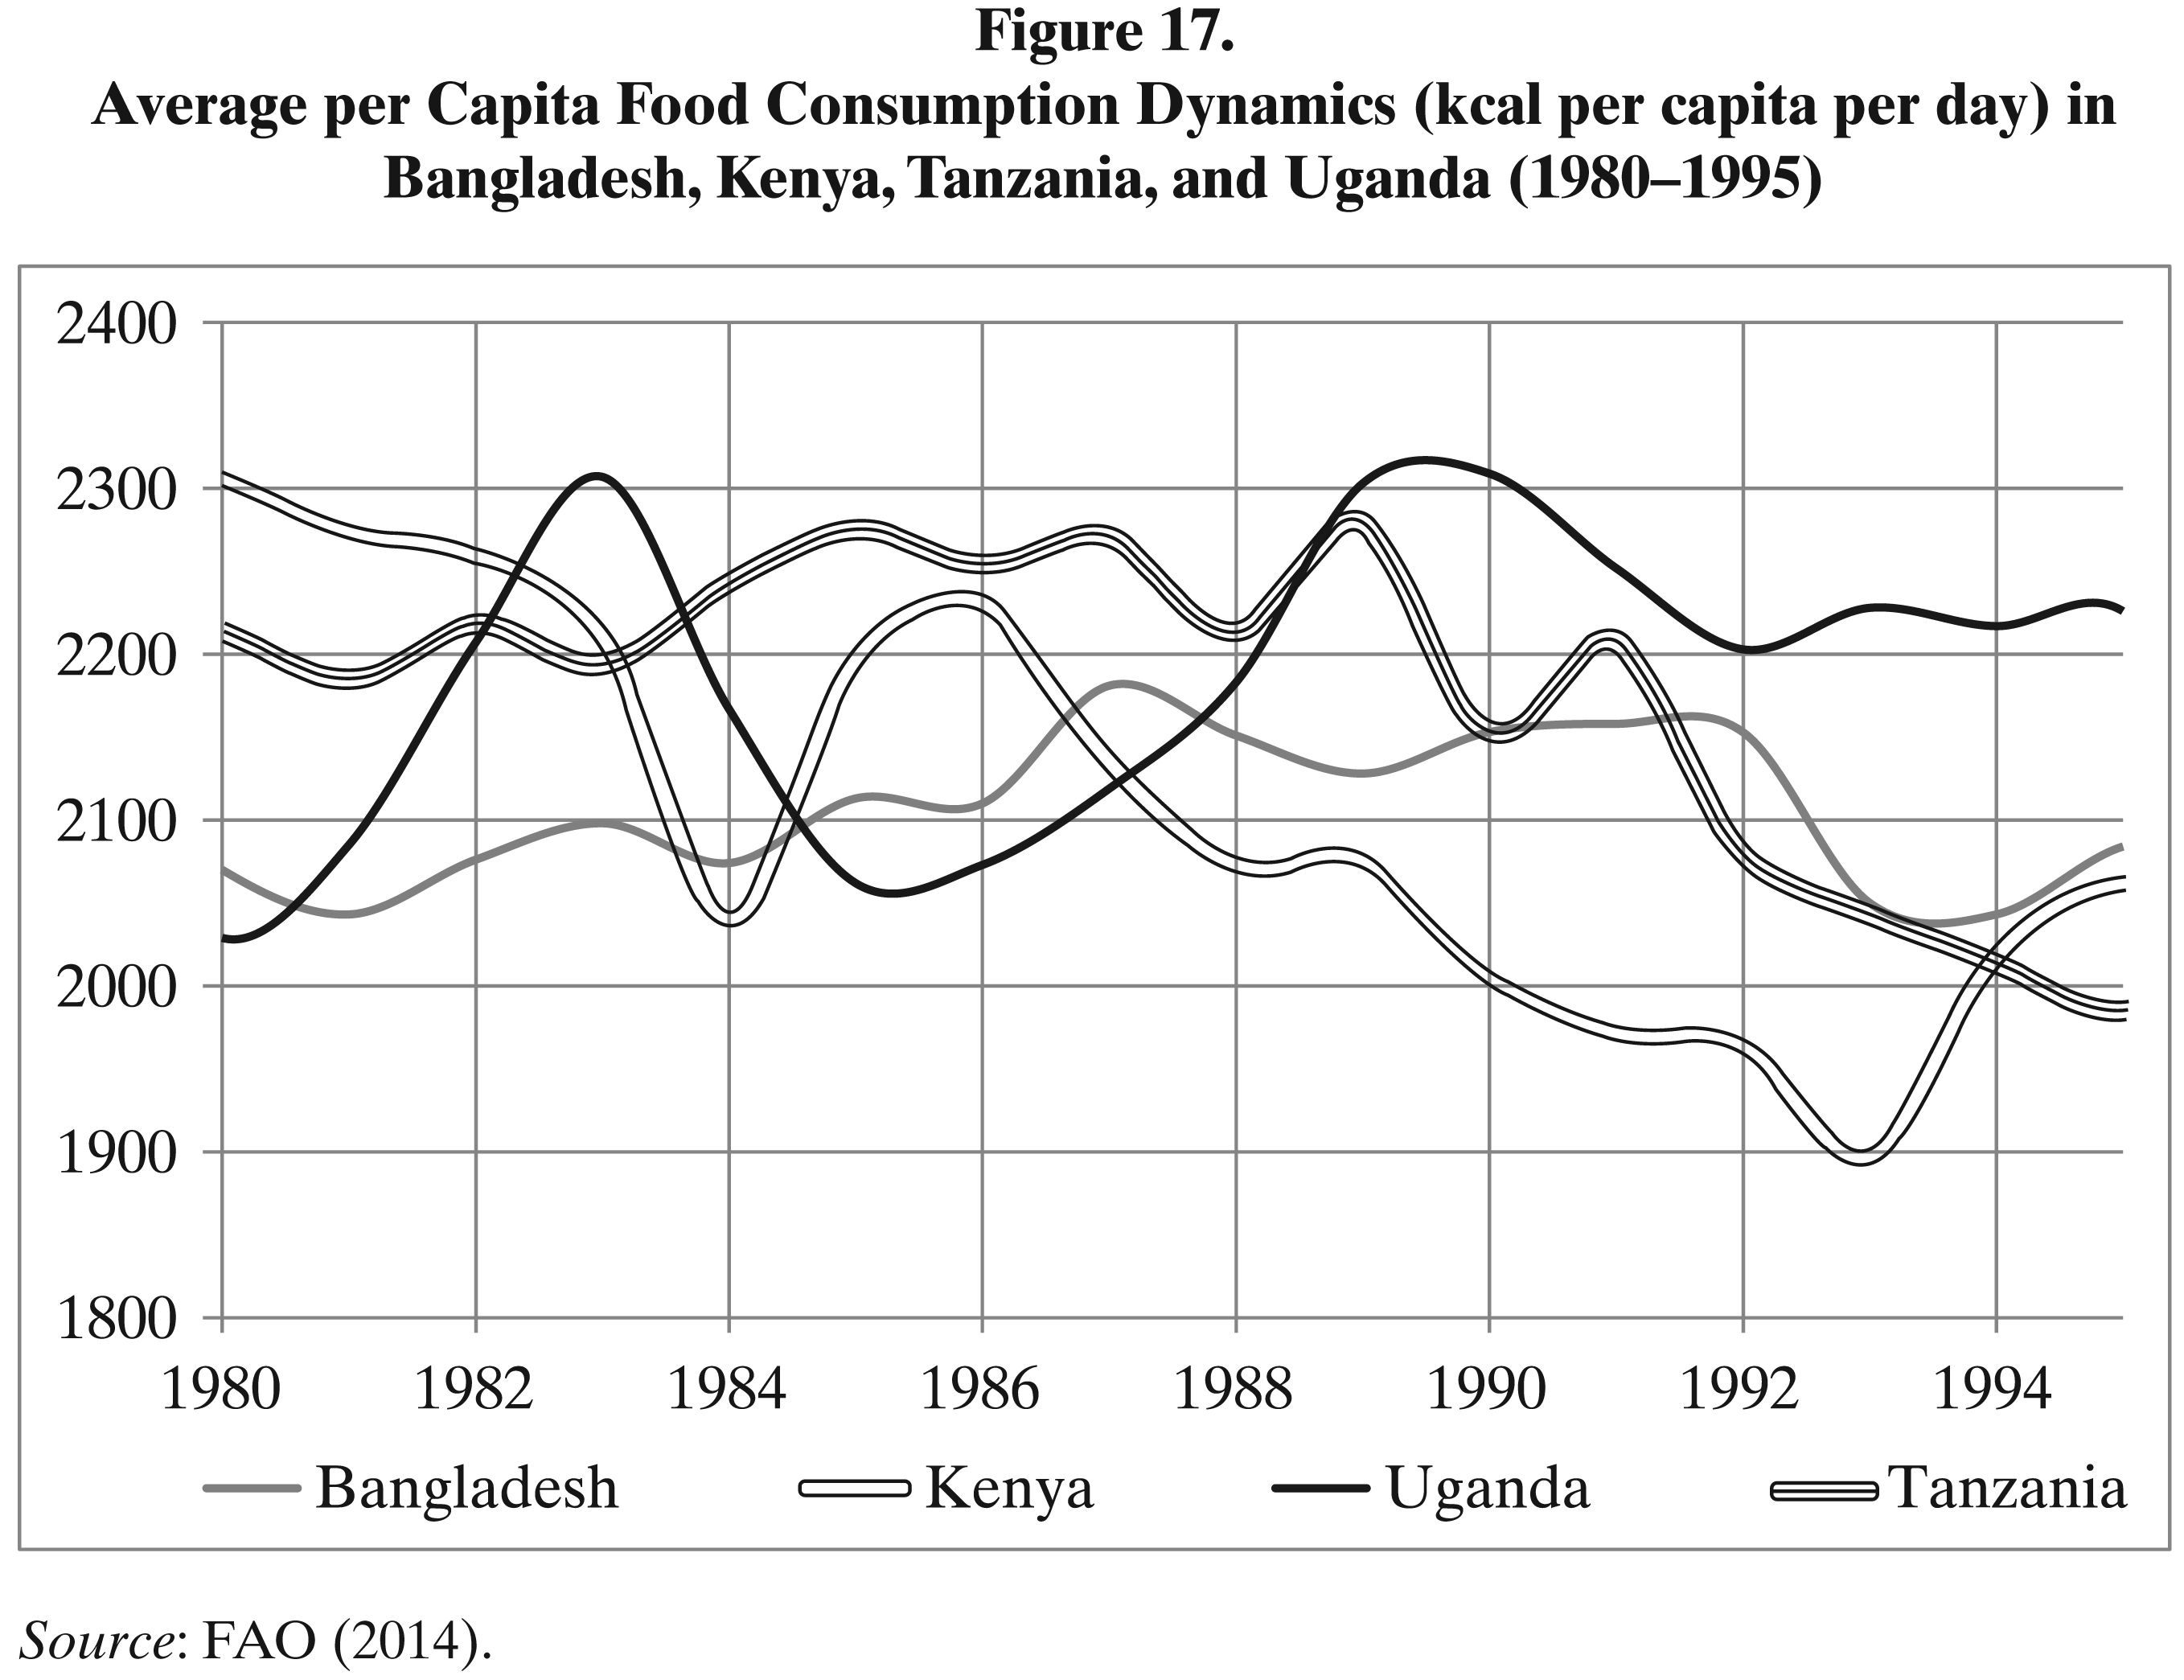
Still there was an appreciable (albeit very slow) growth of per capita GDP in Bangladesh in 1980–1995. However, this growth failed to be translated into a significant improvement in the life of the majority of the Bangladeshi population, which is evidenced by the dynamics of average food consumption which remained at a very low level during this period. This pattern is typical for Tropical African countries caught in the Malthusian trap and it did not exhibit any tendency to increase (i.e., also rather characteristic for this type of countries) (see Figure 17).
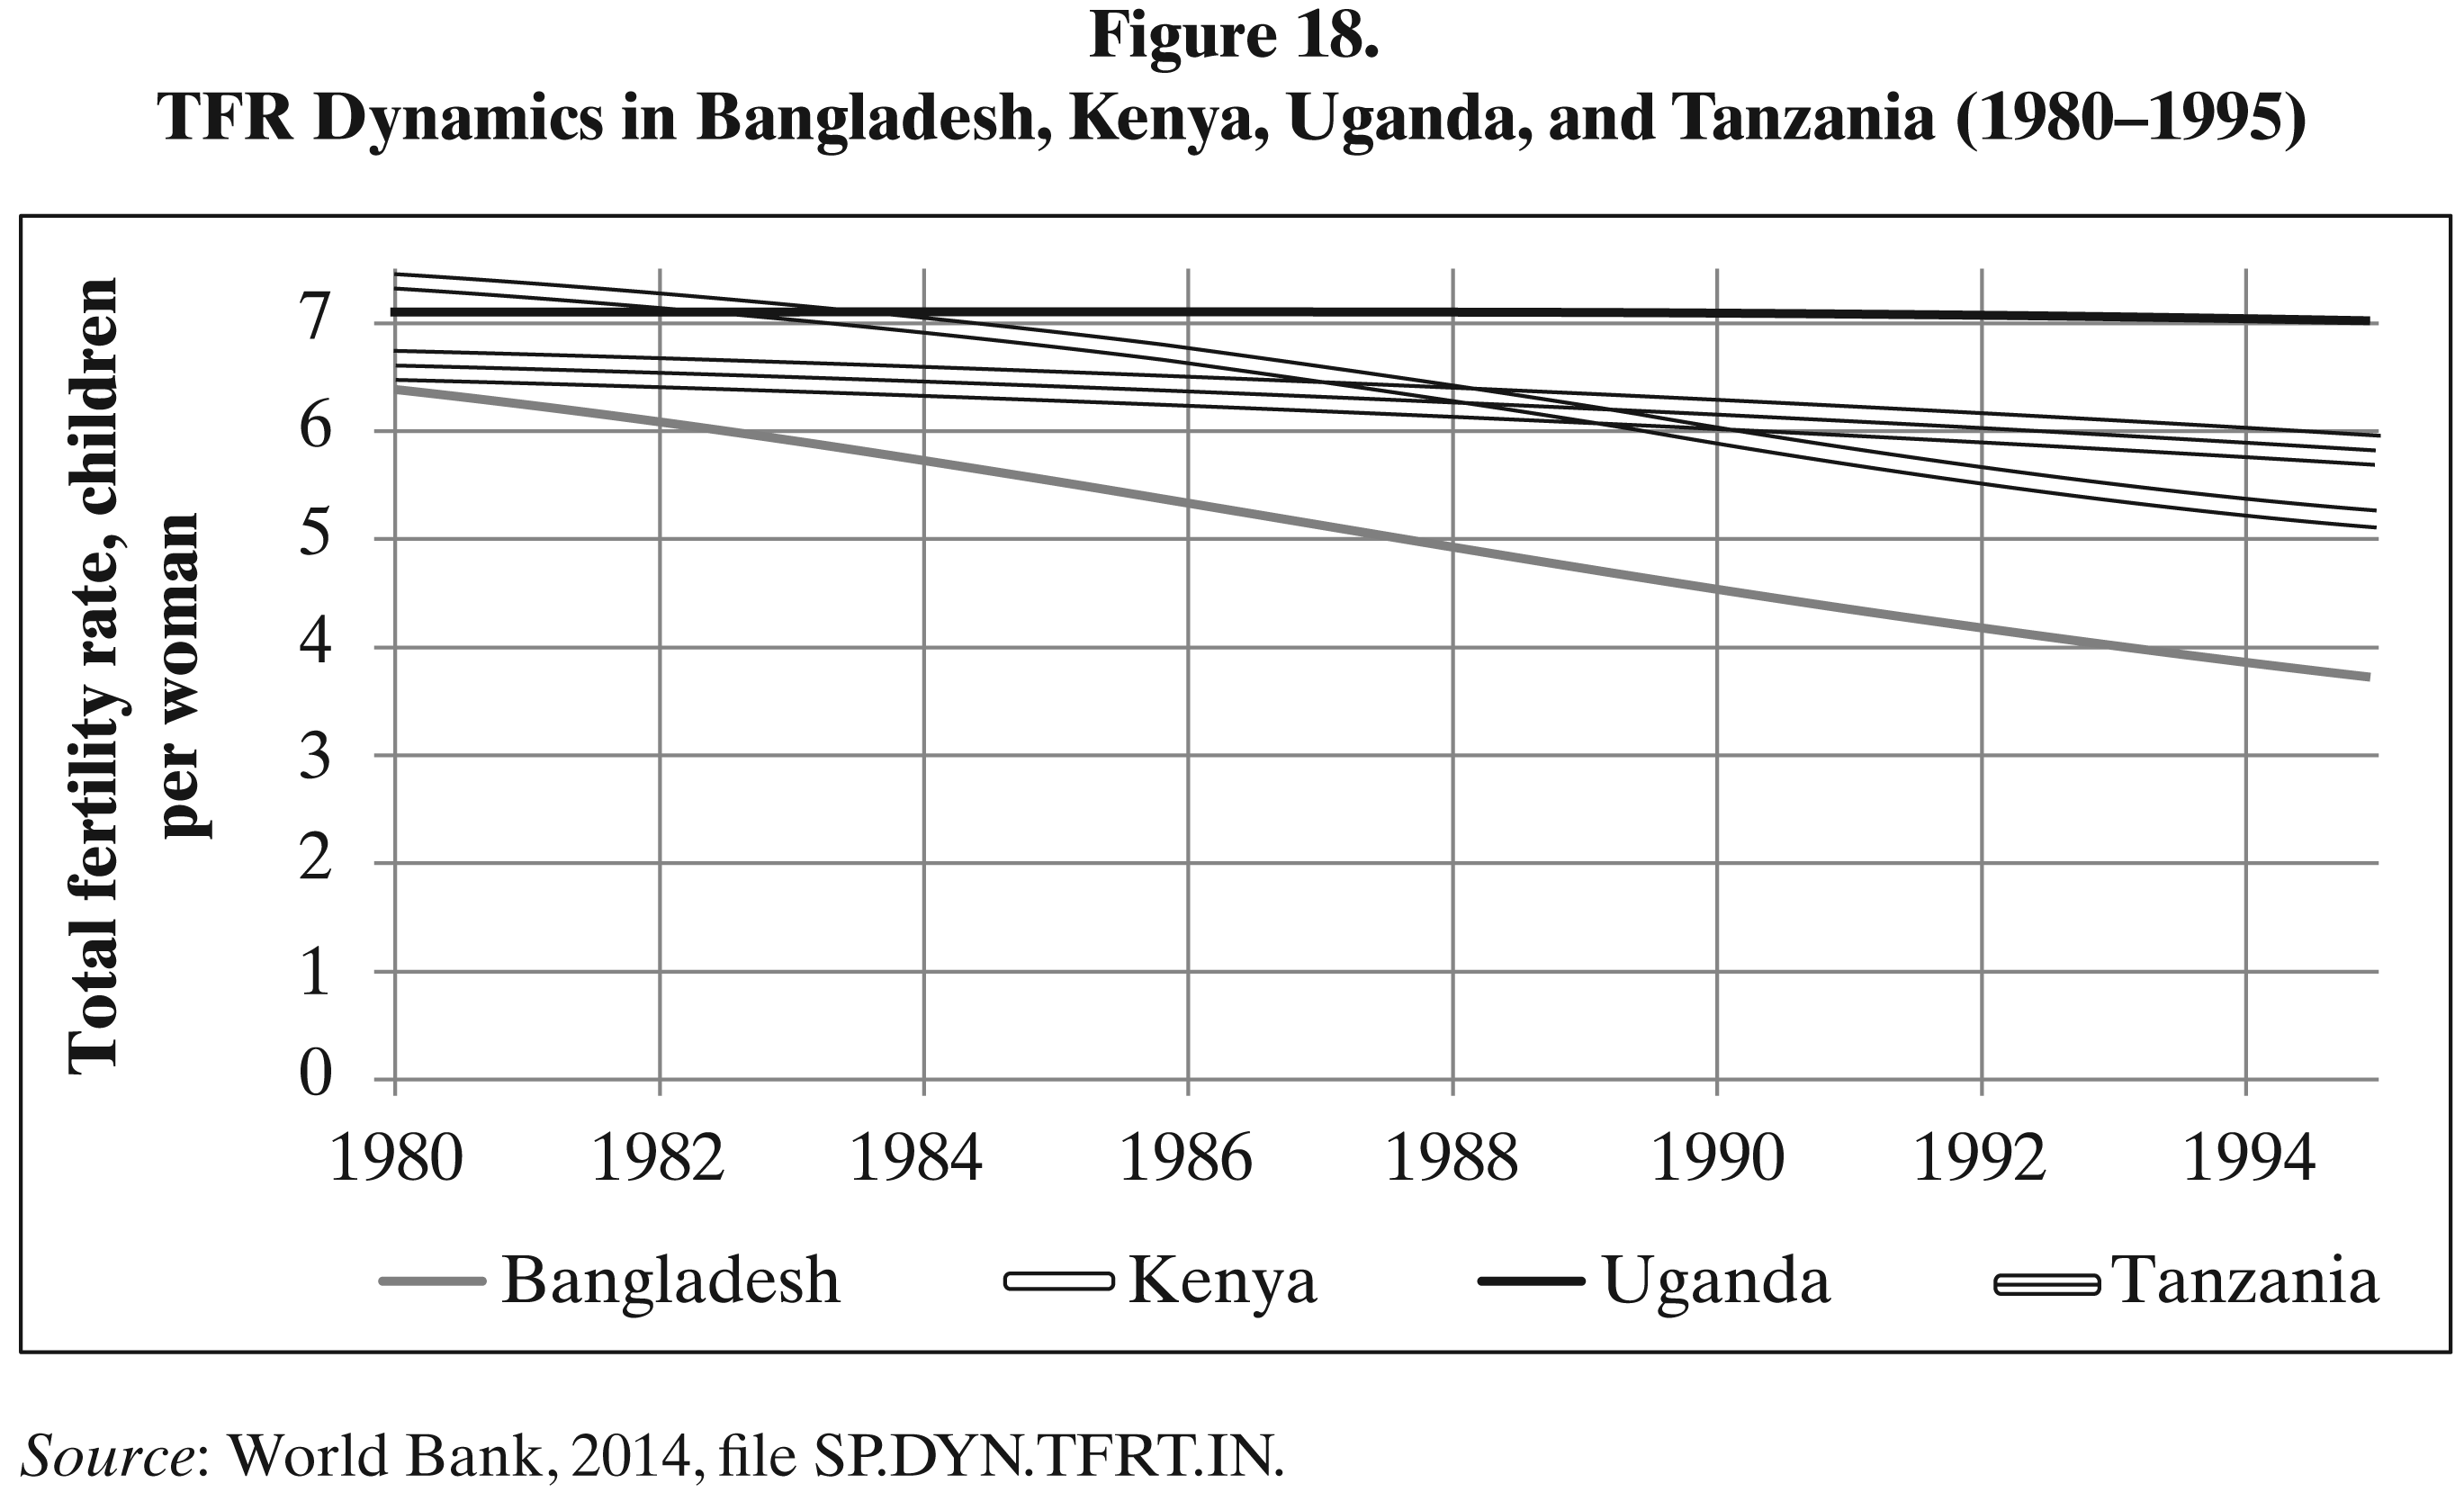
Thus, when fertility in Bangladesh remained close to Tropical African levels (see Figure 18), average per capita food consumption levels also remained extremely close to Tropical African ones (see Figure 17).

Source: World Bank, 2014, files SP.POP.TOTL, NY.GDP.MKTP.PP.KD.
Source: FAO (2014).
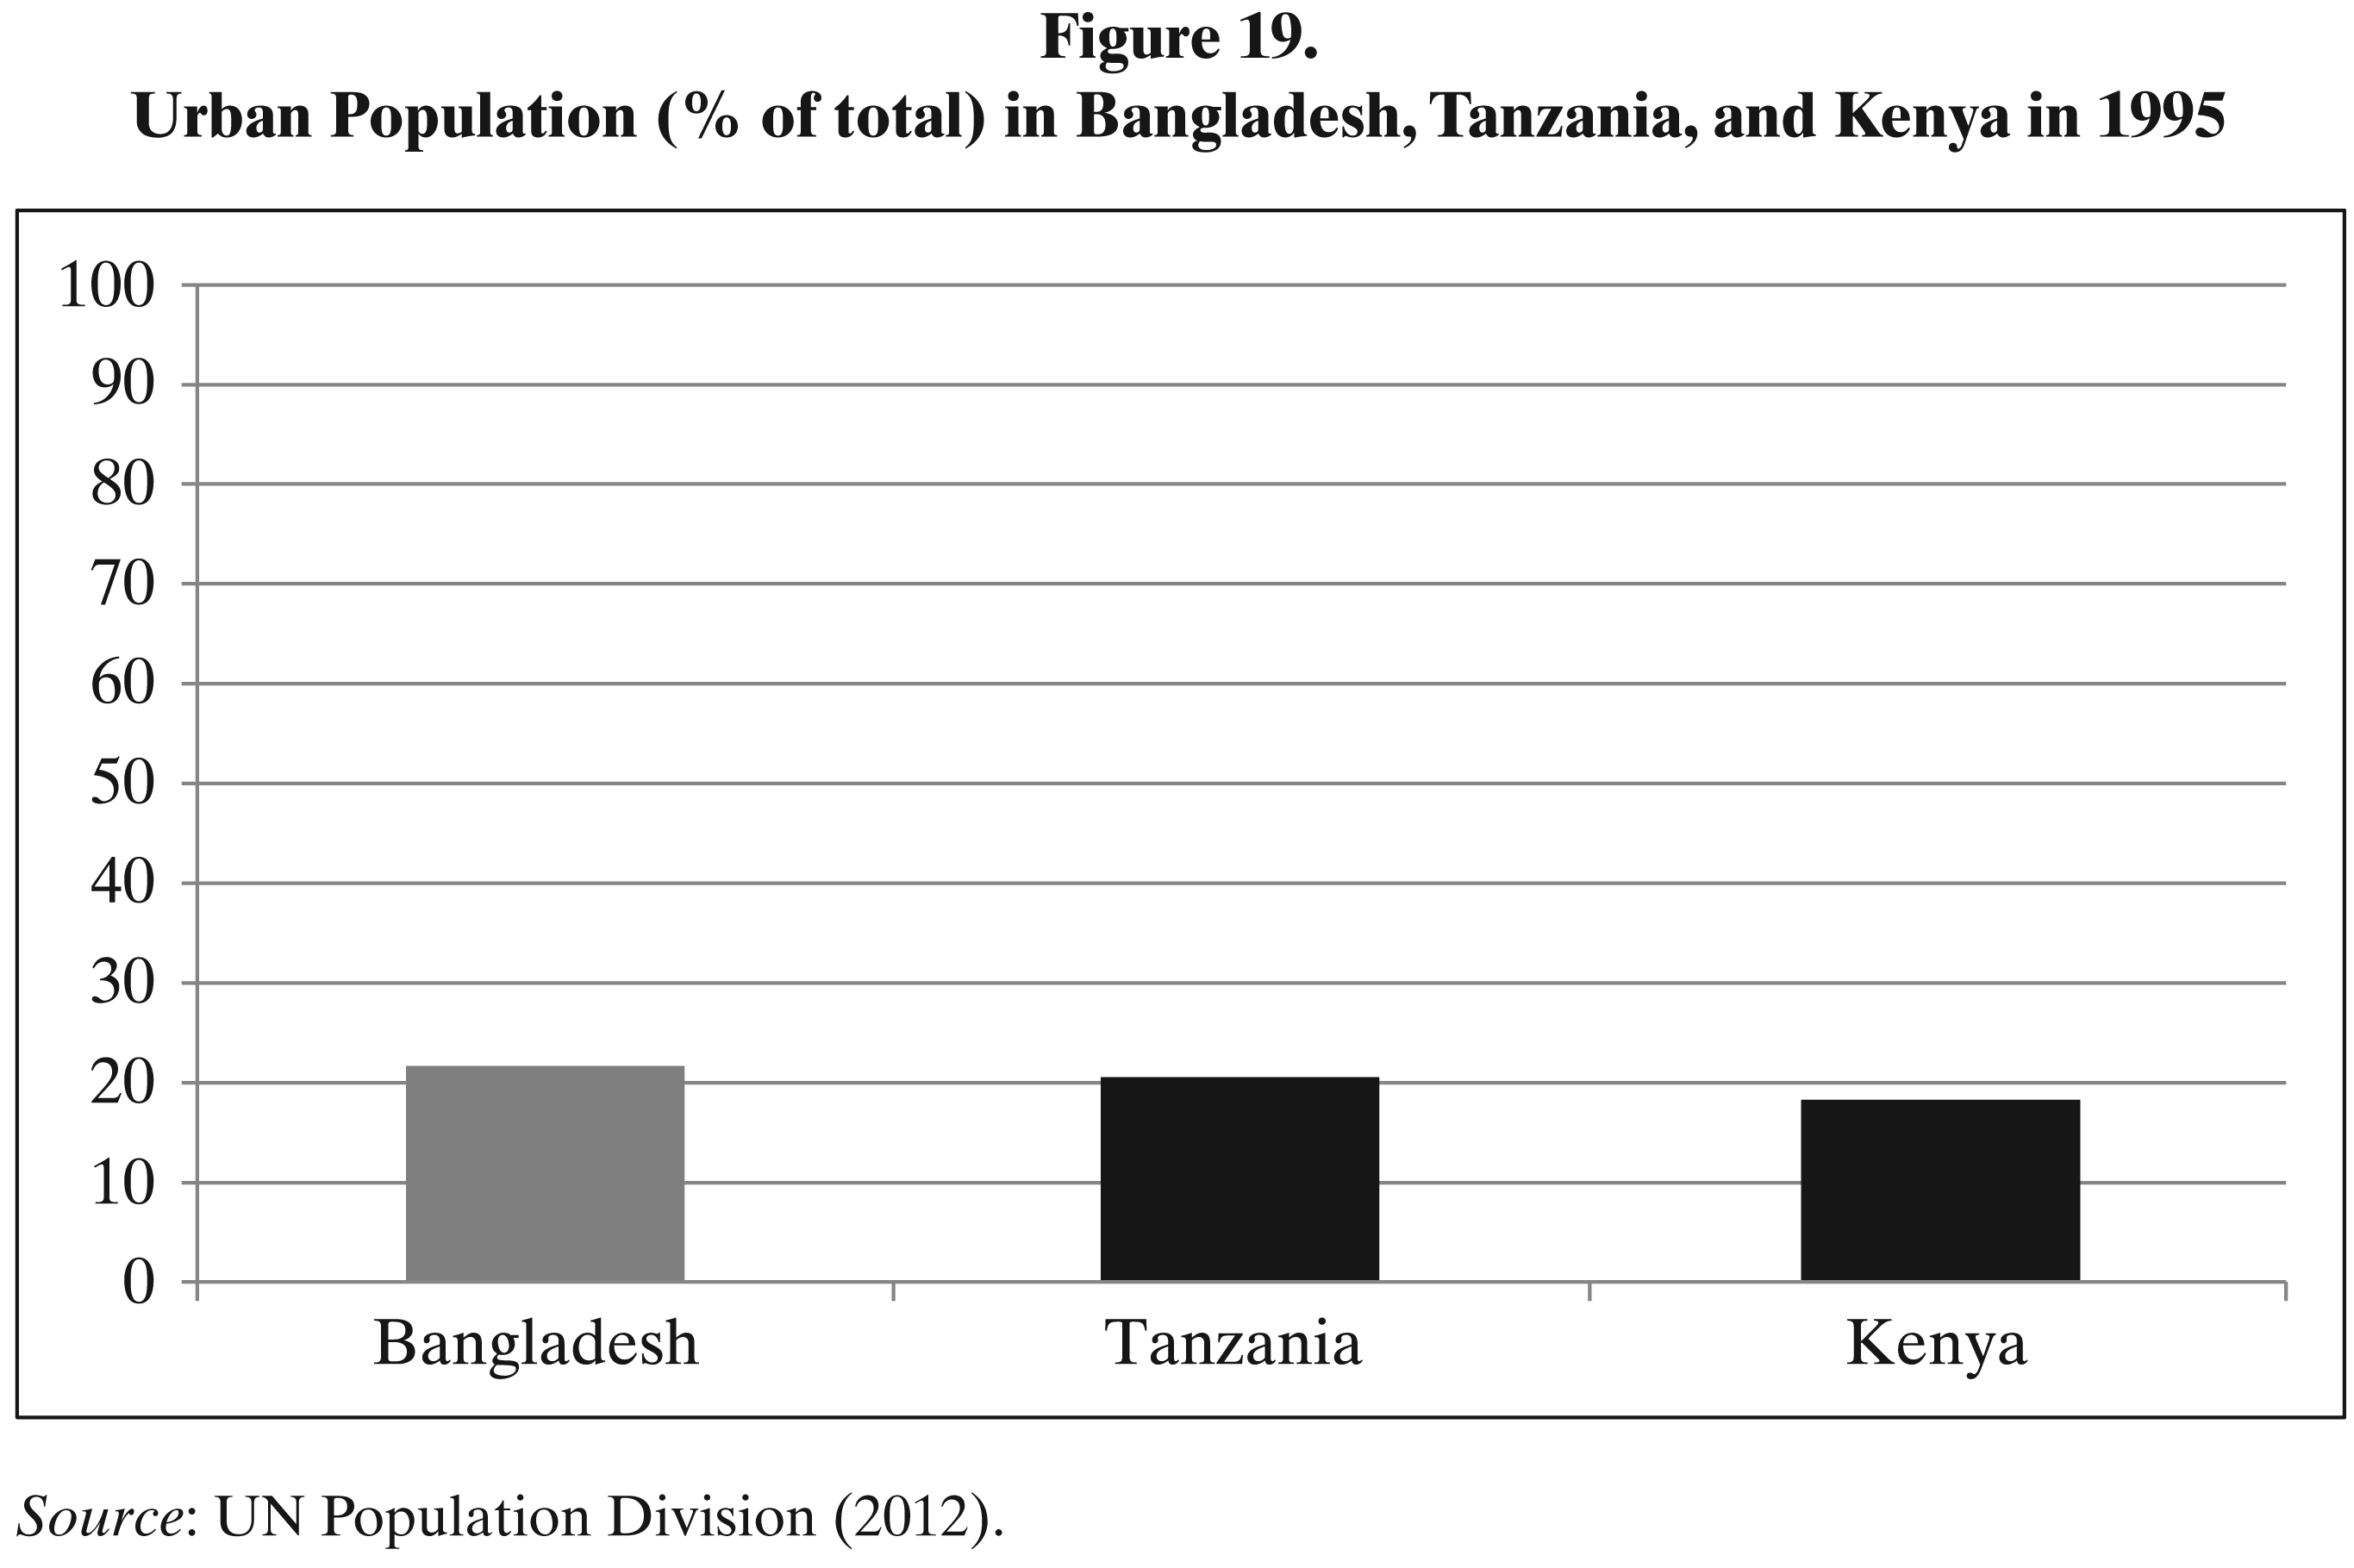
But why did the average per capita food consumption in Bangladesh stall against the background of quite visible growth of per capita GDP in those years (between 1980 and 1995)? The point is that this growth was achieved through an increase in productivity in the nonagricultural sectors of the economy – that is, in industry, construction, transportation, trade, financial sector, and so on. However, one should take into account that at that time a rather small minority of the Bangladeshi population lived in cities (the same was true for the East African countries as well [see Figure 19]) – note that the overwhelming majority of the population is still rural both in Bangladesh and in Tropical African countries in question (see Figure 20).
Source: World Bank, 2014, file SP.DYN.TFRT.IN.
Source: UN Population Division (2012).
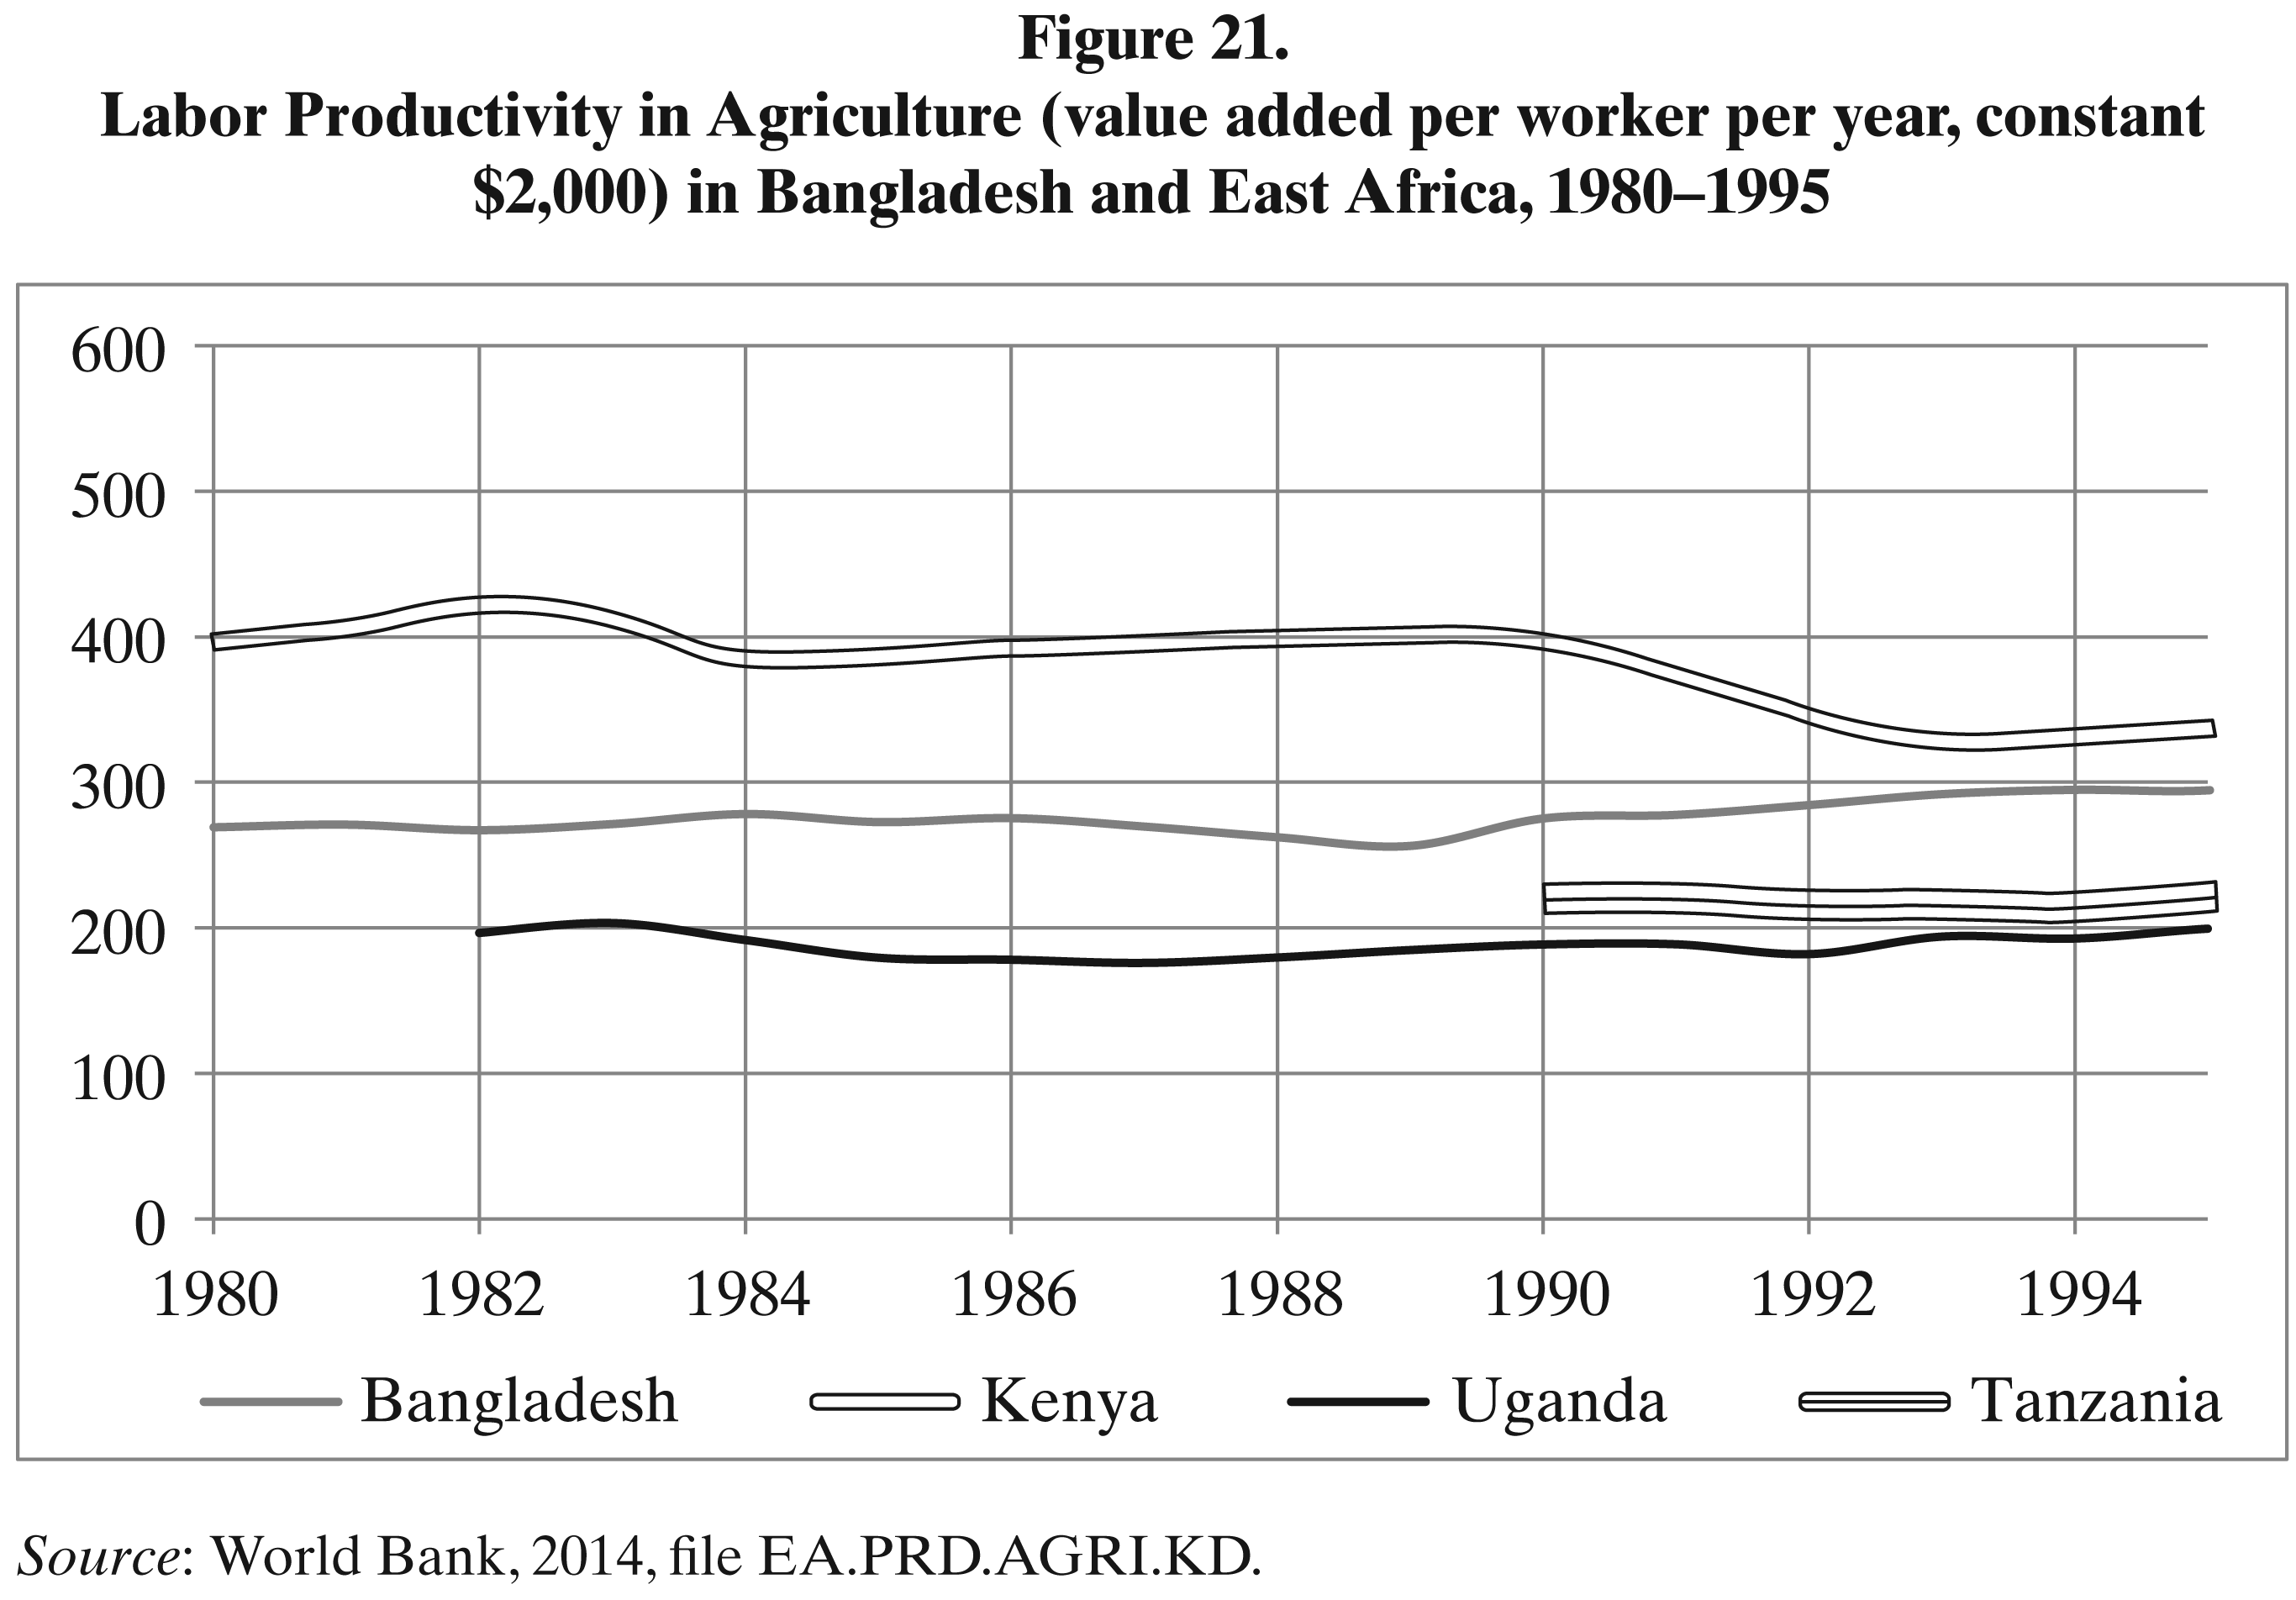
Against this background, it is highly important to notice that in 1980–1995 one could observe a stall of the productivity of labor in agriculture – it was not only very low (quite comparable with its contemporary levels in Tropical African countries still caught in the Malthusian trap); what is more, it hardly grew during the period in question. It is quite clear that the growth in productivity of agricultural labor during this period was blocked by explosive growth of rural population and that this was the main cause for a stall in the growth of the average per capita food consumption (see Figure 21).

Source: UN Population Division (2012).
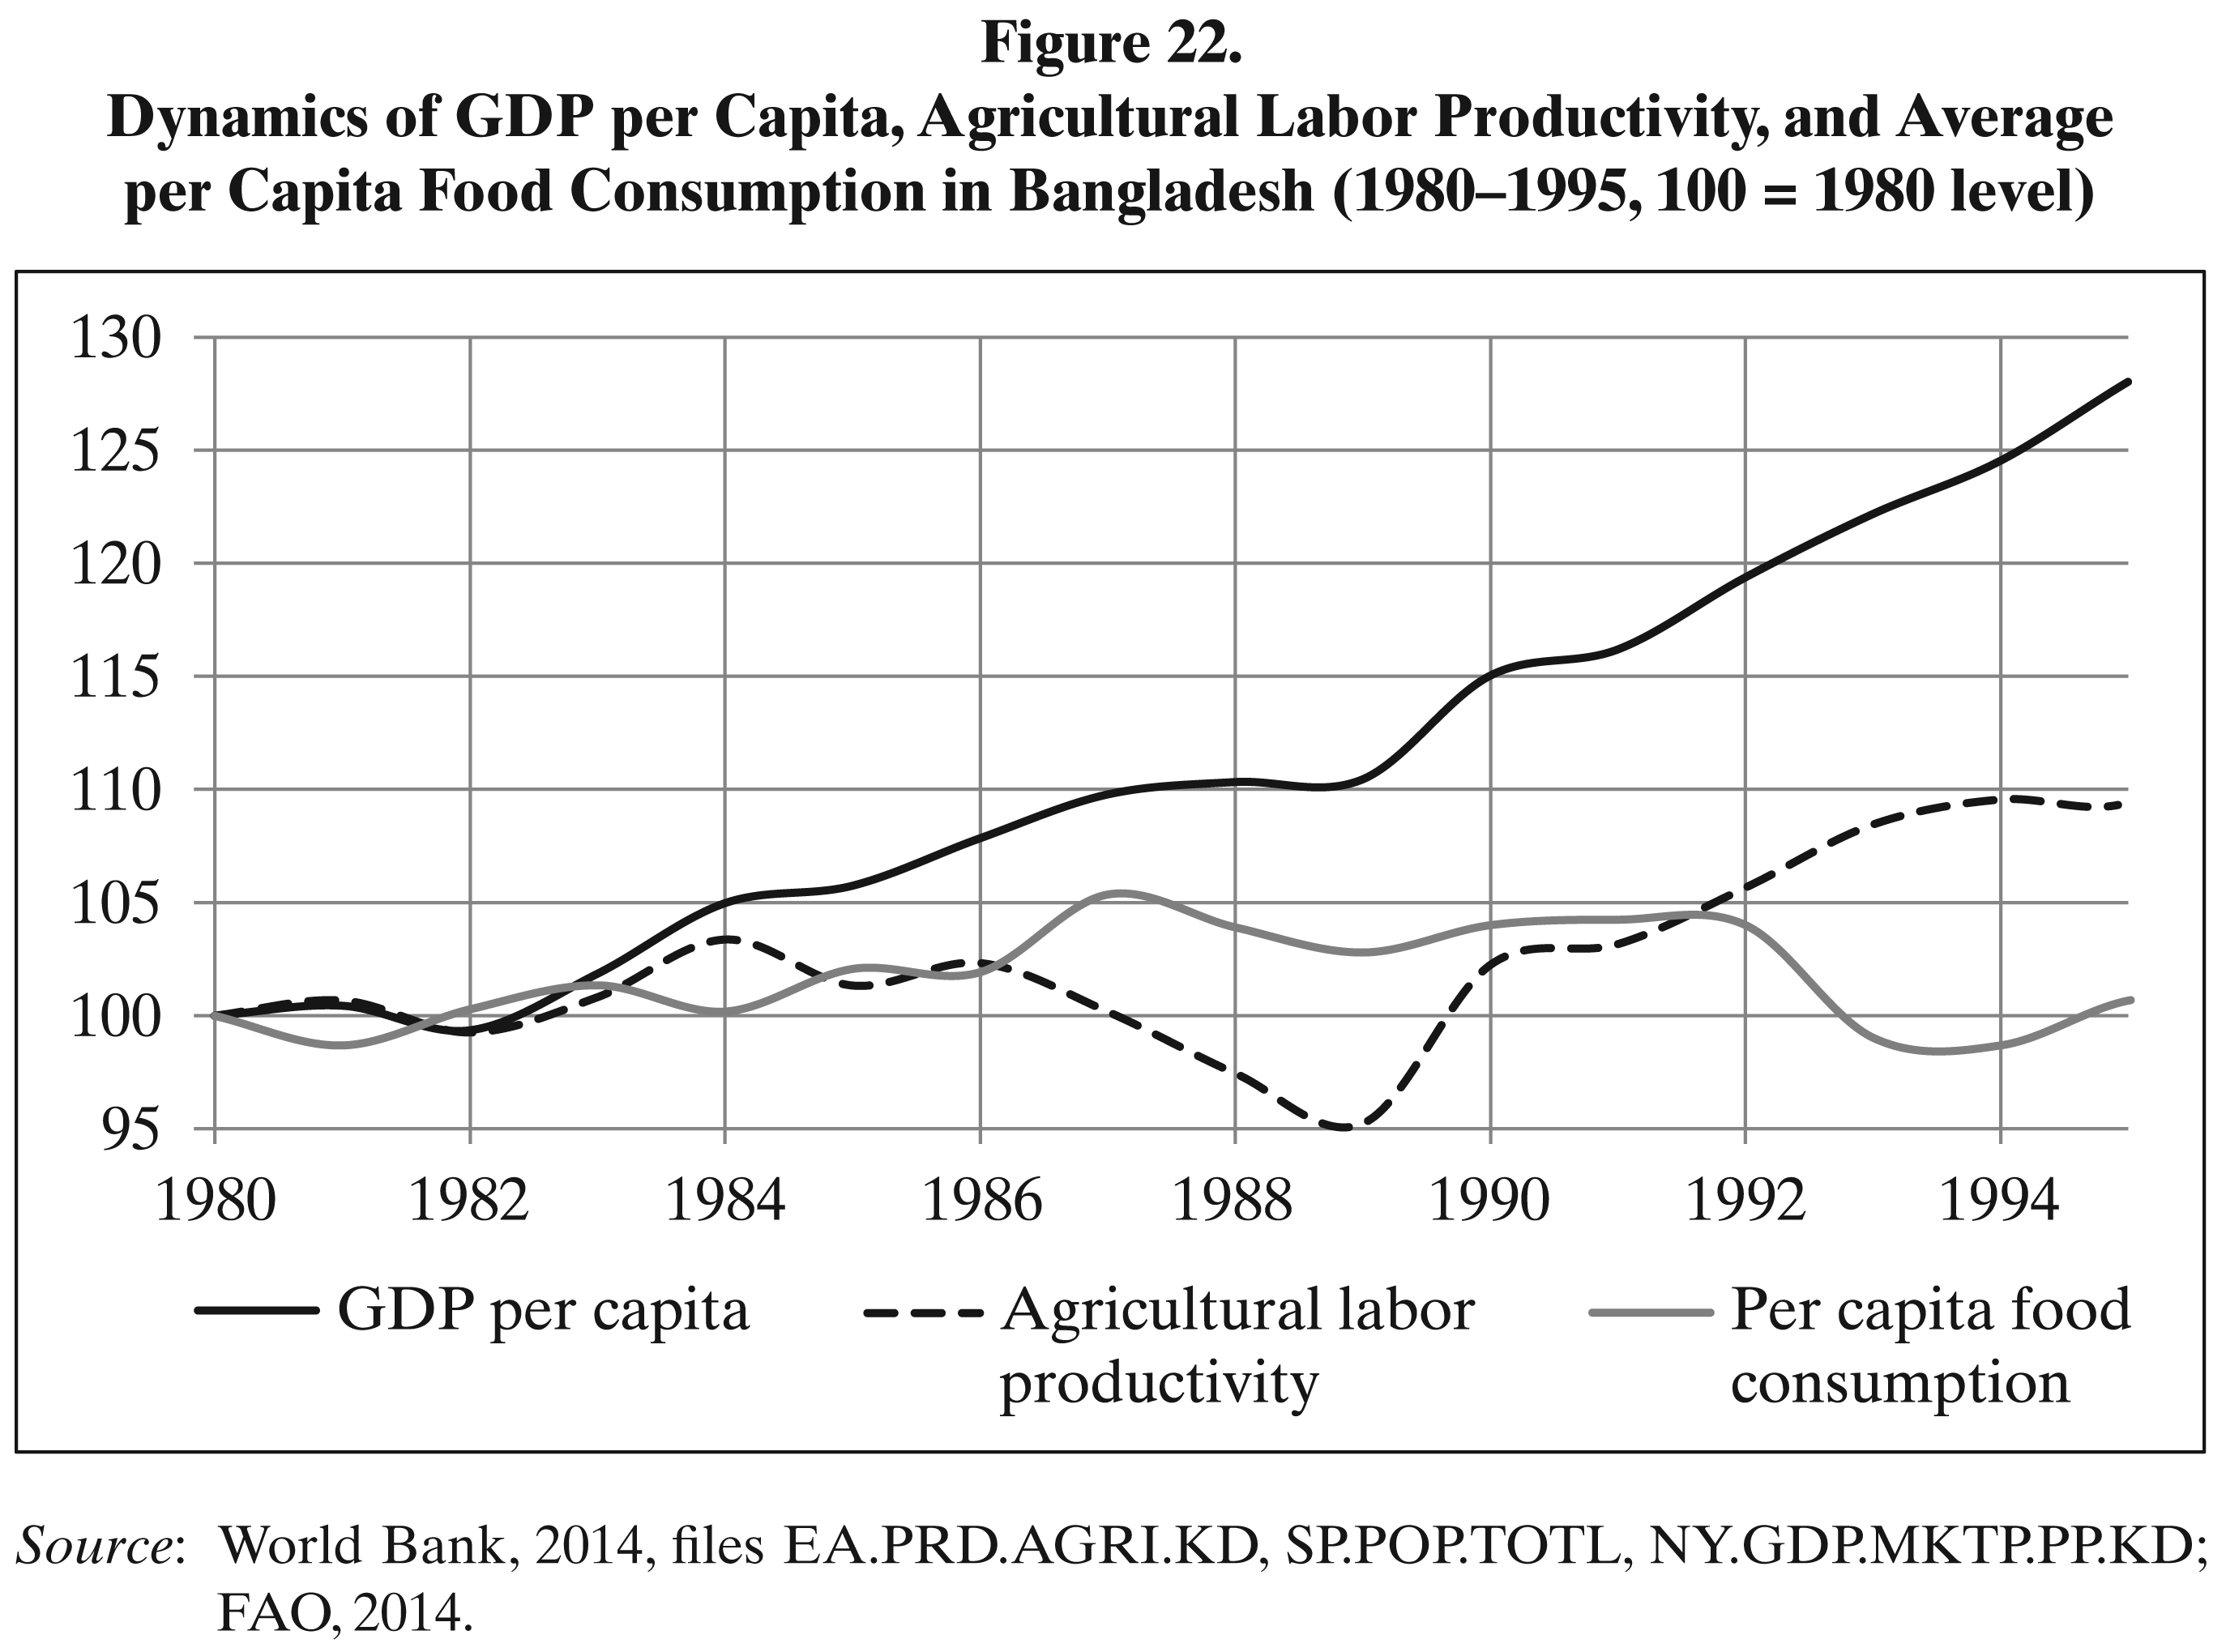
The overall picture of the relative dynamics in Bangladesh in the period before it achieved substantial decline in fertility levels looks as shown in Figure 22.
As we see, against the background of huge population pressure even quite noticeable per capita GDP growth failed to be translated into a comparatively noticeable growth of agricultural labor productivity. This failure (within the context of the overwhelming majority of population still being rural) resulted in the absence of any noticeable improvement in the average per capita food consumption.
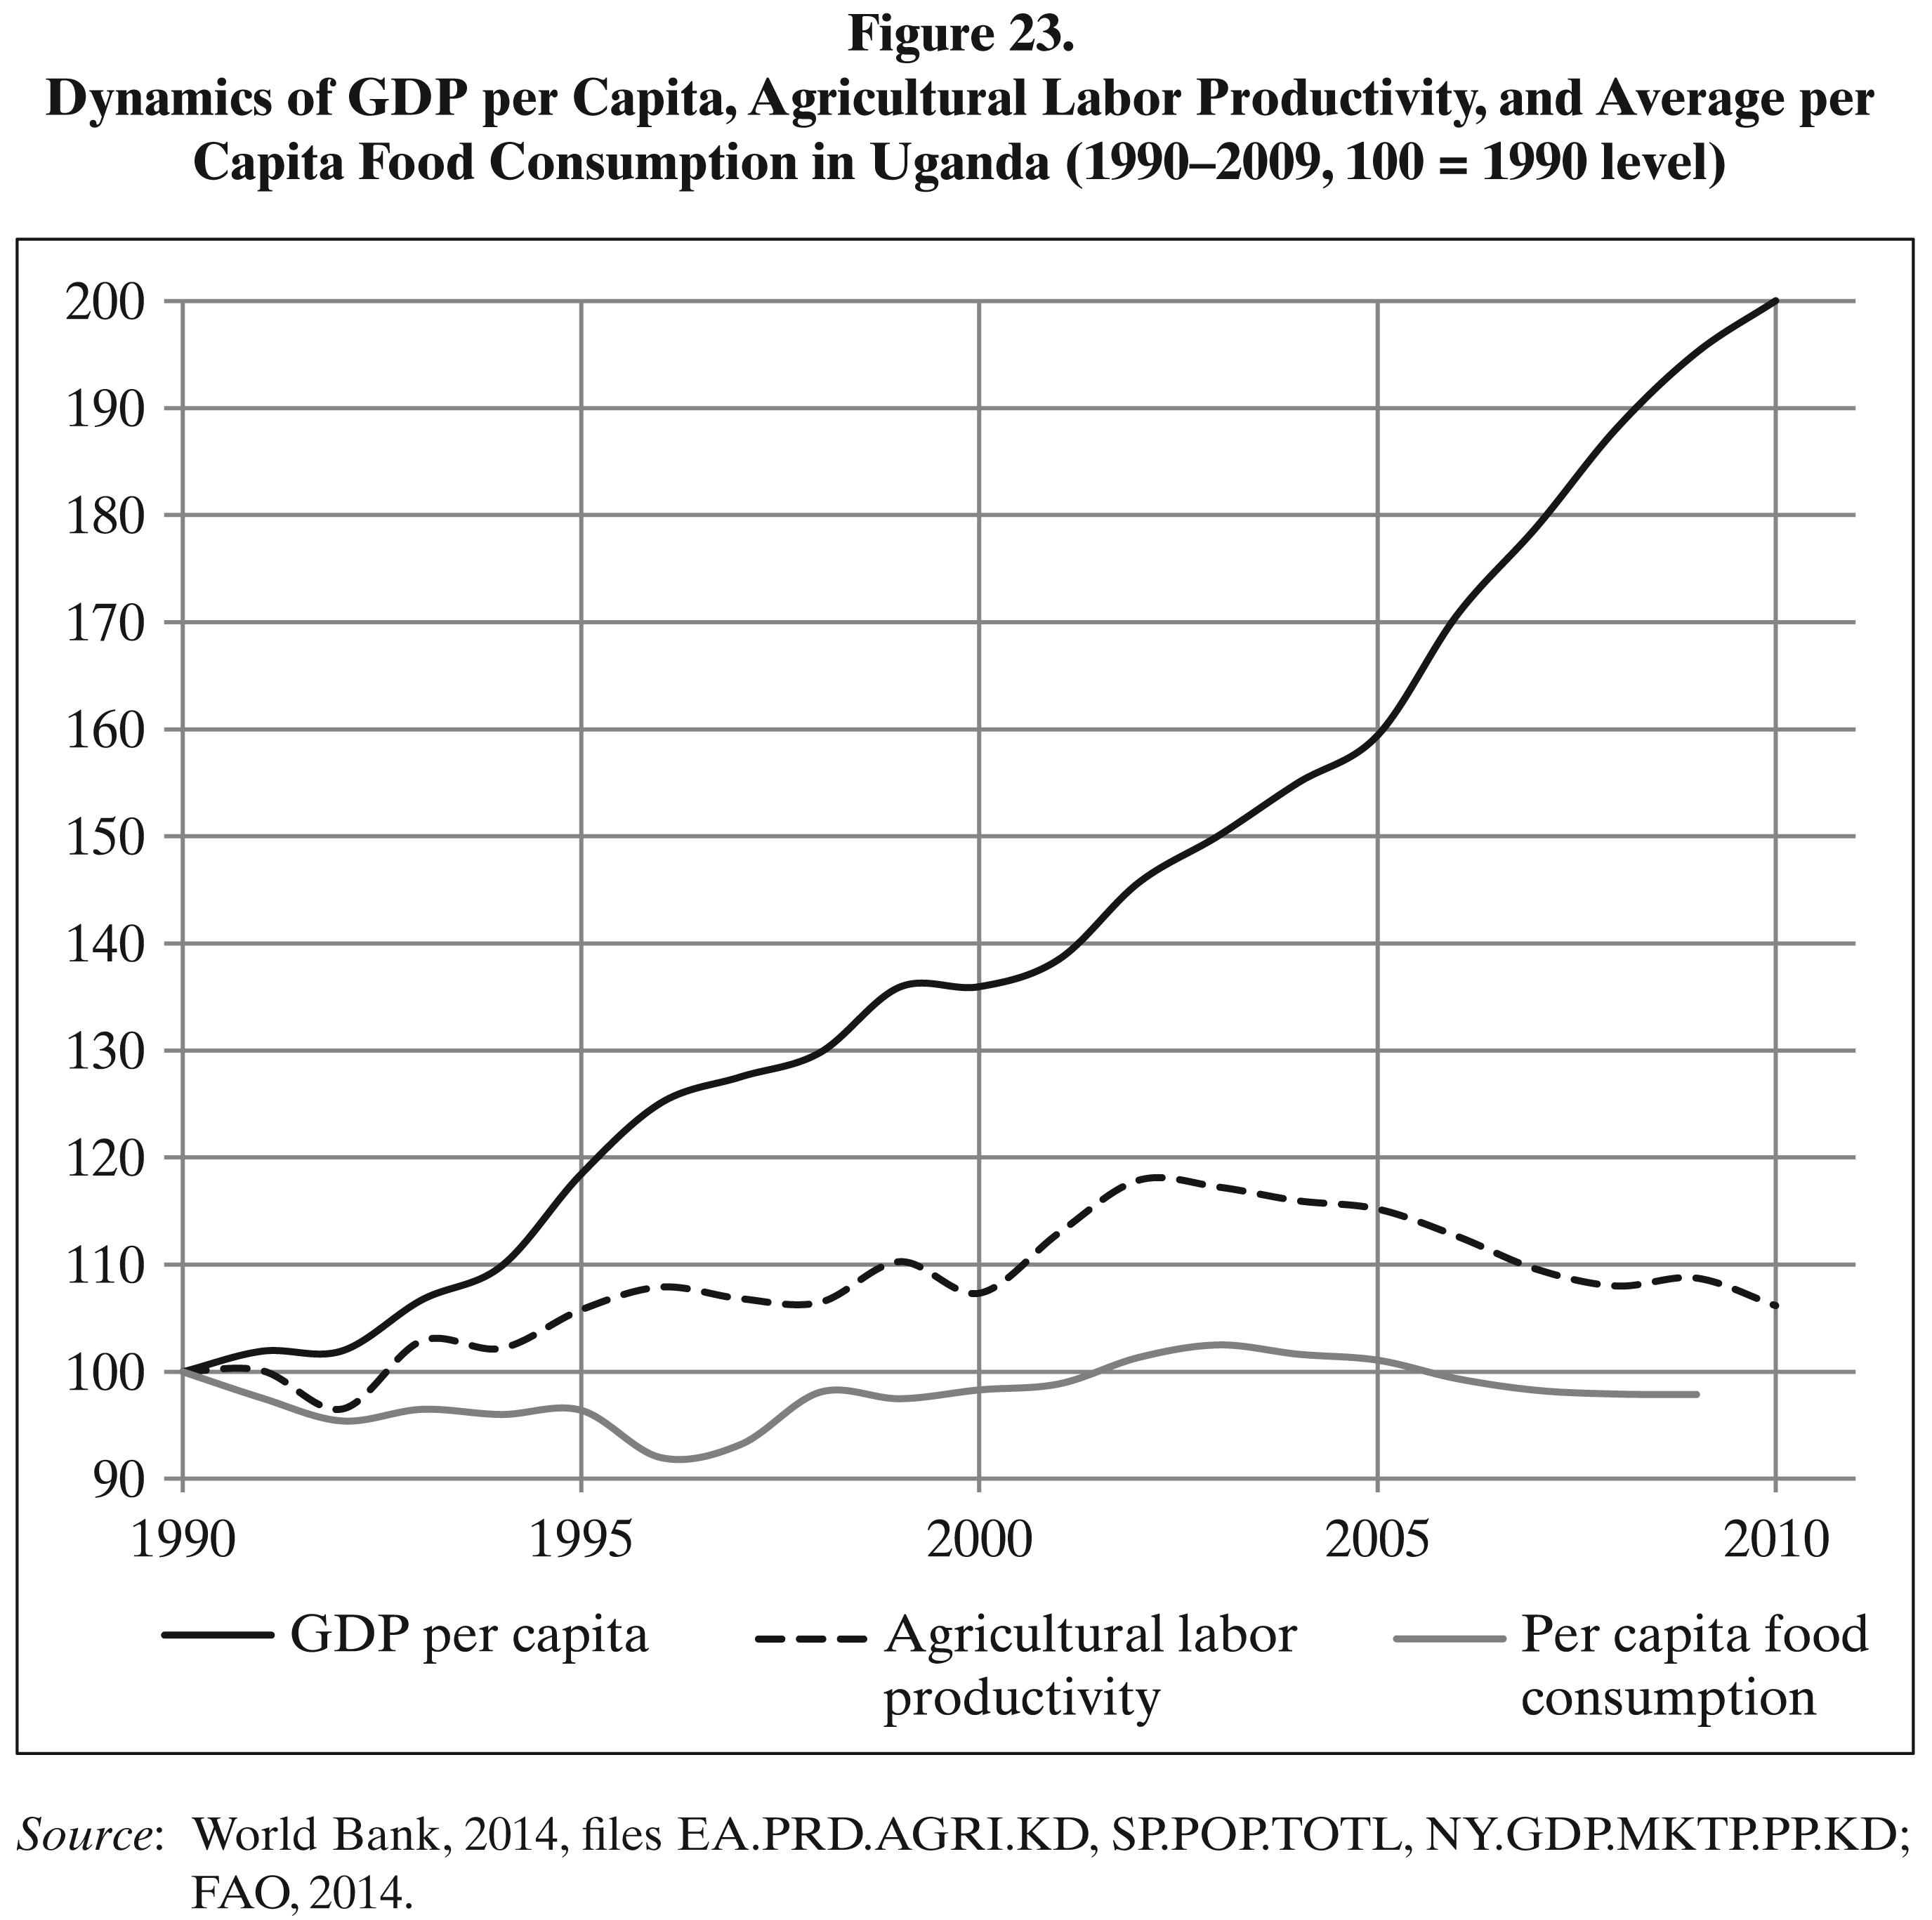
Note that in some East African countries, such a dynamics is still observed. For example, for Uganda it looks as shown in Figure 23.
As we see, the pattern which is observed till now in Uganda is almost identical with the one which had been observed in Bangladesh before this country managed to achieve a really substantial fertility decline – quite a noticeable per capita GDP growth fails to get translated into a comparatively noticeable growth of agricultural labor productivity, which (within the context of the overwhelming majority of population still being rural) results in the absence of any noticeable improvement in the average per capita food consumption at all. 11 This demonstrates again that we should not expect that comprehensive development will “automatically” bring about all the necessary fertility declines (this belief seems to be analogous to the famous belief of some economists that the “invisible hand of market” will sort everything out automatically). The situation is just the opposite for countries caught in the Malthusian trap (which is the case for most of the present-day Tropical African countries) – in those countries, achieving a substantial fertility decline is a precondition for successful comprehensive development.
Source: World Bank, 2014, file EA.PRD.AGRI.KD.
Source: World Bank, 2014, files EA.PRD.AGRI.KD, SP.POP.TOTL, NY.GDP.MKTP.PP.KD; FAO, 2014.
Source: World Bank, 2014, files EA.PRD.AGRI.KD, SP.POP.TOTL, NY.GDP.MKTP.PP.KD; FAO, 2014.
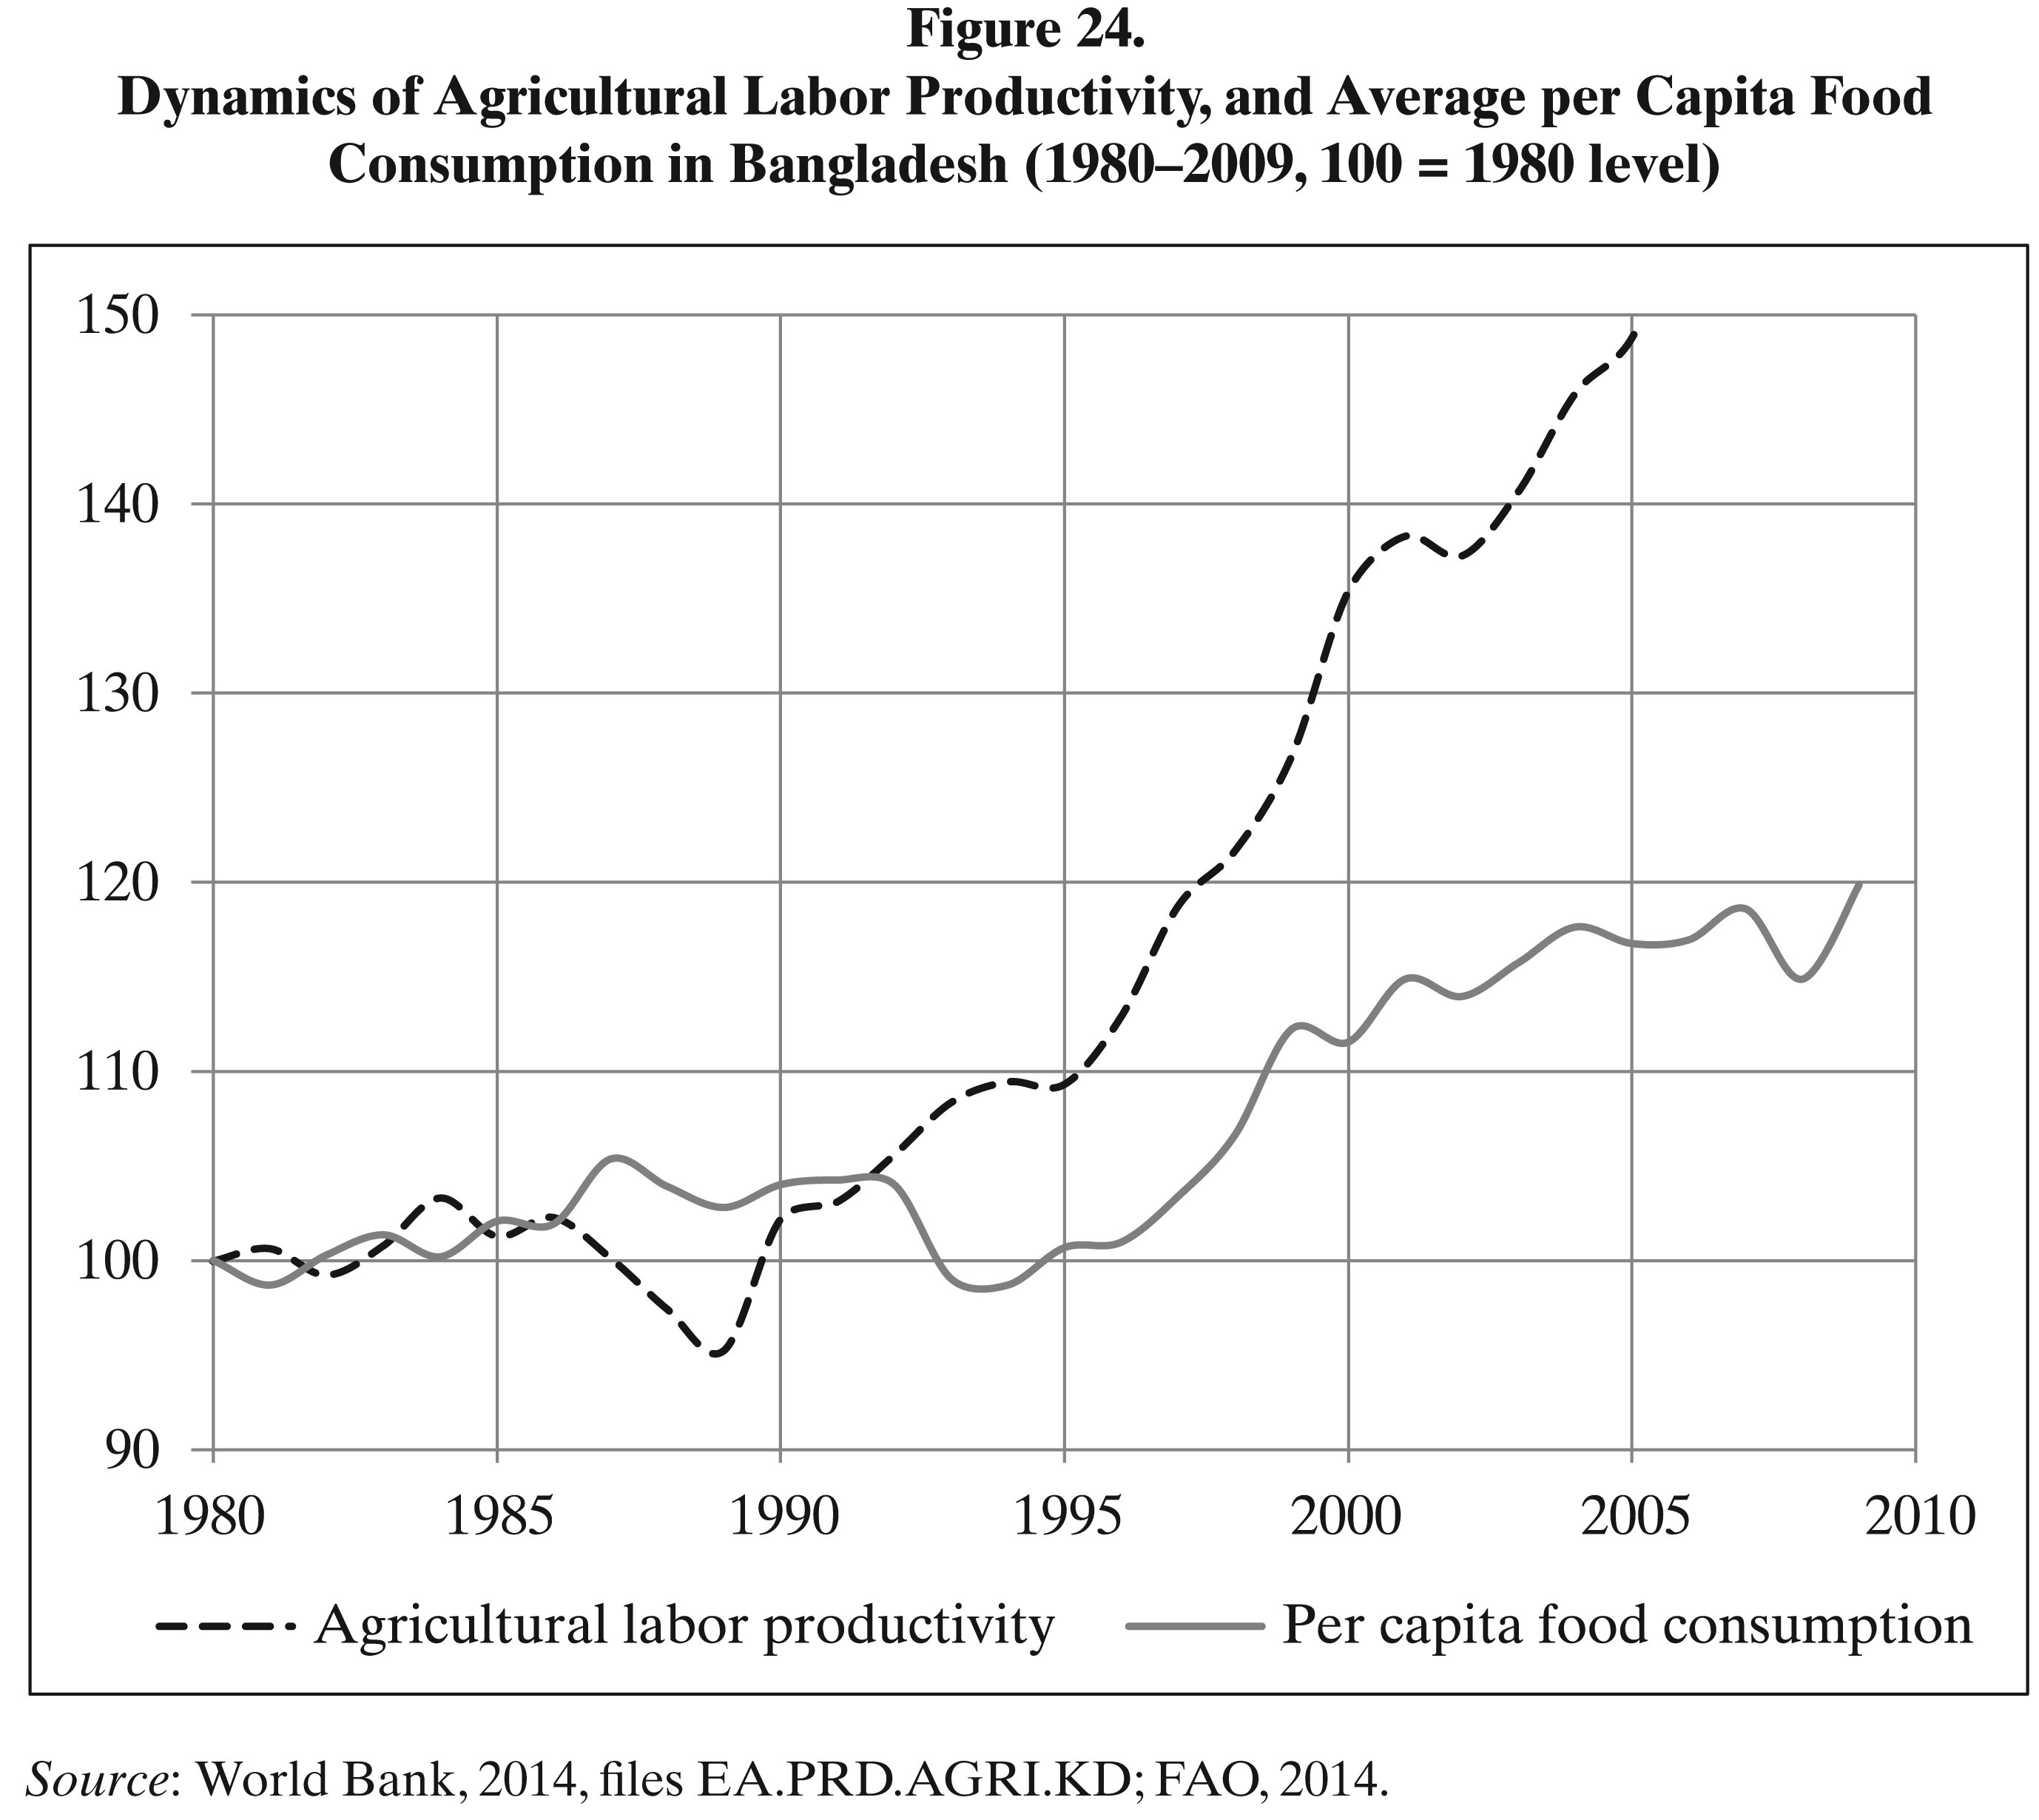
Bangladesh managed to get in the trajectory of really successful comprehensive development only by the mid-1990s when it managed to achieve a really substantial fertility decline (see Figure 24).
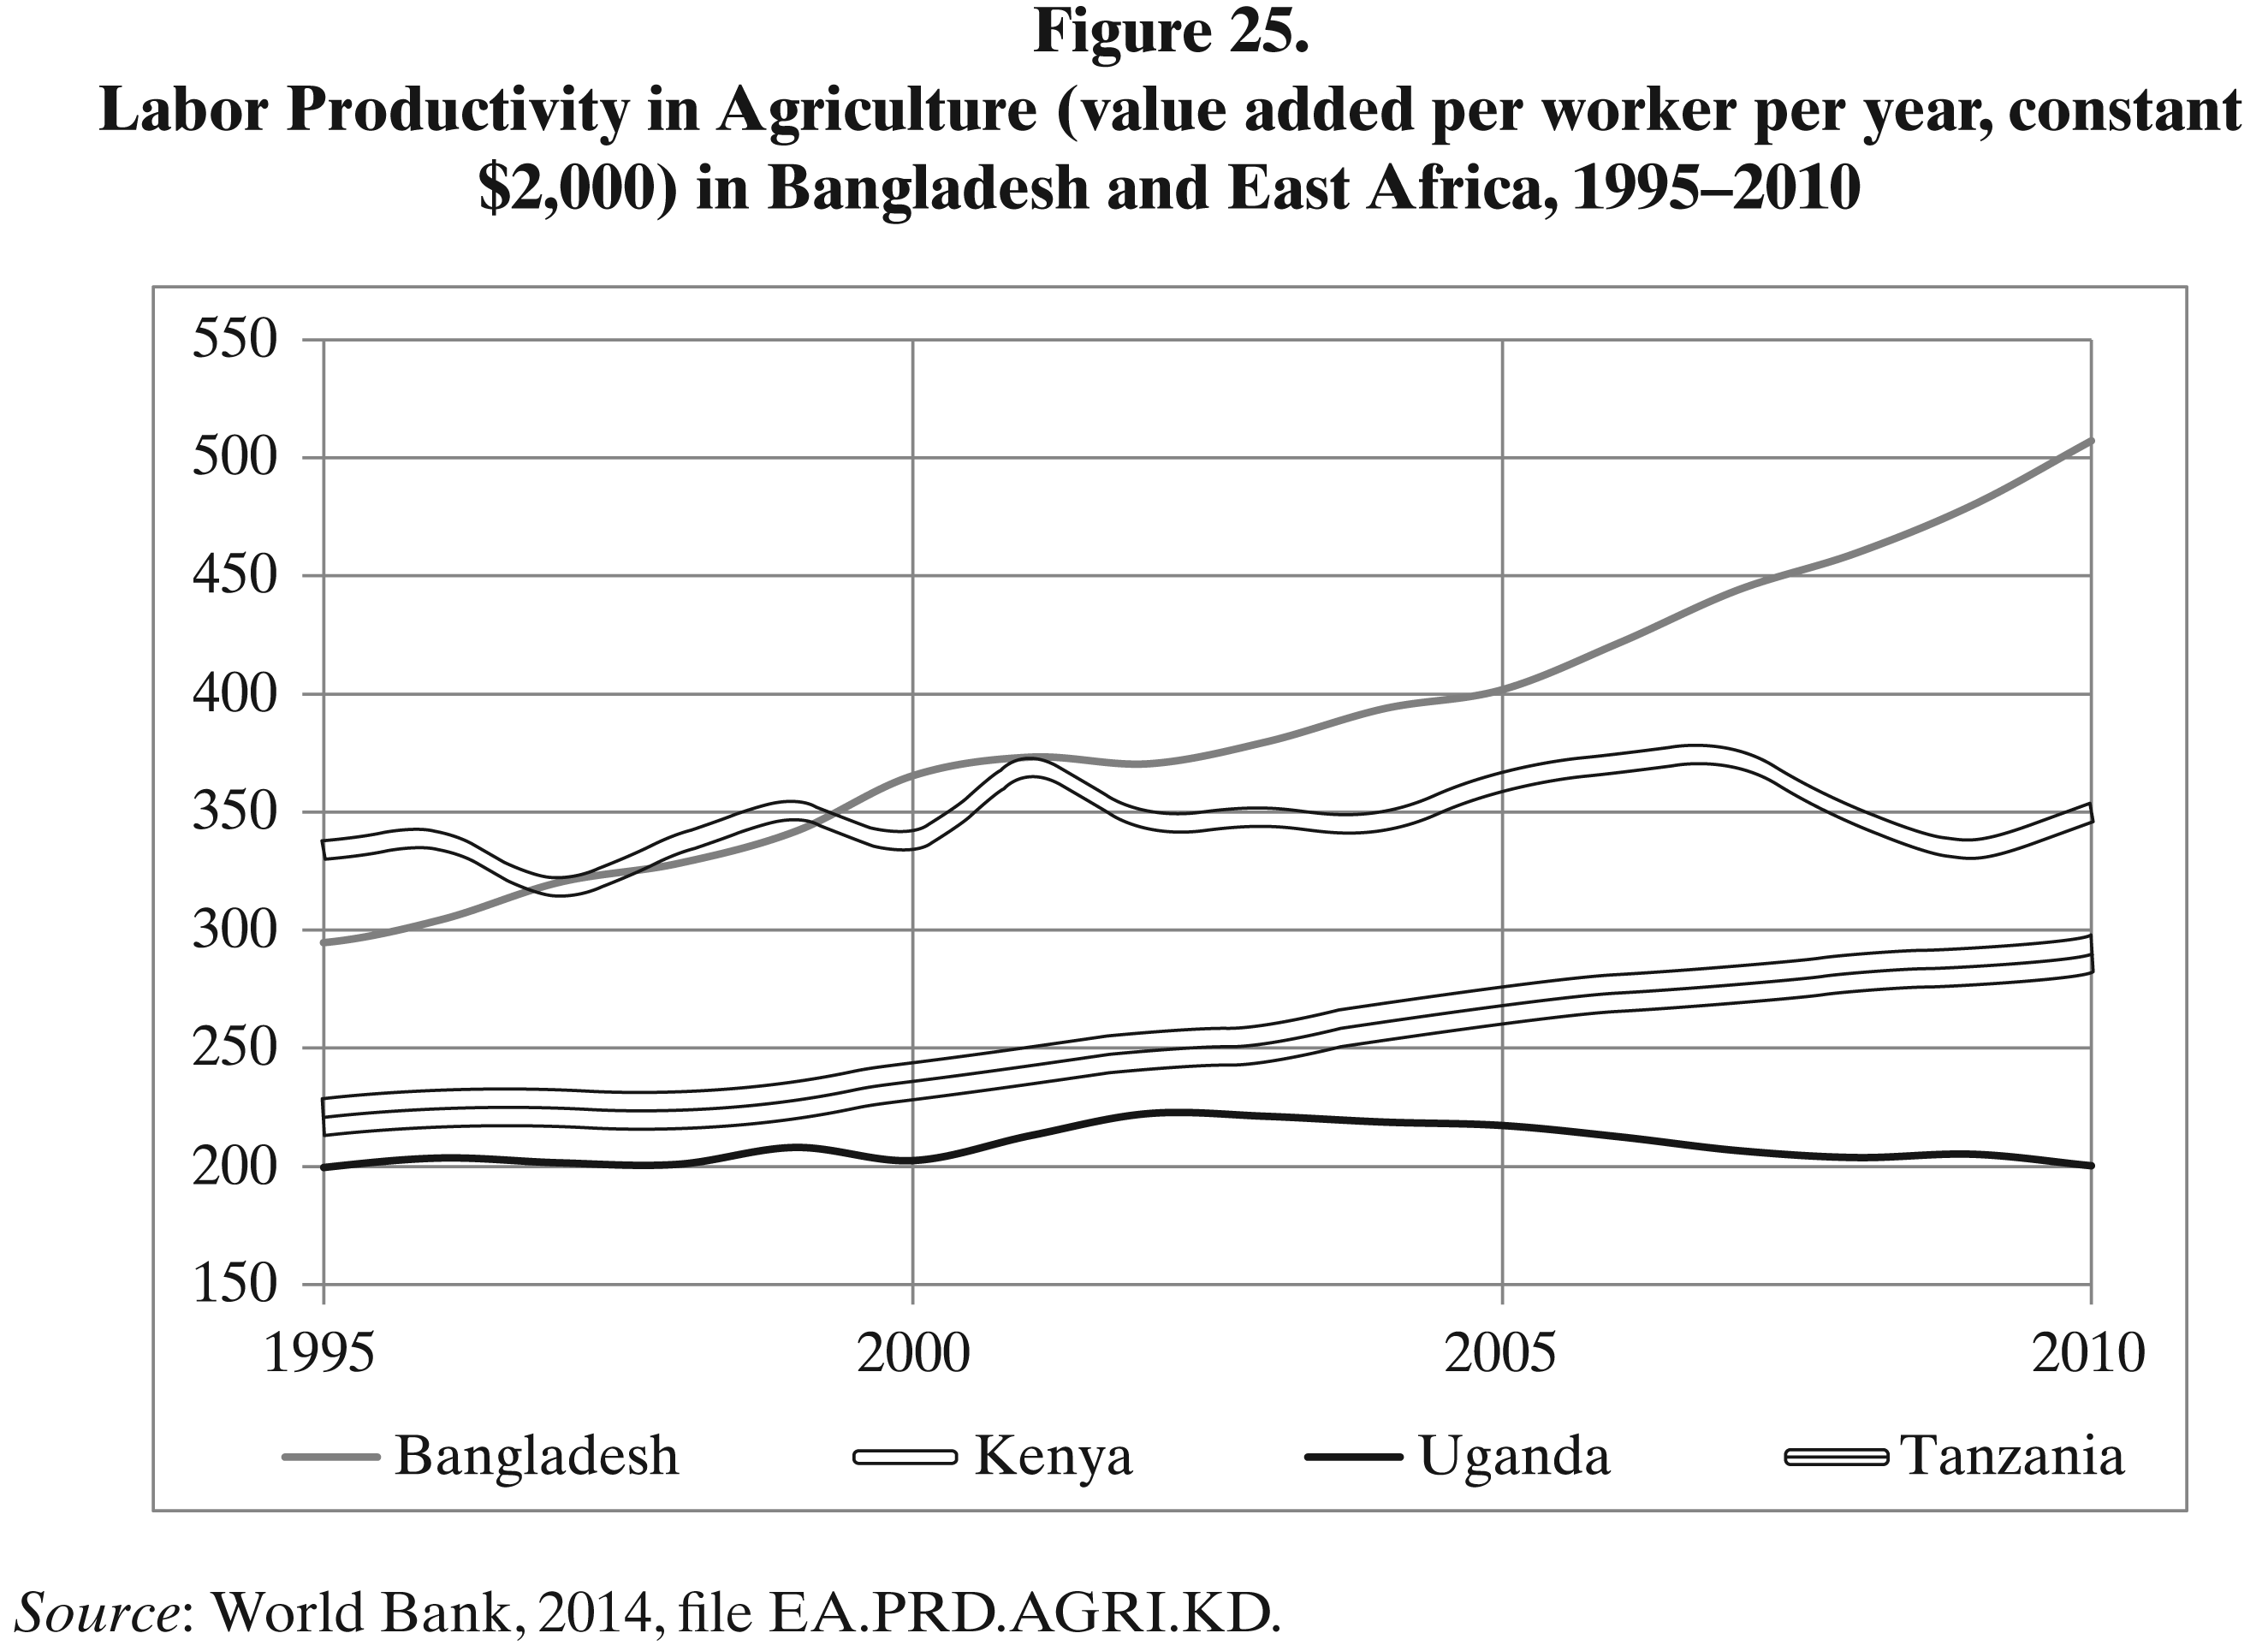
Only after that did Bangladesh start to find its way out of the Malthusian trap. Only after that did it manage to outstrip its Tropical African analogs (that failed to achieve similar fertility declines and that, consequently, continue being trapped in the Malthusian trap) (see Figures 25 and 26).
Source: World Bank, 2014, files EA.PRD.AGRI.KD; FAO, 2014.
Source: World Bank, 2014, file EA.PRD.AGRI.KD.

Source: World Bank, 2014, files EA.PRD.AGRI.KD; FAO, 2014.
Thus, the similarity of the Bangladeshi pattern to the situation in modern East African countries is striking. This demonstrates again that we should not expect that comprehensive development will “automatically” bring about all the necessary fertility declines. The situation is just opposite in countries caught in the Malthusian trap (which used to be the case for Bangladesh and still is the case for the most of the present-day Tropical African countries) – in those countries, the achievement of substantial fertility decline is a precondition of successful comprehensive development (see, e.g., Korotayev & Zinkina, 2014; Zinkina & Korotayev, 2014a, 2014b).
Conclusion
In this article, we have made and demonstrated the following points:
The main countries of East Africa (Uganda, Kenya, and Tanzania) have not yet escaped the Malthusian Trap. These countries are not likely to follow the “North African path” and to achieve this escape unless they first achieve serious successes in lowering their fertility rate. East Africa is unlikely to achieve an escape from the Malthusian Trap unless it follows the “Bangladeshi path.” That is, it must achieve really substantial fertility declines in the foreseeable future. This would necessitate the introduction of compulsory universal secondary education, serious family planning programs of the Rwandan type, and a rise in the legal age of marriage with parental consent. Such measures should, of course, be accompanied by substantial increases in agricultural labor productivity and a decline in the percentage of population employed in agriculture.
Footnotes
Acknowledgements
This research has been supported by the Russian Science Foundation (Project # 14-18-03615). Our special thanks go to Victor de Munck of the State University of New York – New Paltz for his invaluable help with the stylistic editing of this article.
Tanzanian Case
Tanzania constitutes a rather special case, as the stagnation of per capita food consumption was observed in this country against the background of not only the GDP per capita growth but also some growth of labor productivity in agriculture (see Figure 5). This seems to be accounted for by the point that in Tanzania, recent years evidenced a rapid growth of production of such agricultural products as tea (see Figure A1) or tobacco 12 (see Figure A2) where production takes place to a considerable extent at larger agricultural enterprises, whereas the production of such staple foods as cassava (see Figure A3), where the majority of agricultural population is concentrated, stagnated, or even declined.