
Abstract
Visualization (i.e., the use of figures and images to represent findings and conceptual models) is central to theorizing. Yet, by focusing solely on the textual content of papers, analysis has inadvertently marginalized the graphic representations of key ideas. We review the paradox literature not just in terms of what authors have written but also how they have visualized models concisely. An analysis of figures in paradox articles captures the essential role that visuals play in our understanding of competing tensions, leveraging the power of imagery. We explore paradox visually, searching for the figurative materialization of paradox; more particularly, we seek visual signs that render abstract ideas more saliently and concretely. We contribute to paradox theory in three ways. First, we show how visuals constitute the lynchpin between convergent and divergent forces, allowing scholars to simultaneously reinforce and challenge current understanding. Second, we offer a tool for scholars to theorize competing demands based on three key antinomies, or dualities, that define the terrain of research in our field. Third, we reveal the performative effect of figures by identifying the ongoing dominance of certain classes of paradox visuals, which allows us to point to uncharted territories for paradox research.
Introduction
Paradox is central to management and organization scholarship if only because tension and opposition are an inherent part of organizational practice (Putnam, Fairhurst, & Banghart, 2016; Schad, Lewis, Raisch, & Smith, 2016). Dynamic expressions of paradoxical balance are evident in various analyses of proliferating contradictions between multiple logics in organizations and in society (Carmine et al., 2021). Paradoxes have been described as “contradictory yet interrelated elements—elements that seem logical in isolation but absurd and irrational when appearing simultaneously” (Lewis, 2000, p. 760). Paradox theory addresses diverse challenges arising from individual or group tensions (Berti & Simpson, 2021a; Pamphile, 2022; Pradies, Aust, Bednarek, et al., 2021) to global challenges (Sharma et al., 2021). Paradox is an umbrella concept covering multiple facets, including dynamic expressions of paradoxical balance, as are typically assumed in the both-and approach, as well as lack of balance, as in stuckedness-circularity and dialectical transformation. The development of the field has been both convergent and divergent (Schad, Lewis, & Smith, 2019). Centripetal forces foster theoretical convergence around core concepts, while centrifugal forces push the field’s boundaries (Hahn & Knight, 2021b) through interdisciplinary innovation. Both dynamics are “vital to the development of paradox theory” (Schad et al., 2019, p. 108). Despite their interrelated nature, their binary conception minimizes theoretical convergence (Cunha & Putnam, 2019), revealing limits to understanding paradox, as Schad et al. (2019) note. A vibrant cross-disciplinary intellectual community of paradox scholars has emerged, employing a variety of methods to address a wide array of topics (Berti & Cunha, 2022; Putnam et al., 2016; Schad et al., 2016), tensions and their management (Keller et al., 2021; Schad et al., 2019).
Visuals are an effective channel to convey paradoxes (Halgin, Glynn, & Rockwell, 2018; Vince, 2021; Vince & Broussine, 1996), with specific visuals, exemplified by the widespread use of the yin-yang symbol (e.g., Smith & Lewis, 2011), being widely associated with the concept. Figures are constitutive of the core messages presented in many academic papers (particularly those dealing with complex issues). Rather than being mere embellishments, they complement written text and concepts, offering an illustration of the phenomena researched as well as the conceptual frameworks explaining their causes, dynamics, and consequences.
A rich tradition in visual organizational research has shown (e.g., Quattrone, Ronzani, Jancsary, & Höllerer, 2021) that visuals serve multiple purposes. First, visuals have a strong performative effect when they orient our attention to what counts and what is legitimate in the literature (Meyer, Höllerer, Jancsary, & van Leeuwen, 2013; Quattrone et al., 2021), thus shaping theorizing. Second, conceptual depth is increased when scholars and their audiences gain insight not immediately communicated by textual exegesis (Avakian, 2020). Visualization facilitates aesthetic communication of highly abstract concepts (Ravasi, 2017). Hence, as Messaris and Abraham (2001, p. 225) state, “pictorial framing is worthy of investigation not only because images are capable of conveying unverbalized meanings, but also because awareness of those meanings may be particularly elusive.” Finally, visual devices are powerful and effective communications for building academic–practitioner bridges (Trumbo, 1999). The use of well-known visuals, including symbols that have deep historical roots and wide global awareness, such as the yin-yang symbol, serve diverse traditions in contextualizing universal human experiences (Lindgreen & Maon, 2019).
In this article we asked the broad question: How do visuals in paradox academic work address the tension of convergence and divergence in paradox theorizing, focusing on (1) what do visual representations in paradox academic work reveal about paradox and its assumptions and (2) what new possibilities and areas of exploration does mapping the literature reveal? Our analysis contributes to paradox theory in three ways. First, we show that visuals constitute the lynchpin between convergent and divergent forces, allowing scholars to simultaneously reinforce and challenge current understandings of paradoxes. Second, we put forth a theorizing tool that defines the terrain on which paradox research has been built and identifies three antinomies, or dualities, as the cardinal points. Third, we reveal the performative effect of visuals by identifying a few classes that have dominated the imagery used in paradox research, and we subsequently draw attention to classes that reflect uncharted territories in the field.
We structure our paper as follows. We briefly outline the trajectory of paradox theory, presenting the opportunities offered by examining the use of visuals as a core component of theory development and communication. Building on a comprehensive review of the literature on paradox, we identify the basic visual grammar used in figures published in influential academic journals and relevant book chapters. Moving iteratively between this basic visual lexicon and that of narrative text, we inductively identify three fundamental antinomies—equilibrium/disequilibrium, linearity/recursivity, and boundedness/openness—that allow us to map alternative conceptualizations of paradox. From the eight possible combinations (or “classes”, as we name them in the Findings section) of these three antinomies, we derive an exhaustive typology associated with essential iconic representations in paradox theory. While our analysis focuses exclusively on visualization in scholarly works, it allows us to identify conceptual undercurrents shaping the evolution of theory as well as areas requiring further investigation. Finally, we discuss the implications of our findings for future research and practice.
Paradox Theory: Rich in Reflexivity, yet Blind to the Use of Visuals
Scholars and philosophers have speculated on paradox for centuries. In management studies, analysis of persistent opposite and interrelated tensions started with the contributions by Quinn and Cameron (1988), Poole and Van de Ven (1989), and Lewis and Smith (Lewis, 2000; Lewis & Smith, 2014; Smith & Lewis, 2011). Subsequent years have seen a significant increase in scholarly research on paradox (Schad et al., 2016) which, of late, has grown exponentially (Cunha & Putnam, 2019; Fairhurst, 2019). Scholars from various disciplines, working with different methodologies (Putnam et al., 2016; Schad et al., 2016, 2019), contribute to “conversations on a shared objective—understanding organizational tensions and their management better” (Schad et al., 2019, p. 108).
Scholars seek to strengthen paradox theory by refining definitional clarity (Berti & Cunha, 2022; Smith, 2014; Smith & Lewis, 2011), identifying central concepts of opposition, interrelation, persistence, and undecidability, as well as differentiating paradox from dilemmas, dialectics, or dichotomies (Putnam et al., 2016). Some have analysed key processes at the heart of paradox dynamics, such as vicious and virtuous cycles (Pradies, Tunarosa, Lewis, & Courtois, 2021; Sundaramurthy & Lewis, 2003), or provided reflection on paradox’s either inherent or socially constructed nature through insights on the salience or latency of paradox (Hahn & Knight, 2021a; Pradies, 2022; Schad & Bansal, 2018). Not only have responses to paradoxical tensions been widely discussed (Jarzabkowski & Lê, 2017; Jarzabkowski, Lê, & Van de Ven, 2013) but they have also emphasized the need to work through paradoxes (Lüscher & Lewis, 2008; Pamphile, 2022; Pradies, Tunarosa, et al., 2021) to find a balance between integration and differentiation (Cunha & Putnam, 2019; Smith 2014). Lewis and Smith (2014) recognize paradox theory and its multifaceted uses as a metatheory. Schad et al. (2019, p. 108) describe centripetal forces reinforcing core elements of the theory, while centrifugal forces have “pull[ed] away from the core to spur exploration and creativity, challenging, spanning, and extending its boundaries.” By demonstrating the role of power dynamics in generating pragmatic paradoxes (Berti & Simpson, 2021a), or by exploring questions of disequilibrium (Hargrave, 2020; Hargrave & Van de Ven, 2017), researchers have expanded paradox scholarships’ theoretical boundaries.
Paradox scholars’ dialogues in Academy of Management Review between Li (2021b) and Berti and Simpson (2021b) and between Li (2021a) and Hahn and Knight (2021a) capture the vibrancy of current debate. “[P]aradox scholars ‘agree to disagree,’” fostering “conflicting yet interdependent views on key concepts that co-exist and energize community debates” (Schad et al., 2019, p. 110). The paradox scholarship research program’s use of language, research craft, thinking style, and use of material tools underpinning theorizing (Clegg, Cunha, & Berti, 2022) displays a vitality that invites further inquiry. To ensure that the vitality of divergent efforts counterbalances too much convergence (Cunha & Putnam, 2019), both centripetal and centrifugal efforts are essential to “surface and open the remaining ‘black boxes’ of paradox theory” (Schad et al., 2019, p. 108).
Visual representation of the findings or conceptual contributions presented characterize many works published in the field; indeed, visuals have been integral to the evolution of paradox theory. A foundational work by Vince and Broussine (1996) relied on drawings to articulate the paradoxes that managers faced in the wake of organizational change, while the yin-yang symbol was used by Lewis (2000) and Smith and Lewis (2011). Such visualizations capture holistic and simultaneous forms of signification that are difficult to express but are essential for a better understanding of the notion of paradox (Halgin et al., 2018).
While visuals characterize key contributions, they are rarely the focus of attention, a surprising blind spot, as visuals enable researchers to capture the ineffable absurdity (Lewis, 2000) and logic-defying dynamics sometimes present in interrelated contradictions. Visualization assumes different roles (Berti, 2017), with Gibson (1978) noting that depiction frames description, meaning that how an object, such as a paradox, is represented visually inscribes interpretation of its meaning. For Gibson (1978, p. 233), “depiction captures an awareness without describing it.” We see visualizing as central to the theorizing process, able to generate novel theories, as suggested by the visual turn in management studies (Meyer et al., 2013; Quattrone et al., 2021; Swedberg, 2016). Editors and reviewers pay great attention to the consistency between text and figures (Fulmer, 2012). Even if one accepts that “diagrams are not theory” (Sutton & Staw, 1995, p. 376), figures and other visuals, together with textual headings and propositions, are essential in conveying the essence of academic work (Lange & Pfarrer, 2017). Not only do visuals help clarify other inscriptions but they also provide formal models that allow assessment of the “balance between parsimony and completeness” in a theoretical contribution (Whetten, 1989, p. 491).
Ravasi (2017, p. 243) suggests that visualizing qualitative data is essential to solving the “mystery of theorizing from qualitative data.” Similarly, Parmentier-Cajaiba and Cajaiba-Santana (2020) argue that visual mapping enables researchers to engage with data by selecting, removing, or adding elements, as a steppingstone in the theorizing process. Visualizations allow researchers to theorize without being “bound by convention or preconceived notions of linear cause and effect” (Langley & Ravasi, 2019, p. 188). Images have narrative power (Kassinis & Panayiotou, 2018); they embed knowledge (Ewenstein & Whyte, 2009), bringing new meaning to textual understanding.
In sum, visuals are central to knowledge production (and dissemination) processes (Meyer et al., 2013; Quattrone et al., 2021). Indeed, many scholars, noting the performative function of visuals (e.g., Meyer et al., 2013; Steyaert, Marti, & Michels, 2012), observe “how visualization practices produce organizational outcomes” (Quattrone et al., 2021, p. 1197), such as theorization. Visualization frames what is seen as worthy (Arjaliès & Bansal, 2018), not only facilitating sensemaking but also mobilizing actors’ (and spectators’) attention. In addition, it may be used as a means for contestation (Kornberger, 2017). As such, visualization not only defines appropriateness but also offers opportunities to debate what is worthy of attention by establishing “arenas for performance” (Quattrone et al., 2021, p. 1205).
To sum, we will investigate how visuals in paradox theorizing work to address tensions of convergence and divergence. In particular, we focus on two questions: (1) what do visual representations in paradox academic work reveal about paradox and its assumptions, and (2) what new possibilities and areas of exploration does mapping the literature reveal?
Methodology
Tracking visuals in organizational paradox theory
We analyse the use of visuals in paradox theorizing in the published literature to study the use and impact of graphic representations in constituting the corpus. We selected 193 papers containing 266 figures, in a sequence of four steps from the core literature. First, we used a systematic analysis of the organizational paradox literature that considered all peer-reviewed works published in the last four decades following the method employed by Schad et al. (2016). We surveyed Web of Science for articles with the word “paradox” in their titles, abstract or keywords, between 1980 and 2021; this resulted in over 93,000 articles. We then narrowed the focus to business and management and excluded book reviews, meeting abstracts, proceedings papers, and editorial material. Finally, we filtered the results, based on research quality, by selecting journals with a 5-year impact factor of at least 2.00 in 2020 (according to the Journal Citation Reports). Next, we searched for articles citing at least one of four foundational works on paradox in the management literature, those by Quinn and Cameron (1988), Poole and Van de Ven (1989), Lewis (2000), and Smith and Lewis (2011). Focusing on these works ensured focusing on studies consistently applying a paradox lens, creating a community of practice. While different levels of engagement with paradox theory characterize papers in the sample, use of paradox as an umbrella concept is common. We also added relevant book chapters (n = 40) and forthcoming articles in 2021 (n = 25) as well as articles that drew heavily on paradox theorizing and were cited by paradox scholars (e.g., Ashforth & Reingen, 2014) but lacked paradox in their keywords, title, or abstract. We added articles that appeared in journals with an impact factor below 2.0 that were often cited (e.g., Abdallah, Denis, & Langley, 2011), creating a total population of 433 academic works.
A total of 193 papers (79 conceptual and 114 empirical) used visual figures representing paradoxes or tensions. We identified a total of 266 unique figures by excluding figures representing statistical analysis, hypothesized relations among variables, or images used as empirical material with no reference to paradox. We coded these figures by distinguishing images describing types of tensions/oppositions (n = 136) from images representing or conceptualizing paradox dynamics (n = 130). While half of the initially sampled papers did not contain visual figures, our findings are not constrained in terms of their generalizability as a separate corpus of literature, founded on different conceptual assumptions, if only because they are frequently cited in the “nonvisual” articles. Therefore, our sample provides indications about the direction and debates in the paradox literature.
Coding the visual representation of paradox: a classificatory device
Step 1. Identifying the basic lexicon of paradox visualization
Our analytical process was nonlinear and iterative between data and theory (Strauss & Corbin, 1998); however, for readability, we describe it as a series of sequential steps (illustrated in Figure 1). Once our corpus of 193 academic works and 266 figures was identified, two co-authors began inductively coding the first 150 figures to develop a consistent approach to “breaking down” complex models into basic forms in a process akin to open coding (Strauss & Corbin, 1998). The purpose was to break down figures into more accessible, interpretable objects, focusing on their essential elements, i.e., the elementary symbols used to compose them.
Data structure.
While visual representations can be analysed in different ways, considering their representational, interactional, and compositional meaning (Kress & Van Leeuwen, 2020), we focused on recurring symbols. Basic signs were analysed in a manner akin to “word frequency analysis” in critical discourse analysis. The method allows identification of general assumptions or trends in a particular textual corpus; for example, it can show how positive or negative ideas are associated with a particular object (Bednarek & Caple, 2014). We identified some essential basic signs: boxes, arrows, straight and curved lines. We selected frequently found combinations of these basic signs consistently conveying specific meanings: different types of straight lines with arrows (one-directional, bi-directional, converging, diverging, zigzag), bounded annular shapes (circles, loops, knots), spirals, triangles, steps, and cartesian diagrams. The two co-authors performed the operation individually and then discussed and resolved ambiguities. In this way, they treated visual representations as any other form of signification, enabling the communication of complex ideas through the combination of a conventional set of elements (a visual repertoire, that comes together in more complex patterns). They also identified several images that need to be considered holistically, such as yin-yang, scale, bridge, cloud, waves, etc.
Step 2. Identifying and refining antinomies to make sense of the basic lexicon
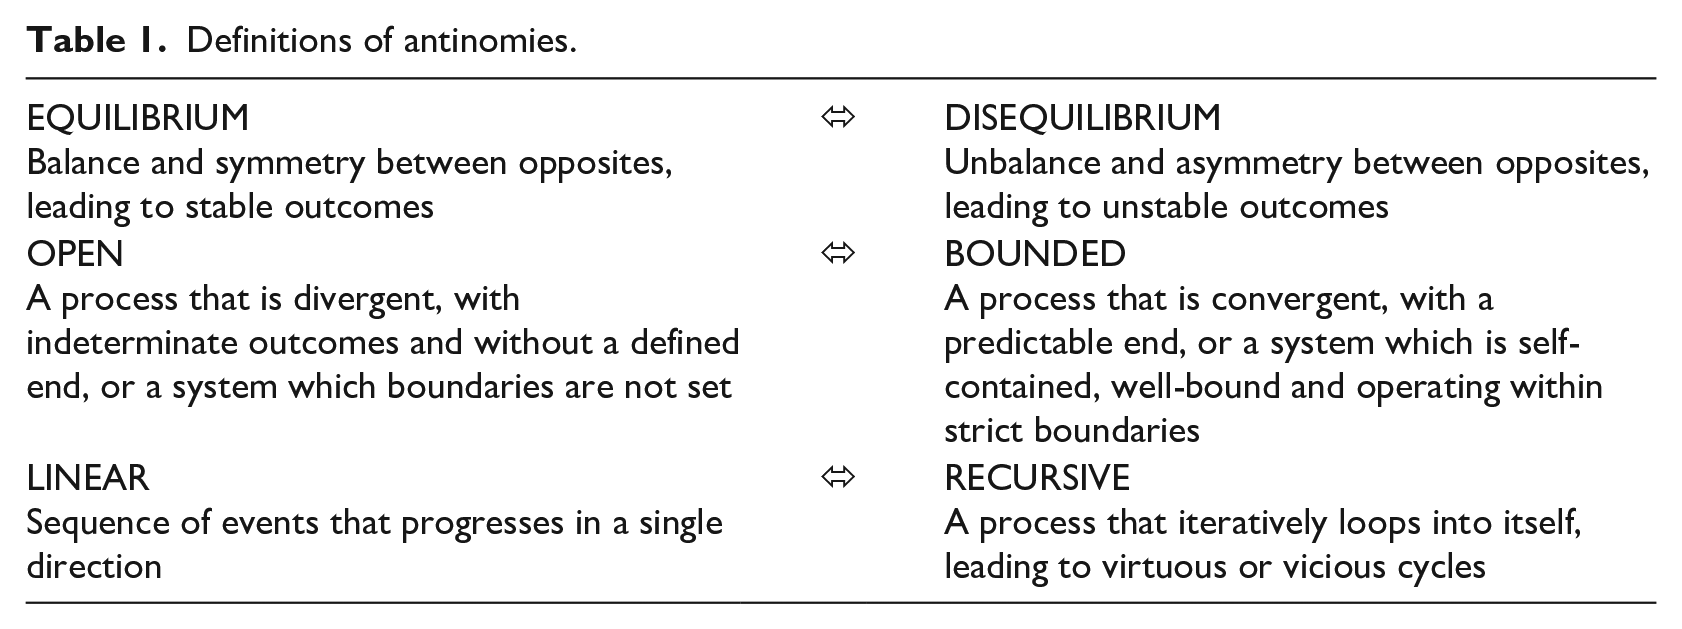
Going back and forth between data and theory, and expanding our coding to the other figures, some of the basic elements of our visual lexicon emerged in an iterative process. Akin to a process of axial coding (Figure 1) as suggested by Strauss and Corbin (1998), we explored relationships among groups of basic visuals, iterating back and forth between data analysis and the literature the better to understand emerging themes and to group the basic elements. Initially, we surveyed the paradox literature and identified relevant concepts at the heart of paradox depiction. In doing this, we mirrored methods of discourse analysis that are based on the frequency of types of words (e.g., Tausczik & Pennebaker, 2010). Inspired by the fundamental assumption of paradox theory, the idea that social organization is invariably characterized by interdependent contradictions, we tried to identify opposite pairs that could be used to typify the meaning of these basic symbols. In so doing, we identified various fundamental contrasting dualities or antinomies. Antinomies, defined as pairs of concepts with opposite meanings, constitute a typical device to organize knowledge; they are a primal determinant of those competing tensions that paradox theorists explore (Keller & Chen, 2017). Using opposing pairs of concepts to codify meaning in paradox scholarship constitutes an effective way of representing convergent or divergent currents (Schad et al., 2016) (see Table 1 for our definition of antinomies). We came up with three pairs: equilibrium/disequilibrium, open/bounded, and linearity/recursivity. These ideas capture fundamental meanings conveyed by different symbols aligned with debates in the paradox literature, as well as the organizational literature more broadly, as we will highlight in our findings.
Definitions of antinomies.
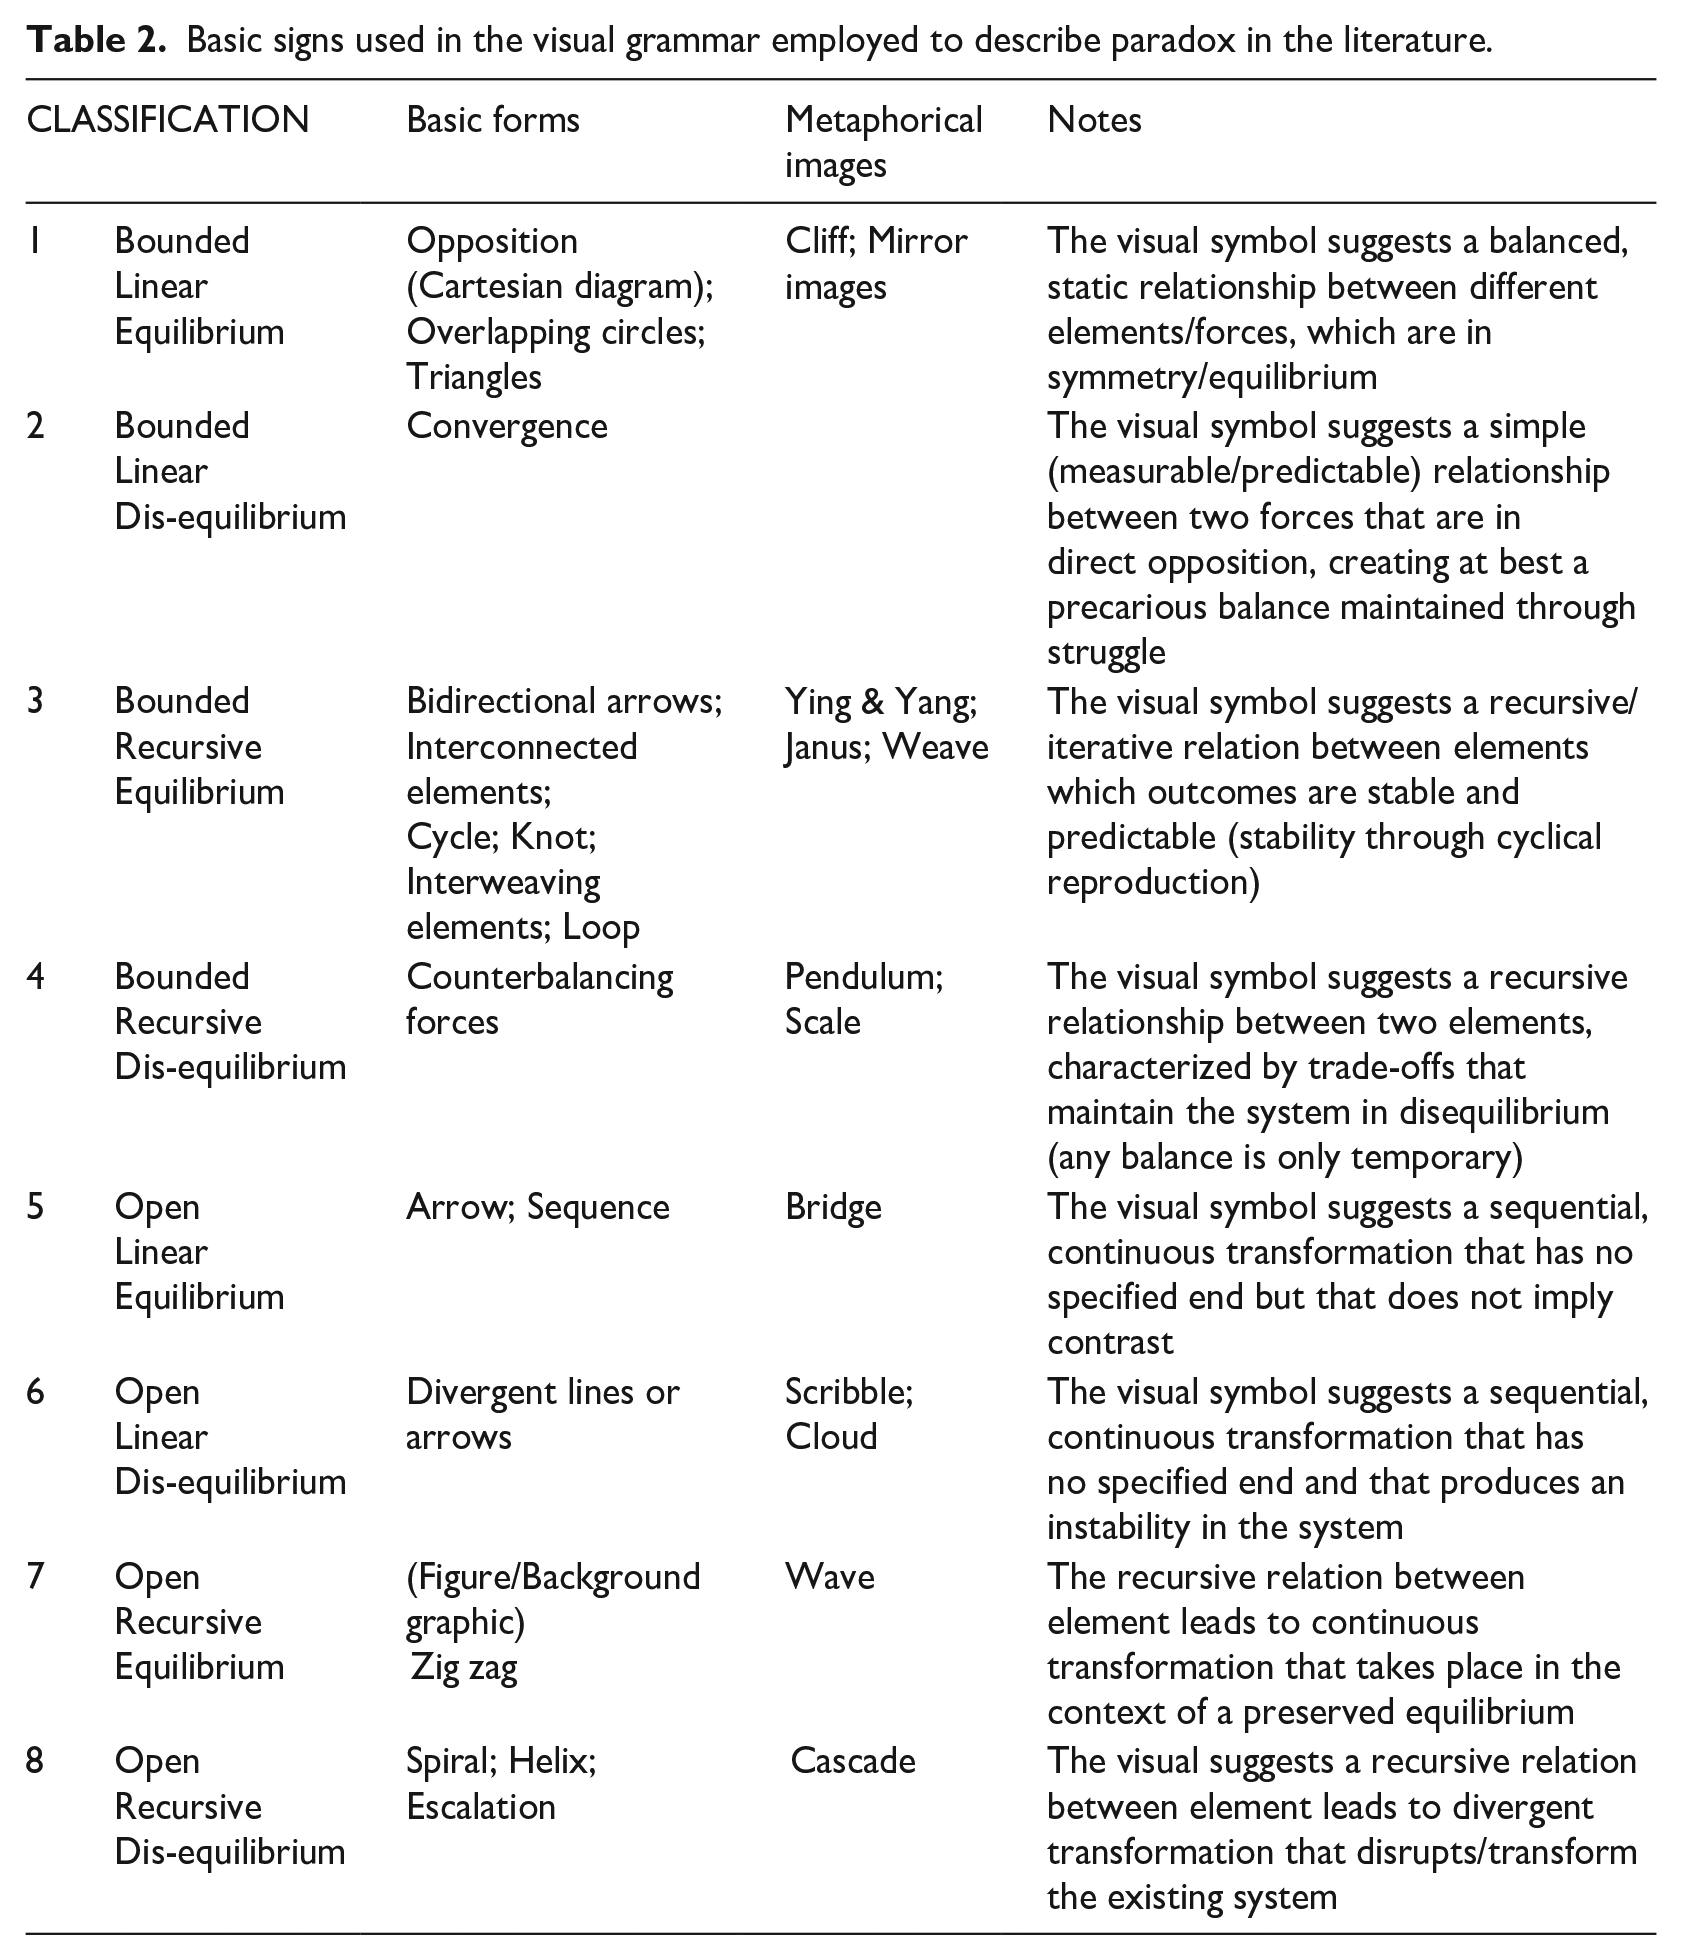
Antinomies emerged as we iterated between data and theory. Some alternative antinomies were considered (e.g., flux versus static) and then discarded because they were ambiguous or redundant when it came to making sense of our basic sign lexicon. The whole team were involved in refining and populating the emerging classification device (Table 2). Discussions on disagreements helped refine our typology. Moreover, the six polar elements composing the three selected antinomies can be unequivocally associated with specific graphic signs. For instance, circles are a clear representation of recursivity, while straight lines and arrows are eponymous of linearity. Similarly, signs representing openness (e.g., steps) suggest open systems with no defined boundaries and no predictable ends, while signs representing boundedness (e.g., cartesian diagrams) evoke bounded systems and a predictable end. Finally, some images (e.g., knots) are associated with stable balance, while others (e.g., pendulum) suggest the potential for instability and disequilibrium because of exogeneity. Some signs provoked questions; for example, we had originally positioned the scale as a sign of disequilibrium but not if the scale was “balanced.” We thus differentiated between the balanced scale (= equilibrium) and the unbalanced scale (= disequilibrium). Similarly, we first considered cartesian diagrams as closed but subsequently realized that arrows in cartesian diagrams may signify openness; despite this, in most cases we categorized cartesian diagrams as bounded (e.g., in Ashforth, Rogers, Pratt, & Pradies, 2014 or Besharov & Smith, 2014). Raisch, Hargrave, and van de Ven (2018) offered a rare example of arrows signalling openness in a cartesian diagram, reinforced by the existence of an additional arrow at the end of the graph.
Basic signs used in the visual grammar employed to describe paradox in the literature.
Step 3. Synthesizing themes into aggregate theoretical dimensions
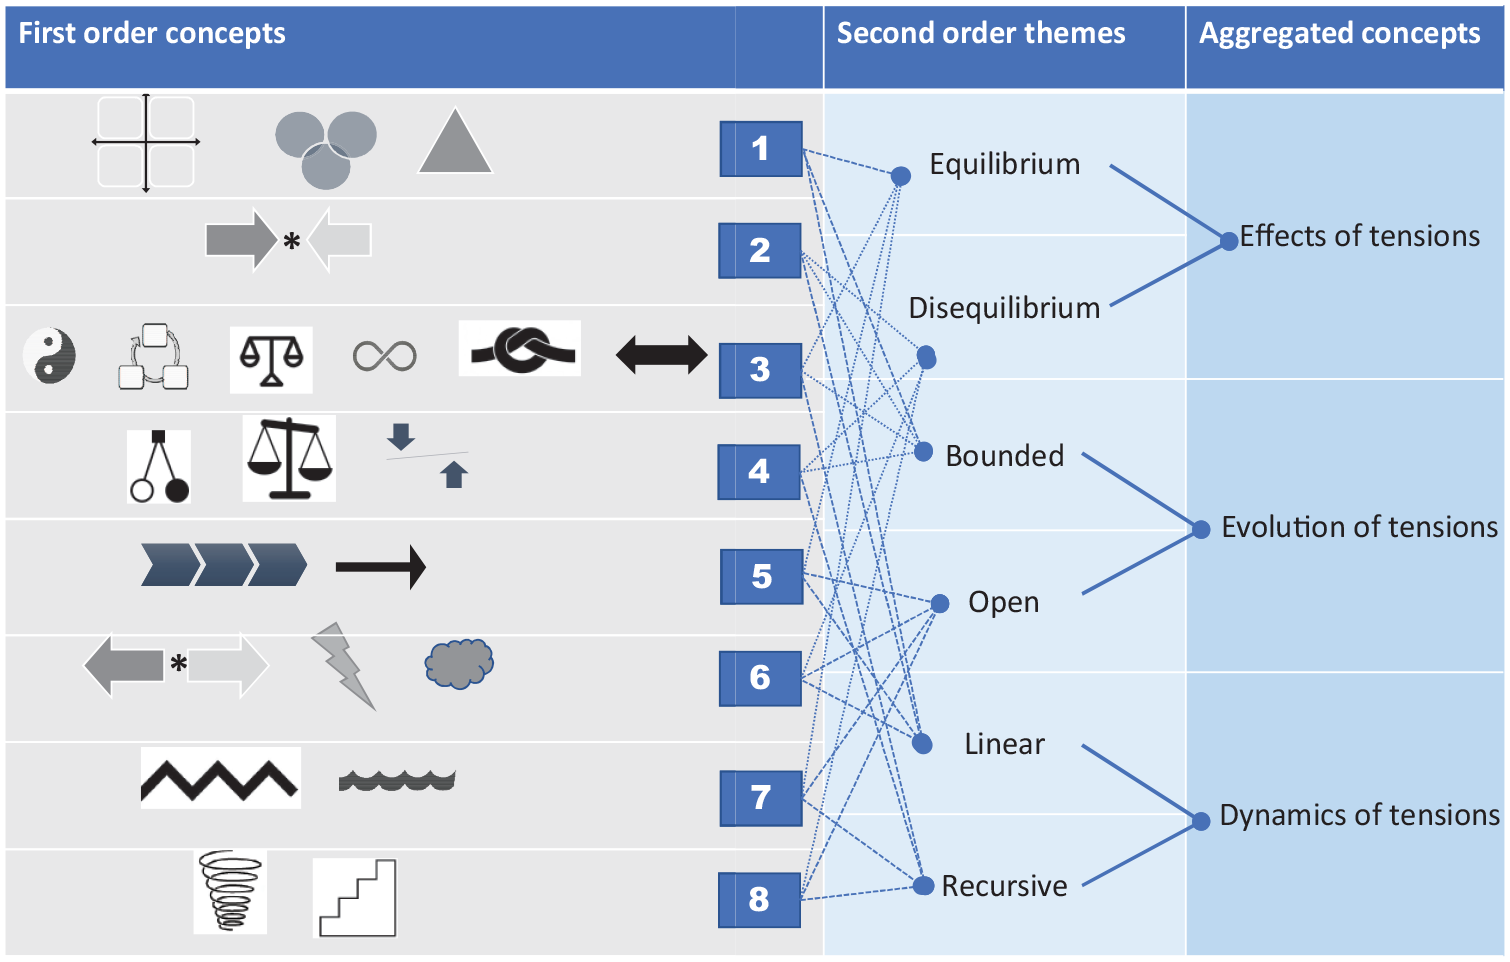
Then, we sought to understand the connections between the themes that made up the antinomies and theorize their interrelations (Whetten, 1989) by engaging the paradox literature. We realized that the equilibrium/disequilibrium antinomy spoke to the consequence of tensions (and responses to them), while the bounded/open antinomy pointed to the evolution of these tensions and linearity/recursivity to their dynamics.
Step 4. Outlining and refining an emerging classification device thanks to the three antinomies
The choice of these three antinomies enabled development of an exhaustive typology to categorize all the visual signs (or basic elements) included in the works we examined, covering different phases of paradoxes. By combining these three pairs we developed a typology of eight possible classes, in which we have collocated the 30 basic figures (see Figure 2). All elements of imagery, including complex images that could not be broken down in their constituent components (e.g., the picture of the bridge, as opposed to the boxes and arrows in a model), have been associated to one of the categories that result from the combination of the opposites present in the three antinomies. Once the classificatory device was refined, disagreement between the authors coding the images independently dealt with how to “decompose” a complex picture, including multiple signs, rather than how to “pigeonhole” a single visual element. For example, we had to interpret how to code a loop incorporating arrow signs; after discussion, we agreed that the presence of the loop superseded the arrow, reinforcing the circular flow without suggesting linearity. Only when an arrow emerged out of the loop, was it coded as a separate element. All attempts at organizing reality through typologies (Cornelissen, 2017) create a vivid but necessarily artificial separation. Ours were ordered by using the well-known typological device of the two-by-two matrix (Lowy & Hood, 2004). The classic two-by-two diagram was enriched by the inclusion of a third dimension (linearity vs. recursivity), allowing ordering and placing in relation to alternative symbols that can be used to describe paradoxes without bundling in the same category visual representations that are semantically distinct.

Classification device.
Step 5. Classifying all elements in the classification and making sense of it
We counted how many of these constitutive elements were present in each academic work, looking at the use of different classes of signs. Note that we conducted our analysis per figure. Thus, academic work including a single figure composed of heterogeneous signs (i.e., belonging to different classes) was coded for several classes. Similarly, because we conduced our analysis per number of figures, academic works including two figures composed of homogeneous signs would be coded twice. If multiple signs belonging to the same class (e.g., multiple arrows) were present in the same figure, they were counted only once. Table 3 illustrates the frequency of appearance of each class of basic forms. Finally, we considered how each type of sign featuring in a figure contributed to the three antinomies: for instance, a yin-yang sign was counted as representing “equilibrium,” “boundedness,” and “recursivity.” For a detailed overview of the coding per figures, please see our Online Appendix.
Frequencies of appearance of a class across the 266 figures analysed.
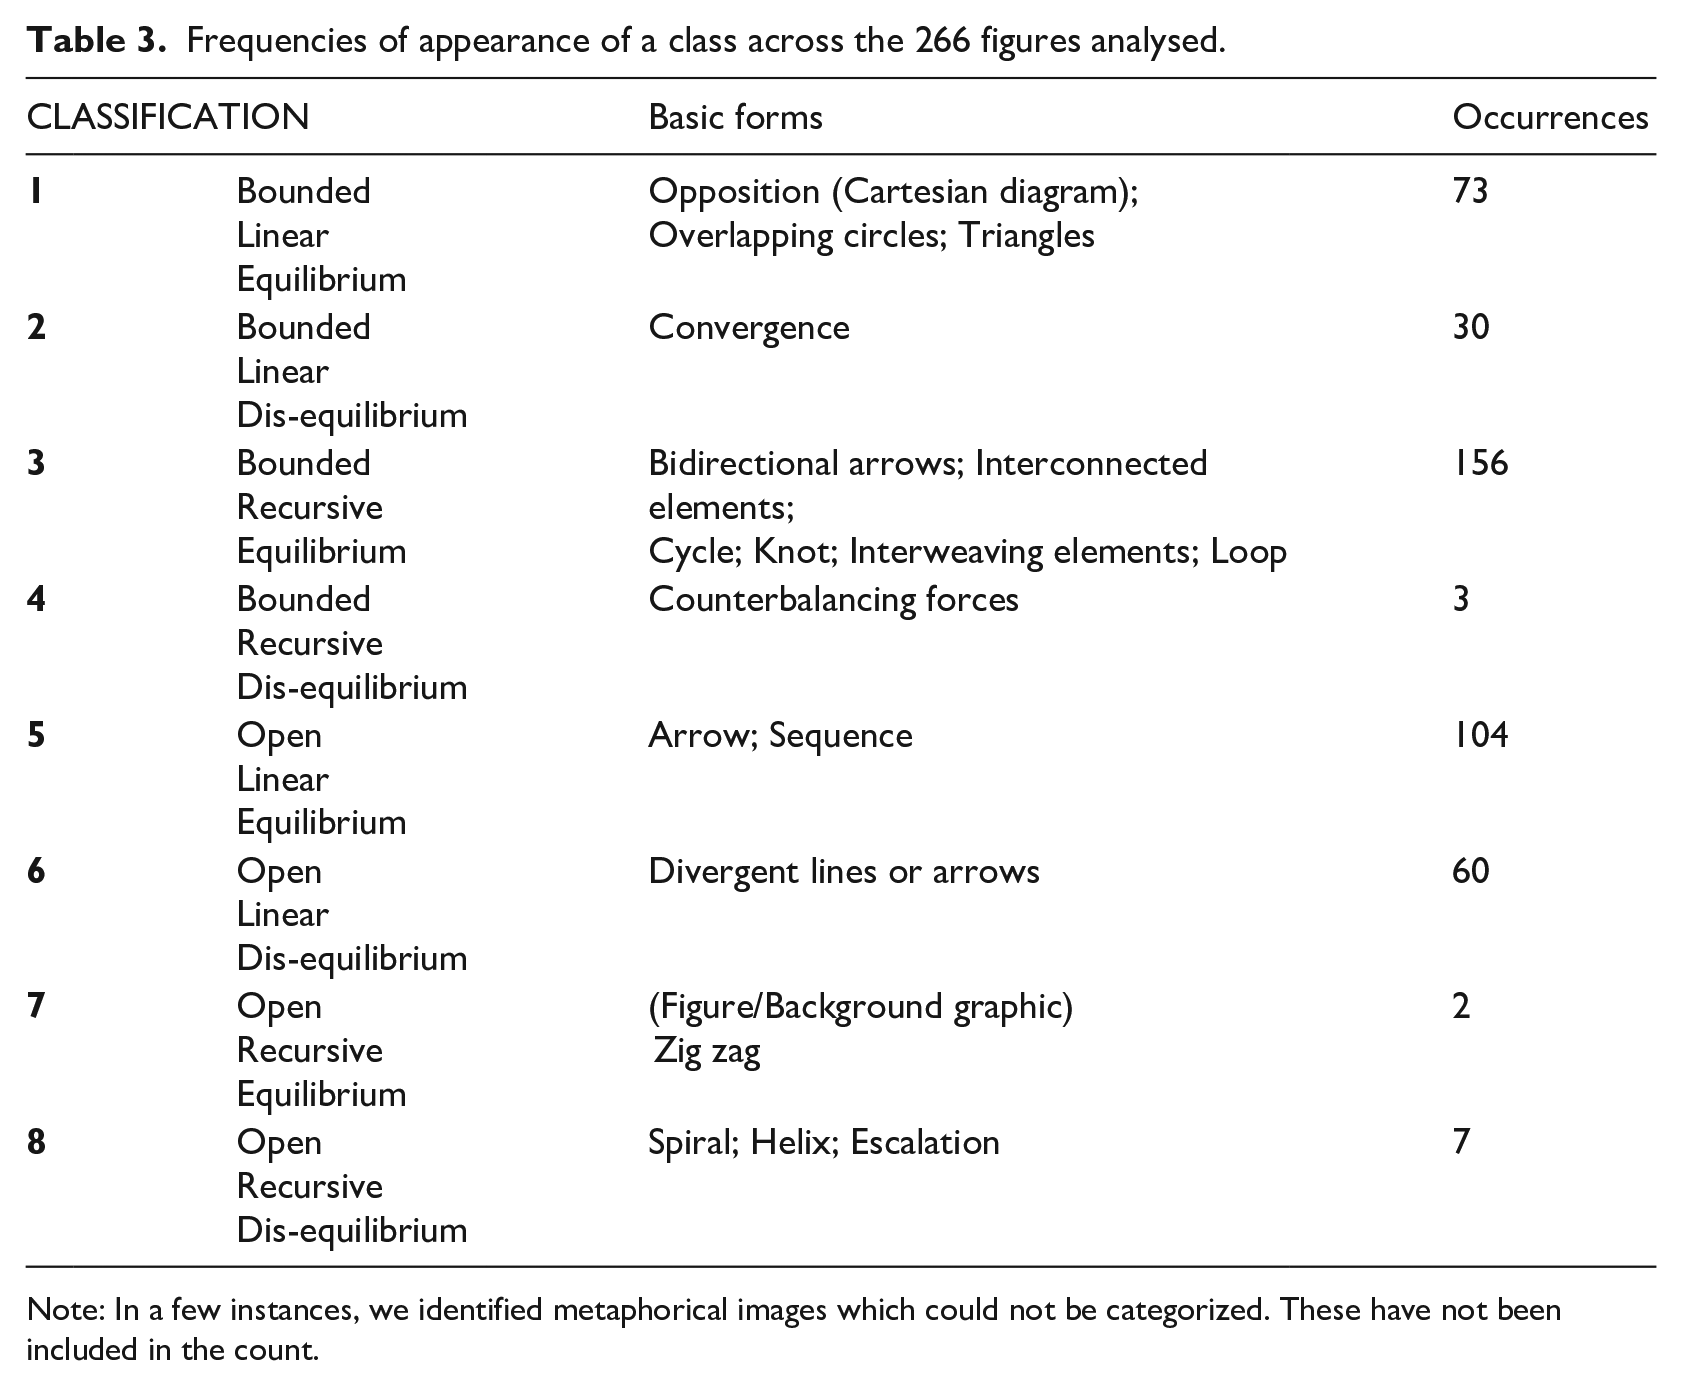
Note: In a few instances, we identified metaphorical images which could not be categorized. These have not been included in the count.
We addressed variance in classification depending on whether the article was empirical or conceptual; whether the article represented paradox dynamics (i.e., focused on describing how a paradox evolves) or paradox description (i.e., focused on describing a paradox). 1 The results presented in Table 4 suggested little variation between empirical and conceptual articles, with more variation between articles representing paradox dynamics or paradox description. Using this method, visual discourse analysis revealed evolutionary directions in paradox literature as well as less frequent areas of discussion (in relation to the three fundamental concerns identified by the aggregate theoretical dimensions).
Count of signs in each antinomy.
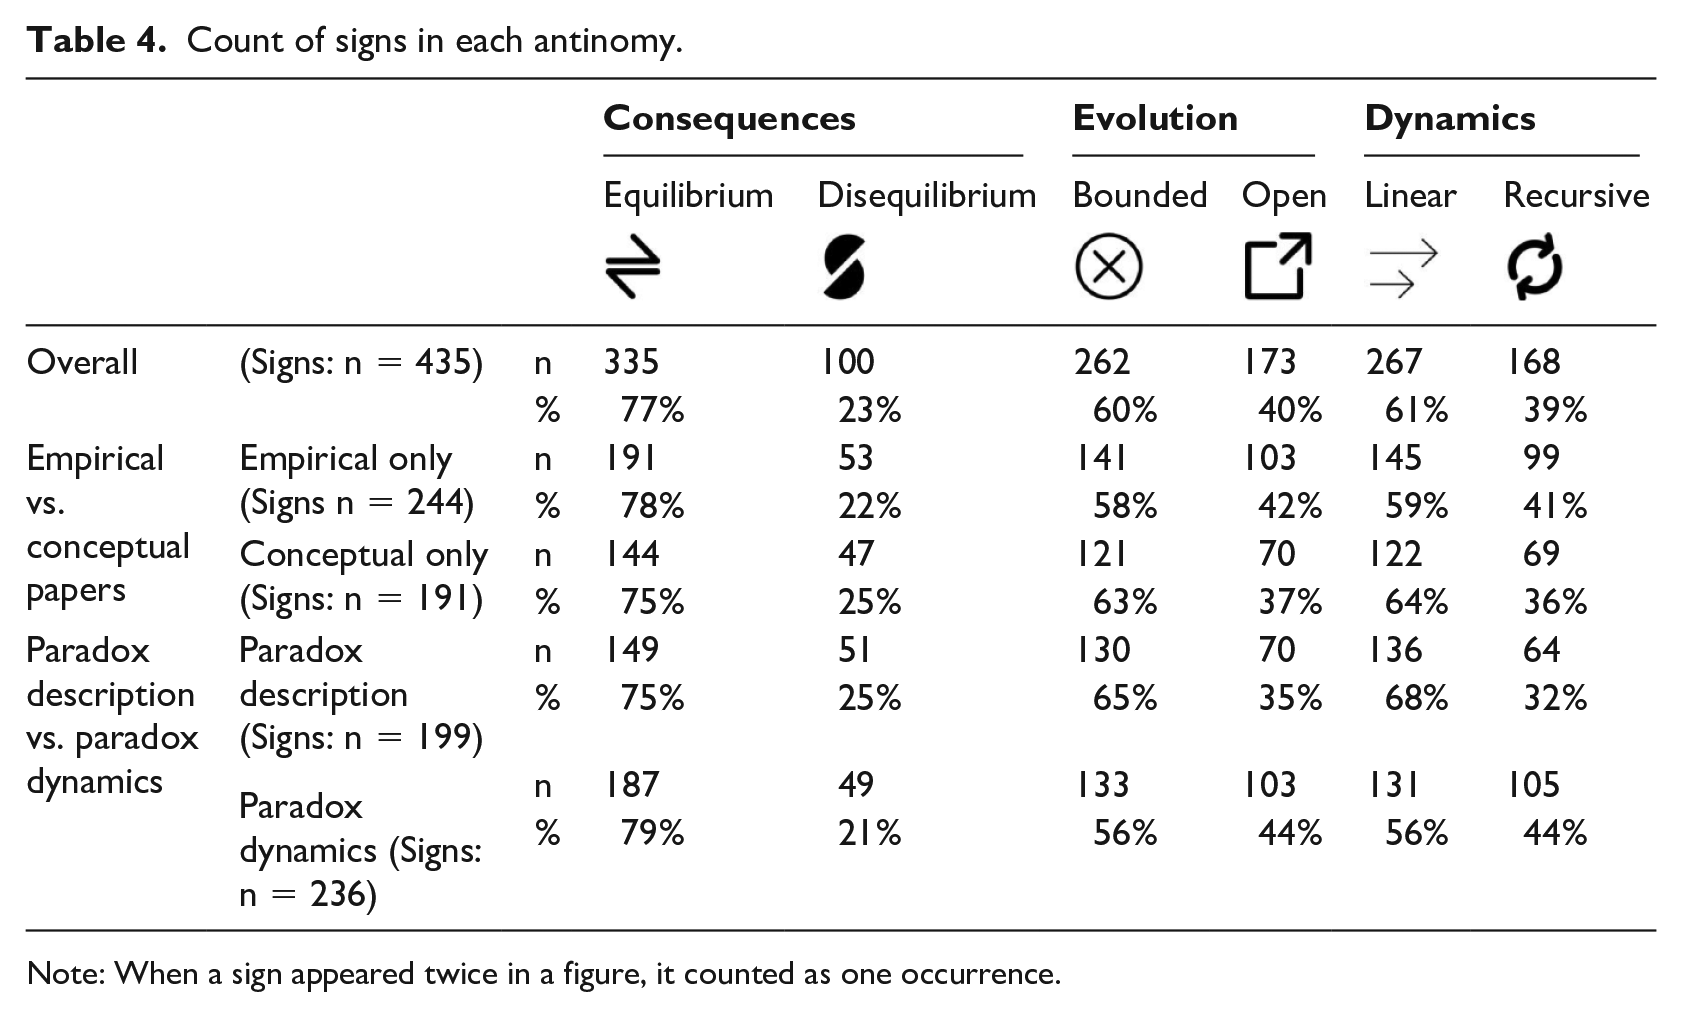


Note: When a sign appeared twice in a figure, it counted as one occurrence.
Findings: The Antinomies
The first antinomy that surfaced is equilibrium versus disequilibrium (Cunha & Putnam, 2019). When facing competing demands, this pair represents opposite tendencies to (1) find balance and synergy, while preserving the status quo (Smith & Lewis, 2011), or to (2) recognize the state of constant imbalance brought about by oppositions that are interrelated, as well as how opposite tendencies are constantly in flux, disrupting the status quo (Hargrave & Van de Ven, 2017). The tension between the “orthodoxy” that privileges a symmetrical and hence power-neutral view of paradox (Van Bommel & Spicer, 2017) and studies that highlight asymmetry within opposite pairs and the intertwinement of paradox and power is also represented (Berti & Simpson, 2021b; Gaim, Clegg, & Cunha, 2021). Equilibrium/disequilibrium is a key tension in analysis of economic policy interventions as well as a foundational tension in structural functionalist theory (Parsons, 2013). Conveyed through signs such as the pendulum (i.e., disequilibrium of stasis) or overlapping circles (i.e., equilibrium), this antinomy was particularly relevant in representing paradox processes. In our analysis, equilibrium refers to a sign that points to balance and symmetry between opposites, leading to stable outcomes. By contrast, disequilibrium describes a sign that suggests imbalance and asymmetry between opposites, leading to outcomes other than stasis.
The second antinomy, open versus bounded, captures the problem of considering paradox concisely in the perspective of a bounded or open system (Schad & Bansal, 2018). Such an opposition points to the problem of studying paradox at multiple levels (Berti, Simpson, Cunha, & Clegg, 2021; Gotsi, Andriopoulos, Lewis, & Ingram, 2010), as nested and interwoven (Andriopoulos & Lewis, 2009; Cunha, Simpson, Clegg, & Rego, 2019). The degree of boundedness/openness, particularly relevant in looking at paradox processes, is the key tension in systems theory of organizations (Scott & Davis, 2015). Open system epistemology emphasizes how paradox interacts with other elements of organization; open-endedness occurs because of the ontological unfolding and indeterminate nature of the world and its events (Hadjimichael & Tsoukas, 2019), stressing paradoxes’ constant evolving. By contrast, a bounded system approach tends to focus on systems that are isolated from their environment, emphasizing paradox as a self-contained occurrence (Tsoukas & Cunha, 2017), an antinomy captured in visual circles and zigzags. More globally, we use the attribute “open” to describe a sign that suggests a divergent process in which outcomes are indeterminate, without a defined end, or a system whose boundaries are not set. By contrast, being “bounded” refers to a process that is convergent, with a predictable end or a system which is self-contained and immanent.
The third antinomy, recursive versus linear, represents the tension between the need to signify paradox’s distinctive epistemological foundations, characterized by the self-reproducing nature of social phenomena (Hernes & Bakken, 2003), while managerial legitimacy strives for ways to “break” the vicious circles that paradoxicality generates, thus highlighting their practical transformative potential (Smith & Lewis, 2011). Literature explores both the iterative ways in which interdependent tensions self-reproduce, becoming persistent paradoxes (Schad et al., 2016), as well as the progression from one step to another entailed in working through and transcending paradoxes (Abdallah et al., 2011; Bednarek, Paroutis, & Sillince, 2017). A clear relation can be identified between paradoxes and responses to paradoxes or steps to escape paradox (Pradies, Tunarosa, et al., 2021). In positivist and phenomenological accounts of causality in organizational analysis, it is linearity/recursivity (Hernes & Bakken, 2003; Meyer, 1972) that is at issue. Single arrows signify linearity while recursivity was a recurrent theme in visuals with spirals. Signs that indicate a sequence of events that progress in a single direction are linear; by contrast, signs that illustrate a process that iteratively loops into itself, leading to virtuous or vicious cycles, highlight recursivity.
Findings: The Evolution of Paradox Theory through Visuals
The above-mentioned antinomies identify eight classes categorizing basic visual signs. One rule we constructed was not to consider individual shapes per se but clusters of “similar” shapes identified by classification. The eight classes may be viewed as ways of seeing paradox as an umbrella concept, each portraying dimensions absent in the others. Below we expand on the eight classes identified, drawing on illustrative figures to exemplify our thoughts (also see the Online Appendix). As each figure may have multiple elements belonging to different classes, we tried to pinpoint figures in which the class in question is particularly striking.
Class #1. Balanced opposition (equilibrium—bounded—linear)
Class #1 emphasizes persistent oppositions in relative balance. The signs in this class often portray a simple, clear, and static relationship between the elements of the model, which stand in symmetrical opposition to one another. The tensions constitute a bounded system in which no outside forces have an impact on the relationship among competing demands. The most common forms include overlapping circles, cartesian diagrams or triangles, and other basic geometrical shapes. For example, Bloodgood and Chae (2010) use a cube to capture several paradoxes that cultural organizations face in promoting art, music, and entertainment. The opposing poles of each paradox (e.g., autonomy versus control) are depicted as opposite corners of the cube. The authors theorize that organizations manage paradoxes integratively as they move within the cube (from one corner to the other) to find equilibrium, thus visually enabling the theorization of opposing forces within which there is movement and adaptation.
Cartesian diagrams also emphasize persistent oppositions in relative balance since the interrelation between both poles is only possible when considering the intersection of the axis opposition (Bansal, Bertels, Ewart, MacConnachie, & O’Brien, 2012; Erdogan, Rondi, & De Massis, 2020). Tensions are thus contained within ideal boundaries whose outcome is somewhat predictable, preserving the status quo. Thus, movements and transformations are linear, in that the paradox follows a predefined path along relatively predictable steps or phases. Two-by-two models, as used by Besharov and Smith (2014) and Smith (2014), or the concentric circles and triangles employed by Engeström and Sannino (2011), illustrate this class of balanced opposition. Sometimes these elements come as a background, associated with “dynamic” signs, as in the use of cartesian coordinates which frame curves (Hahn, Pinkse, Preuss, & Figge, 2015; Ofori-Dankwa & Julian, 2004). This class of signs were found in 27% of the figures.
Class #2. Uncertain struggle (disequilibrium—bounded—linear)
Similar to the visuals in class #1, this representation of paradox emphasizes a simple relationship between forces in direct opposition. However, the visuals in this class underscore the intractable struggle between forces and the process of imbalance that ensues. The struggle locks the system in its own closed realm, isolated from the environment. While the visuals in this class do not necessarily portray steps or phases, the relationship between the opposing poles prevents any form of recursivity or virtuous dynamics as permanent struggle is represented. Commonly used visuals in this class include arrows converging towards one point. In the sources we examined, arrows typically appear in conjunction to show the interplay of forces caused by the paradox (e.g., Berti & Simpson, 2021a; Langley & Klag, 2019; Pradies, Delanghe, & Lewis, 2020). For example, discussing the paradox faced by middle managers, Pradies et al. (2020) portray middle managers as positioned between the top management team and the followers, connecting them. The opposite arrows, stemming from the top management team and from followers converging towards leaders, illustrate the leader/follower paradox in which connecting leaders are both leaders to some and followers to others struggling to meet opposite demands. Similarly, Langley and Klag (2019) use opposing arrows to theorize a constant struggle for field researchers, who navigate the tension of personalizing their research by becoming deeply involved with the subjects and elements of a particular research setting while depersonalizing the research as required by academic protocols. Berti and Simpson (2021a) also use clashing arrows to theorize how episodic and systemic powers underlie paradox dynamics in organizations. This class of signs is present in 11% of the figures.
Class #3. Cyclical reproduction (equilibrium—bounded—recursive)
The visuals in class #3 emphasize a recursive dynamic between tensions. That is, the visuals show opposite forces defining and shaping each other in a repetitive process. Opposite forces are thus simultaneously kept together and pulled apart in a cyclical reproduction critical for achieving stability. The signs convey a sense of self-containment of a system isolated from its environment. Multiple signs occur in this category, including bidirectional arrows, feedback loops, the yin-yang, the Janus relationship, knots, interwoven patterns, etc. For example, Lewis and Dehler (2000) theorize the control-flexibility paradox in the classroom by using a loop on top of a cartesian diagram. They draw on the work of Johnson (1992), who emphasizes the need to understand oppositions and how opposite poles interrelate, entrapped in a continuous and repetitive dance across positive and negative dimensions of each pole. The loop highlights the infinite nature of this relationship and how it is only by understanding the interrelation between the poles that one can navigate paradoxical demands. These authors use the control-flexibility paradox whereby actors learn to value the positive dimensions of focusing on control yet, if they focus on it, they may end up experiencing the negative dimensions of control, namely, extreme rigidity.
The loop suggests that to overcome the pitfalls of control, actors need to focus on its opposite pole, namely flexibility, while being aware that too much flexibility can also result in negative outcomes. In sum, this visualization represents theorizing opposites as they interrelate. The fact that the loop highlights paradoxes occurring within a bounded system also highlights the persistent dynamics of such interrelations. Slawinski, Winsor, Mazutis, Schouten, and Smith (2021) offer a model for managing paradoxes regeneratively. The figure incorporates a feedback loop and bi-directional arrows to suggest cyclical reproduction.
Paradox is represented as a dynamic process generating persistent repetitions (ad infinitum), in the form of loops, knots (e.g., Sheep, Fairhurst, & Khazanchi, 2017) or cycles (e.g., Pradies, Tunarosa, et al., 2021). In such a view, analysis of paradox implies processes in their long-term dynamics. Viewing paradox as a dynamic process highlights that systems dynamics may need to be explored over the long run, with temporary adjustments being part of longer cycles. In this representation, persistency is a consequence of the recursive dimension of paradox tensions, exemplified in the classic dynamic model of organizing by Smith and Lewis (2011). It is this class of symbol that dominates the literature, featuring in 58% of the figures. The dominance of the yin-yang was pervasive in anchoring the field of paradox in a certain way.
Class #4. Oscillation (disequilibrium—bounded—recursive)
The visuals in this class point to a recursive relationship between two elements, characterized by trade-offs that maintain the system in disequilibrium, in constant imbalance, as any balance is only temporary and precarious. These signs point to a bounded system, in that the elements are self-contained, limited by how far from the middle point they diverge, evident in visuals of counterbalancing forces, images of scales or a pendulum. Authors use the scale or other visuals from this class in two ways in their theorizing. First, a swinging pendulum points to a constant lack of stasis within a bounded system with recurrence of disequilibrium at the center (see for example, Figure 3 in Lewis & Dehler, 2000). Second, this sign is used to theorize either/or choices or dilemmas that paradoxes create and the related vacillation of processing them, as in Smith and Lewis (2011), stressing either/or ways of thinking about paradoxes. Smith and Lewis’ (2011) example in a disequilibrium state (with one side heavier than the other) aligns with our sensemaking of the class. Despite the subtleties offered by such signs, they are extremely rare in our review, occurring in only 1% of the figures coded.
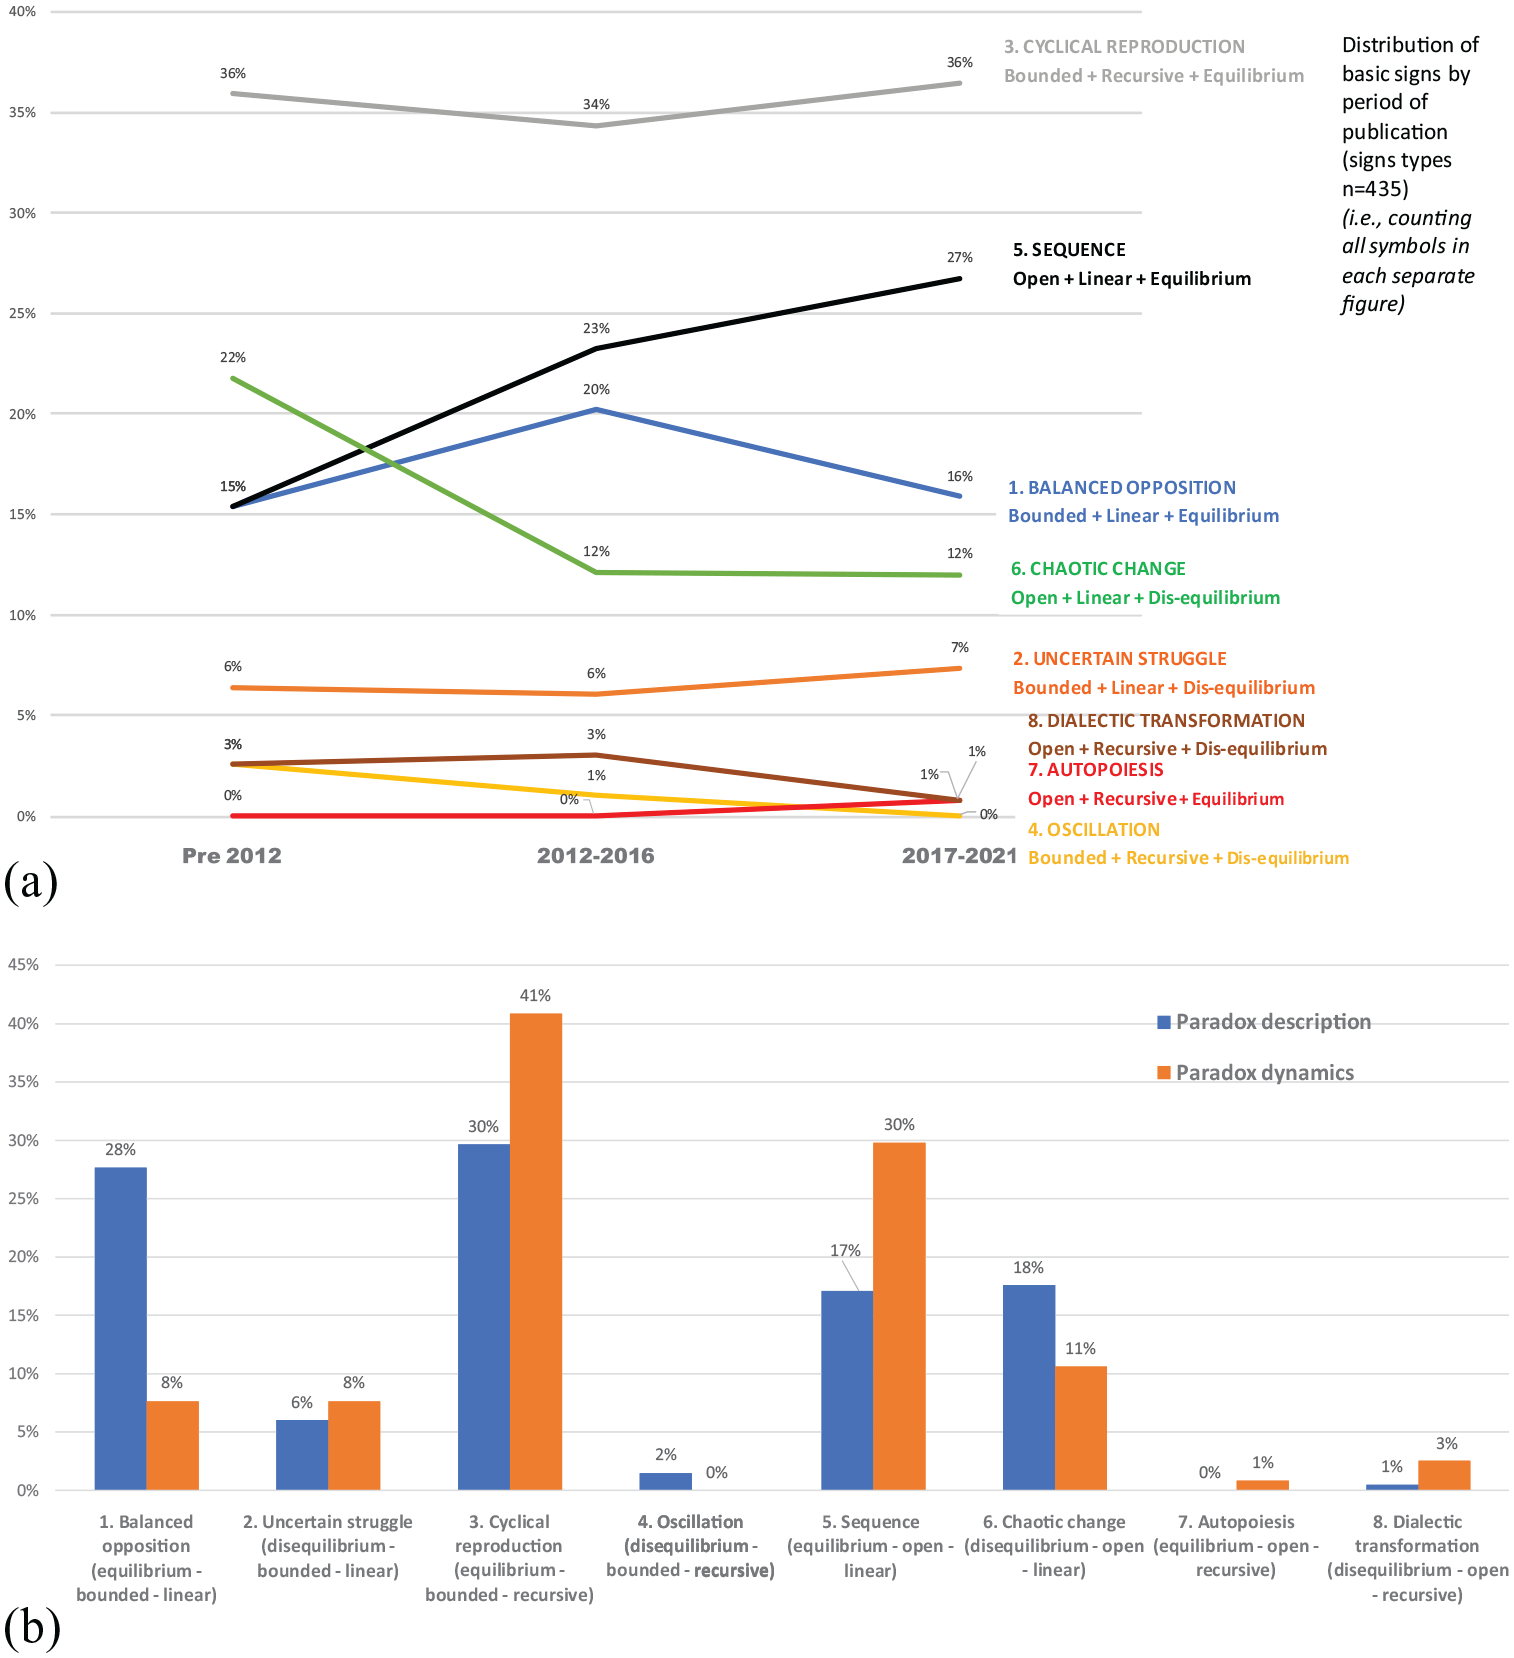
(a) Evolution of classes over time and (b) Distribution of classes between visuals that represent paradox description and paradox dynamics.
Class #5. Sequence (equilibrium—open—linear)
The signs in this class suggest a sequential, continuous process in a system that may interact with its environment because it is not bounded. These signs portray various straight arrows or sequences. They abound in graphical representations in management studies. It is thus not surprising that 39% of the figures coded included these signs, although it is not as dominant as class 3 (i.e., cyclical reproduction). Scholars use this sign to theorize steps in a transformational process or a very simple relationship, while allowing a connection with the environment. For example, Pradies, Tunarosa, et al. (2021) use this sign to highlight the steps of moving from vicious to virtuous dynamics. In their study of plant purchasing managers (PPMs) entrenched in vicious dynamics at TradeCo, they chart the progression that PPMs go through from vicious cycle, cycle break, cycle reversal, and virtuous cycle. Other simple arrows are used to highlight the impact of the HR team on this process, showing how such simple arrows allow for connections between those facing the paradox and supporting actors who leverage the social-symbolic context. Similarly, Calabretta, Gemser, and Wijnberg (2017) resort to such arrows to present their three-step model of the intuition-rationality paradox, using them to convey the progression of engagement with paradox that members of an innovating company experience along with professional design processes.
Class #6. Chaotic change (disequilibrium—open—linear)
The signs in this class suggest a sequential transformation that is not bounded, has no specified end, and produces system instability. Common visuals in this class are divergent lines or arrows. There is a lack of equilibrium that emerges from diverging lines or even from an image of a scribble or a cloud (with no clear pattern). Paradoxical tensions are represented in this class of signs as change motors, accentuating existing qualities or deficiencies in an organizational context. In this sense, the paradox expresses a dynamic with inertial properties: the dynamics of paradox will accentuate pre-existing inertial forces, deepening existing processes. A classic example of this effect is provided by the tendency of successful organizations to repeat and reinforce past practices, leading to a simplification that is functional (in the short term) while, in the long term, dysfunctional (Miller, 1993). There is one main sign in this class, namely two arrows stemming from the same point and going in opposite directions. Lewis, Welsh, Dehler, and Green’s (2002) article on tensions in product development constitutes an example of such a sign used to theorize the notion of being torn apart, whereby the arrows visualize the push of opposite management styles (emergent vs. planned) on the way in which product development occur.
Examples of articles in this class also include Sharma and Good (2003), who depict tensions in a sharp-edged cloud, while Lüscher and Lewis (2008) use a cloud that is softer edged. The authors use clouds to highlight the workable certainty that Lego middle managers reach together with a consultant as they work through paradoxical demands as well as to describe the messes that arise from the confrontation with multiple paradoxes. The choice of a cloud represents the constant shifting complexities of a dynamic situation. Lüscher and Lewis (2008, p. 235) recognize the disorder tied to the changing reality that accompanies the mess (represented by the cloud) but they also stress “a negotiated understanding, sometimes even more complex than the former understanding, but eventually more meaningful and actionable.” As a class of symbols this is neither rare nor is it one of the most frequently employed, being featured in only 23% of the figures examined.
Class #7. Autopoiesis (equilibrium—open—recursive)
The signs in this category point to the recursive relation between elements that lead to continuous balance within an enclosed system, thereby preserving equilibrium. We use the term autopoiesis to describe a system capable of reproducing itself by creating its own parts (Luhmann, 1995). The zigzag is the sign that is found in this category, while the wave is the image. Tuckermann (2019) uses the wave to theorize the oscillating nature of latency and salience. Smith and Besharov (2019) stress the oscillating pattern between business and social mission undergone by the organization they studied. They theorize an open recursive phenomenon with the breadth of the oscillation changing over time, while the oscillation is a repetitive figure. They thereby visualize and theorize a management of paradox imbued with changing directions as the organization bumps against guardrails—preventing the organization from drifting away from the paradox.
The category is extremely rare, accounting for only 1% of depictions. It is exemplified by a device frequently used in lay literature to represent paradoxical situations but not yet employed in the paradox literature, although it has been invoked by Orlikowski (1996) to study transformation. It is a class of figures that exploits one idiosyncrasy of our visual system, the tendency to simplify visual scenes into two distinct components: a figure in the foreground and a background containing everything else. If the background has an intelligible shape, then it becomes possible to switch back and forth between the perception of two different shapes, that constitute each other’s background (M. C. Escher employed this visual trick in some of his artworks). This type of symbology captures well the concept of interdependence of opposites since figure and background require each other to be discernible and we are forced in a loop as we attempt to capture both in our perception.
Class #8. Dialectic transformation (disequilibrium—open—recursive)
The signs in this class show a recursive relation between opposing elements, which leads to a divergent transformation that disrupts the existing system. The visuals in this class include the spiral and the helix, as well as escalation and cascade. The recursive relation suggested by these signs captures the key idea behind “disequilibrium”—that “balances are slightly imbalanced” (Kegan, 1982, p. 108). When interpreted through a dialectic lens, the recursive relation could also portray the idea that a thesis generates its own antithesis, before the clash of the two bring about a new thesis (synthesis) that will, in turn, produce a new antithesis, in a continuous transformation, a permanent dialectic (Clegg & Cunha, 2017; Clegg, Cunha, & Cunha, 2002). In this way, the signs in this class are critical to current conceptualizations of paradox, for they convey, first, that finding balance across competing demands is an ongoing struggle, and second, that this struggle repeats itself over time with increasing levels of complexity. Hence, in their theorizing, paradox scholars who employ this class of signs tend to focus on the mounting effects brought about by competing demands, especially when these constitute vicious or virtuous cycles. An early example is Sundaramurthy and Lewis’ (2003) use of a spiral to describe the reinforcing cycles of control and collaboration in organizational governance.
While this class is rare (present in only 3% of the analysed figures), our review shows a recent resurgence in the use of tri-dimensional spirals to represent paradox. For example, in their study of a start-up that radically altered the music industry, Kassinis and Panayiotou (2017) use a helix to depict the stability-change paradox. They urge the use of such tri-dimensional figures in capturing change processes to overcome the limitations of language and of the more traditional, static visuals. They argue (p. 158):
The helix captures more powerfully the complexity and dynamism we seek to portray: through movement in a 3-D plane, it exemplifies changing and offers a cognitive way out of the change-stability duality. It also holds the potential of the ‘super-helix’ and the ‘ripple effect’, as a further enhancement of the basic model [. . .] More importantly, the 3-D component of the helix illustrates the idea of ‘centrifugal structuring’ that Clegg et al. (2002, p. 495) describe, so that paradoxical tensions can be simultaneously held in suspension and act as a dynamic, creative force, as they revolve around a structural pole.
Understanding the prevalence of these classes
Our analysis revealed that these “visual semiotics” have not been consistently or continuously used to visualize paradoxes. Rather (see Table 3) some forms of representations tend to be prevalent (in particular, classes #3 and #5) while others are rarely employed (e.g., classes #4 and #7 or even #8). Also, while some sign categories are used constantly over time, others seem to go in and out of fashion (see Figure 3a). For instance, the use of class #3 is consistently high while there was a spike in class #1 signs between 2012 and 2016, followed by a recent decline. The opposite happened to class #5, appearing in half of papers before 2012, declining in the following 5 years, before heightening in the last period. Randomness may apply. The use of classes of signs varies depending on the purpose of the picture (Figure 3b): when figures are meant to represent paradoxical phenomena, a broader range of sign types is employed. By contrast, figures describing paradox dynamics tend almost exclusively to use the circle and the linear arrow.
Looking at the appearance of an antinomic class of signs is also revealing. In general, there is a prevalence of open over bounded, linear over recursive, and equilibrium over disequilibrium, in the visual representation of paradox (Table 4). However, the picture is more nuanced: while representations suggesting a degree of equilibrium are present in practically all papers, the ratio between linear and recursive, and between open and bounded, is far more balanced.
Discussion
In this article we asked the broad question: How do visuals in paradox academic work address the tension of convergence and divergence in paradox theorizing, focusing on (1) what do visual representations in paradox academic work reveal about paradox and its assumptions and (2) what new possibilities and areas of exploration does mapping the literature reveal? To answer these questions, we approached visual representation as a semiotic activity that occurs alongside written texts and draws on different categories of signs to produce and share meaning (Cobley & Jansz, 2010). More specifically, we developed an original method for analysing the visual elements of the paradox academic literature, akin to discourse analysis of written texts, based on the frequency of use of the basic symbols that compose visual representations of paradoxes and their dynamics. Analysing the meaning conveyed by these recurring symbols allowed us to advance a typology of eight classes of visuals, organized around three sets of contrasting dualities or antinomies.
As shown in Table 3 (frequencies of appearance), our findings demonstrate that some assumptions and ideas about what a paradox is and how actors respond to them are more prevalent than others. For instance, class #3 (cyclical reproduction) is prevalent. This seems logical as interdependence and persistence of opposition underlie the definition of paradox and are aligned with the notion of circularity and cyclical reproduction. More broadly, the prevalence of classes that convey equilibrium (particularly #1, #3, and #5) supports the critical view that paradox researchers tend to “tame” paradox, underrating the role of conflict and over-emphasizing synergy (Cunha & Putnam, 2019; Fairhurst, 2019). In fact, as shown in Figure 3a (evolution of classes), over time, the only class that increased in frequency emphasizes equilibrium (class #5), while the only one that decreased emphasizes disequilibrium (class #6). But even within a prevalent category of visuals, such as class #3, there is ample space to explore different forms of dynamic circularity (Tsoukas & Cunha, 2017). New questions might include: How can paradox create stuckedness (Hage, 2009)? Or how can paradoxes generate irresistible forces of transformation? The study of these expressions of out-of-control circles promises to offer new angles on the dysfunctions of paradox.
Our analysis also draws attention to the variety of visuals used by figures describing paradoxes versus those unpacking paradox dynamics. As shown in Figure 3b (distribution of classes), figures that unpack paradox dynamics tend to rely almost exclusively on two classes (class #3, cyclical, and class #5, sequence). By contrast, figures describing paradoxes rely on a wider range of classes (class #1, balanced; class #3, cyclical; class #5, sequence; and class #6, chaotic change). Broadening the sets of visuals used beyond those that have become conventional may facilitate divergence in theoretical ideas, as theorizing and visualizing go hand in hand (Ravasi, 2017). This is especially important for exploring paradox dynamics (Jarzabkowski, Bednarek, Chalkias, & Cacciatori, 2022; Pradies, Tunarosa, et al., 2021).
By employing a heuristic device (the antinomy-based classification) that is normatively exhaustive (it covers all possible visual forms, regardless of their appearance in literature), we also identify unexplored territories, showing which classes of visuals have been underused. For example, class #4 (oscillation) contains very little exemplars, even though visuals such as a pendulum or an unbalanced scale could be used to capture important developments in paradox theory, like the asymmetrical relationship of opposite poles and the need to “protect” the weaker pole of a paradox (Huq, Reay, & Chreim, 2017).
Our findings thus contribute to paradox theory in three main ways. First, we show that visual representations constitute the lynchpin between convergent and divergent forces, allowing scholars to simultaneously reinforce and challenge current understandings of paradox. Hence, we show that examining the theoretical development of the field without paying specific attention to the visuals is incomplete—analogous to analysing a speech act by focusing solely on the content of the communication and ignoring the non-verbal elements (e.g., pauses, gestures, emphasis, etc.) that bring meanings to life. Indeed, visuals reinforce the role of analytical discovery by positioning the phenomenon under study, showing the reader what is figure and ground, and highlighting key dynamics. But visuals also go beyond analytical discovery. Unlike written texts, which rely on a discursive mode of communication, visuals operate in a representational mode (Kress & Van Leeuwen, 2020) that does not require lengthy description or detailed elaboration to articulate an idea. As such, visuals facilitate an intuitive grasp of the ways in which researchers push the boundaries of extant knowledge.
This is consistent with research on visual argumentation (Groarke, Palczewski, & Godden, 2016), which suggests that visuals may open up previously closed sites of contestation (e.g., Sundaramurthy & Lewis, 2003), challenge taken-for-granted assumptions (e.g., Lewis, 2000), and create “mind-bombs” (DeLuca, 1999, p. 4) that significantly transform current understandings in a field (e.g., Jarzabkowski & Lê, 2017). In sum, visuals may directly call attention to those aspects of paradox that are not explained by prior research, making novelty apparent within the context of the familiar. For instance, the modified yin-yang in Gümüsay, Smets, and Morris’ (2020) study of the first Islamic bank in Germany captures dynamism in the context of equilibrium; the knot in Jarzabkowski et al. (2022) orients attention to the multiple paradoxes that characterize grand challenges in an interorganizational system; the two scales in Pradies’ (2022) study of French veterinarians highlight that any balancing act when navigating paradox entails finding dynamic equilibrium, not only between responses but also between emotional traces.
Second, our visual analysis contributes a tool for scholars to theorize competing demands. We induced three key antinomies, or dualities: equilibrium/disequilibrium, bounded/open, and recursive/linear. We see these antinomies as defining the terrain along which tensions have been theorized; they constitute the field’s “cardinal points” (see Figure 2), which represent the fundamental principles used to categorize or understand the codes or messages in the paradox literature. The three sets of antinomies are an important theorizing tool, enabling scholars to engage in disciplined imagination (Weick, 1989). On the one hand, the antinomies themselves afford the consistent application of guidelines (i.e., the “disciplined” part of the theorizing process), but the repository of visuals depicted invites scholars to generate alternative perspectives (the “imagination” part of the process).
Third, by mapping the frequency of visuals used in the literature in a typology of eight classes, we contribute an understanding of the performative effect of visuals. Building on the premise that the visual language used in research papers has the capacity to shape social reality (Austin, 1962), our work suggests that, over time, researchers have relied on a limited number of classes, inadvertently producing recurrent conceptualizations of paradox that have shaped subsequent debate in the field and cemented certain assumptions. Paradox visuals have thus recursively influenced the social phenomena they purportedly capture and communicate (Marti & Gond, 2018).
This echoes the current literature on the performativity of theories, which focuses on the processes through which theories shape the social structures and practices they are supposed to describe (D’Adderio & Pollock, 2014; Marti & Gond, 2018). Yet we reveal one additional process that leads to path dependence and self-fulfillment of theories: the surreptitious translation of ideas from older to newer theories. If traditional management theories are equilibrium based, aimed at describing relations between stable variables, paradox theory is process- and recursivity-based, aimed at examining the mutual constitution of action and structure, of phenomena and response, of imagination and materiality (Hernes & Bakken, 2003). Nonetheless, our analysis shows that assumptions of linearity and of one-directional causal relationship are persistently conveyed in paradox theorizing through unambiguous arrows and boxes. Similarly, the idea of equilibrium and status maintenance is conveyed by the continued use of symmetrical, well-ordered graphic representations. Thus, some assumptions related to the very paradigms that paradox theory is aiming to challenge are ironically projected through the sensegiving effects of visuals.
Being mindful about performativity might encourage scholars to explore uncharted territories purposefully, broadening the repertoire of paradox visuals. In line with the principle of requisite variety, we argue that a complicated phenomenon, such as paradox, requires a commensurately varied repertoire of representing concepts because “it takes richness to grasp richness” (Weick, 2007, p. 16). We therefore open an “arena for performance” (Quattrone et al., 2021, p. 1205) in that we invite reflexivity on what is visible and invisible in current paradox visualizations. For example, the rare visibility of visuals, such as a pendulum or an unbalanced scale (class #4), invites us to explore the asymmetrical relationship of opposite poles (Cunha & Putnam, 2019). Indeed, converging towards familiar symbols (e.g., circles and loops), at the expense of introducing divergent ones (e.g., pendulum, zigzags, steps, and clouds), fails to match the complexity of what we seek to explain, with the risk of producing visuals that oversimplify the ideas argued in written texts.
Additionally, our findings show that even if the use of complex, realistic symbols, and images (e.g., bridges, clouds, cliffs, etc.) is not as widespread as the use of simpler graphic signs, it is still quite significant. Visual metaphors are indeed a powerful tool for theorizing (Cornelissen, 2006; Weick, 1989) because they “force us to make semantic leaps” (Cornelissen, 2006, p. 1584). This facilitates the emergence of new meanings and insights thanks to the juxtaposition of ideas from different domains. Visual metaphors act as analogies, making “abstract subjects comprehensible” and “giv[ing] the researcher permission to focus on the relevant part of the problem, to abstract out other parts” (Ketokivi, Mantere, & Cornelissen, 2017, p. 237). Our work raises questions about how visual metaphors count in paradox theorizing. It also invites scholars to consider other forms of visualization, such as the sailing visuals used by Lê and Pradies (2022) to unpack improvisation when navigating paradox in stormy conditions, or the African symbols and their relation to paradox theorizing explored by Koli and Lê (2022). The introduction of more complex imagery could also allow scholars to transcend the three antinomies.
Conclusion
Our paper encourages the community of paradox scholars to be as imaginative as possible in addressing paradoxes visually. Along with the abstract and the contribution, we need to pay particular attention to visual images because they may be the strongest messages we send to our audience. In sum, our paper invites discussion enriching representation of paradox, and thus opens multiple avenues for future research. First, while our paper focuses on single basic visual elements of a figure, it may be that when signs are combined, they reveal aspects of paradox that each sign alone does not. We see this as the potential paradoxical visual nature of a single figure; that is, separately, two or more signs in the same figure might appear disconnected, while together they convey novel elements of paradox. Second, our analysis has explored visuals across different types of papers (e.g., empirical vs. theoretical) and figures (e.g., figures visualizing paradox description or paradox dynamics); however, other dimensions, such as the type of paradox being discussed, the level of analysis (e.g., individual, team, organization—and interactions between them), or the number of poles at play, could be investigated. Future research could also refine analysis further by looking at these dimensions. Third, our work addresses the (in)commensurability of paradox. By using a two-by-two-by-two device, boundaries are created that may suggest that expressions of paradox are relatively stable and commensurate. Yet, tensions are dynamic and can evolve and metamorphose, exposing different meanings at different levels and time scales (Jarzabkowski et al., 2013), or result in cascading effects (Gilbert, Michaud, Bentein, Dubois, & Bédard, 2018). In essence, visualization is a way of seeing (Berger, 1972) but as scholars continue to (re)produce visuals, one must never forget that a way of seeing is also a way of not seeing.
Supplemental Material
sj-docx-1-oss-10.1177_01708406231161998 – Supplemental material for A Figure is Worth a Thousand Words: The Role of Visualization in Paradox Theorizing
Supplemental material, sj-docx-1-oss-10.1177_01708406231161998 for A Figure is Worth a Thousand Words: The Role of Visualization in Paradox Theorizing by Camille Pradies, Marco Berti, Miguel Pina e Cunha, Arménio Rego, Andrea Tunarosa and Stewart Clegg in Organization Studies
Footnotes
Acknowledgements
We sincerely thank senior editor Linda Rouleau for her generous guidance throughout the review process as well as editor-in-chief Renate Meyer for her support. We are also thankful to the three anonymous reviewers for their developmental and detailed feedback. Their insights were key in crafting this manuscript. We are also thankful to the participants in the paradox subtheme at the 2019 EGOS colloquium for their input.
Funding
The author(s) disclosed receipt of the following financial support for the research, authorship, and/or publication of this article: This work was funded by National Funds through FCT—Fundação para a Ciência e Tecnologia (UID/ECO/00124/2019, UIDB/04105/2020, UIDB/00731/2020, UIDB/00315/2020 and Social Sciences DataLab, LISBOA-01-0145-FEDER-022209), POR Lisboa (LISBOA-01-0145-FEDER-007722, LISBOA-01-0145-FEDER-022209) e POR Norte (LISBOA-01-0145-FEDER-022209).
Supplemental material
Supplemental material for this article is available online.
Notes
Author biographies
References
Supplementary Material
Please find the following supplemental material available below.
For Open Access articles published under a Creative Commons License, all supplemental material carries the same license as the article it is associated with.
For non-Open Access articles published, all supplemental material carries a non-exclusive license, and permission requests for re-use of supplemental material or any part of supplemental material shall be sent directly to the copyright owner as specified in the copyright notice associated with the article.