
Abstract
Although trust is a lively area of research, it is rarely investigated in countries outside of commonly available cross-national public-opinion datasets. In an effort to fill this empirical void and to draw conclusions concerning the general determinants of trust, the current article employs detailed survey data from a frequently overlooked Central Asian country, Uzbekistan, to test the relationship between particularized trust and demographic traits previously identified as influential. While a number of Uzbek demographic characteristics coincide with previously identified determinants of trust, age and education yield negative effects not previously found. Interestingly, individual-level demographic variables become insignificant when controlling for regional, religious, and linguistic variation. We conclude with a discussion of the theoretical implications.
Keywords
Introduction
Trust is often identified as a fundamental element of social order (Durkheim, 1984), and is frequently credited as affecting institutional performance (Bjørnskov, 2009; Knack, 2002; Putnam, 1993), economic development (Fukuyama, 1995), collective action (Kollock, 1998), and crime reduction (Messner et al., 2004). 1 Due to the widespread consequences of trust, social scientists have devoted increasing attention to understanding its determinants (Cook, 2001; Hardin, 2002). A number of recent works show that at the individual level classic sociological demographic characteristics, such as education and age (Herreros and Criado, 2008; Paxton, 2007), are positively related to trust, while the content of social ties and being a member of a group that is historically the target of discrimination can stunt its growth (Alesina and La Ferrara, 2002; Simpson, 2006; Smith, 2010). Likewise, at the regional and national levels, recent research finds that political institutions (Freitag and Bühlmann, 2009), income equality (Bjørnskov, 2007; Uslaner, 2002), and civic liveliness (Putnam, 2000) are necessary conditions for the development of trust.
It is surprising to find, however, that the effects of these correlates vary from study to study (Nannestad, 2008). A key reason may be that the majority of research looking at the determinants of trust are localized within the USA and other western nations (for example, Brehm and Rahn, 1997; Claibourn and Martin, 2000; Putnam, 2000, 2007). International studies exist (Bjørnskov, 2007, 2008; Delhey and Newton, 2005; Freitag and Bühlmann, 2009; Herreros, 2004; Herreros and Criado, 2008; Hooghe et al., 2009; Knack and Keefer, 1997; Paxton, 2007; Zak and Knack, 2001), but they primarily investigate differences between a restricted number of countries in order to pinpoint the structural origins of trust (for an exception, see Bjørnskov, 2007, 2008). In addition, although the importance of examining trust using historical, ethnographic, or survey methods within specific countries is not new (Banfield, 1958; Gambetta, 1993; Huysseune, 2003; Kumlin and Rothstein, 2005; Leigh, 2006; Lühiste, 2006; Putnam, 1993; Yamagishi and Yamagishi, 1994), it is rarely done for countries outside of the World Values Survey (WVS) and European Values Survey (EVS) sampling frames. Those outside these samples are among the most understudied in the trust literature. The present article examines the characteristics believed to foster trust in individuals and investigates these processes in Uzbekistan: a previously understudied, Central Asian, post-socialist, Muslim country that is currently under authoritarian rule and, until recently, beyond the reach of public opinion surveys. By doing so, we hope to compare and contrast the present results with those previously found in order to tease out factors such as state repression and ethnic homogeneity that may or may not contribute to rendering or eroding trust.
To accomplish this task, we use Uzbek survey data collected in the spring of 2007 on trust in family, friends, and neighbors. Using multilevel models, we find compelling results that are partly consistent and partly inconsistent with the prior literature. While the positive effect of socioeconomic status parallels results found elsewhere, age, education, and family size are linked in opposite ways than has been identified in prior research. Interestingly, these factors become statistically insignificant when individuals are grouped by region, religion, and the language spoken at home.
The findings relate to a burgeoning literature on the relationship between trust and ethnic heterogeneity (for example, Glaeser et al., 2000; Herreros and Criado, 2008; Leigh, 2006; Putnam, 2007). In conjunction with prior investigations, the results suggest that homophily across linguistic, ethnic, and religious characteristics are critical determinants of trust and that being a minority reduces one’s willingness to trust others. While prior work associates such a pattern with histories of discrimination (Alesina and La Ferrara, 2002; Smith, 2010), this explanation may have less explanatory power in the Uzbek case than in other countries.
The remaining article is organized as follows. We first outline a number of competing theoretical traditions within sociology and political science that attempt to conceptualize trust. Then we briefly review the empirical literature by detailing the various correlates of trust at the individual and regional levels. We then identify unresolved issues within the trust literature and highlight how the present investigation can help alleviate some of these problems. Next, we present the data and methods and illustrate how we tested for general mechanisms with multilevel models. The article ends with a discussion of our findings and a conclusion.
Literature review
What is trust?
An agreed-upon definition of trust, along with a dominant theory outlining its determinants, eludes the literature. In a foundational attempt, Luhmann (1979) equates trust with a coping mechanism that allows individuals to manage the uncertainty and complexity of human social organization. Other scholars equate trust with social intelligence (see Yamagishi, 2001) or a shallow form of morality (Messick and Kramer, 2001). Zucker (1986), in contrast, describes trust as background expectations. That is, when individuals feel that they have a common understanding of the world and perceive that others see the world as predictable, they are more likely to trust. Trust is conceptualized as encapsulated interest by Hardin (2002), who argues that trust is a cognitive and relational process whereby X believes that Y has some reason to act in X’s best interests under condition Z. Finally, a recent attempt by Welch et al. defines trust as ‘the mutually shared expectation, often expressed as confidence, that people will manifest sensible and, when needed, reciprocally beneficial behavior in their interactions with others’ (2005: 457).
Regardless of trust’s elusive meaning, the definitions provided above generally fall along the following two dimensions: (1) strategic versus moralistic and (2) particularized versus generalized (Nannestad, 2008; Uslaner, 2000). The type of trust outlined by Hardin (2002) (X trusts Y with regards to Z) is strategic. It helps us decide who to interact with under conditions of uncertainty and social complexity (Coleman, 1990; Cook, 2001). For instance, this type of trust is applied when one hires a doctor, and not a baseball player, to perform brain surgery. In contrast, moralistic trust is a belief or value that is not rooted in decision-making, person-to-person relationships, or in the context in which trust is granted (Fukuyama, 1995; Uslaner, 2000; Yamagishi and Yamagishi, 1994). This form of trust reflects how individuals should perceive others and ought to behave toward strangers (Mansbridge, 1999). Instead of X trusts Y to do i, j, or k, moralistic trust means that X simply trusts.
While the first dimension refers to how, the second dimension relates to whom trust (either strategic or moralistic) should be extended. When actors trust individuals they know, trust is particularized to that specific individual or group. When actors trust individuals they know nothing about, trust is generalized to the larger society or nation. As Uslaner notes, ‘Generalized trust is the belief that most people can be trusted. Particularized trust is faith only in your own kind’ (2000: 573). Thus, within this dimension, trust is either directed toward friends and family (that is, particularized) or toward strangers and anonymous others (that is, generalized).
Efforts at broad theories attempting to outline what influences these different dimensions have filled volumes (for example, Cook, 2001; Fukuyama, 1995; Gambetta, 1988; Kramer and Tyler, 1996; Sztompka, 1999). As a result, we will not review the constellation of approaches in depth, but rather identify a few key traditions and buttress this review with notable empirical findings. First, however, we will highlight issues within the trust literature relevant to the current study design.
Numerous studies show that the various trust dimensions have different causes (for a review, see Cook et al., 2005; Nannestad, 2008). For instance, membership in exclusive ethnic organizations will help foster particularized trust, while simultaneously precluding the development of generalized trust (Uslaner and Conley, 2003); frequent interactions with relatives, friends, and neighbors will increase particularized trust, while positive experiences with strangers will increase generalized trust (Freitag and Traunmüller, 2009); and particularized trust will spark the development of generalized trust in some conditions, but not others (Glanville and Paxton, 2007). The problem is that the bulk of survey research on trust, with the exception of a few studies, is geared toward the moralistic and generalized trust dimensions, and is largely an artifact of the WVS and EVS survey item asking if most people can be trusted. The survey items we explore, in contrast, are near the particularized trust pole; our measures are concerned with trust in friends, family, and neighbors, and not in strangers or in most people. Unfortunately, there is not a broad, cross-national comparative literature on particularized trust with which to compare our results. Thus, although the existing literature is almost exclusively focused on generalized trust, we compare and contrast our results with this literature, and analyze issues and identify caveats in doing so in the discussion and conclusion. 2
Determinants of trust
Sociological theory generally categorizes the determinants of trust into four kinds of explanations: civil society, institutional quality, culture and values, and demographic homogeneity. Scholars who emphasize the importance of civil society argue that by participating in voluntary associations and civic activities individuals come to understand the general signs and signals used to assess the trustworthiness of others. In other words, it is in the civic sphere that individuals learn from past experiences and develop expectations about how others will treat them (Brehm and Rahn, 1997; Herreros, 2004; Knack and Keefer, 1997; Putnam, 1993). Scholars stressing the importance of institutional quality suggest that political-institutional environments in which ‘good’ government creates and maintains incentives for trustworthy behavior produce the greatest trust (Herreros, 2004; Levi, 1998). Conversely, the opposite institutional conditions (corrupt, unfair, and partial regimes) generate the least trust (Rothstein and Stolle, 2003, 2008; Rothstein and Uslaner, 2005). Scholars favoring the third realm, culture and values, maintain that those who have a generally optimistic outlook, strong moral attitude, and egalitarian values, which are the result of socialization and are relatively stable throughout the life-course, will ultimately trust more (Uslaner, 2000, 2002). Those who highlight the importance of demographic homogeneity claim that social distance between individuals acts as a barrier to developing trust (Delhey and Newton, 2005; Leigh, 2006). Hence, whatever creates a social cleavage between individuals, such as income inequality, religious fractionalization, or ethnic homogeneity, will likely deter trust.
Although research suggests that each of these four models accounts for considerable variation in trust, there also appear to be some interesting correlates of trust at the individual level. In regards to demographic factors, age is considered one of the strongest predictors of both particularized and generalized trust (Freitag and Bühlmann, 2009; Freitag and Traunmüller, 2009). As individuals mature they are more likely to trust others, with the positive effect of age slowly diminishing through time (Robinson and Jackson, 2001). This suggests that as individuals age they either learn how to navigate their way through the morass of social signs and signals that help predict benign behaviors (Gambetta and Hamill, 2005) or they develop a generational propensity to trust others (Putnam, 2000). The literature also shows that greater education and income increase both particularized and generalized trust (Alesina and La Ferrara, 2002; Freitag and Traunmüller, 2009; Hooghe et al., 2009; Kumlin and Rothstein, 2005; Leigh, 2006). Education, like age, may teach individuals the experiences and history of unfamiliar groups and provide people with a greater understanding of trust-warranting information. Likewise, monetary factors, such as income, occupational prestige, and employment, appear to generate trust (Paxton, 2007). Being successful in the labor market is likely to promote trust because it provides people with the necessary resources to take risks and, hence, trust others. In line with this argument, research also finds that being unemployed lowers rates of both particularized and generalized trust (Brehm and Rahn, 1997; Freitag and Traunmüller, 2009). Other individual-level variables that yield mixed or insignificant results appear to be the number of children within a household, political ideology, and marriage (Welch et al., 2007).
Regarding demographic factors that decrease trust, groups that are more likely to experience discrimination, such as African Americans, immigrants, and women, tend to report lower levels of trust (Alesina and La Ferrara, 2002; Hooghe et al., 2009; Smith, 2010; Uslaner, 2002). These results are thought to stem from current or past structural disadvantage; that is, individuals excluded from multiple institutional contexts because of ascribed or achieved characteristics will trust less than those who are treated fairly. Moreover, findings show that people who experience some sort of trauma (Alesina and La Ferrara, 2002), such as divorce (Paxton, 2007), are more cautious and hesitant of others, while those who are ‘satisfied with their lives’ or ‘optimistic’ will trust more (Brehm and Rahn, 1997; Uslaner, 2000).
The results of regional factors often parallel individual-level findings writ large: household income (Alesina and La Ferrara, 2002), neighborhood income (Leigh, 2006), and population density (Simpson, 2006) increase trust, while racial fragmentation (Putnam, 2007) and ethnic heterogeneity (Hero, 2003) lead to its decline. Other likely regional factors driving rates of trust may be social embeddedness in civil society (Kumlin and Rothstein, 2005; Putnam, 1993) or the content of social ties, such as the differences in individualism and collectivism found in the American north and south (Simpson, 2006).
The literature reviewed to this point suggests the existence of general causal effects. These results, however, are suspect for a key reason: much of the research is based on cross-national public-opinion datasets and sampling frames of a limited sample of countries. For example, the cross-national work that either aggregates the trust question or uses multilevel models employs data from the WVS, EVS, or both (Berggren and Jordahl, 2006; Bjørnskov, 2007, 2008; Delhey and Newton, 2005; Freitag and Bühlmann, 2009; Herreros and Criado, 2008; Hooghe et al., 2009; Knack and Keefer, 1997; Zak and Knack, 2001). Moreover, all the western and non-western in-depth case studies explore the determinants of trust using countries found within the WVS and EVS sampling frame (see Bahry et al., 2005; Banfield, 1958; Brehm and Rahn, 1997; Claibourn and Martin, 2000; Gambetta, 1993; Jamal, 2007; Kornai et al., 2004; Kumlin and Rothstein, 2005; Leigh, 2006; Marková, 2004; Putnam, 1993, 2000; Pye, 1992; Simpson, 2006; Stolle et al., 2008). The issue is that large-N, cross-national analyses and case studies using such sampling frames have the potential to constrict generalizations and reduce external validity, and the findings, as a consequence, should be strictly limited to the sampled nations. In effect, the country-level convenience sample found with the WVS and EVS creates unobserved variation in the dependent variable, trust, which biases the results and jeopardizes the general conclusions drawn from these studies.
Thus, despite the voluminous trust literature examining the relationship between various causal mechanisms and trust, less attention has been paid to the importance of investigating other groups, cultures, and nations outside the WVS and EVS sampling frame in order to verify the generality of these mechanisms. To deal with this problem, we examine the case of Uzbekistan, a rarely studied, Central Asian, post-socialist, Muslim country. We chose Uzbekistan primarily because political, economic, religious, and ethnic factors are quite salient in Uzbek society; poverty is widespread, unemployment is considerable, and the population is home to numerous religious, linguistic, and ethnic minorities. According to the CIA World Factbook (CIA, 2009), Uzbekistan ranks 170th in the world for GDP per capita (US$2800 circa 2009) and 80th for income inequality (gini index is 36.8 circa 2003), with roughly 33 percent of its 27.6 million residents below the poverty line (circa 2004). Furthermore, although Muslims and ethnic Uzbeks constitute the bulk of the population (88 percent and 80 percent, respectively), Russian, Tajik, Kazakh, Karakalpak, and Tatar form the remaining ethnic groups, with many of them speaking Uzbek, Russian, or Tajik.
Moreover, Uzbekistan has experienced continued authoritarian rule by President Karimov since the collapse of the USSR in 1991 (Van Boven, 2003). This is significant since authoritarian rulers often exhibit partiality in the public allocation of resources and tend to discriminate against and oppress certain ethnic, religious, and linguistic groups. Under authoritarian regimes, specific groups and coalitions are targeted for social provisions and services, while others are excluded or ignored. What often results is active corruption or the use of public resources for private gain. If this occurs, the regime conveys active distrust or favoritism toward certain groups and the perceived goodwill and fairness of the government will be in question. The consequence is that partiality, injustice, and corruption will foster distrust in government and reduce trust among other citizens (Levi, 1998; Rothstein and Stolle, 2003, 2008; Rothstein and Uslaner, 2005).
These sorts of practices are readily seen in contemporary Uzbekistan. For instance, due to previous efforts by the Islamic Movement of Uzbekistan (IMU) to remove President Karimov from power, ethnic Uzbeks (considered devout Muslims in Central Asia) are frequently stopped and harassed by government authorities (Bureau of Democracy, Human Rights, and Labor, 2009). Moreover, since 1991 the ethnic Tajik community has suffered frequent state oppression, ranging from forced resettlement to political exclusion (Melvin, 2000). Finally, after the fall of the USSR, ethnic Russians lost much of their cultural influence, although Russian remains the lingua franca of Uzbekistan. The alphabet has been changed, streets renamed, and an entire non-Russian and non-Soviet culture has been fabricated (MacFadyen, 2006). Although the particulars are different, this is similar to what occurred in the case of the Scottish in the United Kingdom and what is currently happening to Anglophones in Quebec, Canada (Hechter, 1975, 2000).
Expectations
The trust literature would lead us to expect to find the following relationships in Uzbek society. Age and education should have a significant effect on trust. The effect, however, may be positive or negative. As individuals mature and receive an education in Uzbekistan, they may learn how to assess trustworthy signs and signals, such as gender and socioeconomic status. Alternatively, age and education may be a proxy for the clear structural break that occurred in the political and economic system of Uzbekistan after the fall of the USSR, possibly producing more trust among older cohorts due to their greater reliance on informal social networks during the repressive Soviet regime (see Kornai et al., 2004). On the other hand, those from the old regime may experience greater distrust for the same reasons: a reliance on informal social networks can isolate trust within those networks and prohibit the development of trust toward strangers (Cook et al., 2005).
The trust literature also would lead one to predict differences in the extent of trust linked to socioeconomic status and sex. One would expect the Uzbekistan elite to have greater trust than the economically impoverished, since the elite have more resources to spare for risk-taking behavior, which requires trust. Likewise, women, a disadvantaged group in Uzbekistan, might exhibit less trust than men. Jamal (2007), however, finds that men and women do not differ with regard to trust in Muslim countries, possibly because women do not perceive their status as disadvantaged. Since Uzbekistan is largely Muslim, these effects may hold for trust in Uzbek society as well. Marriage, number of children, and rural residence yield inconsistent results in the trust literature; we explore their impact on variations in trust in Uzbek society.
Finally, the literature would lead one to expect that trust will vary by ethnicity, religion, and language (see Alesina and La Ferrara, 2002; Bahry et al., 2005; Delhey and Newton, 2005; Paxton, 2007; Putnam, 2007). The reason is that individuals favor in-groups or groups with a common identity (Tajfel, 1978), which can result in a homophilic bias according to which people trust only those that share some common group characteristic, such as language or ethnicity (Perdue et al., 1990). Thus, greater homogeneity among individuals along the dimensions of region, religion, and language within Uzbekistan should yield higher trust; conversely, anything that generally increases the social distance between individuals (such as geographical barriers, religious regulations, and linguistic fractionalization) may potentially impede trust. Alternatively, histories of discrimination, political injustice, or state oppression could account for linguistic and regional variation in Uzbekistan. Ethnic Tajiks, for instance, may reveal lower trust than ethnic Uzbeks not because of ‘in-group bias’, but because of recent oppression by the Uzbek state. These and other hypotheses will be explored below.
Data
The data for this study come from a broad social survey of Uzbekistan conducted in the region between April and June of 2007. 3 The third author designed the survey instrument and contracted the survey firm BRIF Research Group, located in Almaty, Kazakhstan, to administer the 2007 survey. The survey was administered to 1000 respondents aged 15 and older. Due to the authoritarian regime and political climate in Uzbekistan, respondents were guaranteed confidentiality and anonymity by the BRIF Research Group interviewers. The survey sample was based on Uzbek census information for age, gender, ethnicity, and geographical location. The survey, which was administered in Russian and other regional or national languages to residents throughout Uzbekistan, contains more than 300 variables focusing on preexisting patterns of information use, information-seeking behavior, and levels of trust in various groups and sources of information. In addition to the general sampling scheme, a three-stage process was used to select respondents: (1) probability-proportional-to-size sample of primary sampling units (PSUs); (2) random sampling of households in determined PSUs; and (3) selection of a respondent using the Kish Grid Method (Kish, 1949).
The survey contained 19 questions about trust in various institutions, ranging from family, friends, and neighbors to police, national newspapers, and the Internet. Respondents were asked to rate their level of trust in a series of institutions as ‘very untrustworthy’, ‘untrustworthy’, ‘trustworthy’, ‘very trustworthy’, or ‘don’t know’, coded on a five-point scale with ‘don’t know’ as the center. Although there are numerous questions about trust in institutions, many of these items can be grouped. This serves several purposes. First, combining related variables permits greater variation in the measurement of the intended concept. While any single trust metric only has five possible values, combining measures increases potential variability by five for each combined metric. Importantly, while each measure taps a specific dimension, there are natural clusters in these concepts. For example, trust in friends, family, and neighbors each measure how much the respondent trusts particularized people. In contrast, trust in the courts or trust in the police each measure trust in political institutions. These two examples could be presumed to be independent of one another, while the components within each should be related. Factor analysis confirms this hypothesis: trust in political institutions and particularized trust are independent of one another (results available upon request), while the components of the particularized trust dimension (a combination of trust in family, trust in friends, and trust in neighbors) are highly related, forming a Cronbach’s alpha of 0.77. Note that the values for each respondent are averaged to return a value on the same scale as the original questions. 4
Other variables in the analyses are demographic traits and group classifications. The basic demographics included are age, marital status, sex, education, number of children, place of residence, and the family’s socioeconomic status. Individuals were also coded for their region, religion, and the language spoken at home. These allow us to categorize respondents. Descriptive statistics of the demographic variables can be found in Table 1.
Descriptions of Demographic Variables
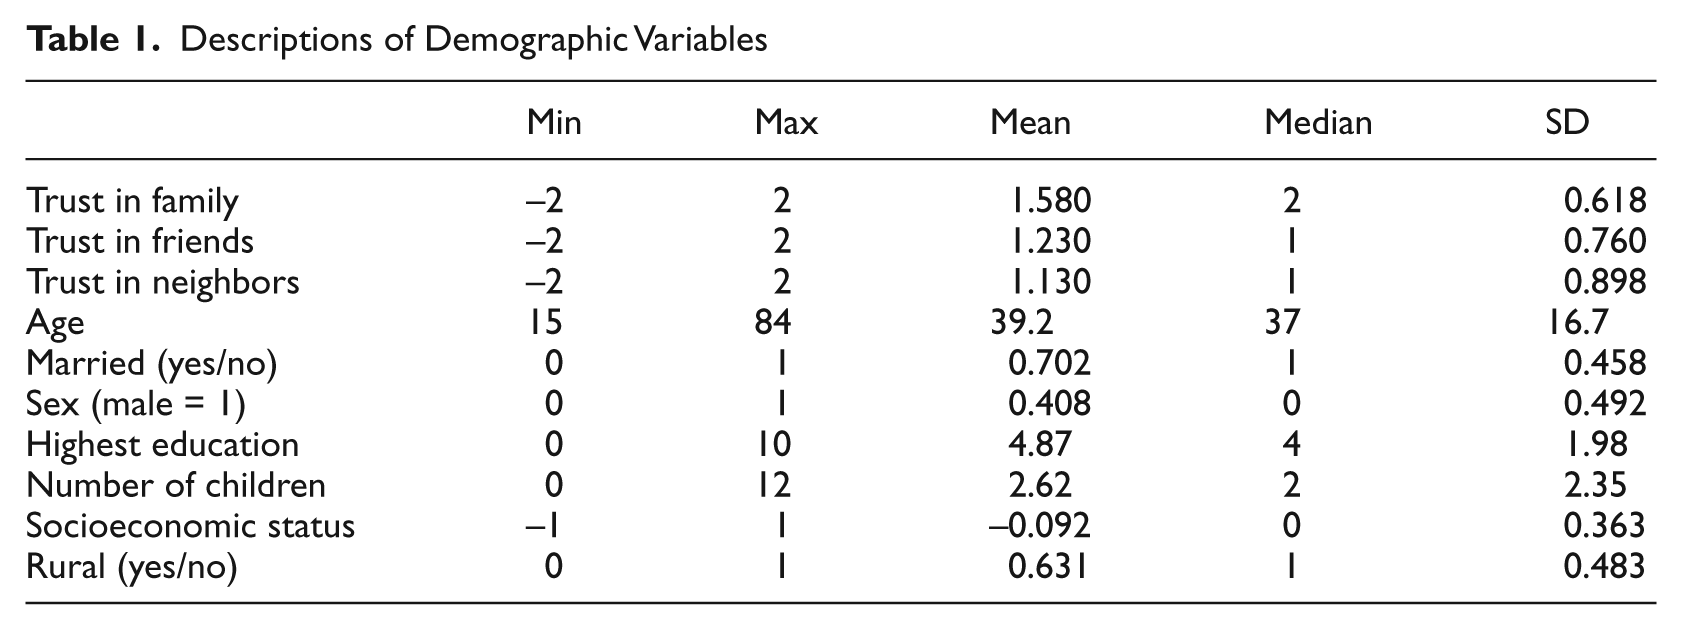
While socioeconomic status has a long-standing effect in the literature on trust (Alesina and La Ferrara, 2002; Brehm and Rahn, 1997; Knack and Keefer, 1997; Paxton, 2007; Zak and Knack, 2001), it is important to note the imprecision of this particular metric. Rather than capturing income or expenditures, respondents were asked whether they considered themselves lower class, middle class, or upper class. Some 86.0 percent considered themselves middle class, with only 2.4 percent upper and 11.6 percent lower class. While this does not reveal as much as we might like about their economic status, there may be important differences between the majority and individuals who do not consider themselves middle class. Employment status, type of employment, type of employer, and student status were not statistically significant.
Analysis
In the following analysis, we first discuss the level of trust across each population division using independent-sample t-tests and OLS regression. This shows the differences in the overall population by region, religion, and language spoken at home. We then present multilevel regression models of trust as a function of individual-level demographic attributes as well as random intercepts for region and language. All multilevel models were run using LMER in R (Bates, 2010).
Region
There are 14 politically defined regions in Uzbekistan, each sufficiently represented in the sample. These regions reflect the administrative divisions of the nation: thirteen provinces and one city (Toshkent). They vary widely in population density, land size, and cultural history, which produces important contrasts in their social environments that may influence levels of trust. For instance, trust in highly urban areas may be greater than trust in less densely populated areas (Simpson, 2006). Likewise, variations in population heterogeneity may lead to varying levels of trust (Putnam, 2000, 2007; Uslaner, 2002).
The regression results for trust by region are presented in Table 2. By fixing the intercept at zero and regressing region as a factor onto trust, this analysis produces mean trust values for each region. 5 These results demonstrate the regional variation. Since the possible values range from –2 to 2, some of the means are surprisingly high. Surxondaryo has the highest value of 1.78, while Samarqand has the lowest mean at 0.95. This simple model, which partitions the mean by region, accounts for 84.5 percent of the variation in trust. This interesting finding deserves further examination. What may account for the low levels of trust in Samarqand, beyond in-group or out-group biases, is that Samarqand is primarily an ethnic Tajik town within Uzbekistan, and, interestingly, the ethnic Tajik minority has recently suffered considerable oppression by the Uzbek state. For instance, some years ago educational materials in the Tajik language were destroyed in Samarqand and at the beginning of the century ethnic Tajiks who resided in areas along the border with Tajikistan were forcefully resettled because the Uzbek authorities feared that the Tajiks were favorable to the IMU (Melvin, 2000). As a result, these repressive tactics by the Uzbek state may have generated some distrust among the Tajik minority, possibly accounting for the lower levels of trust within Samarqand. This explanation, however, is conditional until key demographic factors, such as age, religion, and language, are taken into consideration.
Trust by Region

Note: Results from OLS regression with no intercept, making each β the mean for that region. Trivially, all regression coefficients are statistically different from zero at p < 0.0001. Italicized t-values are to highlight insignificant differences, all others significant at p < 0.05.
Comparisons of regional means to the sample population mean are also presented in Table 2. It is worth noting the regional variation relative to the sample population mean. These show remarkable variation from the overall mean. The italic entries in Table 2 highlight the four regions whose means are substantively similar to the sample population mean. The other values indicate how far some regions are from the overall means, from Surxondaryo exhibiting much higher levels of trust to Samarqand exhibiting much lower levels.
To demonstrate statistically significant differences, Table 3 contains the absolute t-values for an independent sample t-test of significance for differences in means. Despite the consistently high means, 68 percent of the 91 pairs are significantly different from one another. While not revealing a structure of regional clustering, this demonstrates the degree to which regions vary from one another. This variation may account for the high R2 value obtained in the region-based regression model.
T-Tests for Significance in the Difference of Means by Region
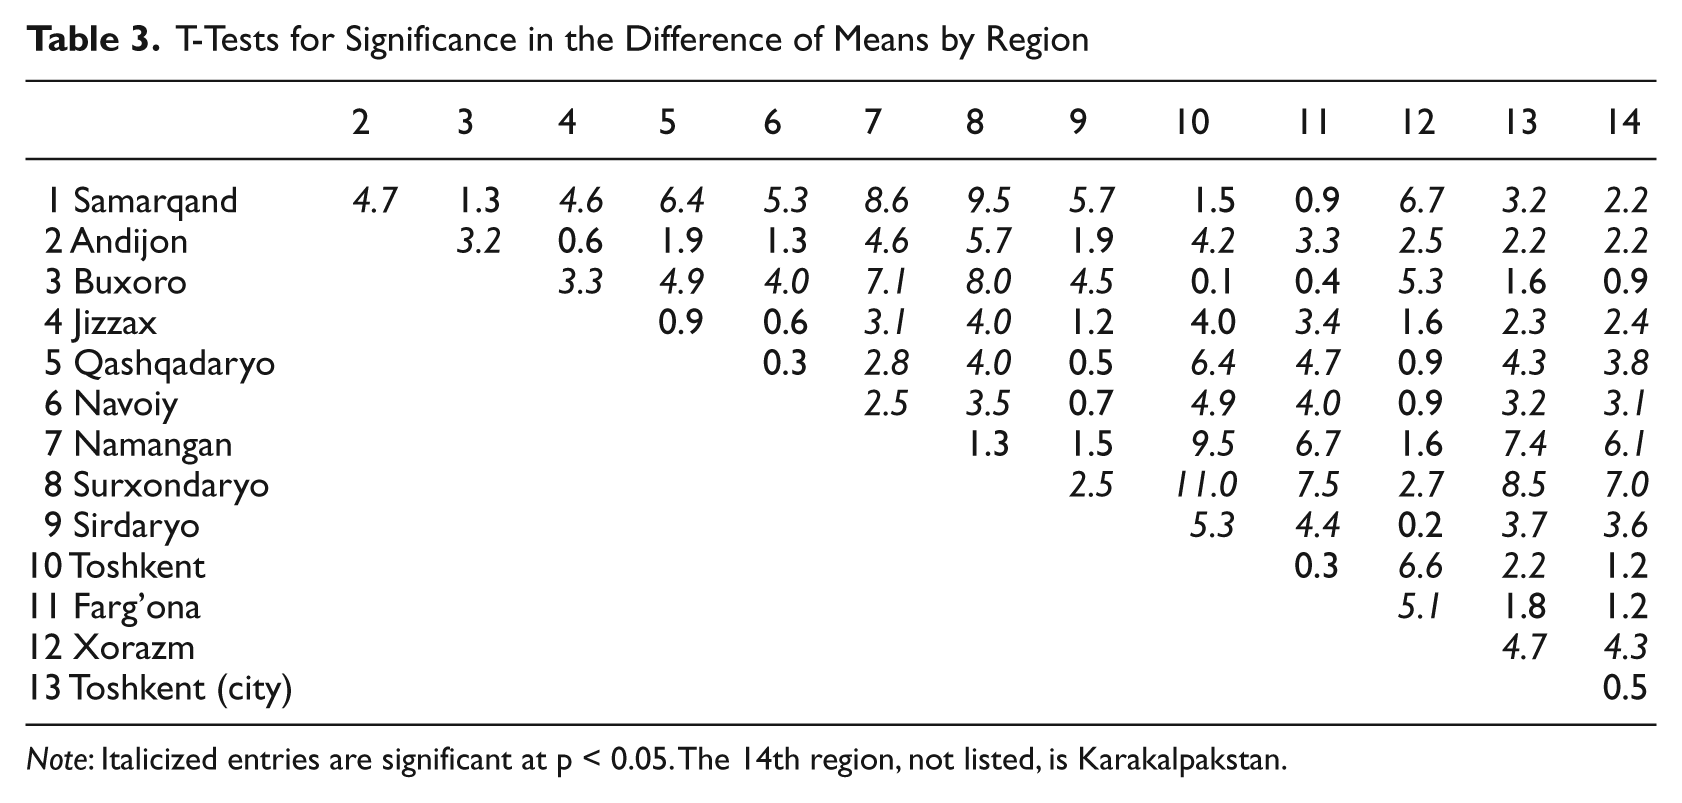
Note: Italicized entries are significant at p < 0.05. The 14th region, not listed, is Karakalpakstan.
Religion
Respondents provided eight distinct responses when asked about their religion, including those who refused to answer. The small size of some groups (for example, there was one Buddhist respondent and one Lutheran) means that they must be excluded from the analysis. Further, we have combined ‘Christian’, ‘Russian Orthodox’, and ‘Lutheran’ into simply Christian. Of potential importance is that, while 82.6 percent considered themselves Muslim, 11.0 percent identified as Sunni and 1.1 percent identified as Shia. While these are refinements of the broader category of Muslim, there may be important differences between those identifying themselves as Muslim and those who identified which variant of Muslim, so we include these categories in this analysis.
The levels of trust in people by religion are reported in Table 4. As with the regional analysis, this regression produces coefficients that represent the mean values for that group. Values for each group are presented, regardless of size. Christians report the lowest levels of trust across varieties. This finding is in line with work that suggests that minorities are less trusting than the dominant population (Alesina and La Ferrara, 2002; Smith, 2010; Uslaner, 2002). Those who identified as Shia reported notably higher levels of trust than for Sunni or the broad category of Muslim.
Trust by Religion
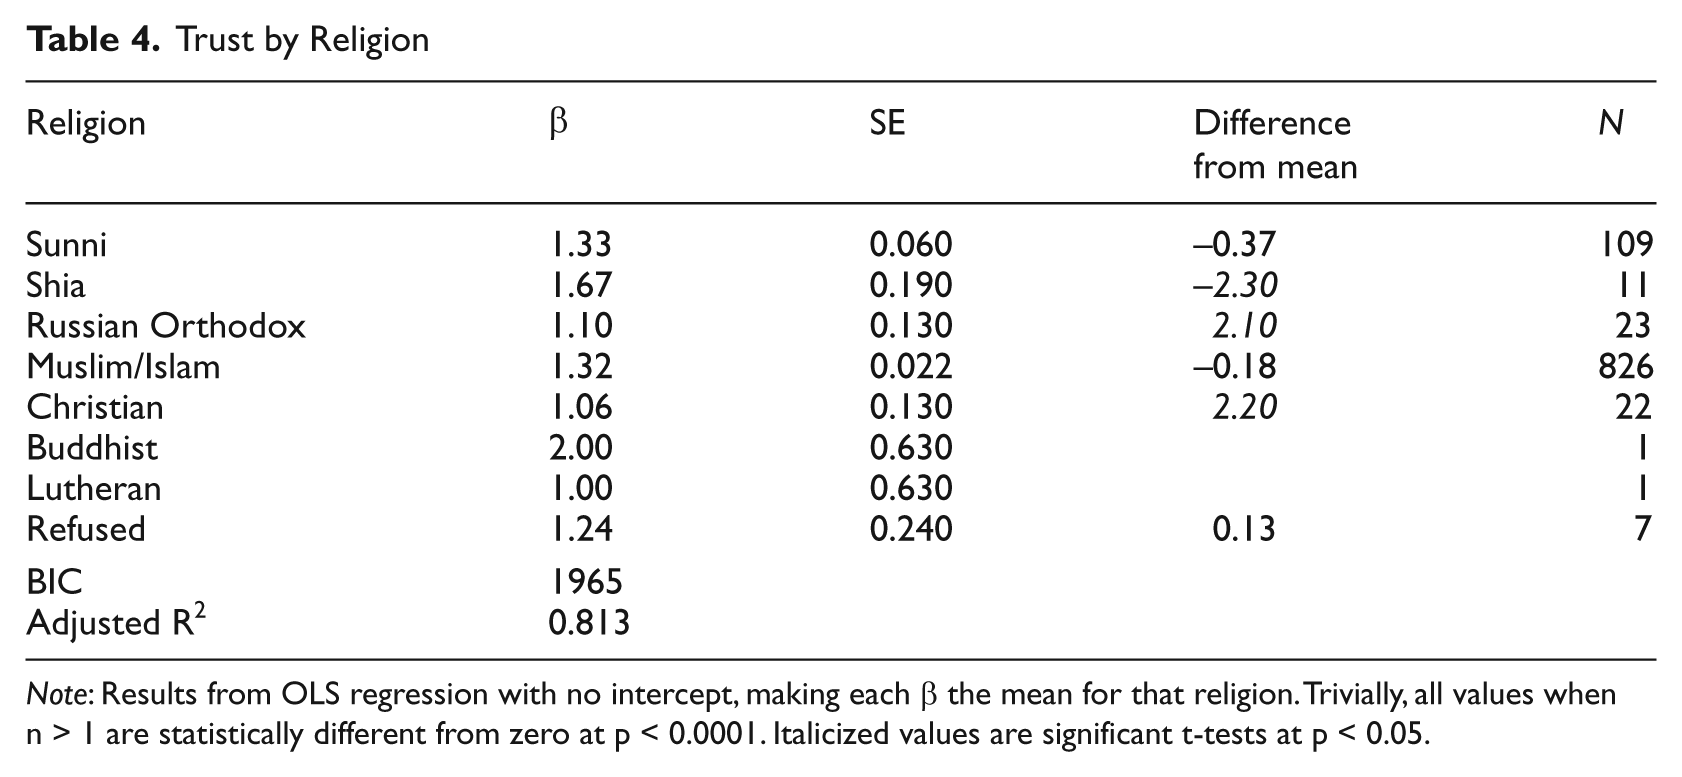
Note: Results from OLS regression with no intercept, making each β the mean for that religion. Trivially, all values when n > 1 are statistically different from zero at p < 0.0001. Italicized values are significant t-tests at p < 0.05.
Table 5 shows the differences in trust between religious groups using a series of independent sample t-tests. It is noteworthy that those who did not know or refused to state their religion do not differ significantly from members of religious groups. The Shia are different from all other groups, however, and the Christians (both self-identified ‘Christian’ and ‘Russian Orthodox’) are also different from the other populations, yet not distinguishable from one another. Sunni and broad-category Muslims are not significantly different from one another. This is interesting, as an estimated 90 percent of Uzbek Muslims are Sunni (ARDA, 2008).
T-Tests for Significance in Difference of Means by Religion
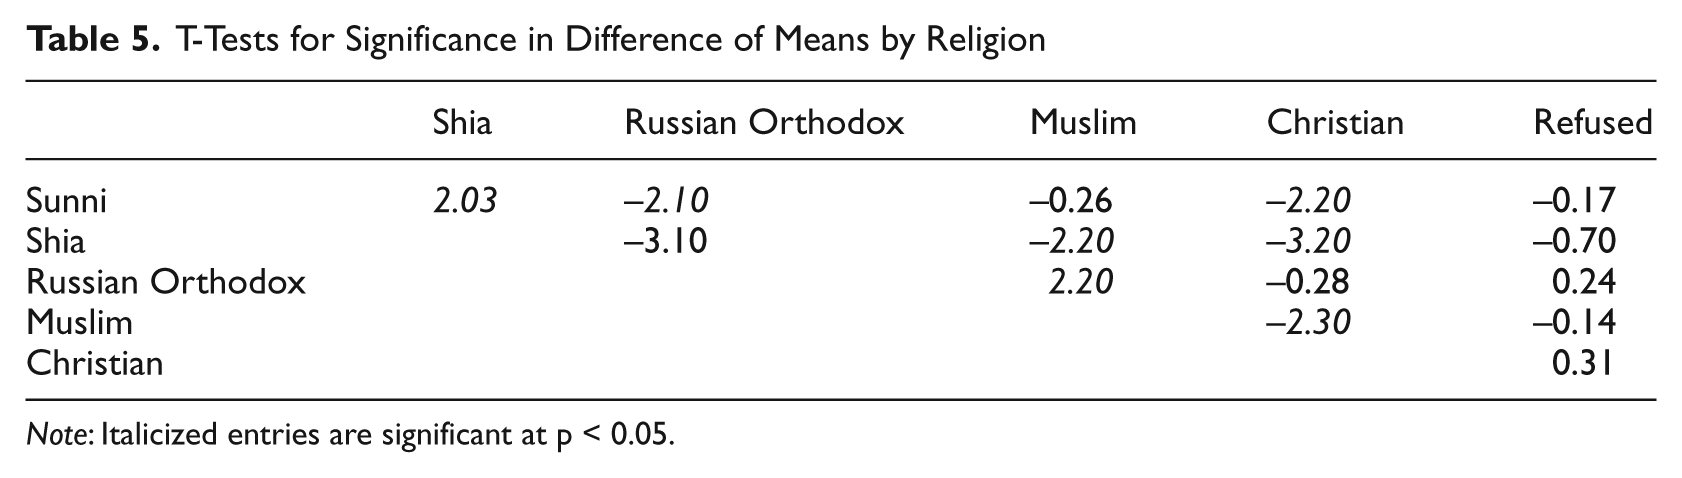
Note: Italicized entries are significant at p < 0.05.
Language
Prior research has found ethnic and cultural heterogeneity to be an important determinant of trust. While the survey asked specifically about ethnicities, respondents could provide multiple answers (that is, the survey item was open-ended). Moreover, Uzbek ethnicities are fairly mixed, with no clear distinctions between Uzbeks, Tajiks, Russians, and Kazakhs, for instance. Given the methodological issues of ethnic self-categorization in Uzbekistan, we use the language spoken at home as a proxy for ethnic identity. Although imprecise, this measure captures the culture in which a respondent is embedded and is a clear interpersonal signal of similarity. The language spoken at home is also commonly used as a measure of ethnic membership in the trust literature (for example, Uslaner and Conley, 2003). There were eight languages reported. Uzbek, with 75.4 percent, was the most common response. No other language represented more than 10 percent of the population.
Table 6 presents the regression of trust by language spoken at home. Fixing the intercept at zero permits the estimation of coefficients for each group, which then represent the mean value for that group. Trust in people is highest for Uzbek speakers and notably smaller for others. Though largely driven by the much larger Uzbek population, the size of a language community is loosely correlated with the levels of trust reported by that community (Portes and Sensenbrenner, 1993); the language variable accounts for 81.8 percent of the variation in individual responses.
Trust by Language
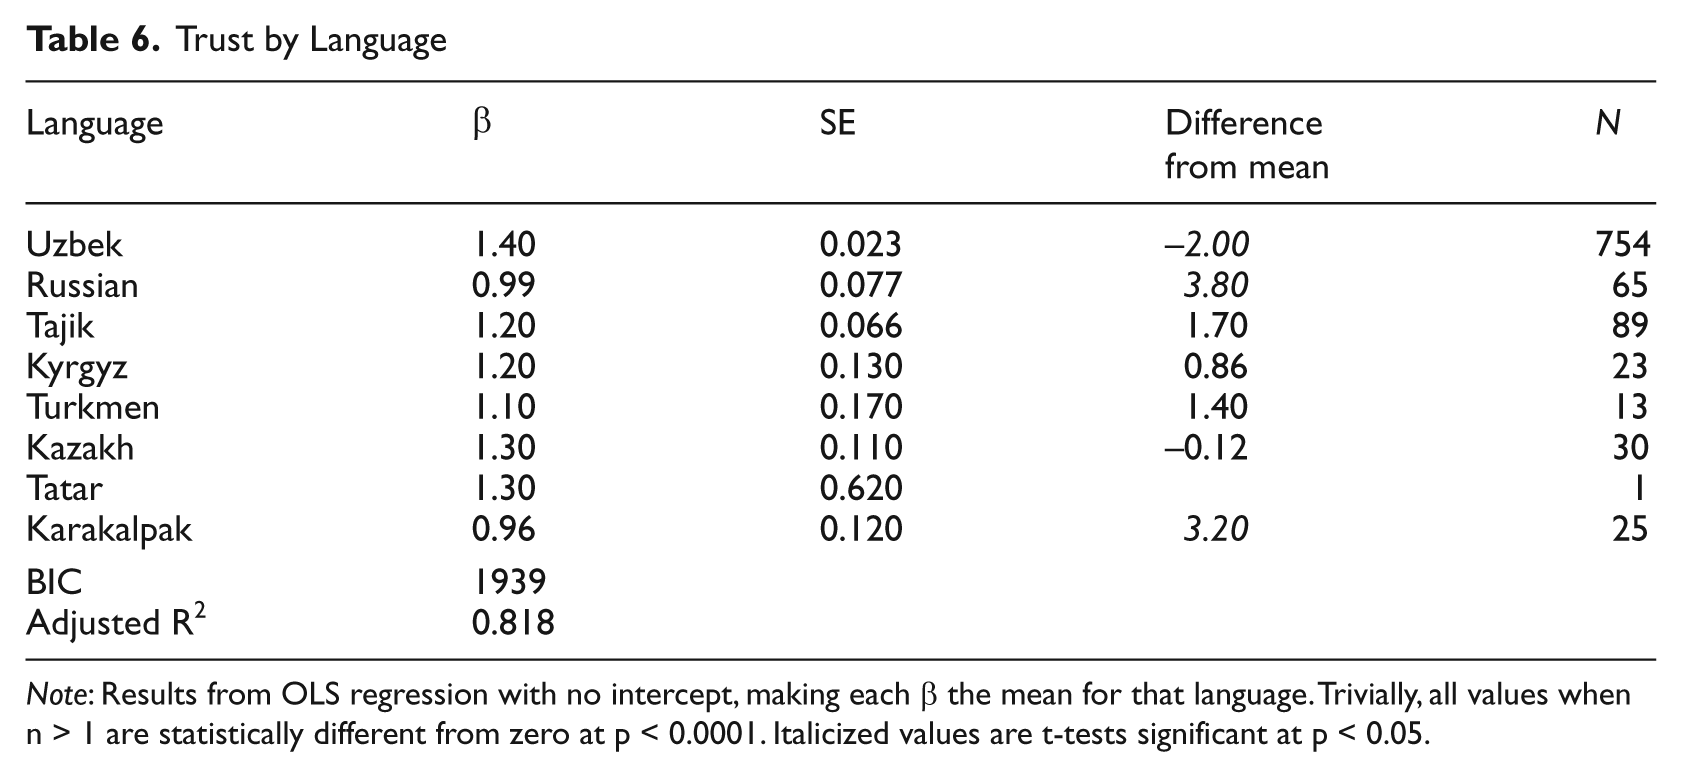
Note: Results from OLS regression with no intercept, making each β the mean for that language. Trivially, all values when n > 1 are statistically different from zero at p < 0.0001. Italicized values are t-tests significant at p < 0.05.
Differences between language groups appear again in Table 6, which highlights differences between each subpopulation mean and the full sample population. The sign on these t-tests is the direction in which the sample population differs from the subpopulation; for example, the value of –2.00 for Uzbeks relates to the higher mean for Uzbeks. The Russian population is distinct from the full population, as are speakers of Karakalpak.
The independent sample t-tests for significant difference between sample means are presented in Table 7. Unlike in the previous classifications, there are not as many notable differences between the language groups. Russian, Tajik, and Karakalpak are significantly different from the largest language group, Uzbek. Kazakh speakers differ from Russian speakers, and speakers of Karakalpak also differ from speakers of Kazakh. No other pairings are significantly different. Once again these results are understandable: state repression of ethnic Tajiks in Uzbekistan may explain why Tajik speakers have lower rates of trust. Yet if histories of discrimination, unfair treatment, or government oppression were the principal factors leading to lower levels of trust among the Tajiks, then we would not expect lower levels of trust among the Russian or Karakalpak populations, since they have historically suffered less oppression by the Uzbek state (Peyrouse, 2008; Spechler, 2007). Possible reasons for these discrepancies will be explored in the discussion.
T-Tests for Significance in Difference of Means by Language Spoken at Home
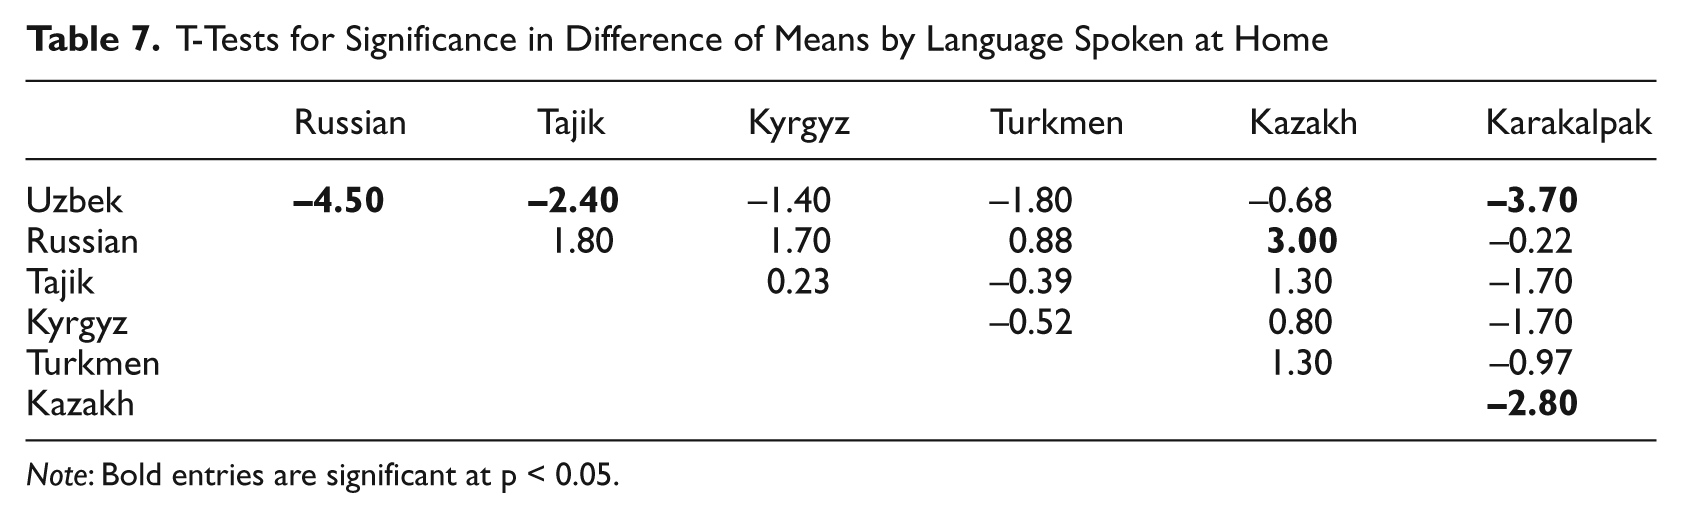
Note: Bold entries are significant at p < 0.05.
Demographics
The above sets of analyses show how variations in trust can be explained by group membership. While this can tell us a lot about the groups, it provides little insight into the determinants of trust at the individual level. The following analysis first investigates trust as a function of individual-level characteristics and then adds the effects of groups in a multilevel model.
A series of regression models are presented in Table 8. Model 1 includes only the demographic variables. Model 2 adds religion to this base model. While religion could be included as a random intercept, the large majority of respondents belonging to a single group caused estimation problems and the group intercepts to be of little value. 6 Here we have collapsed the Christian groups together, and those who refused to answer and Buddhists are grouped into ‘Other’. The Uzbek Muslim population is predominantly Sunni, and although there are statistically significant differences between Shia and other Muslims, there are none between Sunni and ‘Muslim’. Thus, those who responded ‘Muslim’ or ‘Sunni’ are combined. Models 3 and 4 introduce region and language as random intercepts, respectively. Model 5 combines all prior models into a multilevel model with region and language varying randomly.
Multilevel Regression Models of Trust
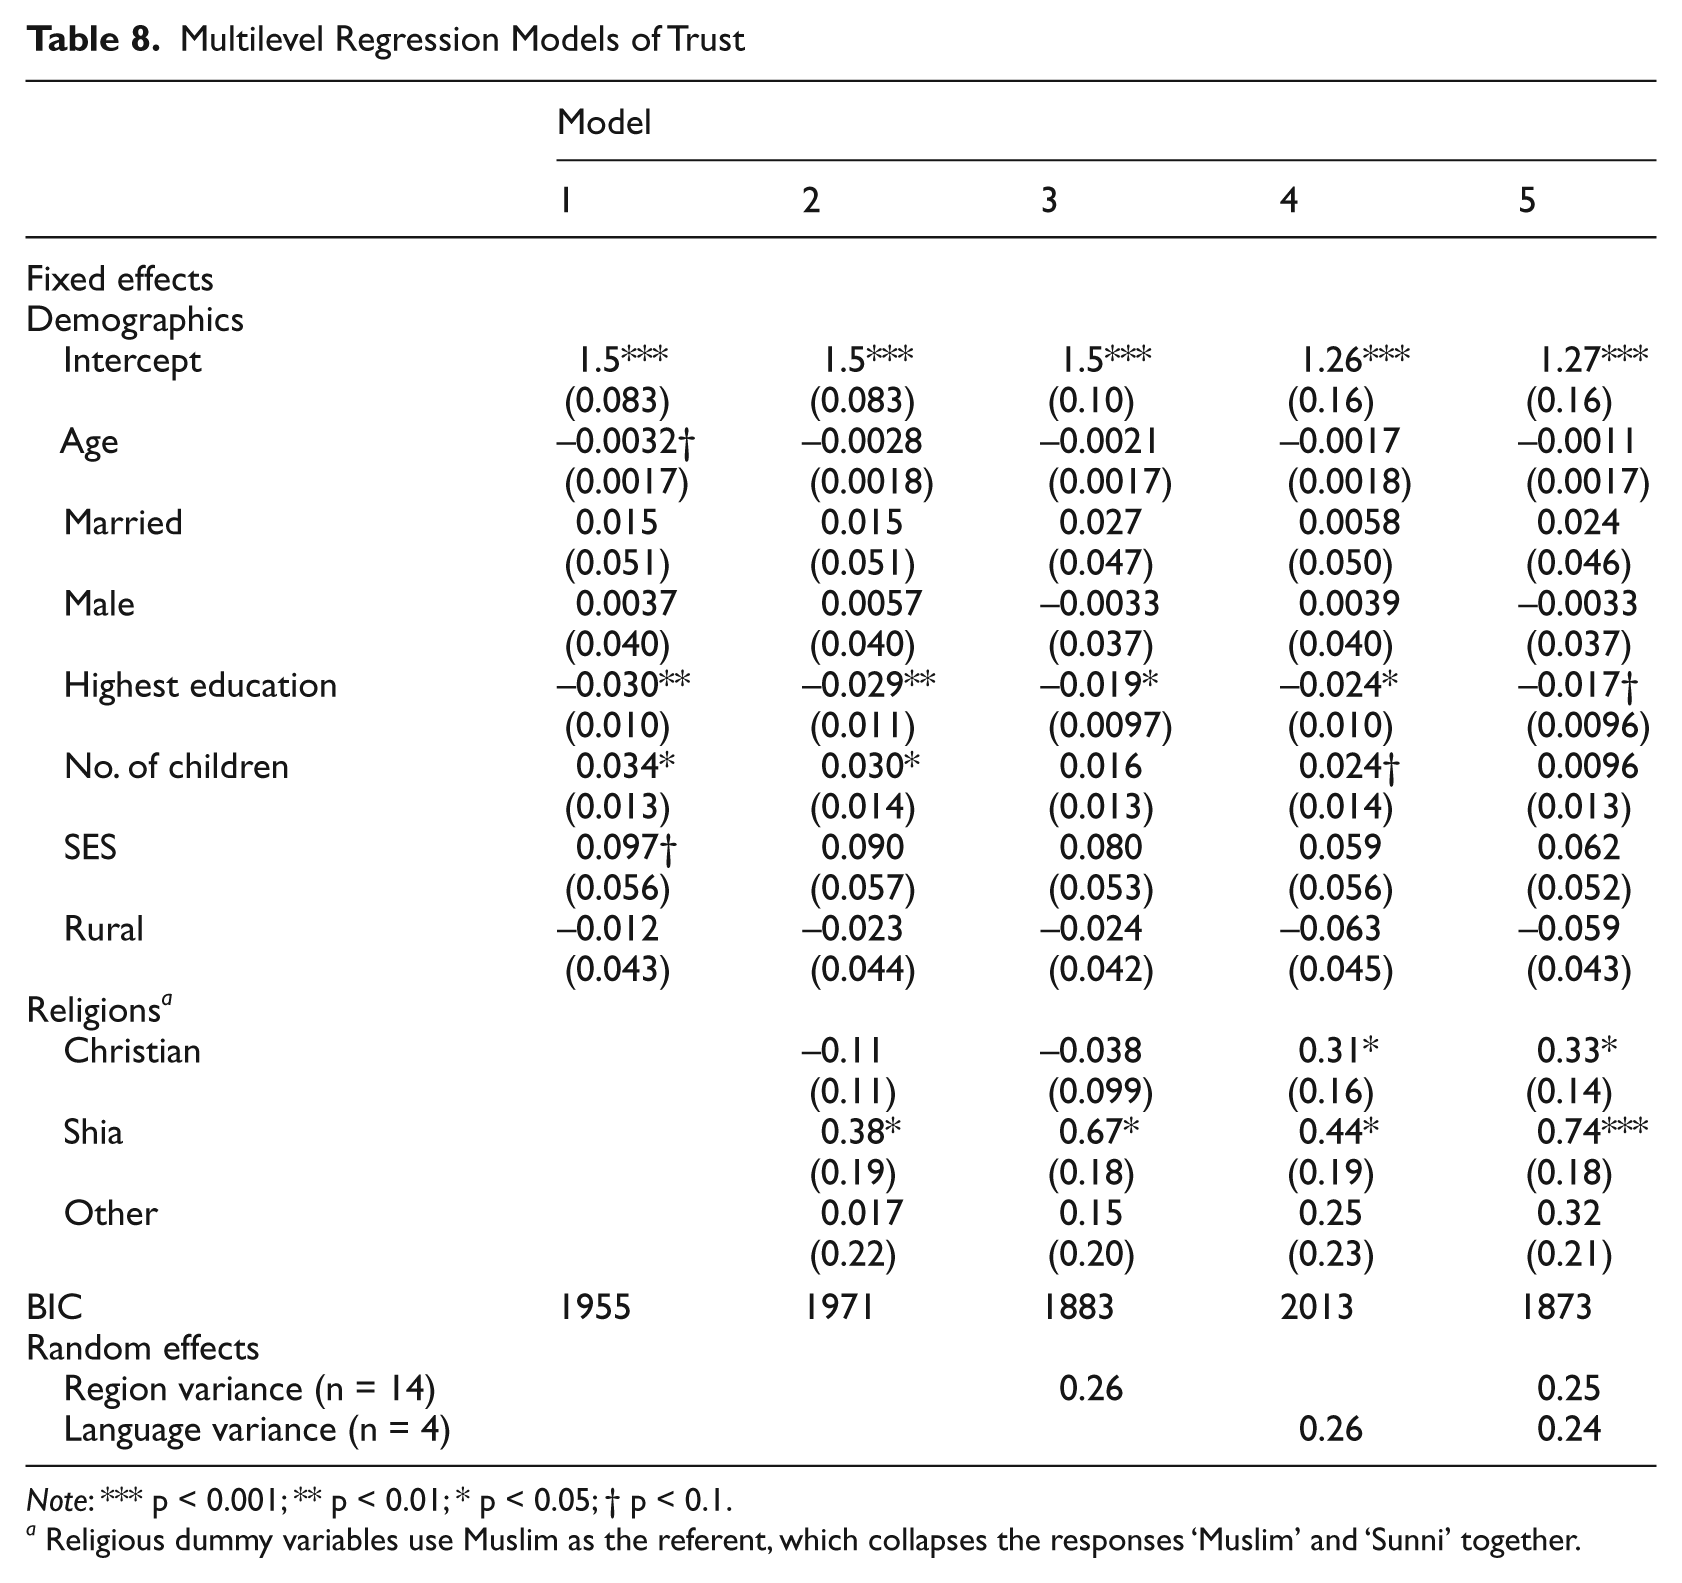
Note: *** p < 0.001; ** p < 0.01; * p < 0.05; † p < 0.1.
Religious dummy variables use Muslim as the referent, which collapses the responses ‘Muslim’ and ‘Sunni’ together.
The results for Model 1 reveal that the individual attributes in our study have little influence on levels of trust. As has been shown in the previous tables, there is not a high level of variation in trust. While individual responses fill the entire possible spectrum, the dominant response was, by far, 1 (55 percent of respondents). The intercept in Model 1 reflects this generally high level of trust, with certain attributes associated with lower levels. A major contributor to the decline is age, with each additional year reducing the expected level of trust by 0.0032. The next significant coefficient is educational level: the more educated respondents are, the less they trust other people. Though small, this result is robust even when controlling for age, socioeconomic status, and place of residence.
Model 2 uses the same individual-level characteristics as in Model 1, but it controls for variation by religious group. Remember that the results in Table 4 show levels of trust by religion, ignoring individual attributes. Model 2, on the other hand, takes the effects of religious groupings into account and identifies which individual-level effects still have a statistically significant influence on trust. While age, education, number of children, and socioeconomic status (SES) were all significant predictors of trust, age and SES become insignificant once we control for religion. Although the level of education is a significant predictor, the impact is small. The highest level of education observed is 10, representing a PhD or equivalent, so the most the level of trust can be altered is by 0.3.
Worthy of note is the effect of particular religions. Christians and Others are not significantly different from Muslims and Sunni once controlling for demographics; Shia, on the other hand, have a significantly higher mean level of trust. Moreover, differences between the dominant religions and Christian or Other, shown to be statistically significant and of equal magnitude to the differences of the Shia in Table 4, are no longer significant once demographic factors are taken into account. The differences between these religious groups may thus be a result of demographic factors, such as socioeconomic status and education.
Model 3 in Table 8 adds region as a random intercept to Model 2. As identified in Table 2, political regions account for much of the observed variation. This model, with a notable improvement in fit over the prior two models, greatly reduces the size of the effect of education and renders the number of children insignificant. Perhaps of greatest interest is the increase in the magnitude of the Shia coefficient. Once political regions are accounted for, the effect of Shia doubles. Upon further investigation, this is a combination of the effect of regions and the effect of religions. Of the 11 respondents reporting Shia, 10 of them live in Farg’ona. As shown in Table 2, this region exhibits a far lower level of trust than the population mean. Rather than the base expectation for a Shia to be the population intercept and the Shia coefficient, resulting in a level of trust exceeding the top of the scale, the Shia are trusting at the level of the population when this increase by religious group is combined with the regional decrease. Thus, the model takes into account the high mean level of trust for the Shia and the low mean level of trust for those residing in Farg’ona.
Model 4 replicates Model 2 with the addition of the language spoken at home as a grouping level. As with religion, languages have to be combined to create large enough groups for model estimation. Based on the similarity in trust indicated in Table 7, Uzbek, Russian, and Karakalpak were kept as separate categories and all other languages were combined into a residual ‘other’ category. This model powerfully distinguishes between members of the dominant cultural group (Uzbek) and minority populations. Education remains statistically significant, though the coefficient indicates that it makes a very small contribution to the variation in trust. With a value of 0.024, the most an individual’s level of trust could be reduced is 0.24. The number of children is again marginally significant, and has a positive effect. Perhaps most interesting is that including language makes being Christian a significant predictor of trust. Of the 46 individuals in the Christian category, 45 of them speak Russian at home. So when a random intercept for language is included, the result is a slightly higher mean and magnitude in the effect of the coefficient for Christian. This overlap of effects helps explain why the coefficients become larger and more significant while the model fit is the poorest.
Model 5 in Table 8 combines the random intercepts for both region and language with the fixed effects of the individual characteristics of demographics and religious affiliation. In this model, only education remains a significant demographic determinant of trust. The fixed effects of Shia and Christian again conflict with their correlated variables of Farg’ona (–0.37) and Russian (–0.22), respectively. It is notable, however, that the magnitude of the fixed effects for religion increases while the magnitude of the random effects for language and region decrease.
Adjudication between non-nested models such as these is aided by the use of the Bayesian Information Criterion (BIC). Measuring model fit while penalizing for model complexity, BIC is comparable across models as long as the N is constant. In these models, the full model has the lowest value with 1873. It is unlikely to be a coincidence or statistical accident that each of these models controls for region. This implies that either individual-level characteristics, which are related to trust, are segregated across the geography of Uzbekistan or that levels of trust are local phenomena which appear statistically related to endemic demographic characteristics.
Discussion and conclusion
Our results both parallel and question prior findings. While the effects of several Uzbek demographic characteristics, such as socioeconomic status, are similar to those found in previous work, we find that increases in both age and education in Uzbekistan significantly reduce one’s willingness to trust others. These results parallel recent research in the Arab world underscoring how the positive effect of education on trust may not hold in either authoritarian or Muslim countries (Jamal, 2007). In a sense, the social learning experiences that often accompany these characteristics are not as critical for the development of trust; instead, a generational or cohort effect might be at work (Putnam, 2000). In the post-Soviet case of Uzbekistan, the effects of age and education may be reversed for those who matured and lived under Soviet rule, producing a tendency for older cohorts to trust less than younger cohorts (Kornai et al., 2004).
Yet we find that the effects of individual demographics become insignificant when region or language is used to cluster individuals. This implies one of two things. First, levels of trust may be generated by these individual attributes and these attributes may be clustered by region and language. That is, including random intercepts for region and language in the models might have offset the impact of individual demographic variables by attributing their effects to these group characteristics. Second, trust and some individual demographics may all be the product of an unidentified factor that varies by group. Although the latter case seems less likely given prior work that identifies individual attributes as theoretically and empirically important, additional data may help adjudicate. For instance, contextual-level measures of GDP and income inequality could help identify whether levels of trust in Uzbekistan are determined by group characteristics, individual demographics, or both.
The association between group size and levels of trust is of particular interest. While prior research has also found low levels of trust among minority populations, the causal mechanism used to explain this relationship is that of a history of discrimination (Alesina and La Ferrara, 2002; Smith, 2010) or of unfair treatment (Rothstein and Stolle, 2003; Rothstein and Uslaner, 2005). In light of the current analysis, it may not necessarily be past discrimination that reduces trust in Uzbekistan, but current injustice: those ethnic groups that feel oppressed, such as the Tajik, could be wary of voicing regime disapproval for fear of further mistreatment from the Uzbek state, leading to less trust. This claim is consistent with our data. The language and region variables indicate that ethnic Tajik minorities display lower levels of trust than their majority counterparts.
Yet the matter is not so simple. Although ethnic Tajiks suffer from repressive political practices that may produce lower levels of trust than those of ethnic Uzbeks, ethnic Russians and ethnic Karakalpaks yield equally low, if not lower, levels of trust than ethnic Uzbeks, yet they have experienced considerably less discrimination and unfair treatment by the Uzbek state. For instance, other than surrendering some of their cultural heritage while retaining their linguistic influence within the region after the fall of the USSR, ethnic Russians have lost fewer freedoms and have experienced much less oppression and procedural and distributive inequity than ethnic Tajiks (however, this is beginning to change (Peyrouse, 2008; Spechler, 2007)).
Moreover, Uzbek populations are sometimes geographically distinct, such as in Karakalpak, and in other situations more integrated, such as urban populations. Since the survey specifically asks about family, friends, and neighbors, it is impossible to know whether respondents are thinking of members of their own group or people from other groups. In a homogenized society, we would expect this to be ‘others’ for small minorities, but some of these populations may be isolated linguistically and geographically, even if only in urban enclaves. Taken together, the explanation for the lower levels of trust reported by the smaller Uzbek groups is probably rooted in factors relating to social psychology.
Individuals have a tendency to favor in-groups (Perdue et al., 1990) or those groups with which they share a common identity (Tajfel, 1978). This can result in homophilic bias, whereby individuals develop a preference for their own group (Perdue et al., 1990), namely those with whom they engage in regular, daily interaction. This process is observed among groups in which participants share a number of ascribed characteristics, but if individuals differ along a number of dimensions, such as race and nationality, then interactions within small, heterogeneous communities will reduce the perceived trustworthiness of others and levels of trust (Glaeser et al., 2000). So, for members of a minority, trust would be lower toward the population majority than toward members of their own minority group.
If those in heterogeneous groups have positive interactions, however, this will result in increased trust (Marschall and Stolle, 2004). This suggests that individuals may first search for homophilic characteristics when deciding to trust, and then, once more information becomes available, rely on reputations to navigate through exchanges with strangers (Stolle et al, 2008). Other mechanisms besides ethnic, linguistic, or religious heterogeneity, however, may account for these results. Individualism and collectivism, for instance, are known to influence the development of trust (Fukuyama, 1995; Gheorghiu et al., 2009; Yamagishi and Yamagishi, 1994) and often vary by group size and region (see Simpson, 2006). As a result of these conflicting accounts, further research on countries beyond the traditional WVS and EVS sampling frame would help identify the general causal mechanism or mechanisms connecting group size to trust.
It is important to place prior findings regarding minorities and perhaps all demographics related to trust in the correct context. Note that much of the trust literature is based on a broad survey item asking about ‘most people’ that only permits two possible responses (that is, generalized trust). The present study, in contrast, is based on a series of specific questions asking about family, friends, and neighbors that permits five types of responses (that is, particularized trust). The issue is that a persecuted minority may only trust family, friends, and members of a tightly knit enclave, while simultaneously distrusting most people. Since generalized trust is not measured in the present article, the specificity of the survey items put to the Uzbek respondents may explain the high particularized trust rate of 95 percent 7 relative to the low generalized trust rate of 22 percent. 8 The reader should keep in mind, then, that the differences between our findings and others may be due to the fact that different kinds of trust are being measured. More generally, the relationship between particularized trust and generalized trust in Uzbekistan, and elsewhere, remains an important task for future empirical investigations.
In conclusion, while the subject of trust has become a lively area of research, there is little work exploring the causes and correlates of trust in countries outside of commonly available, cross-national, public-opinion datasets. The present study addresses this gap by examining the post-Soviet, authoritarian, Muslim country of Uzbekistan. We find that some individual-level determinants of trust are consistent with the existing literature (such as socioeconomic status), while others (such as age, education, and number of children) yield results in the opposite direction. We also find that controlling for variation by region, religion, and language spoken at home reduces the demographic characteristics to statistical insignificance. Determining whether this is an artifact of reduced variation within these grouping variables or unexplained group variation will require more contextual-level data. Given the correlation between group size and trust, it seems probable that homogeneity and majority status encourage trust. A policy conclusion that emerges from this study is that identifying the barriers to social integration and reducing the perceptions of group differences may help foster trust, and possibly lead to economic development and heightened government performance within Uzbekistan.
Footnotes
Acknowledgements
This work was supported in part by US National Science Foundation grants No. 0326101 and No. 0219350. The first author acknowledges generous support from a Microsoft External Research Grant. We are grateful to Edgar Kiser, Howard T. Welser, and members of the Central Asia + Information and Communication Technologies project at the University of Washington as well as the anonymous reviewers for valuable suggestions and comments on earlier drafts.