



Abstract
Background: Stakeholder participation is an important trend in the field of program evaluation. Although a few measurement instruments have been proposed, they either have not been empirically validated or do not cover the full content of the concept. Objectives: This study consists of a first empirical validation of a measurement instrument that fully covers the content of participation, namely the Participatory Evaluation Measurement Instrument (PEMI). It specifically examines (1) the intercoder reliability of scores derived by two research assistants on published evaluation cases; (2) the convergence between the scores of coders and those of key respondents (i.e., authors); and (3) the convergence between the authors’ scores on the PEMI and the Evaluation Involvement Scale (EIS). Sample: A purposive sample of 40 cases drawn from the evaluation literature was used to assess reliability. One author per case in this sample was then invited to participate in a survey; 25 fully usable questionnaires were received. Measures: Stakeholder participation was measured on nominal and ordinal scales. Cohen’s κ, the intraclass correlation coefficient, and Spearman’s ρ were used to assess reliability and convergence. Results: Reliability results ranged from fair to excellent. Convergence between coders’ and authors’ scores ranged from poor to good. Scores derived from the PEMI and the EIS were moderately associated. Conclusions: Evidence from this study is strong in the case of intercoder reliability and ranges from weak to strong in the case of convergent validation. Globally, this suggests that the PEMI can produce scores that are both reliable and valid.
Keywords
Background and Research Problem
“One of the larger trends in evaluation theory and practice is an increased focus on stakeholder participation” (Mark 2001, 462). Numerous evaluation approaches such as collaborative, democratic-deliberative, empowerment, fourth-generation, inclusive and utilization-focused to name a few, explicitly endorse the principle of stakeholder participation. The abundance of terms used to designate evaluation theories and models in which stakeholders are significantly involved “is surely an indication that participatory approaches to program evaluation are coming of age” (King 1998, 58). Indeed, the participatory principle is now widely accepted, some would even say hegemonic, within the evaluation community (Fleischer, Christie, and LaVelle 2011; Biggs 1995, as cited in Gregory 2000, 180; Mathison 2005; Shea and Lewko 1995; Whitmore 1998). Stakeholder participation is not only a rhetorical device but also a phenomenon that has taken root in evaluation practice in various contexts of evaluation practice (e.g., Cousins et al. 2011; Cullen, Coryn, and Rugh 2011; Thayer and Fine 2001).
Stakeholder participation is one of the major constructs that has caught the attention of researchers, especially those interested in evaluation use (Cousins 2003; Cullen, Coryn, and Rugh 2011; Johnson et al. 2009; Poth and Shulha 2008). Yet, in order for empirical research to contribute effectively to knowledge development, a sound conceptualization and operationalization of stakeholder participation is needed. To that end, Daigneault and Jacob (2009) have developed—based on the work of Cousins and Whitmore (1998)—what they deemed to be a coherent, parsimonious yet content-valid conceptualization of participatory evaluation (PE). Their framework possesses three constitutive dimensions that are theorized as necessary and sufficient conditions for the concept of PE: extent of involvement, diversity of participants, and control of the evaluation process. The dimensions are measured on a 5-point ordinal scale ranging from .00 (complete absence of the dimension) to 1.00 (full presence of the dimension). In between these two extremes, .25, .50, and .75 represent a limited, moderate, and substantial level of the dimension, respectively. Because of the necessary and sufficient condition concept structure, the overall level of stakeholder participation they have proposed is logically determined by the minimum of the three dimensions (Goertz 2006). For instance, an evaluation case with scores of .75 on the first two dimensions and .25 on the third one would get an overall score of participation of .25. Four dichotomous indicators, respectively, representing involvement in various evaluation tasks and types of stakeholders involved, serve to operationalize the extent of involvement and diversity of participants dimensions (Daigneault and Jacob 2009). Control of the evaluation process, by contrast, has not really been operationalized with precision. Rating of this dimension is indeed based on a subjective assessment of the balance of power between the evaluator and participants (from exclusive control by the evaluator to exclusive control by participants).
This framework has given rise to a few applications that seem quite promising (Connors and Magilvy 2011; Jacob, Ouvrard, and Bélanger 2011; Laudon 2010). For instance, Connors and Magilvy (2011) have positively assessed their use of the framework:
Overall, we found the index both easy to implement and to understand and relevant to the work of the CON [College of Nursing] evaluation. The language of the instrument was clear and familiar. In particular, examining the degree of stakeholder participation at the four decision points (design, data collection/analysis, judgment, and dissemination) aligned with the collaborative process used in the CON program evaluation. The rating on the dimension of control was the most subjective, as acknowledged by Daigneault and Jacob, when thinking in general terms about the evaluation. However, when specific evaluation decisions were reviewed retrospectively, we were easily able to assign a rating on this dimension. From our perspective, the scale fulfilled Daigneault and Jabob [sic] goals that the instrument be parsimonious, consistent in structure, and useful for differentiating participatory from nonparticipatory evaluation practices. (pp. 82–83)
Yet, the framework as a measurement instrument has not been empirically validated and could clearly benefit from more specific guidance with respect to how to rate each dimension, especially control. Legitimate doubts have indeed been raised about the reliability and validity of the instrument in its nonvalidated form (Cullen 2009; Cullen, Coryn, and Rugh 2011).
Since the instrument—hereafter labeled the Participatory Evaluation Measurement Instrument (PEMI) for convenience—was specifically developed for the purpose of conducting sound empirical research, it appears necessary to proceed to a first empirical examination of its reliability and validity. Assessing the reliability of the scores generated by two different coders is indeed a first, fundamental, step in any validation study (DeVellis 2005; Fleiss, Levin, and Paik 2004). Next, it is important to assess whether the scores derived from the PEMI can be interpreted as actually measuring the concept of stakeholder participation (see Carmines, Woods, and Kimberly 2005).
Research Objectives and Hypotheses
This study consists of an empirical validation of the PEMI. Specifically, three objectives are pursued:
Intercoder reliability assessment. To examine the level of intercoder reliability achieved by two research assistants working independently using the PEMI on published reports of a sample of published evaluation cases.
Convergent validation I. To examine the extent to which the scores achieved by two independent coders, once discrepancies are resolved through discussion, align with those of a key respondent for each case.
Convergent validation II. To examine the convergence between the scores obtained by key respondents on the PEMI and on the Evaluation Involvement Scale (hereafter EIS, Toal 2009), a validated—albeit incomplete—measure of stakeholder participation.
We hypothesize that the scores of coders will display a “fair” level of agreement or better (i.e., Cohen’s κ must be greater or equal to .40). Following the reliability assessment, it is essential to check whether the coders’ scores correspond to the “real” level of stakeholder participation observed in cases. The “catch” here is that reality does not allow for unfiltered access to its secrets (if it were possible to directly observe reality, it would be meaningless to develop and test a new measurement instrument of stakeholder participation). Therefore, the “true” scores of participation are unknown and we must rely on external variables that are supposed to covary (or not) with this concept to assess whether our measurement is valid. In other words, a convergent/discriminant validation strategy must be used to assess the validity of the inferences derived from the PEMI. The variety of terms used to describe different facets of the unified concept of validity or, more accurately, validation procedures can be quite confusing. In this study, convergent validation refers to the process of comparing different measures of the same concept to see if they converge (covary), whereas discriminant validation refers to the process of comparing different measures of different concept to see if they diverge (Adcock and Collier 2001; McDonald 2005).
Coders’ scores on the PEMI were compared to those of the authors of the articles reporting the evaluation cases on the same instrument (Objective 2, see Figure 1). Contrary to the coders, the authors have direct experience with the evaluation cases (although they might also have consulted the article to establish their scores). This approach to convergent validation is a similar but simpler version of the monotrait-heteromethod approach as initially developed by Campbell and Fiske (1959; cited in Trochim 2006). Our second hypothesis is that there will be a “fair” level of agreement between the two sets of scores (i.e., Cohen’s κ greater or equal to .40).
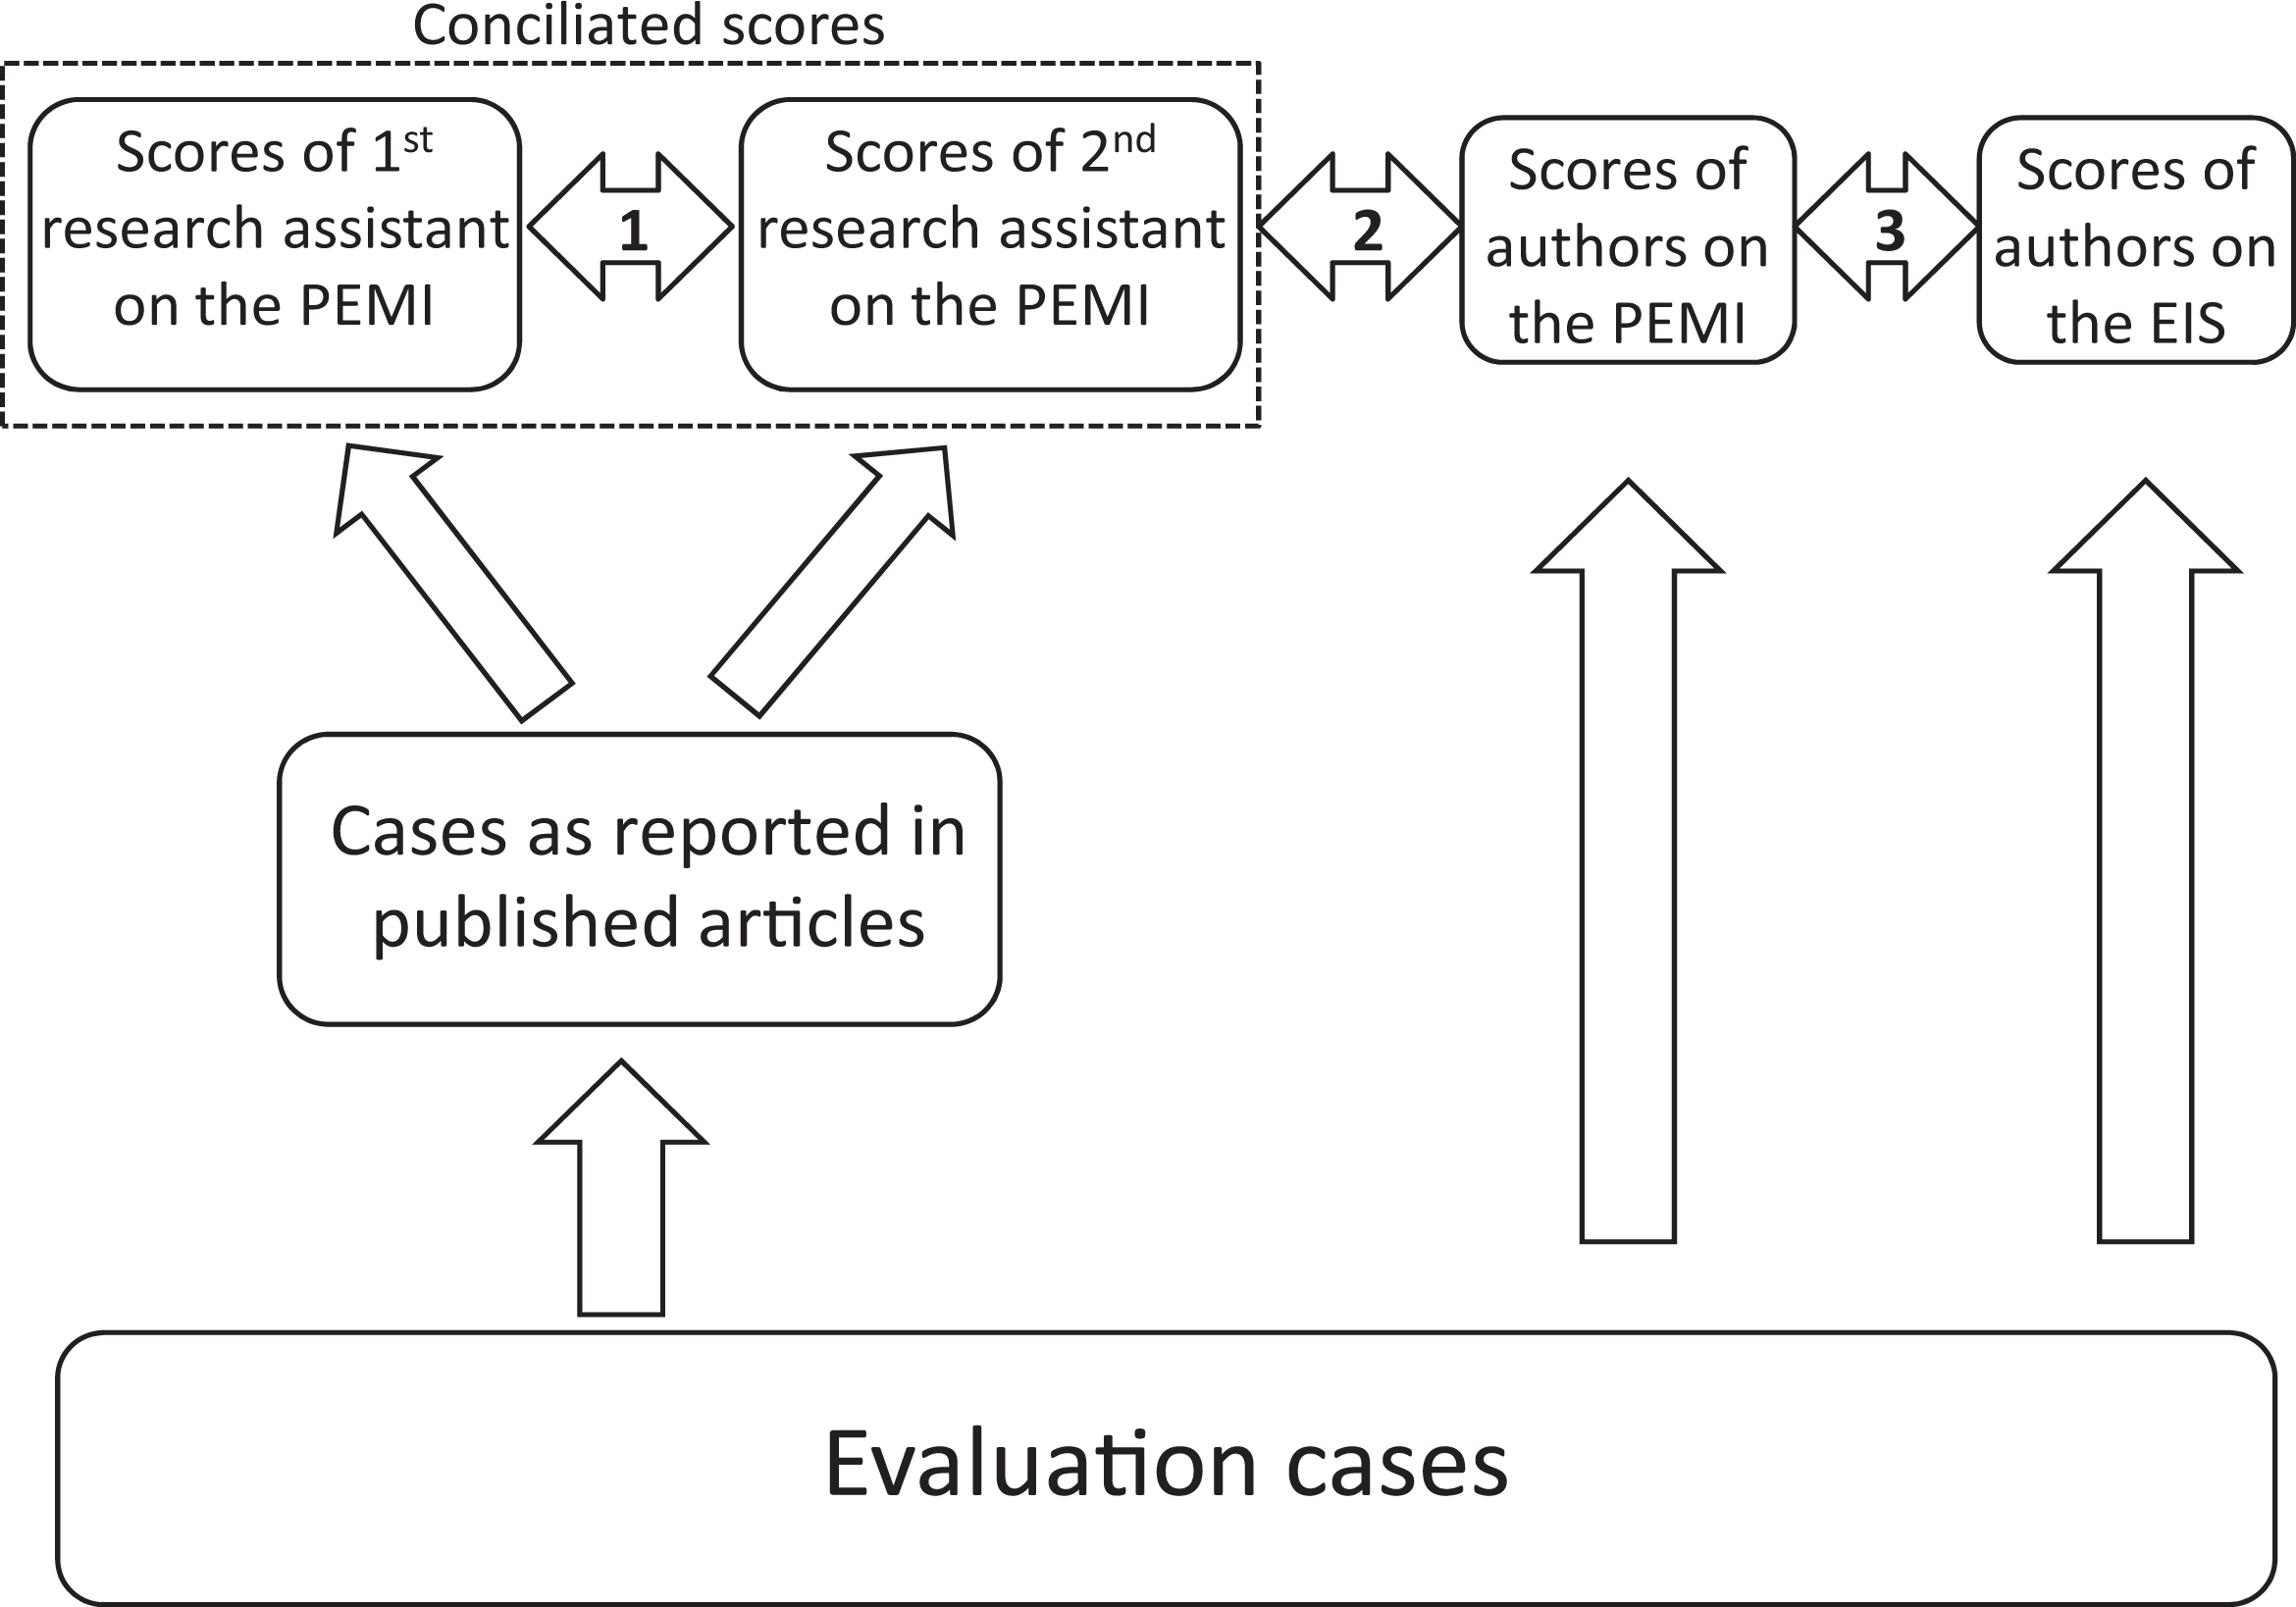
Schematic representation of validation objectives. Note. EIS = Evaluation Involvement Scale; PEMI = Participatory Evaluation Measurement Instrument.
In addition, authors’ scores on the PEMI and the EIS will be compared (Objective 3, see Figure 1). A few words on the EIS are first warranted. This quantitative scale has been developed to measure stakeholder involvement—which corresponds to the extent of involvement dimension in the PEMI—not participation. This instrument has been empirically validated using Messick’s unitary concept of validity and the evidence suggests that it “produces appropriate and adequate inferences and interpretations of involvement in multisite evaluations” (Toal 2009, 361). The EIS thus seems to be a good candidate for validating an instrument like the PEMI. On one hand, a strong positive correlation is expected between the scores for the extent of involvement dimension on the PEMI and the EIS since they purport to measure the same construct (monotrait-heteromethod). On the other hand, a moderate correlation is hypothesized between the overall level of participation as measured by the PEMI and the EIS scores (heterotrait-heteromethod). This expectation is based on both convergent and discriminant rationales. On one hand, convergence is expected since involvement is one of the three constitutive dimensions of stakeholder participation. On the other hand, we expect only a moderate association between the two constructs because they are different even though they are closely related. Indeed, stakeholder participation is not exhausted by involvement: Diversity of participants and control of the evaluation process are necessary dimensions of participation.
Method
Data and Sample
Intercoder reliability assessment
Data for the assessment of intercoder reliability came from a purposive sample of evaluation cases that were reported in articles published in peer-reviewed journals. Though limited in size, the final sample was sufficiently large (i.e., n = 40) to conduct quantitative analysis, once studies used for coder training and pilot testing were excluded. It must be stressed that the unit of analysis was the (evaluation) case, not the article. 1
Articles that were already familiar to the authors were perused to assess whether the PE cases they reported respected three selection criteria. First, cases had to contain sufficient information about the evaluation process to allow for scoring the three dimensions of the PEMI (i.e., who participated, when and how). Second, evaluation cases had to be collectively diverse in terms of their theoretical approach used and their level of stakeholder participation (assessed informally). Third, the study had to contain the e-mail address of the authors or this information had to easily be obtained through a web search or colleagues. Although informally applied, other considerations for case selection included diversity in terms of policy domains (education, health, human services, etc.), origins of authors (United States, Canada, Europe, etc.), and journals.
The database created for the purpose of this study contained 48 cases published between 1985 and 2010 (M = 2000). Cases were published in various journals devoted to program evaluation and other disciplines (see Appendix A). The sample covered many policy domains, mainly education, health and human services, but also agriculture, local governance, environment, and international development. Based on an informal assessment, cases in the sample displayed varying levels of stakeholder participation: nonparticipatory or barely participatory cases (n = 4), limited participation (n = 12), moderate or moderately high participation (n = 26), high or very-high participation (n = 6). This rough classification should not obscure the fact that cases from the same category of participation can actually be very different as to who is involved, how and when. In addition, cases were rather diverse from a theoretical perspective with respect to their evaluation approach and stakeholder involvement. Evaluation cases reported in articles were indeed qualified by their authors as participatory, collaborative, empowerment, stakeholder-based, utilization-focused, democratic-deliberative, community-based, responsive, and so on. Contrary to our initial expectations, contact information proved impossible to obtain for four cases. Since these cases did not respect the third selection criterion, they were used exclusively for training purposes (see below).
Convergent validation I and II
A second source of data came from a survey of one key respondent for each case in the final sample for which author contact information was either available or easy to obtain and which was not part of the first pilot test (n = 39). 2 The survey was conducted online, in English and French, from December 6, 2011, to January 9, 2012. An invitation e-mail was personally addressed to potential respondents and contained a link to an online questionnaire (one link per case). E-mails mentioned the complete reference to the case for which respondents were contacted and the questionnaire’s instructions explicitly asked respondents to base their answers on this specific case. A follow-up message was sent to nonrespondents 1 week after the initial invitation and a second one was sent a week later. A third and last follow-up message was sent 3 days before the survey closed. More frequent correspondence has occurred with a few respondents who have shown interest in the study or for whom problems were experienced. The timing and titles of follow-up messages capitalized on behavioral theory to increase the response rate (RR), emphasizing the need for help and study salience by highlighting the specific evaluation case for which contacted persons were involved (see Ritter and Sue 2007).
It was assumed that the first author of each study was most likely to be knowledgeable about the case and willing to participate in the survey. Second authors were contacted only if the first author’s e-mail address was unavailable or was inaccurate, or if the first author explicitly refused to participate in the study (n = 6). 3 In the end, 44 invitations to participate in the survey were sent, including noncontacts. A total of 25 fully completed surveys were received. 4 Another completed survey was received but a misunderstanding occurred. The respondent’s answers were general (i.e., not related to the specific case for which this person was contacted). While this survey could not be used to check whether the coders’ scores aligned with those of the respondent (i.e., Objective 2), it could nevertheless be used to examine the relationship between scores for the PEMI and the EIS (i.e., Objective 3). It was thus considered a “partially usable questionnaire.” The RR, which was calculated according to the American Association for Public Opinion Research’s (AAPOR) Standard Definitions RR1 (AAPOR 2011, 44), was 56.8%. 5 This RR compares well to those generally obtained through electronic surveys (Couper 2000; Kwak and Radler 2002; Millar and Dillman 2011).
Instruments and Procedures
Intercoder reliability assessment
Applying the PEMI with an adequate level of reliability requires a certain level of familiarity with program evaluation. Coders were therefore recruited from a larger pool of potential coders who had followed a master’s level course on program evaluation and had been studying and/or working as research assistants in a research center on evaluation (i.e., PerfEval). Two research assistants were recruited (one had to be replaced because of unsatisfactory scores) and asked to familiarize themselves with the PEMI by reading Daigneault and Jacob (2009) and an application of it (i.e., Connors and Magilvy 2011). A codebook detailing coding conventions was then developed and was updated during the coding process (see final version in Appendix B). The overall level of stakeholder participation (PART), which was measured on a 5-point ordinal scale, was derived from the minimum or lowest score of the three dimensions. In turn, the scores of extent of involvement and diversity of participants depended respectively on four dichotomous indicators (four indicators measuring the steps of the evaluation process in which stakeholders were involved and four indicators measuring the types of stakeholders involved).
The research assistants were then instructed to independently code nine “vignettes” (i.e., short hypothetical cases about a paragraph in length) developed for training purposes. The use of vignettes was justified by the limited size of the sample. Scores were compared and reliability between coders was assessed informally as recommended by Lombard, Snyder-Duch, and Campanella-Bracken (2002) when conducting training. Coders’ scores were also compared to the scores of the first author (i.e., Daigneault) to ensure a fair understanding of the instrument logic. Clarifications and revisions to the codebook were made when necessary. Coders then continued their training on four real, precoded cases in order to fully integrate the operationalization of the concepts (these cases were those for which we were finally unable to obtain author contact information).
Intercoder reliability was formally assessed in a pilot test based on four evaluation cases (n = 4) of varying levels of stakeholder participation. Using a random number generator and alphabetical ordering by author’s name, one case was selected in each category of participation (i.e., one case for nonparticipatory or barely participatory cases, one case for limited participation, etc.). The following standards, which are well established and widely cited, were used to interpret the values of κ and ICC:
The guidelines developed by Cicchetti and Sparrow (1981) resemble closely those developed by Fleiss (1981) and also represented a simplified version of those introduced earlier by Landis and Koch (1977). The guidelines state that, when the reliability coefficient is below .40, the level of clinical significance is poor; when it is between .40 and .59, the level of clinical significance is fair; when it is between .60 and .74, the level of clinical significance is good; and when it is between .75 and 1.00, the level of clinical significance is excellent. (Cicchetti 1994, 286, italics added)
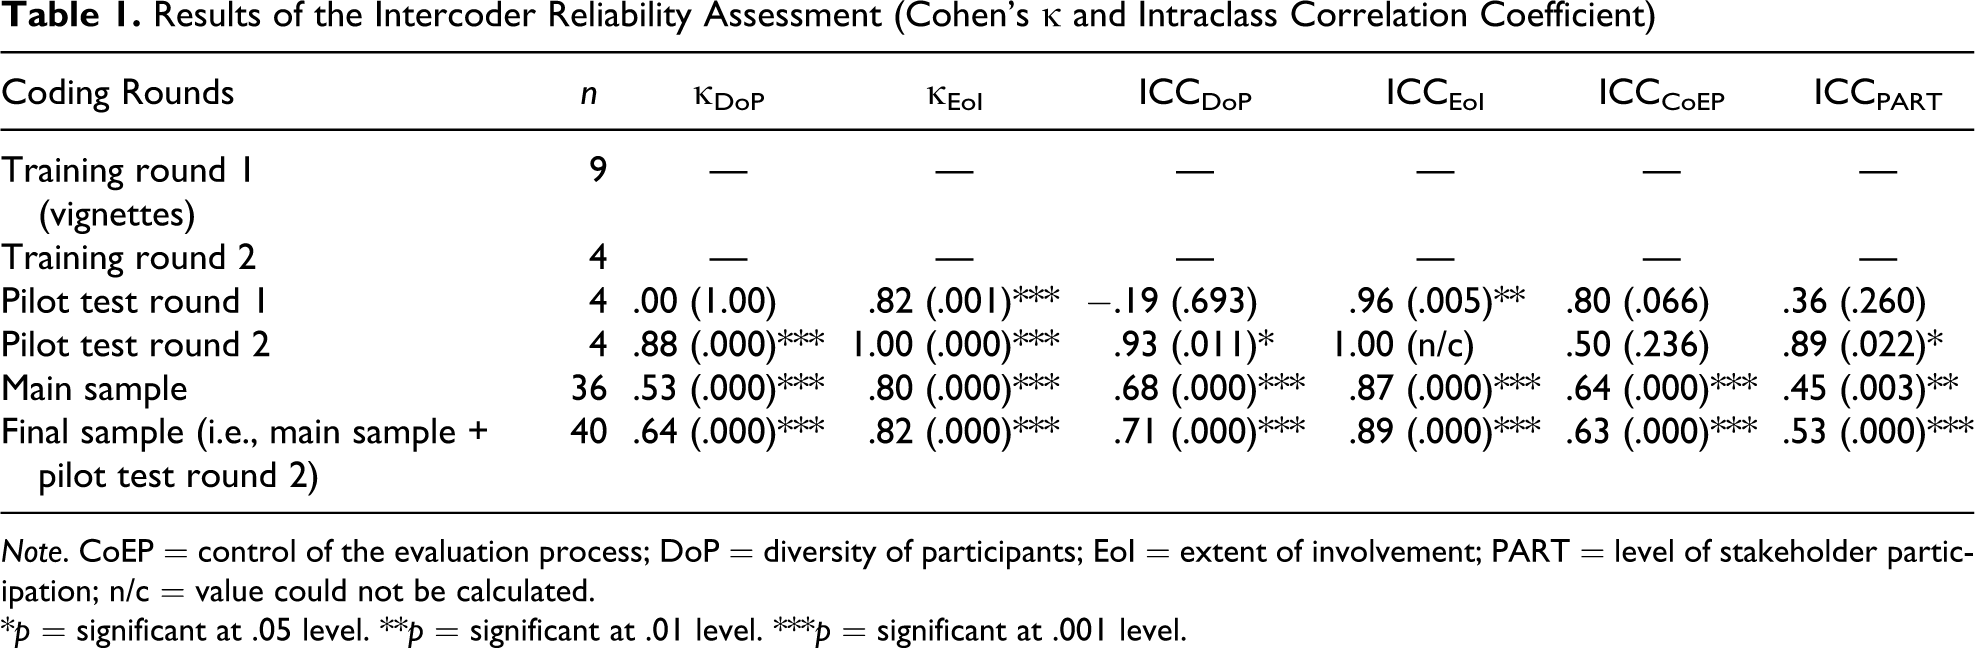
To go on with the coding of the main sample, intercoder reliability scores had to be equal or greater than .40 for this first round of pilot tests. Unfortunately, results were clearly unsatisfactory for the diversity of participants (κDoP = .00; ICCDoP = −.19) and slightly unsatisfactory for the overall level of participation (ICCPART = .36). By contrast, reliability scores for extent of involvement and control of the evaluation process were excellent (see Table 1). The codebook was revised and a second pilot was conducted on four new cases (n = 4) selected in the same way as for the first pilot. Since the results of the second pilot displayed fair to excellent levels of reliability, a decision was made to pursue with the coding of the main sample.
Results of the Intercoder Reliability Assessment (Cohen’s κ and Intraclass Correlation Coefficient)
Note. CoEP = control of the evaluation process; DoP = diversity of participants; EoI = extent of involvement; PART = level of stakeholder participation; n/c = value could not be calculated.
*p = significant at .05 level. **p = significant at .01 level. ***p = significant at .001 level.
Once cases used for training and the two pilots were removed, the main sample contained 36 cases. The cases were double-coded independently at a rate of approximately six cases at a time (i.e., which took a few days each time), depending on length of coding and availability of coders. Cases for each coding round were purposively selected by the author to reflect the various levels of stakeholder participation, the evaluation’s date of publication and the policy domain. Discrepancies were resolved by discussion between the two coders, with occasional guidance by the authors. Coding conventions were revised and added as needed. Coding took an average of 2.5 hr by case per research assistant, including time to solve discrepancies between the coders. To mitigate the limited size of our sample, a decision was made to add the cases of the second pilot to those of the main sample. This practice is acceptable when the scores obtained during the pilot are adequate (Lombard, Snyder-Duch, and Campanella-Bracken 2002). The final sample contained 40 cases.
Convergent validation I and II
The questionnaire sent to key respondents of the evaluation cases (i.e., studies’ authors) had two sections. The first section focused on the PEMI. Respondents had to first check boxes about which stakeholder type participated at which step of the evaluation process and then assess their level of control on the evaluation process. A 5-point index of participation (PART) was derived from their answers and fed back to respondents for reactions. Respondents’ opinions were measured on an ordinal scale (Do not agree at all, Agree to some extent, Totally agree, or I don’t know/I don’t want to answer) and an open-ended question asked respondents to justify their choice.
The second section relied on a slightly modified version of the EIS (Toal 2007, 2009). In the original scale, “Respondents [are] asked to indicate the response that best reflected the extent to which they were involved in 13 different activities (No = 1, Yes, a little = 2, Yes, some = 3, Yes, extensively = 4, or ‘I don’t think this activity took place)” (Toal 2009, 354). The results of exploratory factor analysis conducted by Toal (2009) supported the removal of 2 items with low factor loadings. In addition, instructions to respondents were adapted to provide a better fit to the specific aim of this study. Whereas the original scale asked respondents to rate their involvement in the process, the version of the EIS used in this study asked about the involvement of nonevaluative stakeholders: “For each question, please choose the response that best describes the extent to which stakeholders other than the evaluator were involved in this evaluation activity.” This modification was especially important since most articles in our sample reported cases written from the perspective of the evaluator and since the PEMI purports to measure stakeholder participation (as opposed to the evaluator’s involvement).
The original scale is based on the theoretical work of Cousins and Whitmore (1998) and Burke (1998). Contrary to the PEMI, however, this instrument does not purport to measure the three dimensions of Cousins and Whitmore’s framework, but only depth of participation (similar to extent of involvement in the PEMI). The EIS is therefore a closely related but incomplete measure of stakeholder participation. Why use the EIS if it does not perfectly measure stakeholder participation? First of all, it is possible to derive theoretical expectations about the relationship between PEMI and EIS scores that could be empirically assessed. As stated earlier, a moderate correlation is expected between the overall level of participation generated by the PEMI (PART) and the level of stakeholder involvement generated by the EIS. A strong correlation is also expected between the latter and the PEMI’s extent of involvement score since both indices purport to measure the same concept. Second, the EIS’ usefulness stems from the fact that it has been empirically validated and that the evidence of its validity is convincing: “it appears that the majority of the evidence suggests that the Evaluation Involvement Scale produces appropriate and adequate inferences and interpretations of involvement in multisite evaluations” (Toal 2009, 361).
The questionnaire sent to studies’ authors was pilot-tested for clarity and readability by two university professors with significant expertise in program evaluation in general and stakeholder participation in particular. One expert tested the English version of the questionnaire while the other tested the French version. Comments from experts were generally positive but also pointed to a few modifications required in the wording of the questions. In addition, correspondence with an early respondent highlighted an ambiguity with respect to what their answers should refer (i.e., general practice vs. the specific case for which they were contacted). Whereas the invitation e-mail was clear on this point (i.e., respondents were instructed to answer the questionnaire with respect to the specific case for which they were contacted), the questionnaire was modified early in the process to eliminate this ambiguity.
Data Analysis
Intercoder reliability assessment
Two quantitative indices were calculated by SPSS (Version 13) to assess intercoder reliability: Cohen’s κ and intraclass correlation coefficient (ICC). The Cohen’s κ statistic was used to calculate reliability for the eight dichotomous indicators. The κ was selected over its main rival for nominal data, namely percentage of agreement, because it is a chance-corrected measure of agreement for which results are easily interpretable (Orwin 1994). Averaged κ was calculated for the four indicators of extent of involvement and diversity of participants, respectively. While it is usually recommended to assess reliability scores on an item-by-item basis (e.g., Orwin 1994), the κ scores for indicators of a same dimension were averaged. It indeed makes sense theoretically as the indicators are supposed to measure the same construct and it facilitates calculation of κ where the number of cases is small (i.e., only four cases for the pilot tests) and where the distribution of scores for individual indicators is skewed (i.e., some columns of the 2×2 matrices were blank).
The ICC was used to assess intercoder reliability for ordinal scale variables (PEMI’s three dimensions and the overall level of participation—PART). Although the use of weighted κ is generally advocated for ordinal variables and the ICC for continuous ones, ICC is robust enough to be used with ordinal variables in most situations (Norman 2010). The two tests have indeed been proven to be equivalent under certain conditions by Fleiss and Cohen (1973, as cited by Cicchetti 1994; Fleiss, Levin, and Paik 2004; Norman 2010). Furthermore, ICC’s flexibility and relationship with Generalizability or G theory are desirable properties that militate in its favor (Norman 2010; Orwin 1994). The ICC model selected was the two-way random effects with measures of absolute agreement (i.e., ICC [2, 1], see Shrout and Fleiss 1979).
Convergent validation I
Cohen’s κ and ICC statistics were also used to examine the extent to which the scores achieved by the two independent coders, once discrepancies resolved, aligned with those of a key respondent for each case (where the key respondent is an author of an article in which the cases were reported).
Convergent validation II
Spearman’s rank order correlation coefficient (rs ) was used to examine the convergence between the scores achieved by the authors on the PEMI and on the EIS. Whereas Spearman’s test is less statistically powerful than Pearson’s correlation coefficient, it is a robust nonparametric test appropriate for ordinal scales that makes few assumptions about the distribution of data. The following standards were used to interpret the results (whether negative or positive): .00 to .20 = very weak correlation; .20 to .40 = weak correlation; .40 to .70 = moderate correlation; .70 to .90 = strong correlation; .90 to 1.00 = very strong correlation (Johnston 2000).
Results
Intercoder Reliability Assessment
Results from the different rounds of coding are presented in Table 1. As it was explained earlier, the final sample (n = 40) was composed of cases from the main sample and the second pilot. As denoted by the κ statistic and the ICC, intercoder reliability is “good” for diversity of participants and “excellent” for extent of involvement. The ICC score is also “good” for control of the evaluation process. Reliability for the overall level of participation, which is the minimum score of the other dimensions, is “fair.” Furthermore, all the results are statistically significant (p = .000), which means that it would be highly improbable that the agreement between coders was due to chance. Thus, the results from this intercoder reliability assessment suggest that the PEMI can be used on evaluation cases reported in the literature to produce reliable scores about a phenomenon that is believed to be stakeholder participation. We now examine whether this belief about the nature of this phenomenon is warranted.
Convergent Validation I
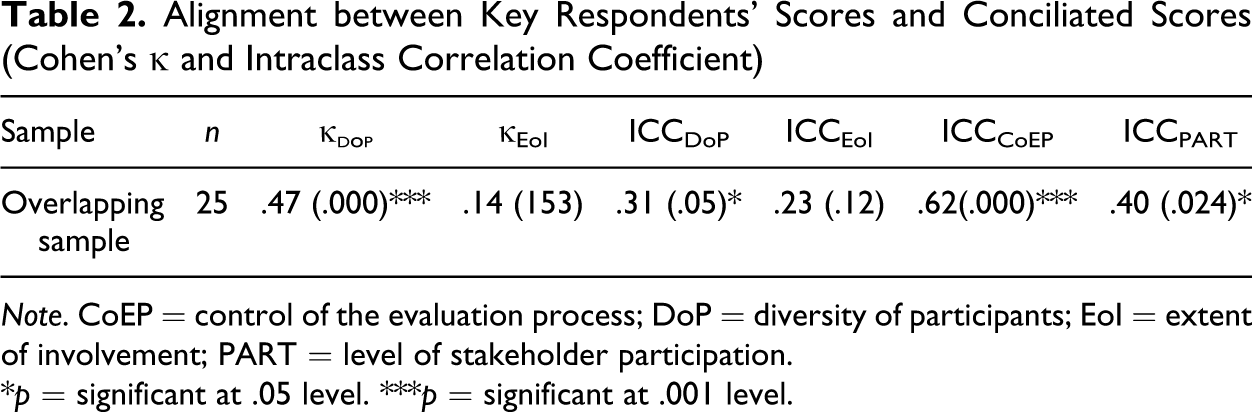
The scores obtained by the authors who fully completed their questionnaires (n = 25) were compared to those of the coders (once discrepancies were resolved). Regarding the dichotomous indicators for diversity of participants and EOI, reliability as measured by Cohen’s κ is “fair” and “poor,” respectively (see Table 2). Even though the results for the EOI are not satisfactory (i.e., low κ and statistically nonsignificant results), it must be noted that they are still better than what would be expected by chance alone (i.e., κ = 0). ICC results for the diversity of participants and EOI dimensions are “poor” and, in the latter case, also fail to attain statistical significance. This result is puzzling since extent of involvement was the dimension for which coders’ scores were the most reliable. ICC results for the control of the evaluation process and overall level of stakeholder participation were respectively “good” and “fair” and were both statistically significant. Overall, there is a positive alignment between the coders’ and the authors’ scores, but its magnitude is relatively modest (ranging from poor to good). Overall, these results provide some evidence about the validity of the PEMI, but this evidence is relatively weak.
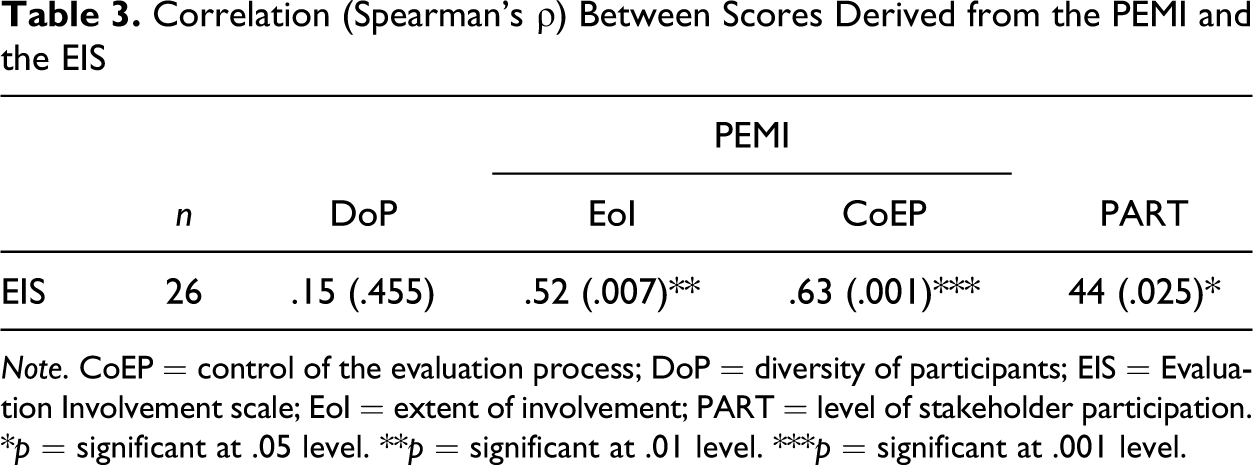
Correlation (Spearman’s ρ) Between Scores Derived from the PEMI and the EIS
Note. CoEP = control of the evaluation process; DoP = diversity of participants; EIS = Evaluation Involvement scale; EoI = extent of involvement; PART = level of stakeholder participation.
*p = significant at .05 level. **p = significant at .01 level. ***p = significant at .001 level.
Alignment between Key Respondents’ Scores and Conciliated Scores (Cohen’s κ and Intraclass Correlation Coefficient)
Note. CoEP = control of the evaluation process; DoP = diversity of participants; EoI = extent of involvement; PART = level of stakeholder participation.
*p = significant at .05 level. ***p = significant at .001 level.
Convergent Validity II
The authors’ scores on the PEMI were compared to their scores on the EIS. As stated earlier, a positive moderate relationship was expected between PART and EIS scores because there are closely related but yet different constructs. In addition, a strong positive relationship was expected between extent of involvement and EIS scores since they both purport to measure stakeholder involvement in evaluation. On one hand, the results support the first hypothesis (see Table 3).The relationship between the overall participation score derived from the PEMI and the involvement score derived from the EIS is one of moderate strength (rs = .44) and statistically significant (p = .025). On the other hand, the relationship between the two alternative measures of stakeholder involvement is only one of moderate strength (rs = .52, p = .007). Whereas this result goes in the expected direction, it is clearly below our expectations. An unexpected result is the moderate association (i.e., rs = .63, p = .001) between the scores for control of the evaluation process and the EIS scores. This will need to be further investigated.
At the aggregate level (i.e., overall level of participation), the results from convergent validation provide strong evidence in favor of the PEMI’s validity. The two sets of scores are indeed moderately associated, which is congruent with our theoretical expectations. At the dimension level, the validation evidence is weaker since the relationship between extent of involvement and EIS is not as strong as expected. Yet, the moderate strength of the correlation still constitutes evidence of the validity of the extent of involvement dimension:
We know for sure that we would hope for a correlation of neither 1.00 nor 0. In the first case, the new test could be considered a veritable clone of the one with which it is being compared. In the second case, the construct validity of the very concept being measured would be called into question. (Cicchetti 1994, 288: see also Adcock and Collier 2001)
Discussion
This study aimed at examining (1) whether the PEMI could be used by two coders on published evaluation cases to produce reliable scores; (2) whether the coders’ conciliated scores aligned with those of a key respondent for each evaluation case; and (3) whether the scores derived by key respondents on the PEMI and the EIS converged.
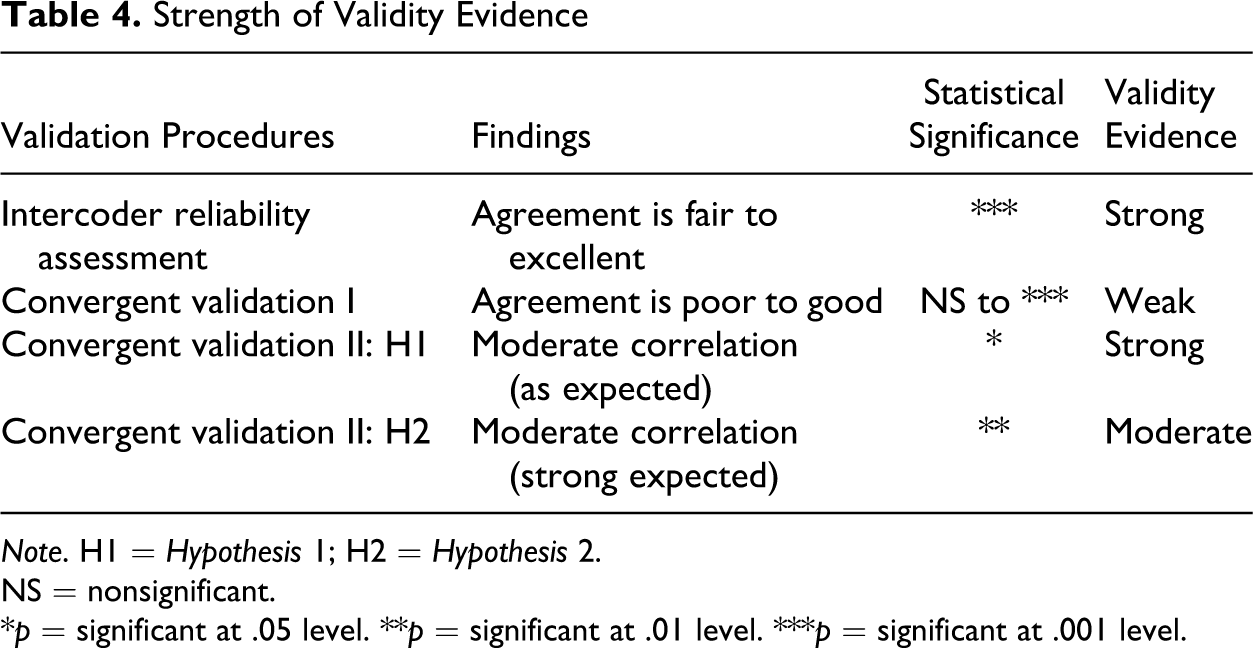
Are inferences derived from the PEMI reliable and valid? It is important to stress that “validity is best thought of as a degree, since no variable completely captures an abstract concept” (McDonald 2005, 939). Similarly, Toal (2009) argued that “validity is not a question of ‘yes’ or ‘no,’ but instead a question of ‘more’ or ‘less’” (p. 350). The results from this study were therefore interpreted in terms of the strength of the evidence they bring for (and against) PEMI’s validity (see Table 4). On one hand, the evidence is positive and ranges from moderate to strong in the case of intercoder reliability and convergence between PEMI’s and EIS’ scores. On the other hand, the strength of the evidence is weaker in the case of the alignment between coders’ and authors’ scores on the PEMI. A first, natural, explanation for this finding would be that the validity of the PEMI is problematic. We would like to suggest three plausible, alternative explanations to this conclusion. First of all, whereas the research assistants had been trained in the use of the instrument, could rely on numerous coding conventions (see Appendix B), and benefited from useful feedback on their scores, the authors who responded to the survey were “left on their own” when using the PEMI. Second, the different data sources used by the research assistants and the authors (i.e., published articles and direct experience, respectively) might explain the discrepancy between their respective results. Coders had indeed to base their scores on what the articles reported about evaluation cases.Even though reporting sufficient data about each evaluation case was a selection criterion for articles, it cannot be assumed that the articles constitute a perfect representation of cases. Third, memory limitations could have biased the scores of the authors and, as a result, could have brought down the level of agreement between their scores and those of the research assistants. Studies in the sample were published more than 10 years ago on average and some authors expressed concerns about their ability to correctly remember the details of the case. Memory problems were cited as the reason for refusal to participate in the study or abandonment by two authors. While a few respondents initially expressed concerns about their memory as well, they nevertheless seemed to be able to remember the case well enough to fully complete the questionnaires and did not raise this problem again, whether through the open-ended section of the questionnaire or e-mail.
Strength of Validity Evidence
Note. H1 = Hypothesis 1; H2 = Hypothesis 2.
NS = nonsignificant.
*p = significant at .05 level. **p = significant at .01 level. ***p = significant at .001 level.
It is worth stressing that this study, like every study which relies on a purposive sample, incurs risks of selection bias. Indeed, although great care was taken to ensure a certain level of diversity during case selection, the extent to which the findings from this study are generalizable to other evaluation cases and settings remains uncertain. For instance, it is entirely possible that some “mainstream” evaluation model (e.g., PE à la Cousins; see Cousins and Earl 1992) are overrepresented in the sample simply because they are more likely to report in sufficient details the evaluation process that was followed. Moreover, the fact that only published evaluation studies were used may have biased the sample against both nonparticipatory and highly participatory cases. Finally, while the survey RR was quite acceptable with respect to public opinion research standards, respondents might nevertheless differ from nonrespondents on significant dimensions, for instance their greater knowledge in or interest for PE. However, it is difficult to establish the direction and magnitude of the influence that nonresponse would have in this specific case.
Yet, in the end, the results of this study suggest that the PEMI can produce scores that are both reliable and valid. It must be noted that the statistics used to measure intercoder reliability and convergence between scores, namely Cohen’s κ and ICC, are based on agreement, not consistency. These statistics are thus rather conservative (see e.g., Lombard, Snyder-Duch, and Campanella-Bracken 2002). Furthermore, a debriefing session with the research assistants revealed that reliability would probably improve if more cases were coded. Some coding conventions were developed relatively late in the coding process and added to the coding book but could unfortunately not be applied to many cases. The debriefing also revealed that testing the PEMI on articles was a tough test for reliability. Indeed—and despite careful selection—many of the articles reviewed in this study contained incomplete or ambiguous information on participation. The need for interpretation was increased and, in turn, the probability of misunderstandings increased as well. This suggests that reliability would improve if the PEMI was used in a real-world setting. The research assistants finally stated that control of the evaluation process was the most difficult dimension to score as determining a representative score is difficult when there are variations during the process. Moreover, they pointed that the rule used to determine the overall level of participation (PART) can be counterintuitive. They thus suggested that the use of the average score of the dimensions would better reflect the level of stakeholder participation than would the minimum score. This theoretical issue will need to be further investigated (see Daigneault and Jacob, forthcoming).
Footnotes
Appendix A: Reference List of the Total Sample
Appendix B: Coding Conventions (Final Version)
Acknowledgments
The authors first wish to thank the two research assistants who coded the cases, Geoffroy Desautels and Marylie Roger, and all respondents for their generosity and interest in this study. The authors also wish to thank Marvin C. Alkin and Marie Gervais for their help in pilot-testing the questionnaire for readability, as well as David Collier and Nathalie Loye for their useful precisions on the distinction between various types of validation. Finally, the authors acknowledge the help of Kristen Leppington for linguistic revision.
Declaration of Conflicting Interests
The authors declared no potential conflicts of interest with respect to the research, authorship, and/or publication of this article.
Funding
The authors disclosed receipt of the following financial support for the research, authorship, and/or publication of this article: The first author gratefully acknowledges a doctoral grant from the Canadian Social Sciences and Humanities Research Council (SSHRC). Funding to carry out this study was provided by the Canadian Social Sciences and Humanities Research Council (SSHRC).