
Abstract
This meta-analysis examines the effectiveness of self-management strategies in enhancing the teaching performance of educators, with a focus on special education contexts. Thirty-six studies, including peer-reviewed articles and gray literature, were evaluated for methodological rigor using the What Works Clearinghouse (WWC) Design Standards. Of these, 26 studies meeting the standards with or without reservations were further analyzed using descriptive review, meta-analysis, and moderator analysis. Findings revealed self-monitoring is the most frequently used self-management strategy. Among the educators included in the studies, the majority were special education teachers. Effect sizes were calculated using Tau-U for all 26 studies, between-case standardized mean difference (BC-SMD) for 25 studies, and performance-criteria-based effect size (PCES) for 13 studies reporting a mastery criterion. The overall Tau-U indicated a very large effect size of 0.88 (CI95 = [0.74, 1]), and BC-SMD resulted in a large effect size of 0.87 (CI95 = [0.77, 0.98]). The PCES showed an overall effective effect size of 1.15 (CI95 = [1.07, 1.23]). Moderator analysis revealed behavior-specific praise, and fewer years of teaching experience were associated with higher teaching performance effect sizes compared to other relevant categories; however, years of teaching experience and higher teaching performance were positively associated when using BC-SMD calculations. Detailed findings along with corresponding recommendations are discussed.
Introduction
The field of education increasingly emphasizes the use of evidence-based practices to ensure effective instruction and positive student outcomes. Within special education, this emphasis is reinforced by federal mandates such as the Individuals with Disabilities Education Improvement Act of 2004 (IDEIA, 2004), which requires educators to implement instructional approaches supported by strong empirical evidence (Mason et al., 2017). To meet these expectations, interventions have been developed and categorized as evidence-based, research-based, or scientifically supported depending on the rigor of their supporting data (Kretlow & Blatz, 2011). Educators must implement these interventions that often involve following several steps within a task analysis, collecting ongoing data, and making data-based decisions to address the increasing diversity of student needs (Borosh et al., 2023; IDEIA, 2004; Mason et al., 2017). Although such interventions have demonstrated effectiveness, they typically require strict adherence to treatment fidelity as well as consistent support and feedback to maintain educator performance (Rispoli et al., 2023). However, these requirements are challenging to sustain in real-world school settings or other educational environments where time and resources are limited (Rispoli et al., 2017). In response, self-management strategies for educators have emerged as a practical and sustainable alternative that minimizes reliance on external resources while supporting high-quality teaching. As a note, the term “educator” in the present study is used broadly to encompass school personnel, including teachers, paraeducators, and others (e.g., student teachers) who play a role in teaching students with special needs.
Self-management strategies equip educators with the skills to regulate their own behavior (Aljadeff-Abergel et al., 2015) and involve the application of techniques by the person themselves to achieve desired behavioral changes (Cooper et al., 2020). The basis of self-management strategies relies on the principles of self-control, which reflect the individual’s ability to modify the environment in order to change their own behavior (Marshall & Rohrer, 2022). Self-management strategies support implementation fidelity by enabling educators to systematically monitor their own performance (e.g., Bishop et al., 2015). These strategies might typically follow a sequential process, beginning with setting personal goals and independently applying antecedent strategies (e.g., response prompts) to increase the likelihood of correct performance. Educators then engage in self-monitoring by recording whether target teaching behaviors occur, followed by self-evaluation through comparing their performance with predetermined criteria, self-reinforcement through managing performance consequences, and, in some cases, self-administered feedback, such as delivering praise or corrective feedback based on their own performance (Aljadeff-Abergel et al., 2015). The use of these strategies provides data for educators to recognize their strengths and areas that need improvement, reduces the need for external observers, and enhances the consistency and integrity of their teaching performance. In this way, educators can apply interventions more accurately and increase their professional independence.
Prior to using self-management strategies, educators are typically taught evidence-based instructional practices (e.g., discrete-trial teaching, direct instruction) by experts, often through instruction, modeling, rehearsal, and feedback (Courtemanche et al., 2020; Sarokoff & Sturmey, 2004). Following this training, educators have used self-management strategies to increase the fidelity of implementation of many instructional practices across various settings and formats. For example, educators have used self-management strategies to strengthen the consistent implementation of discrete-trial teaching (Belfiore et al., 2008), direct instruction (e.g., Fedders, 2011), and prompting students with special needs to use augmentative and alternative communication (AAC) devices when communication demands arise (e.g., Bingham et al., 2007). Educators have also employed self-management strategies to implement behavioral practices such as praising (Kalis et al., 2007), data recording (Gerald et al., 2019), and the Good Behavior Game (Oliver et al., 2015). Studies have reported the applications of these strategies both in classrooms (e.g., Bishop et al., 2015) and in individualized instructional settings (e.g., Abbondante, 2012), where they enhanced intervention fidelity for students with a variety of disabilities (e.g., intellectual disability, Browder et al., 2007; emotional and behavioral disorders, Wills et al., 2019). The structure of intervention packages has also varied, with some studies using a self-management strategy as a standalone strategy to improve educators’ teaching performance (e.g., de la Cruz, 2009), whereas others combined a self-management strategy with one other self-management strategy (e.g., self-monitoring plus self-evaluation; Belfiore et al., 2008) or with additional components (e.g., Kiyak & Tekin-Iftar, 2022) to further strengthen teaching performance. Overall, self-management strategies have been applied to improve competencies across a wide range of educators, from teacher candidates (i.e., student teachers) to core subject teachers (e.g., Keller et al., 2005; Kiyak & Tekin-Iftar, 2022; Markelz et al., 2019; Sallese & Vannest, 2022).
Although the growing body of literature highlights the practicality of self-management strategies and their positive outcomes for educators in the special education field, their overall effectiveness in enhancing teaching performance has yet to be fully assessed. To the best of our knowledge, to date, three literature reviews have focused on examining studies that use self-monitoring strategies to improve educators’ teaching behaviors and professional practices (i.e., Layden et al., 2023; Rispoli et al., 2017; Scheibel et al., 2023). However, none have examined self-management more broadly, and no meta-analysis has been conducted on this specific topic. Two of these reviews (i.e., Layden et al., 2023; Rispoli et al., 2017) evaluated the quality of peer-reviewed studies using the standards for evidence-based practices of the Council for Exceptional Children (CEC, 2014) and analyzed the descriptive features of the included studies. Among these, Rispoli et al. (2017) investigated self-monitoring strategies aimed at improving educators’ fidelity in implementing within-classroom practices up to 2015. Of the 17 studies reviewed, seven met all the CEC quality indicators. A more recent review by Layden et al. (2023) examined 30 years of self-monitoring studies aimed at improving educator performance from 1990 to 2021. Although their inclusion criteria were broader than those of Rispoli et al., allowing for an updated review covering more than five additional years, there was some overlap in the included studies, resulting in 24 studies, of which eight met the CEC quality indicators.
Both systematic syntheses provided valuable insights, noting that high-quality interventions often included structured and individualized training paired with performance feedback delivered by others, in studies that met the CEC quality indicators (Layden et al., 2023; Rispoli et al., 2017). However, they also emphasized limitations, particularly regarding teaching performance and in specifying participant and interventionist characteristics (Layden et al., 2023; Rispoli et al., 2017). Within these reviews, self-management strategies were described as promising approaches for educators to independently monitor and improve their own implementations. However, Rispoli et al. (2017) highlighted the need for a meta-analysis to quantify the findings, and Layden et al. (2023) underscored the importance of incorporating gray literature to mitigate potential publication bias.
A recent review by Scheibel et al. (2023) sought to address limitations in the existing literature by including gray literature and applying a meta-analytic approach through the Single Case Analysis and Review Framework. Their inclusion criteria focused exclusively on studies in which teacher-directed self-monitoring (TD-SM) served as the independent variable (IV) and teaching performance as the dependent variable. As a result, studies included self-monitoring strategies but targeted outcomes beyond teaching performance, such as general classroom management, administrative tasks, or other educator behaviors, were excluded, leading to the removal of 36 studies and leaving only 10 studies for inclusion. Following quality and rigor analyses, a meta-analysis could not be conducted because only two studies provided designs with calculable effect sizes (Scheibel et al., 2023). Therefore, the authors reported their findings as a systematic literature review highlighting the importance of self-monitoring for enhancing educators’ teaching performance. Nevertheless, given that much of the current literature emphasizes increasing educators’ daily frequency of implementing interventions (Scheibel et al., 2023), there remains a need to synthesize research examining broader educator outcomes and a wider range of self-management strategies beyond self-monitoring.
Although no meta-analysis has specifically targeted self-management strategies for educators, existing meta-analyses may provide some insight into related practices. For instance, Ennis et al. (2020b) conducted a systematic review and meta-analysis study examining the effectiveness of coaching in increasing educators’ use of behavior-specific praise (BSP) in Pre K–12 settings. Their review indicated 16 of the 48 included studies incorporated a self-management strategy alongside coaching. Similarly, Zoder-Martell et al. (2019) conducted a systematic review and meta-analysis on interventions aimed at improving educators’ implementation of BSP. They identified only four studies (out of 28) employing self-monitoring, making it the least frequently used practice in their systematic review, even though other research (e.g., Ennis et al., 2020a; Rispoli et al., 2017) has described self-monitoring as a commonly used behavioral intervention to enhance educators’ praising skills. Notably, neither of these meta-analyses examined moderator variables. Despite these limitations, both reported large overall effect-size values, underscoring the potential impact of self-monitoring on educators’ use of BSP when implemented effectively. These findings highlight the need for further quantitative research to assess the role of self-management strategies for educators.
Given the broad applicability of self-management strategies and the promise of these interventions for improved outcomes in a variety of educator skills, particularly in strengthening teaching performance, there is a need for a systematic and quantitative investigation, including gray literature. Thus, this study aims to contribute to the literature by aggregating and comparing self-management studies focused on improving the teaching performance of educators utilizing single-case experimental designs (SCEDs), the most common methodology in this area (Aydin, 2024). To achieve this, peer-reviewed studies and gray literature were examined to address the following research questions:
Method
Search Procedure
We followed the initial search protocol for the research process, which is available in the Supplementary Material. The search focused on SCED studies published in English and included peer-reviewed articles, theses, and dissertations. To access the studies, a database search covering the period before July 2024, including ERIC, Scopus, Academic Search Ultimate, ScienceDirect, PsycInfo, Open Dissertation, and Proquest and Thesis Global, was conducted. Keywords were categorized into three groups: (1) educator-related terms, (2) self-management strategies, and (3) special education-related terms. Keywords were combined using “OR” within each group and “AND” across groups. Each group’s keywords were as follows, respectively: teaching practice, staff training, personnel preparation, graduate training, behavior analyst training, teacher training, professional development, staff performance, teacher, educator, practitioner, instructor, pre-service teacher, in-service teacher, paraprofessional, paraeducator, therapist, educational staff, student teacher, substitute teacher, educational specialist, tutor, trainer, behavior analyst, interventionist (AND) self-management, self-regulate, self-regulation, self-monitoring, self-recording, self-reinforcement, self-evaluation, self-advocacy, self-observation, self-instruction, self-determination, self-control, empowerment (AND) special education, special needs, and disabilit*.
The first and second authors independently searched each database using the keyword groups. The RIS documents generated from each database were downloaded and merged in Zotero to create a single RIS document after removing duplicates. This process was conducted independently by both authors to ensure search reliability. However, only the first author’s final RIS document was uploaded to the Rayyan system, a web-based platform for systematic reviews, which enables the research team to evaluate studies independently and ensure quicker coder reliability (Aydin et al., 2025; Ouzzani et al., 2016; Sulu et al., 2026). We identified 3,398 articles and 1,539 dissertations/theses in the initial search. After removing duplicates (n = 1,794), we transferred 3,173 studies to the Rayyan system for review based on the inclusion and exclusion criteria. On this platform, the first and second authors independently screened the titles and abstracts of all retrieved studies. A blind on/off function was used to facilitate independent decision-making and to discuss and resolve disagreements collaboratively. First, the blind-on was used until the first two authors independently completed the inclusion and exclusion decisions for the studies transferred into the Rayyan system. Then, the blind-off mode was opened to make both coders’ evaluations visible to each other, enabling assessment of their agreement and disagreement. This process facilitated collaboration between the two coders and accelerated the reliability assessment.
Inclusion and Exclusion Criteria
We included studies according to the following inclusion criteria: (a) publication in a peer-reviewed journal or as a thesis/dissertation in English, (b) use of SCEDs as the research method, (c) focus on improving the teaching practices of educators who teach students with disabilities, (d) use of a self-management strategy as the IV to improve educators’ teaching performance, and (e) inclusion of a graphical representation of self-management data for educators. We excluded studies if they did not meet one of these criteria. First, we screened 3,173 studies by title and abstract in Rayyan. Of these, we excluded 3,049 because they were unrelated to the topic or did not use SCEDs as the methodology. We conducted a full-text review of 124 studies, and excluded 100 of them for the following reasons: not related to special education (n = 45), not targeting educators (n = 20), lacking data on educators (n = 18), and not using a self-management strategy (n = 17). After this process, 19 studies (15 articles and nine theses/dissertations) remained for inclusion. The first and second authors then conducted backward and forward searches to identify possible additional studies. The backward search, which involved examining reference lists of included studies and related review articles, identified eight additional articles and two theses/dissertations for inclusion. The forward search, using Google Scholar’s cited lists of included studies, added two more theses/dissertations. In total, we included 36 studies (23 articles and 13 theses/dissertations) for evaluation against WWC standards. Figure S1 in the Supplementary Material illustrates the search process in accordance with the Preferred Reporting Items for Systematic reviews and Meta-Analyses (PRISMA) guidelines.
Quality Appraisal
We evaluated 36 studies according to the WWC standards 4.0 (What Works Clearinghouse [WWC], 2017). We intentionally did not adopt the latest WWC standards (WWC, 2022) because several concerns have been raised regarding their methodological suitability and applicability. Specifically, the newer standards have been criticized for minimizing the role of visual analysis, relying only on fixed-effect and design-comparable effect-size estimates (i.e., between-case standardized mean difference [BC-SMD]) with limited applicability and imposing unrealistic values for SCEDs research (Kratochwill et al., 2021, 2023; Maggin et al., 2022). Furthermore, requirements such as a minimum of six baseline data points cannot be retroactively applied to previous studies. Given these limitations, and consistent with recent SCEDs meta-analyses that continued to use previous WWC standards (e.g., Aydin et al., 2025; Sulu et al., 2026; Tekin-Iftar et al., 2023), we chose Standard 4.0 with a scoring system (adapted from Hong et al., 2016 & Maggin et al., 2013) to ensure methodological rigor, fairness, and comparability across the evaluations of the included studies. The adapted version of the WWC assess quality of the design standards (DSs) of SCEDs, focusing on (a) systematic manipulation of IVs (DS1), (b) interrater reliability (DSs 2A, 2B, and 2C), (c) three demonstrations of the effect of the IV (DS3), and (d) an adequate number of data points for baseline and intervention phases (DS4). Detailed explanations of the scoring criteria are provided in Table S1 of the Supplemental Materials. For similar evaluations using WWC standards, readers can refer to studies conducted by Hong et al. (2016), Neely et al. (2016, 2018), Aydin et al. (2025), and Sulu et al. (2022, 2026). According to the protocol, studies received a score of “2” and were classified as “meet standards” if all criteria were fully satisfied. Studies scored as “meet standards with reservations” if at least one DS was rated “1,” where the maximum score was “2.” A score of “0” indicated that at least one DS was rated “0,” meaning the study did not meet standards. The first and second authors (who have experience in WWC coding with the scoring system from their previous research) independently scored all included studies based on the WWC standards. After ensuring consistency in scoring, 26 out of the 36 studies with overall Scores 1 and 2 were retained for further analyses (see Supplementary Figure S2).
Descriptive Coding
We coded the included 26 studies according to the following descriptive variables: (a) participant characteristics, including educator role, teaching level, sex, age, experience year, and education level; (b) settings; (c) dependent variables (DVs); (d) IVs and components of IVs; (e) research design and mastery criteria for educators; (f) procedural fidelity for applying self-management strategy by educators; (g) data for social validity, generalization, and maintenance; and (h) if available from studies, student data including gender, age, disability type, targeted skills, data for outcomes and findings. The first and second authors coded all studies according to these variables.
Single-Case Data Extraction
We used the PlotDigitizer to digitize raw data from the included single-case graphs. This tool is a free, highly reliable, and valid program for extracting data from graphs (Aydin & Yassikaya, 2022; Huwaldt & Steinhorst, 2020). In the present study, to calculate the effect size of the interventions, we digitized data on self-management strategies from both the baseline and intervention phases. After data extractions, we transferred the digitized raw data to the Numbers documents (MacOS files). To calculate effect sizes with more reliability and validity, as suggested by Aydin and Yassikaya (2022), the extracted raw data were rounded to the nearest integer value by looking at each graph, as most of them were digitized in decimal values. The second author digitized raw data from all included single-case graphs (n = 127) derived from the 26 studies. To ensure the reliability of this stage, the first author also digitized the related single-case graphs (n = 55) derived from eight (31%) randomly selected studies out of 26. After completing this task, we moved on to the effect-size calculations.
Effect Sizes
There are several techniques for calculating the effect sizes of SCEDs; among these techniques, we calculated the magnitude of effect sizes of self-management strategies using Tau-U (Parker et al., 2011), performance criteria-based effect size measurements (PCES; Aydin & Tanious, 2022), and BC-SMD (Pustejovsky et al., 2014). We selected the first two methods because they control for therapeutic baseline trends on the dependent variable. We also preferred the BC-SMD to provide a more contemporary perspective on the effect-size measurements, as recommended by the WWC (2022) 5.0 version. Specifically, Tau-U is a non-overlap-based method that calculates effect-size indices by contrasting each data point between the baseline and intervention phases. Although Tau-U has several limitations, including yielding high effect-size indices when there is no overlap between the baseline and intervention phases, even with only a minimal improvement in behavior during the intervention phase, Tau-U was retained in the study for comparison with the other two effect-size values. The PCES, in contrast, is a mean-based method that requires a performance criterion (i.e., mastery criterion) set in the studies to calculate the effect sizes of interventions. The PCES can determine the magnitude of the intervention’s effectiveness, taking into account the behavior change that occurs at a socially meaningful level through the intervention. This feature distinguishes it from non-overlap and other techniques (Aydin & Tanious, 2022). Alternatively, the BC-SMD is considered a “design-comparable” effect size that allows comparisons between effect-size values derived from group experimental and SCED studies (i.e., Cohen’s d indices). Importantly, using those three effect-size indices enables examination of intervention effects from three complementary perspectives.
To obtain the effect sizes of PCES, the averages of the baseline and intervention phases are calculated. The required progress in behavior through intervention is obtained by subtracting the performance criterion from the baseline average. After introducing the intervention, the average change in behavior via the intervention is divided by the required amount of change, and thus, the PCES value is obtained. As for controlling baseline trends, Tau-U calculations (Tau-U baseline correction [Tau-UBc]) correct the baseline trend with the Theil–Sen regression if there is a contrast of 0.40 or above among baseline data (cf. Brossart et al., 2018; Parker et al., 2011); on the contrary, PCES calculations (PCEStrend) correct the baseline trend with the split-middle method if there is a visually noticeable linear trend in terms of the split-middle method (cf. Aydin & Tanious, 2022).
In effect-size calculations, we obtained Tau-U or Tau-UBc and BC-SMD values through web-based calculation engines (http://singlecaseresearch.org/calculators/tau-u; https://jepusto.shinyapps.io/scdhlm, respectively). However, we calculated PCES and PCEStrend values twice to verify accuracy using Excel, following the formulae provided by Aydin and Tanious (2022). Moreover, we calculated the weighted average Tau-U/Tau-UBc, PCES/PCEStrend, and BC-SMD values to estimate the aggregated effect of the studies and moderators. We used the web-based calculators to generate weighted averages for Tau-U and BC-SMD values, whereas, as explained in the Aydin et al. (2025) study, we used Equation 1 in Excel to obtain weighted average PCES values for individual and overall results of the included studies:

where N is the number of the included A-B phases in the study for individual study results; number of the included studies for overall results; ki is the number of data points in the A-Bi for individual study results; number of PCES values in the studyi for overall results (i.e., number of A-B phases included for PCES calculations in the studyi); and PCESi is the PCES value for the A-Bi for individual study results; weighted average PCES value in the studyi for overall results.
Tau-U and BC-SMD calculations also yield confidence intervals (CIs) for effect sizes in web-based calculation engines. However, Aydin and Tanious (2022) did not address the CI equation for PCES values. In the present study, we used the following formulae to obtain CI values of PCES by integrating these equations into Excel:

where N is the number of the included A-B phases, z-score is the confidence level (i.e., 1.96 for 95% CI), and σ is the standard deviation of PCES values. To calculate σ, we used the following equation:
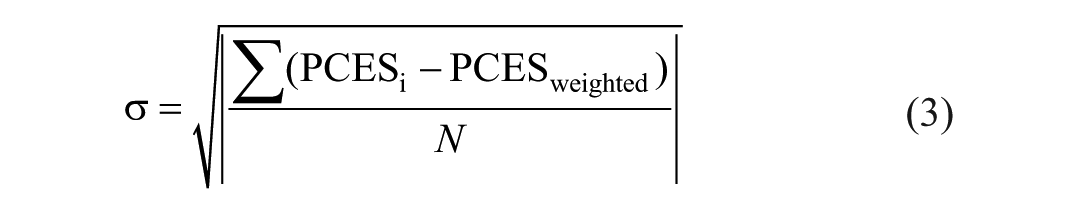
where PCESi is the each individual PCES value of the included A-B phases, and N is the number of the included A-B phases. We used 95% CI (CI95) to determine the intervals of PCES, Tau-U, and BC-SMD values. The narrower the interval of CI95 is, the more precise the effect size is; otherwise, the precision of the effect size is weakened. Forest plot graphs were created to show the precision of effect-size values. The first author calculated all intervention effect sizes following the above-mentioned instructions and formulae. He used Excel to calculate PCES values and utilized the web-based engines to obtain Tau-U (Vannest et al., 2016) and BC-SMD (Pustejovsky et al., 2023). The first author also created the forest plot graphs.
We considered the following benchmarks to interpret the effect sizes of self-management strategies to enhance educators’ competencies. We evaluated Tau-U values as small for ≤.20, moderate/medium from .21 to .60, large from .61 to .80, and very large from .81 or above (Vannest & Ninci, 2015). If more PCES values included detrending calculations, then we interpreted PCES values as ineffective for ≤.39, very small effect from .40 to .60, small effect from .61 to .84, moderate effect from .85 to 1.01, effective from 1.02 to 1.16, high effect for ≥1.17; otherwise, we interpreted PCEStrend values as ineffective for ≤0.20, very small effect from .21 to .39, small effect from .40 to .67, moderate effect from .68 to .91, effective from .92 to 1.11, and high effect for ≥ 1.12 (Aydin & Tanious, 2022). As for interpreting BC-SMD values, we followed the benchmarks established by Cohen (1988). We interpreted BC-SMD effect-size values as small for ≤.29, medium from .30 to .79, and large for ≥.80.
Moderator Analyses
Moderator analyses for the meta-analysis studies could help uncover the boundaries of interventions by evaluating variables such as independent and dependent variables separately in a categorical unit (Dowdy et al., 2021). The moderators of the included studies were determined in terms of the salient variables. We identified the salient variables in accordance with the descriptive coding of the included articles. As a result, we separated the study moderators into four categories with a consensus among the study researchers: IV categories, dependent variable categories, educator, and experience year categories.
Intercoder Reliability
We calculated the intercoder reliability for the following six processes: (1) search procedure, (2) evaluations for inclusion criteria, (3) quality appraisal according to WWC standards for SCEDs, (4) descriptive codings, (5) data extraction, and (6) categorizing moderators. The percentage of intercoder agreements was calculated using a point-by-point method; the number of agreements was divided by the total number of agreements plus disagreements and multiplied by 100. The first and second authors performed the database search procedure independently, and the reliability was 100%. As for the evaluations by inclusion criteria, the second author reviewed all studies, whereas the first author reviewed about 28% (n = 901) of the studies in Rayyan. The intercoder reliability between the two coders in this process was 99.1%. Disagreements (n = 9) were discussed, and consensus was achieved.
The first and second authors independently scored 36 studies that met the inclusion criteria using WWC standards. The first and second authors calculated intercoder reliability at 98.3%. After discussing all inconsistencies, the two coders reached full agreement. The first and second authors also performed descriptive coding on all 26 studies that met WWC standards. Descriptive coding yielded a reliability of 97.3%. The two coders discussed and resolved all inconsistencies and reached consensus. To evaluate data extraction reliability, the second author digitized all included graphs (n = 127) across 26 studies, whereas the first author extracted raw data from 43% (n = 55) of the graphs obtained from eight studies. Using a ±1-unit deviation between coders for each data point as the criterion for agreement, the reliability analysis indicated approximately 100% agreement. The first and second authors also independently classified moderator categories for all studies, achieving 100% interrater agreement.
Results
Quality Assessments
We evaluated 36 studies included in the present analysis according to WWC standards, with detailed results provided in Table S2 of the Supplementary Material. Figure S2 in the Supplementary Material further illustrates the distribution of WWC scores assigned to the 36 studies. Seven studies (19%) met the standards without reservations, whereas 19 studies (53%) met the standards with reservations. Ten studies (28%) did not meet all of the design standards. All studies met DS1; however, variability emerged for the remaining standards. For the remaining standards, specifically, five studies (e.g., Browder et al., 1986; Gerald et al., 2019) did not meet DS2B; nine studies (e.g., Kalis et al., 2007; Yates, 1982) did not meet DS3; and two studies (Workman et al., 1982; Yates, 1982) did not meet DS4. In cases in which multiple standards were not met, two studies (Gerald et al., 2019; Hager, 2012) did not meet DS2B and DS3, one study (Vannest et al., 2010) did not meet DS2A, DS2B, DS2C, and DS3, one study (Workman et al., 1982) did not meet DS3 and DS4, and another study (Yates, 1982) did not meet DS2B, DS3, and DS4.
Descriptive Analysis
We descriptively analyzed the included studies (n = 26), focusing on the characteristics of educators, interventions, and students with disabilities. We organized the data into a descriptive table and conducted percentage and frequency analyses. The primary and ancillary descriptive characteristics of the included studies are presented in Tables S3a and S3b of the Supplementary Material, respectively.
Educator Characteristics
We analyzed educators’ characteristics using the following variables: educator role, teaching level, sex, age, years of experience, and education level.
Educator Role
The studies reviewed (n = 26) included a total of 91 educators. Of these, 45% (n = 41) were special education teachers, 32% (n = 29) were paraeducators, 8% (n = 7) were preschool teachers, another 8% (n = 7) were trainee special education teachers, 3% (n = 3) were care supervisors, 3% (n = 3) were Turkish language teachers (Kiyak & Tekin-Iftar, 2022), and 1% (n = 1) was a mentor teacher.
Teaching Level
Of the 91 educators included, 86% (n = 78) provided information on the educational level at which they taught. Of the 78, 49% (n = 38) worked at the preschool level, 44% (n = 34) at the elementary level, 4% (n = 3) at the postsecondary level, 3% (n = 2) at the high school level, and 1% (n = 1) at the middle school level.
Sex
Gender information was provided by 81% (n = 74) of educators, with 93% (n = 69) identifying as female and 7% (n = 5) as male.
Age
In total, 42% (n = 42) of educators reported their age, which ranged from 20 to 57 years, with a mean of 36. Among these educators, 40% (n = 15) were between 20 and 29 years, 26% (n = 10) were between 30 and 39 years, 21% (n = 8) were between 40 and 49 years, and 13% (n = 5) were between 50 and 57 years.
Experience Year
Professional experience was reported for 70% of educators (n = 64), with years of experience ranging from 0 to 30; educators at the beginning of their careers were classified as having zero years of experience. Professional experience data were not available for the remaining educators (n = 27). We categorized educators’ years of experience using Huberman’s (1989) framework (0–3, 4–6, 7–18, and 19+). Within these categories, 36% (n = 23) had 0–3 years of experience, 33% (n = 21) had 7–18 years of experience, 22% (n = 14) had 4–6 years of experience, and 9% (n = 6) had 19–30 years of experience.
Education Level
The educational levels were reported for 76% (n = 69) of educators: 39% (n = 27) held a bachelor’s degree, 33% (n = 23) held a master’s degree, 10% (n = 7) were high school graduates, and 7% (n = 5) held an associate degree. In addition, 10% (n = 6) of the educators were undergraduate students.
Intervention Characteristics
We descriptively analyzed the characteristics of interventions across several key dimensions: settings, independent and dependent variables, research designs, mastery criteria for educators, teaching behaviors of educators, social validity, generalization, and maintenance.
Settings
In total, 73% of the studies (n = 21) were conducted in therapeutic rooms, with two additional studies taking place in therapy settings. The other environments were used in only one study each: a specialized classroom (Belfiore et al., 2008), a school counselor’s office or library (Kiyak & Tekin-Iftar, 2022), and a playground (Martin et al., 2015). One study was conducted in both the classroom environment and the computer laboratory (Zhang, 2015), whereas another took place in a separate room (Pelletier et al., 2010).
Independent Variables
The studies employed two self-management strategies as IVs: self-monitoring and self-evaluation. Self-monitoring, defined as educators observing their own implementation and recording whether the steps of the targeted teaching behaviors occurred using a checklist, was used in 89% of the studies (n = 23). Of these studies, 35% (n = 8) used self-monitoring as a standalone strategy, whereas 65% (n = 15) combined it with other interventions such as self-evaluation, performance feedback, coaching, workshops, modeling, and peer monitoring. Self-evaluation, defined as educators’ rating the accuracy of their own performance against predetermined criteria for the steps of teaching behaviors, was implemented in 23% of the studies (n = 6), with only one study using it independently. In the remaining studies, self-evaluation was combined with self-monitoring, performance feedback, modeling, and role-playing interventions.
Dependent Variables
Behavior-specific praise was the dependent variable in 31% of the studies (n = 8) and discrete-trial instruction in 19% (n = 5). The remaining studies (50%, n = 13) each examined one of the following as dependent variables: responding to students’ requests, embedding instructional learning trials, improving instructional decision-making, implementing a naturalistic developmental behavioral intervention, teaching students to use self-monitoring, the implementation of advanced direction instruction reading techniques, the simultaneous prompting procedure, instructional interactions with target children, the application of individualized behavior intervention plans, data collection methods, management of disruptive behaviors, prompting of appropriate behaviors, behavior support plans, functional communication training, and noncontingent attention preference assessments.
Research Designs
Of the studies reviewed, 69% (n = 18) utilized multiple baseline designs, whereas 27% (n = 7) implemented multiple probe designs. Additionally, one study combined multiple baseline and alternating treatment designs.
Mastery Criterion (Performance Criterion) for Educators
Half of the studies reported mastery criteria. Of these, 31% defined mastery as at least two to five consecutive data points at 90% accuracy, whereas 23% used at least three consecutive data points at 80% accuracy. The remaining studies each reported a unique mastery criterion, including at least three consecutive data points at 100% accuracy, a minimum increase of 25% across five consecutive data points from baseline, two praise statements per one feedback statement, 12 or more BSP statements across three consecutive days, 20% of intervals, twice per minute for one behavior, and once per minute for two behaviors.
Procedural Fidelity
Of the studies reviewed, 77% (n = 20) reported procedural fidelity data, with reliability ranging from 80% to 100%. In these studies, researchers assessed procedural fidelity for at least 20% of the data and applied a minimum reliability criterion of 80%. Note that procedural fidelity refers to the extent to which researchers implemented the training components as planned when teaching educators to use self-management strategies.
Social Validity, Generalization, and Maintenance
Most studies (73%, n = 19) collected social validity data; however, a smaller number (23%, n = 6) collected generalization data. Among those focusing on generalization, three studies collected data across stimuli, whereas others focused individually on across-response, across-setting, or across-participants measures. Maintenance data were reported in 69% of the studies (n = 18), encompassing 58 participants. These data were collected from immediately after the instructional intervention to 12 weeks later, most often within 1 to 2 weeks post-intervention. The number of data points per participant varied from 1 to 27, with an average of four data points. Only a single maintenance data point was collected for a significant portion of participants (n = 17).
Student Characteristics
Of the studies reviewed, 89% (n = 23) described specific characteristics of the children with whom educators worked. Data on the number of children were provided in 21 studies, whereas the number of participants in two studies remained unspecified. We conducted descriptive analyses based on 122 children from 21 studies and presented characteristics from the two studies with unspecified participant numbers as additional information. Although some studies did not specify the children’s ages, they provided data on educational levels, which allowed for age-related inferences. This information was categorized by age and included as supplementary information in the analyses.
Student Genders, Ages, and Diagnoses
Of the studies reviewed, 54% (n = 14) provided information on the gender of the children (n = 58) who received interventions using self-management strategies. Among these children, 17% (n = 10) were female, whereas 83% (n = 48) were male. In addition, 42% of the studies (n = 11) specified individual ages for 36 children, ranging from 2 to 16 years. In contrast, seven studies (27%) reported either an overall age range or general school-level information for all participating children. Children’s diagnoses were reported as follows: 52 children with autism spectrum disorder, 18 children with emotional and behavioral disorders, eight children with intellectual disability, five children with speech and language disorders, four children with other health impairments, three children with learning disabilities, three children at risk, two children with multiple disabilities, two children with developmental disabilities, and one child with Down syndrome.
Skills, Outcomes, and Findings
In total, 85% (n = 22) of the studies targeted skills taught to students; half addressed student behavioral regulation or management (n = 11). In addition, 36% (n = 8) addressed academic skills, 14% (n = 3) studied language and communication skills, and 5% (n = 1) focused on life skills. In 27% (n = 7) of the studies, positive outcomes were reported for all participants and across all skills. In 31% of the studies (n = 8), some participants or skills showed positive outcomes, whereas others exhibited neutral results. One study reported both positive and negative findings (McCollow, 2013), whereas another presented data on students that included both positive, negative, and neutral outcomes (Mouzakitis et al., 2015).
Effect-Size Calculations
We calculated effect sizes for 26 studies using Tau-U and for 25 using BC-SMD; however, we calculated effect sizes for only 13 studies using PCES because these studies used a mastery criterion. Table S4 in the Supplementary Material shows the calculations of Tau-U values. Tau-U was calculated for 127 A-B phases gathered from 26 studies. The weighted Tau-U values for individual studies ranged from 0.53 to 1. Two studies (Bishop et al., 2015; McCollow, 2013) had a moderate effect, the other two (de la Cruz, 2009; Gorden, 2017) had a large effect, and the remaining studies (n = 22) had very large effect sizes. The aggregated weighted Tau-U for the overall results of studies was calculated to be .88 and interpreted to have a very large effect size. Figure 1 shows the Tau-U values with CI95 ranges of the studies except for the Rispoli et al. (2023) study due to calculating the effect size for only one graph, which was thus not suitable for evaluating CIs of that effect size. Although the aggregated weighted Tau-U value (0.88; CI95 = [0.74, 1]) resulted in a more precise effect size, most individual studies had a larger CI95 range, and thus, the precision of their weighted Tau-U effect sizes may be weak (see Supplementary Figure S2).
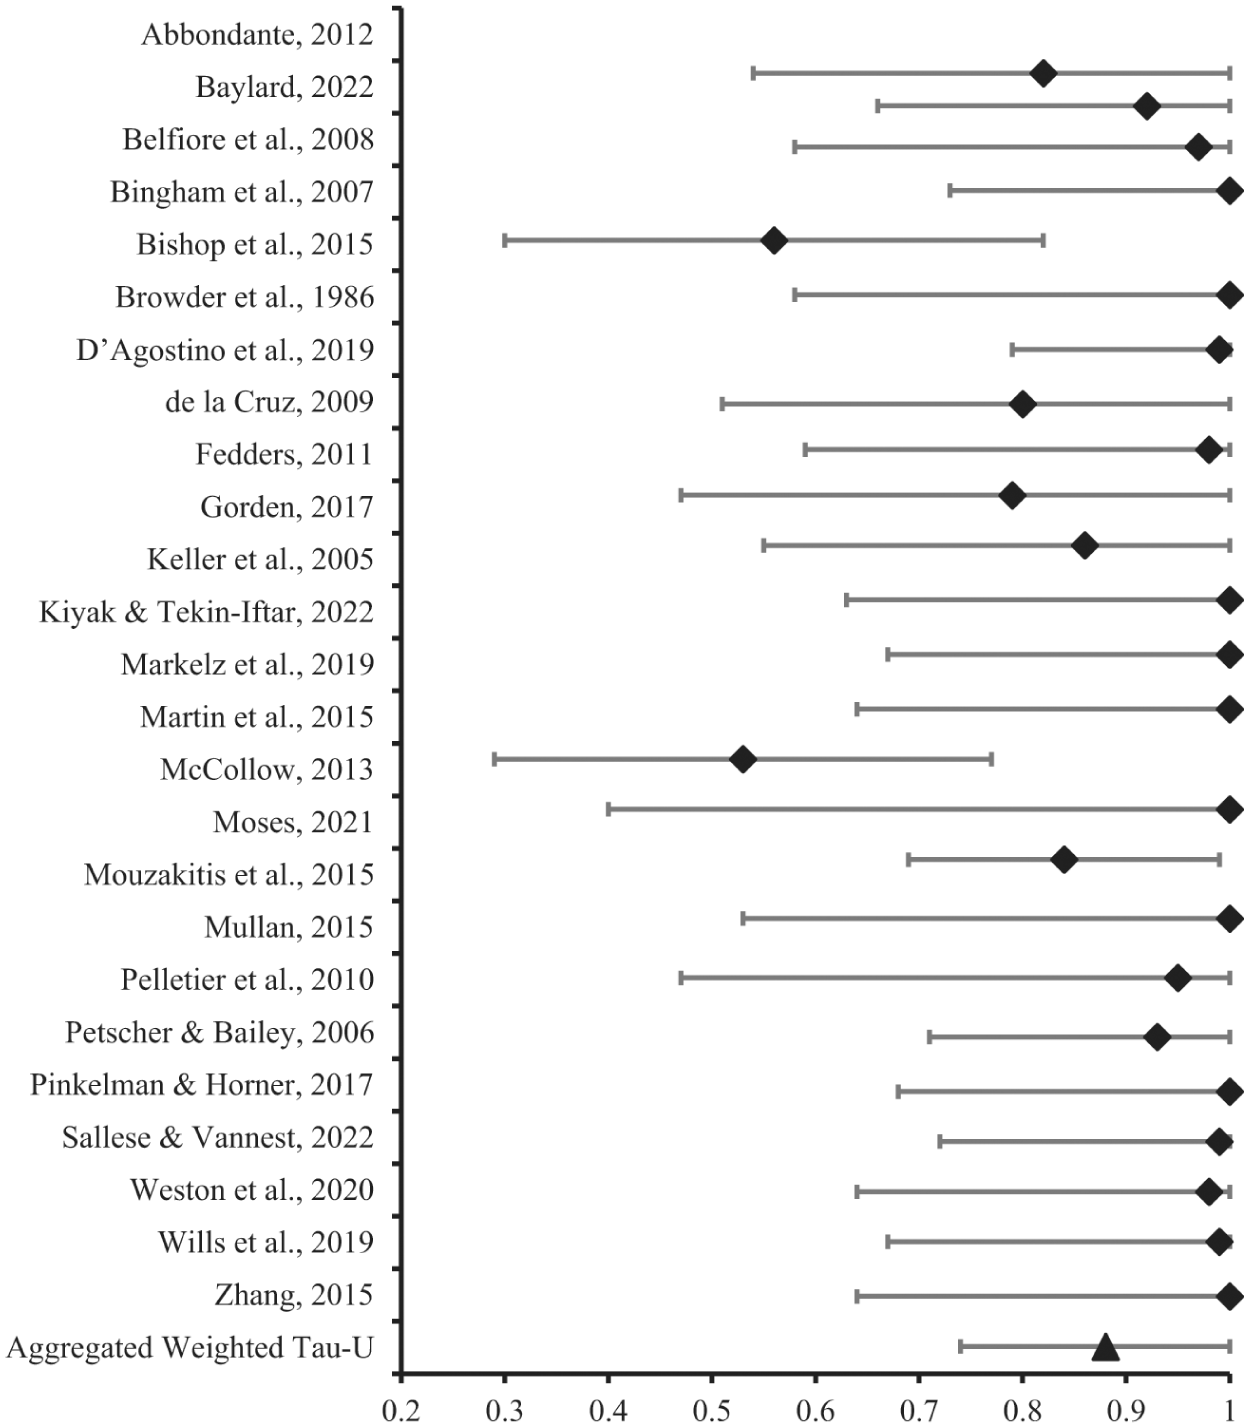
Forest plot for Tau-U values with 95% CI of individual studies.
Table S5 in the Supplementary Material shows BC-SMD values for 25 studies. The BC-SMD could not be calculated for the Rispoli et al. (2023) study because it had a single graph for the effect-size calculations. The weighted BC-SMD values for individual studies ranged from 0.05 to 111.49. One study (de la Cruz, 2009) had a small effect, three studies had a medium effect, and the remaining studies (n = 22) had large effect sizes. The aggregated weighted BC-SMD for the overall results of studies was calculated to be 0.87 and interpreted as having a large effect size. A forest plot was not shown for BC-SMD values with CI95 ranges because there were huge gaps among the effect-size values and CIs. This issue was distorting the image of the forest plot graph. However, the precision of the BC-SMD effect sizes can be found from the CI95 ranges presented in Supplementary Table S5. As in Tau-U analyses, the aggregated BC-SMD value (0.87; CI95 = [0.77, 0.98]) resulted in a more precise effect size, whereas most individual studies had a larger CI95 range, indicating their precision may be weak.
Table S6 in the Supplementary Material shows PCES values calculated for 58 A-B phases of 13 studies. The weighted PCES values for individual studies ranged from 0.37 to 1.91. There were two “very small effect,” one “small effect,” three “moderate effect,” two “effective,” and five “high effect.” The aggregated weighted PCES was calculated to be 1.15 and interpreted to be “effective” on the overall results of 13 studies. Figure S3 in the Supplementary Material shows PCES values with CI95 ranges of the studies. The PCES CI95 ranges were narrower than those of Tau-U and BC-SMD when considering no limits for PCES calculations. Even though this provides a clear inference regarding the precision of the calculated PCES values and offers greater confidence than Tau-U and BC-SMD, two studies (Martin et al., 2015; Mouzakitis et al., 2015) had a larger CI95 range than others, and thus, the precision of their weighted PCES values may be weak (see Supplementary Figure S3). In the calculations of effect sizes, Tau-UBc was calculated for only five (4%) of 127 A-B phases (see Supplementary Table S4), whereas PCEStrend was calculated for only six (10%) of 58 A-B phases (see Supplementary Table S6). As noted in the Method section, Tau-UBc was used only when the baseline contrast exceeded 0.40, whereas PCEStrend was applied only when a linear trend was visually detected using the split-middle method.
Moderator Analyses
Table 1 shows the moderators of the included studies. The IV categories encompassed all studies. However, within the dependent variable categories, half of the included studies (n = 13) could not be inserted in any subcategory as they consisted of different dependent variables that could not be categorized (see Table S3a in the Supplementary Material). Educators were categorized into four groups (excluding care supervisors and a mentor teacher in two studies): core subject teachers, special education teachers, paraeducators, and trainee special education teachers. In addition, six studies did not report educators’ years of experience, and one study (Mouzakitis et al., 2015) consisted of complexity for years of experience. Therefore, the total number of A-B phases included in the experience-year categories was 85 across 19 studies.
Moderator Analyses of the Included Studies.
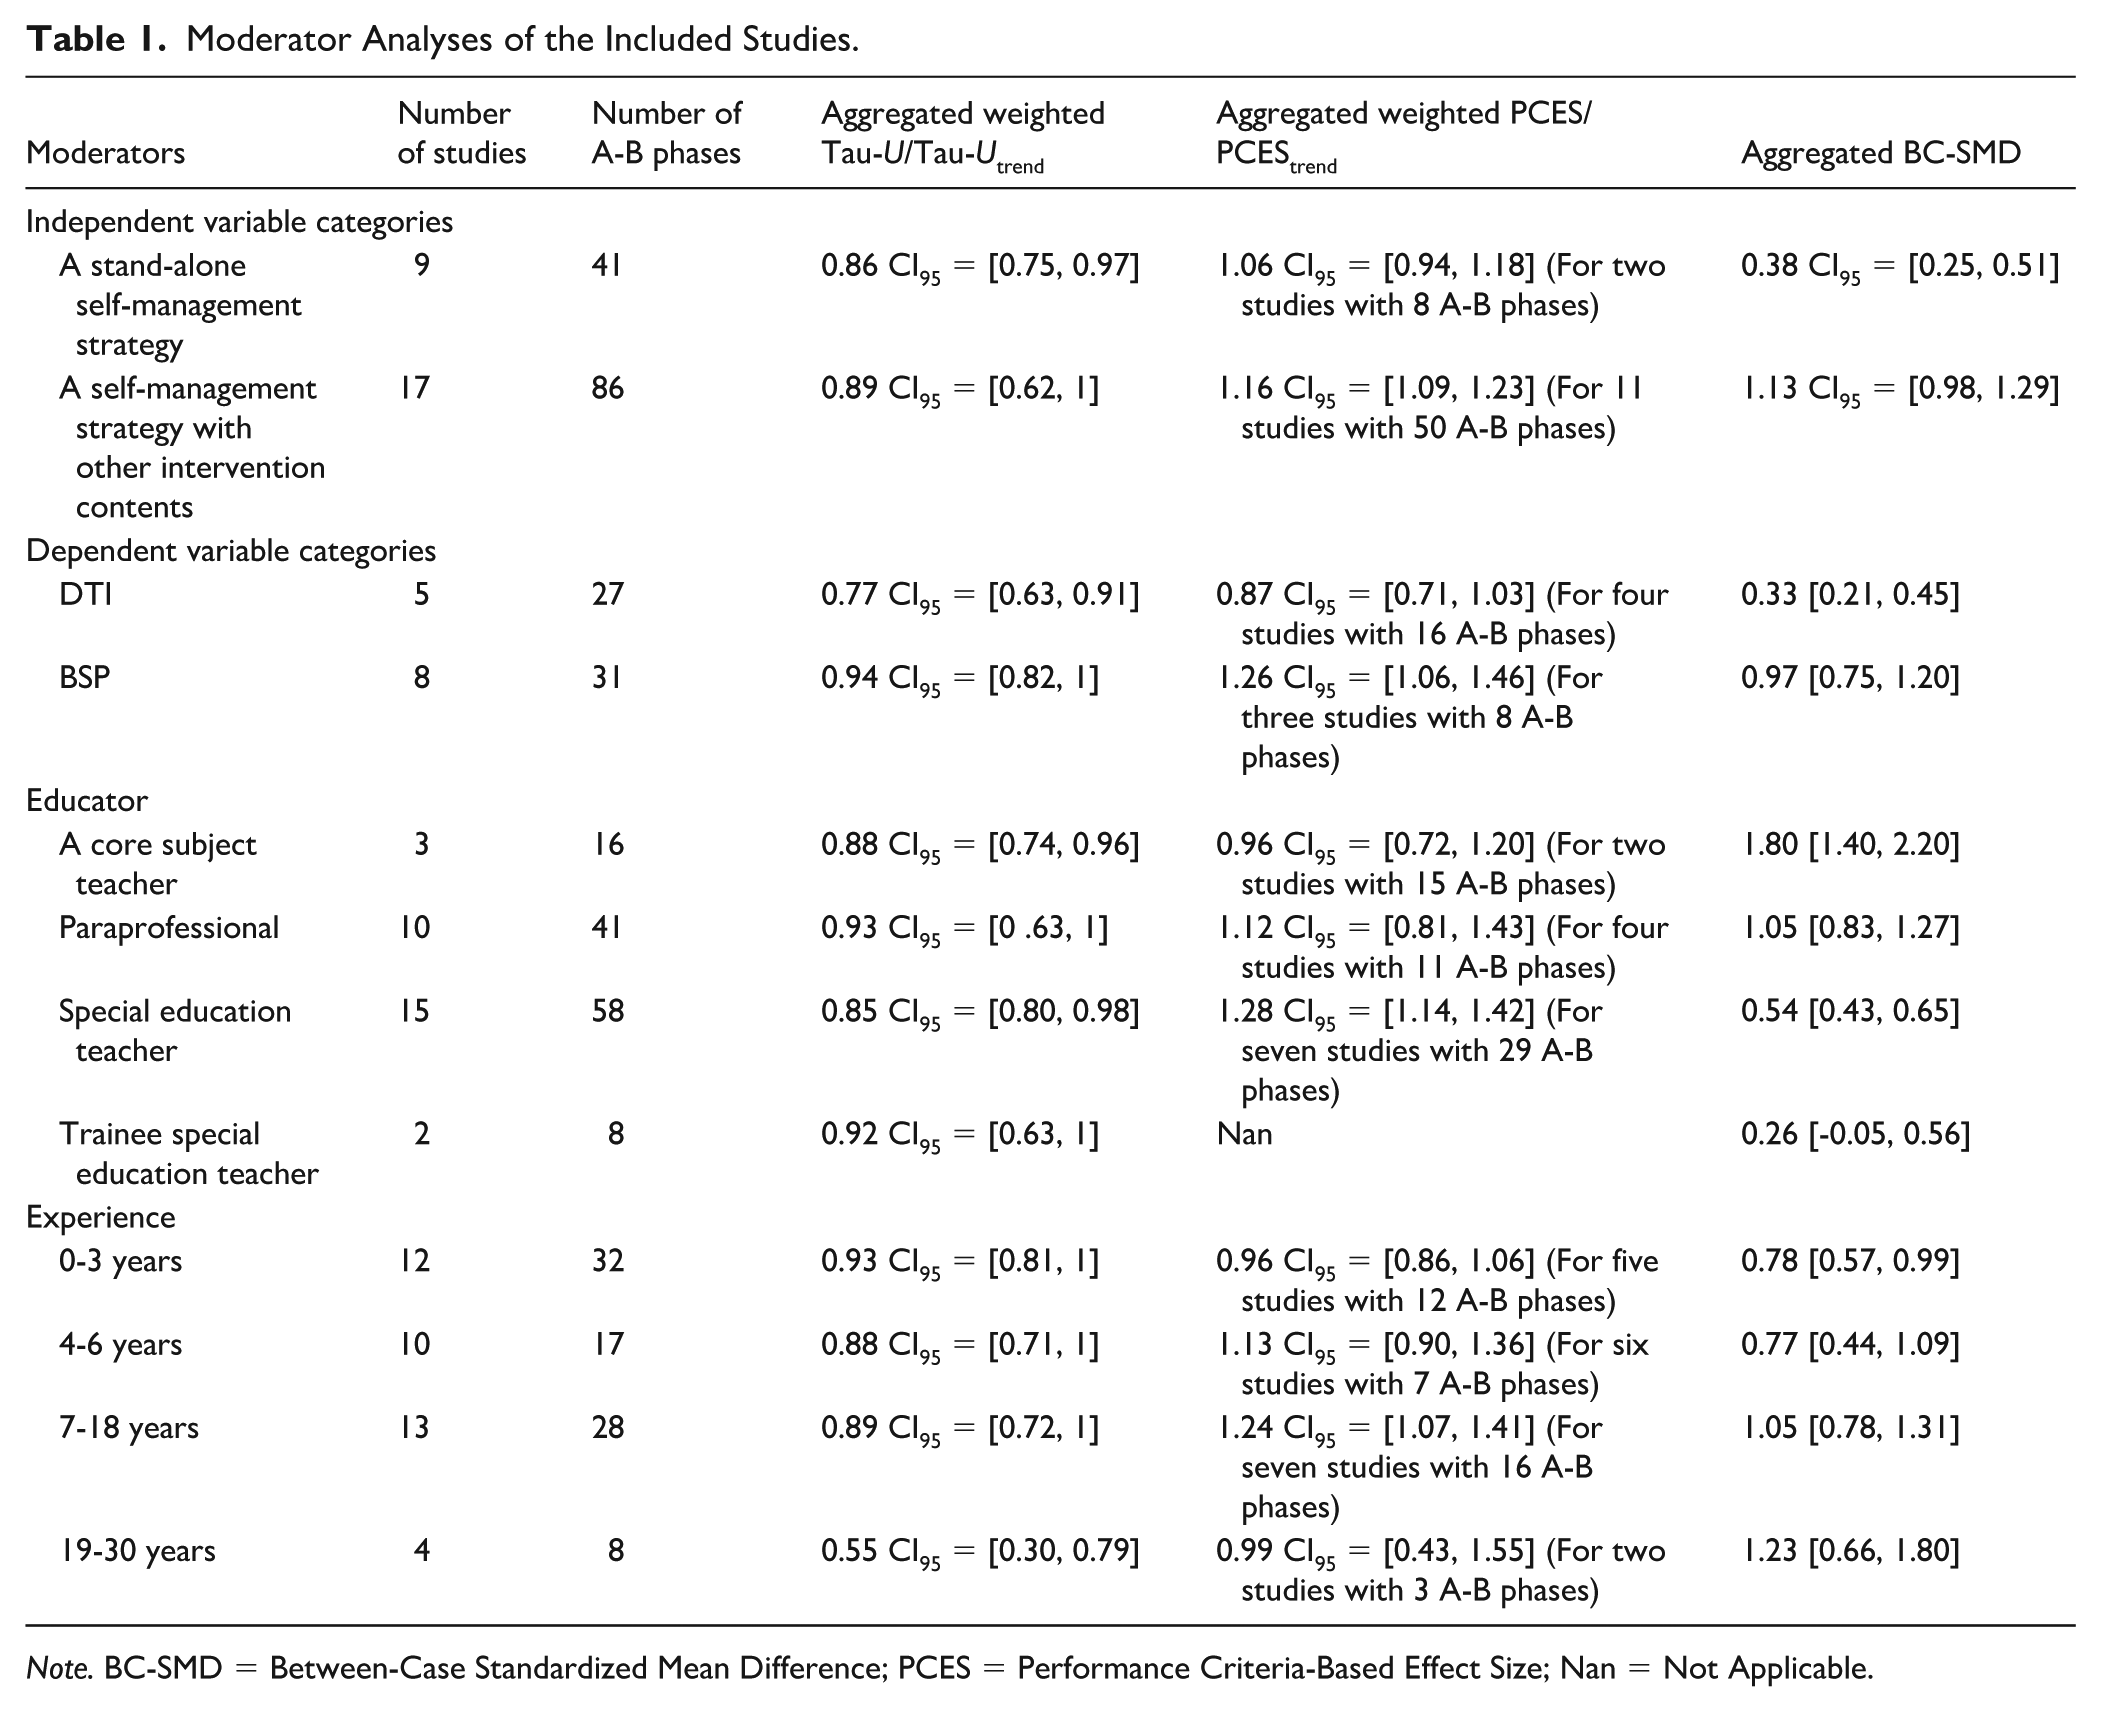
Note. BC-SMD = Between-Case Standardized Mean Difference; PCES = Performance Criteria-Based Effect Size; Nan = Not Applicable.
Considering IV categories, nine studies used a stand-alone self-management strategy for the educators’ competencies, which resulted in a Tau-U effect size of 0.86 CI95 = [0.75, 0.97], which is interpreted as a very large effect, a BC-SMD effect size of 0.38 CI95 = [0.25, 0.51], interpreted as a medium effect, and a PCES effect size of 1.06 CI95 = [0.94, 1.18], which is interpreted as effective. If a self-management strategy was used with another intervention content (n = 17 studies), the effect-size values resulted in 0.89 CI95 = [0.62, 1] for Tau-U, 1.13 CI95 = [0.98, 1.29] for BC-SMD, and 1.16 CI95 = [1.09, 1.23] for PCES, which they were interpreted as a very large effect, large, and effective, respectively.
Upon considering the dependent variable categories, the accuracy of the use of discrete-trial instruction by educators via self-management strategies resulted in 0.77 CI95 = [0.63, 0.91] for Tau-U with a large effect size, 0.33 CI95 = [0.21, 0.45] for BC-SMD with a medium effect, and 0.87 CI95 = [0.71, 1.03] for PCES with a moderate effect. On the contrary, the fidelity of the usage of BSP resulted in 0.94 CI95 = [0.82, 1] for Tau-U with a very large effect, 0.97 CI95 = [0.75, 1.20] for BC-SMD with a medium effect, and 1.26 CI95 = [1.06, 1.46] for PCES with a high effect. As for educator categories, all four subcategories yielded a very large effect in the Tau-U analyses. According to BC-SMD values, self-management strategies for core subject teachers and paraeducators had large effect sizes, whereas special education teachers had a medium effect size, and trainees had a small effect size. Based on PCES values, special education teachers demonstrated higher performance than other educator groups, resulting in a high effect size (see Table 1). In contrast, core content teachers had a moderate effect size according to PCES calculations, whereas paraeducators had an effective effect size in performing an intervention through self-management strategies. Across experience year categories, between 0 and 18 years of experience resulted in a very large effect size for Tau-U analyses, but 19–30 years of experience yielded a moderate effect. Upon considering BC-SMD values across the experience year categories, those 6 years and below had medium effect sizes, whereas those 7 years and above had large effect sizes. On the contrary, PCES values resulted in a high effect for 7–18 years of experience, a moderate effect for 0–3 and 19–30 years, and effective for 4–6 years (see Table 1). Effect sizes for moderator analyses should be interpreted alongside their 95% CIs, as reported in Table 1, to evaluate the precision of these estimates.
Discussion
The present study included peer-reviewed articles and gray literature that utilized self-management strategies to enhance educators’ teaching performance using SCEDs methodology, with no time restrictions applied. Thirty-six studies met the inclusion criteria, with the oldest dating back to the 1980s. Of these, 26 studies met the WWC (2017) DSs with or without reservations and were included in further analyses (see Supplementary Figure S1). The present analysis had three primary objectives for the 26 studies: (a) to define the characteristics of self-management strategies in improving educators’ teaching performance, (b) to quantify the effect sizes of these studies using three different methods (i.e., Tau-U, BC-SMD, and PCES), and (c) to investigate whether salient variables influenced the effect sizes on teaching performance of educators.
The present study revealed self-monitoring emerged as the most frequently employed self-management strategy. The majority of the studies focused on teachers working in special education classrooms with varying levels of experience. Self-monitoring strategies were primarily employed as a tool to ensure teaching behaviors of educators, often to increase rates of BSP or the frequency of intervention implementation. The multiple baseline design was the most frequently used SCED, although only half of the studies (n = 13) reported a mastery criterion. All studies demonstrated improvements in educators’ teaching performance, and 13 of the 26 studies also collected student outcome data to evaluate intervention efficacy, with results generally indicating positive effects on student learning. The findings from the three effect-size methods showed slight differences. For the 26 studies, Tau-U indicated an overall very large effect size of .88 CI95 = [0.74, 1], and the overall effect size of BC-SMD showed a large effect size of .87 CI95 = [.77, .98]. In comparison, PCES values showed an overall effective effect size of 1.15 CI95 = [1.07, 1.23] for the 13 studies reporting mastery criteria. Despite the relatively narrow focus of self-management strategies and the absence of mastery criteria in half of the included studies, these interventions show promise according to all three effect-size methods. A detailed analysis of these findings is presented below.
First, self-monitoring emerged as the most frequently used self-management strategy in the literature. Our findings align with the literature on self-management strategies for educators (e.g., Ennis et al., 2020b; Rispoli et al., 2017; Zoder-Martell et al., 2019) as well as for students (e.g., Sulu et al., 2022). Among the 26 studies, 23 incorporated self-monitoring, either as a sole intervention or as a component of a broader intervention package. However, self-management includes several other strategies (e.g., self-reinforcement, self-evaluation) and tactics (e.g., performance feedback, tactile prompting) that the researchers should explore beyond self-monitoring (Cooper et al., 2020). For example, D’Agostino et al. (2020) examined educators’ implementation of naturalistic developmental behavioral interventions via telehealth training and demonstrated how self-monitoring with performance feedback contributed to effective implementation. Similarly, Markelz et al. (2019) found combining self-monitoring with tactile prompting increased teachers’ use of BSP in classroom settings. In addition, Keller et al. (2005) demonstrated self-evaluation alone enhanced trainee special education teachers’ use of specific praise. Collectively, a range of self-management strategies and tactics, rather than an exclusive focus on self-monitoring, can enhance educators’ instructional practices by promoting self-regulation, ongoing feedback, and adaptive teaching behaviors, ultimately improving professional performance across diverse educational settings. Although these strategies, either alone or in combination with specific tactics, have demonstrated promising effects, they have been examined in only a limited number of studies. Accordingly, further research is needed to move beyond the predominant focus on self-monitoring and to systematically evaluate these underrepresented variables, thereby strengthening the evidence base for educators’ teaching performance outcomes.
Although self-monitoring strategies have been predominantly used in the literature, Rispoli et al. (2017) indicated that self-monitoring has primarily been applied to increase teacher praise, representing a relatively narrow application. They emphasized the importance of expanding the use of self-monitoring to target a broader range of teaching practices and behavioral interventions. Our findings align with the review of Rispoli et al. The majority of the included studies focused on educators’ praising rate (e.g., Keller et al., 2005; Moses, 2021) or discrete-trial instruction (e.g., Mullan, 2015) and were conducted in special education classrooms. To accumulate sufficient evidence across diverse instructional contexts and to more comprehensively advocate for the effectiveness of self-monitoring on educators’ teaching practices, future research should further investigate the use of self-monitoring across a broader range of instructional practices, such as errorless teaching methods (e.g., Kiyak & Tekin-Iftar, 2022), direct instruction (e.g., Fedders, 2011), antecedent and consequence-based instructions (e.g., Pelletier et al., 2010), functioning communication training (e.g., Rispoli et al., 2023), and preference assessments (e.g., Weston et al., 2020) and across diverse school settings, such as school library (e.g., Kiyak & Tekin-Iftar, 2022), playground (e.g., Martin et al., 2015), and computer lab (e.g., Zhang, 2015). In addition, our findings indicated self-monitoring can be used effectively with other tactics, such as performance feedback (e.g., Baylard, 2023), graphical feedback (e.g., Gorden, 2017), tactile prompting (Markelz et al., 2019), coaching (McCollow, 2013), workshops (Mullan, 2015), and behavioral skills training (e.g., Rispoli et al., 2023). Future research is needed to determine which components are most effective when paired with self-monitoring.
Self-management strategies effectively improve educator outcomes; however, evidence examining the relation between improvements in educator behavior and student behavior remains limited. Only half of the studies (n = 13) reported on the effects of educator self-management on student outcomes. For example, in the Bingham et al. (2007) study, paraeducators were trained through instruction, modeling, and role-playing to promote students’ use of AAC systems. Self-monitoring was integrated into the intervention, enabling paraeducators to record their implementation accuracy, maintain high fidelity, and ultimately improve student communication and behavior. Similarly, training educators to use self-management strategies to enhance their instructional competencies led to improvements in students’ engagement skills in classroom settings (e.g., de la Cruz, 2009; Markelz et al., 2019), academic performance (e.g., Fedders, 2011; Kiyak & Tekin-Iftar, 2022), communication skills (e.g., D’Agostino et al., 2020; Martin et al., 2015), and daily living abilities (e.g., Browder et al., 1986) for students with different disabilities, including autism spectrum disorder, intellectual disability, emotional and behavioral disorders, and other health impairments. These findings suggest as self-management strategies improve the teaching performance of educators, students with various disabilities may experience improved outcomes in many domains.
According to other descriptive findings related to student data, the authors of nine studies provided only general information about the characteristics of the students, without collecting data on student outcomes. On the contrary, two studies (i.e., Belfiore et al., 2008; Mullan, 2015) relied solely on educator outcomes with no student information or data. If the ultimate goal is to improve student outcomes by enhancing educators’ teaching performance, future studies should collect data on both educator teaching performance and the students involved in the research (Rispoli et al., 2023). In addition, student characteristics should be detailed to allow these studies to be replicated.
Another area requiring improvement is the systematic investigation of generalization. Eighteen studies collected maintenance data, often reported over relatively extended periods. However, generalization data were collected in only five studies. The limitations in generalization assessments were highlighted over 40 years ago by Stokes and Baer (1977) in the field of applied behavior analysis. Despite recent efforts to improve systematic generalization planning in the implementation of self-management strategies with students with disabilities (e.g., Sulu et al., 2026), this focus needs to be extended to educators. For example, Mouzakitis et al. (2015) collected generalization data from four teachers, three of whom successfully generalized their skills to other students with similar behavioral intervention programs. In the generalization process, researchers can collaborate with educators to plan and facilitate generalization more effectively (Mouzakitis et al., 2015).
Despite the limitations of the studies reviewed in this study, the increasing inclusion of diverse special education personnel roles strengthens the current literature. Research indicates paraeducators often receive insufficient training to support the behavioral, academic, and social needs of students with disabilities and, in some cases, no training at all (Borosh et al., 2023; Mason et al., 2021). Of the 10 studies involving paraeducators, self-management strategies demonstrated effectiveness in enhancing teaching performance. Therefore, future research should explore the use of self-management strategies to address a broader range of behavioral and academic skills with paraeducators, aides, and other school personnel who could be part of the instructional practices supporting students with disabilities. Special education teachers constituted a substantial proportion of the educators included in the reviewed studies (45%). This representation aligns with the broader literature emphasizing the importance of ongoing professional development across educational disciplines, particularly for special education teachers, whose instructional responsibilities often involve complex, individualized, and behaviorally intensive practices (e.g., Billingsley et al., 2020; Darling-Hammond et al., 2017). In this context, self-management strategies may serve as a feasible and efficient in-service support mechanism to enhance instructional fidelity and teaching performance beyond preservice preparation.
In addition to the descriptive analysis of the included studies, the effect-size analysis provided valuable insights. The overall Tau-U demonstrated a very large effect size of .88; however, the BC-SMD yielded a large effect size of .87. In contrast, the PCES indicated an overall effective effect size of 1.15 across the 13 studies reporting a mastery criterion. The slight discrepancies observed between Tau-U, BC-SMD, and PCES can be attributed to the distinct analytical approaches employed in SCEDs. The overall results of the three effect-size analyses indicated self-management strategies are effective in enhancing educators’ teaching performance. As a noticeable finding in the present study, BC-SMD resulted in 111.49 for Kiyak and Tekin-Iftar’s (2022) study. Furthermore, a total of 10 studies yielded BC-SMD values greater than 3, which weakens the credibility of BC-SMD. As discussed by Kratochwill et al. (2021, 2023) and Maggin et al. (2022), BC-SMD tends to produce unrealistic values for the effect sizes of SCEDs studies. It was also noteworthy that the majority of effect sizes of individual studies according to BC-SMD (n = 21, see Supplementary Table S5) were greater than the overall effect size of BC-SMD. Although standardizing observations from different studies has a significant impact on this result, it may also be related to the fact that BC-SMD effect-size calculations can be influenced by the number of A-B graphs included in the calculation. The BC-SMD values may tend to decrease as the number of A-B graphs increases.
Regarding moderator analysis (see Table 1), self-management strategies produced positive outcomes using Tau-U and PCES, whether employed as a stand-alone strategy or in combination with other treatment components. However, BC-SMD yielded a medium effect for stand-alone self-management interventions, whereas it resulted in a large effect for combined interventions. Educators demonstrated greater success in improving their teaching performance with BSP than with discrete-trial instruction; a difference may be attributed to the multi-step nature of the latter. Although all educator types effectively implemented interventions using self-management strategies based on Tau-U results, special education teachers showed greater improvement compared to other educators (e.g., core subject teachers) according to PCES values. In contrast, core subject teachers and paraeducators indicated more improvement in their teaching performances according to BC-SMD calculations. These discrepancies may be strongly related to the rate of non-overlapping data for Tau-U analyses, the mastery criterion levels set in the studies for PCES, and the standardization of measurements derived from different studies for BC-SMD. We found an inverse relationship between educators’ years of experience and the effect-size results of Tau-U and PCES (i.e., effect sizes were larger for educators with fewer years of experience); however, we found a positive relationship between years of experience and effect size using BC-SMD (i.e., effect sizes were larger for educators with more experience). This discrepancy in effect-size results makes the consistent interpretation of the findings difficult. However, if the inverse relationship is accurate, the enthusiasm of educators with less experience (cf., Keller et al., 2016; Kunter et al., 2011) and potential professional burnout of educators with more experience (cf., Maslach & Leiter, 2016; Skaalvik & Skaalvik, 2017) may be underlying this relationship.
Comparing patterns of effect sizes using the PCES method to patterns using Tau-U and BC-SMD methods was limited, as we encountered only 13 (50%) studies identifying mastery criteria. However, establishing mastery criteria is crucial. Behavioral analytic literature typically begins with behavioral objectives, with mastery criteria serving as a key measure of expected behavioral outcomes for educators. These criteria not only indicate the effectiveness of an intervention but also help ensure the long-term maintenance of the acquired skills (Aydin & Tanious, 2022; Kim et al., 2023). The absence of this essential component limited the scope of our meta-analysis to include only studies that defined and reported mastery criteria. Future research should prioritize the development of clear and precise mastery criteria to support skill acquisition, fluency, maintenance, and generalization (Wong & Fienup, 2022).
Limitations and Recommendations
Although the present study offers crucial contributions to the literature, it has four known basic limitations. First, the quality standards were based on the WWC 4.0 (2017) guidelines rather than the updated 2022 version. These guidelines were preferred because the current version has faced criticism for its lack of a scoring system, reduced emphasis on visual analysis, and acceptance of fixed-effect analysis (Maggin et al., 2022). In addition, recent meta-analyses investigating SCEDs (e.g., Aydin et al., 2025; Sulu et al., 2026; Tekin-Iftar et al., 2023) have continued to use WWC 4.0 (2017). Other evaluation rubrics (e.g., Aydin et al., 2019; CEC, 2014; Horner et al., 2005; Reichow et al., 2008) are also available in the literature. Future studies could assess and compare the quality of included studies using these alternative evaluation rubrics. Second, we used three different effect-size models to determine the magnitude of the effects of self-management strategies. There are many effect-size formulae for SCEDs in the literature. This diversity can be used in further research and compared with the effect-size results of this study. Third, we included only educators in school environments in the present study. However, there is substantial research related to parent educators’ teaching behaviors to their children with disabilities at home or in relevant environments (e.g., Hampshire & Allred, 2018; Ingersoll et al., 2024; Simmons et al., 2022). Future studies should examine whether parent educators’ teaching performance can be effectively enhanced through self-management strategies. Finally, although the electronic search was comprehensive, variations in terminology and the use of self-management strategies within broader intervention packages may have limited the initial retrieval of some studies. This limitation was identified because studies implementing self-management strategies in conjunction with coaching, behavioral skills training, performance feedback, or other components often did not include self-management-related terms in their titles, keywords, or abstracts. Nevertheless, supplementary manual searches and citation tracking ensured that all relevant records were systematically identified and included.
Conclusion
In summary, self-management strategies are effective in enhancing the competencies of educators working with students with disabilities. Moderator analyses suggest self-management strategies can be successfully implemented as either a component of an IV or a stand-alone intervention. Most studies focused on two dependent variables for educator practices: BSP and discrete-trial instruction, both of which were effectively improved through self-management strategies. Two notable findings emerged. First, approximately half of the participants in the included studies were special education teachers, underscoring the demand among in-service special education teachers for strategies that improve their teaching performance. Self-management strategies appear to be a promising solution to address these needs. Second, the effectiveness of training delivered through self-management strategies, as measured by Tau-U and PCES, decreased as educators’ experience levels increased; however, findings using the BC-SMD calculations indicated that the effectiveness of these strategies increased as educators’ experience levels increased. Although inconsistencies in effect-size results prevent consistent interpretation of the findings, the findings from Tau-U and PCES analyses imply that professional burnout or educator enthusiasm may play a role. Further investigation of the relationship between educator experience and the effectiveness of self-management strategies is needed.
Supplemental Material
sj-docx-1-bhd-10.1177_01987429261448214 – Supplemental material for A Meta-Analysis of Self-Management Strategies to Enhance Educators’ Teaching Performance
Supplemental material, sj-docx-1-bhd-10.1177_01987429261448214 for A Meta-Analysis of Self-Management Strategies to Enhance Educators’ Teaching Performance by Orhan Aydin, Ceren Ari-Arat and Mehmet D. Sulu in Behavioral Disorders
Footnotes
Ethical Considerations
Only published data sets were used for the analyses.
Funding
Open access funding provided by the ANKOS. The authors received no other financial support for the research, authorship, and/or publication of this article.
Declaration of Conflicting Interests
The authors declared no potential conflicts of interest with respect to the research, authorship, and/or publication of this article.
Data Availability Statement
If requested, the corresponding author can provide all documents.
Code Availability
No code.
References
Supplementary Material
Please find the following supplemental material available below.
For Open Access articles published under a Creative Commons License, all supplemental material carries the same license as the article it is associated with.
For non-Open Access articles published, all supplemental material carries a non-exclusive license, and permission requests for re-use of supplemental material or any part of supplemental material shall be sent directly to the copyright owner as specified in the copyright notice associated with the article.