
Abstract
Of late, financial inclusion has assumed a development policy priority in many countries. To consider the importance of the same, this study attempts to compute a comprehensive, cross-country index of financial inclusion (IFI), and use it to measure progress of financial inclusion in 68 countries from 2004 through 2008, to 2012. With the mean IFI value upgrading from 0.292 (low inclusion level) in 2004 to 0.332 (medium inclusion level) in 2012, the article exhibits a general improvement in the extent of financial inclusion for the period. Indicated by a diminution in the coefficient of variation (CV) of IFI from 0.853 in 2004 to 0.703 in 2012, the results also evidence convergence in IFI values. Seeking to measure the relationship between financial inclusion and human development, the article finds a strong and significant correlation between the two. Additionally, not only the Human Development Index (HDI) but also the income level of countries seems to show a movement, in tandem with the extent of financial inclusion evidenced by them. As an all-inclusive measure of socio-economic development, an IFI-incorporated HDI (modified HDI) has additionally been computed for the year 2012. The same has been employed to compare the extent of socio-economic development of the countries, as shown by HDI alone, and also by the proposed measure. Modified HDI, by capturing the vitality of ‘financial availability and access by all’, has been noted as an improved measure of socio-economic development over HDI. In addition, the study suggests removal of the stumbling blocks of financial illiteracy and technological backwardness to extend financial services to the unbanked masses. Financial inclusion is therefore a road that countries need to transverse to become global harbingers of development and prosperity.
Introduction
Access to finance assumes an overtly important role to facilitate effective utilization of productive, but scarce, resources in the economy (Sarma, 2012). Availability and equality of opportunities to access financial services is termed as financial inclusion. As per the latest World Bank (2015) estimates, approximately two billion people around the world make no use of formal financial services. Also, about 50 per cent of the adults in the most deprived households are unbanked or underbanked. Financial inclusion has, therefore assumed a social policy priority in all developing and developed countries (Arashiro, 2010; Sarma, 2008). Additionally, equality and ease of access to finance are inevitable in reducing and/or removing the far-flung problems of poverty and income disparities (Kunt & Klapper, 2012).
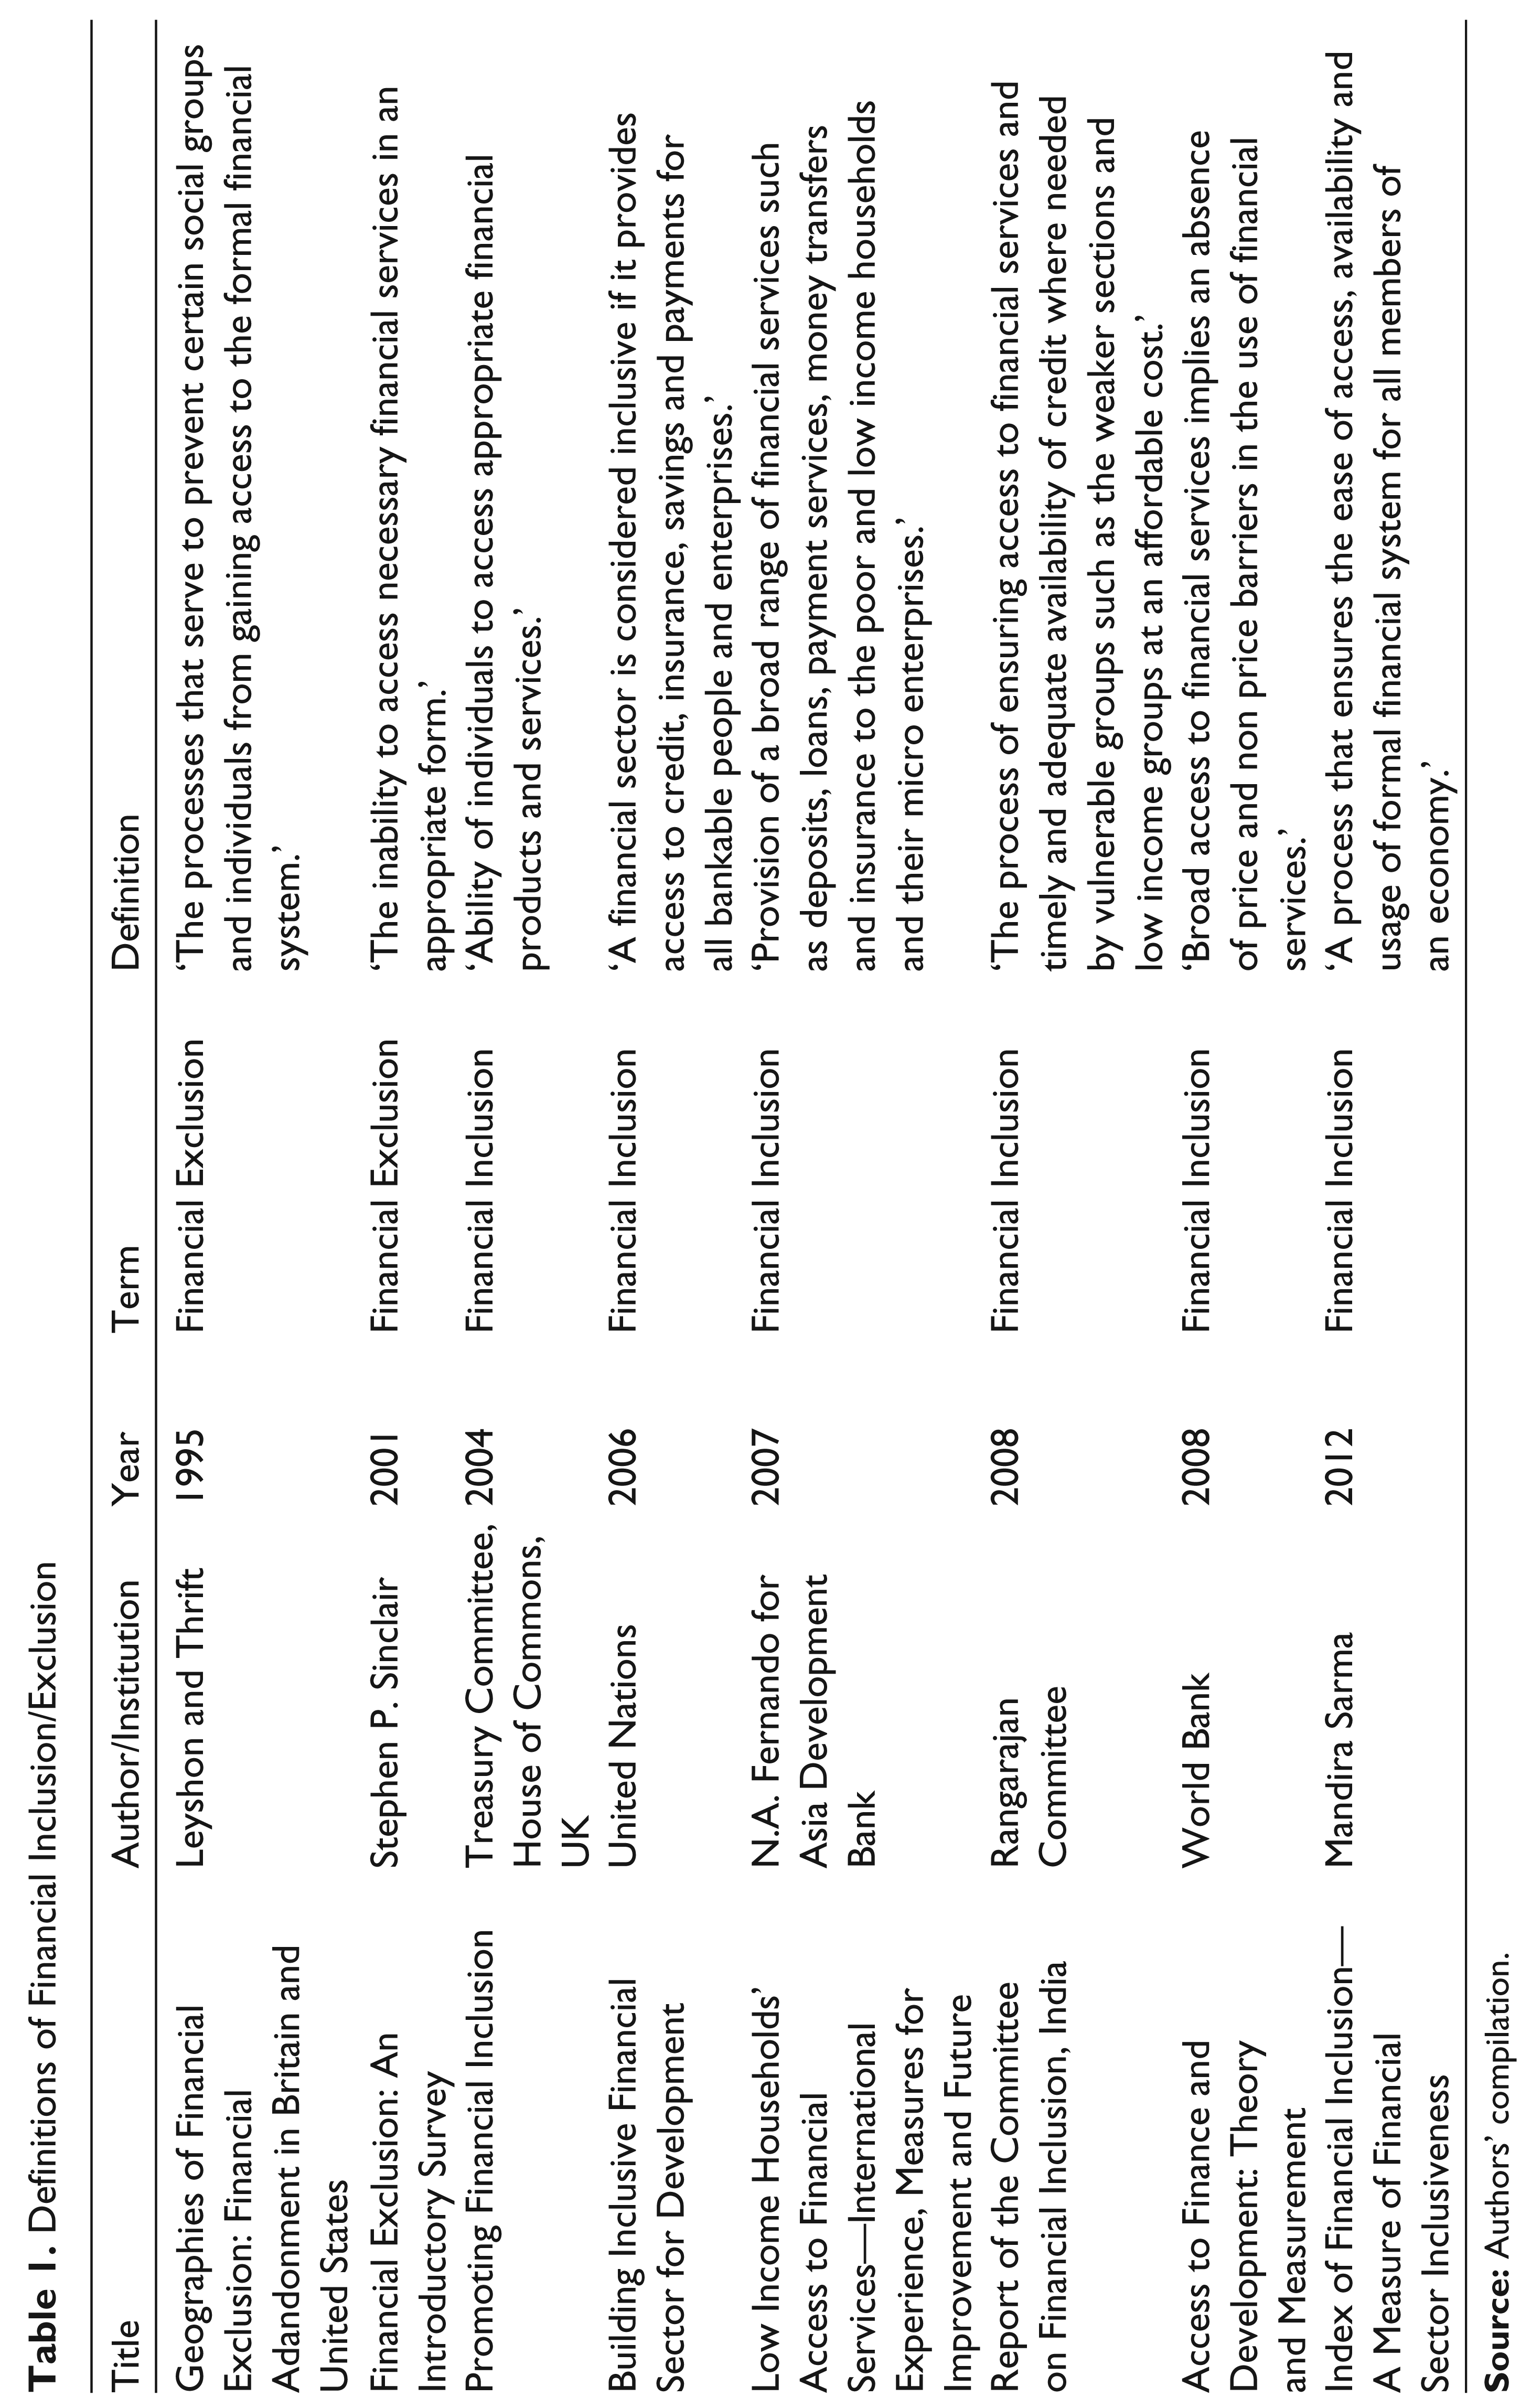
Considering the evolution in the usage of the term ‘financial exclusion’, it, in the earlier periods, was used to highlight limitations in access to the banking network (European Commission, 2008). Before the era of liberalization, the term was used to describe both, demand and supply side bottlenecks to adequate financial access (Rahim, Wan & Franceschelli, 2009). Early literature on financial exclusion has been defining it in the broader context of social exclusion (Kempson, Atkinson & Pilley, 2004; Sarma, 2008). Exclusion, in the early period, meant a process preventing certain social groups from gaining access to the formal financial system (Leyshon & Thrift, 1995).
Presently, modern-day definitions of financial inclusion consider its importance in not only providing access to the formal financial system, but also in ensuring the availability of timely, easy and affordable range of financial products and services to the vulnerable groups (Rangarajan Committee, 2008). The recent definitions not only span the linkage to banks through deposits but also imply inclusion in terms of credit, insurance, savings and payments for all bankable people and enterprises (United Nations, 2006). Development agendas today, thus, consider inclusion as means, and not an end in solving the developmental problems (Kodan & Chhikara, 2013). An inclusive financial system not only helps toenhance efficiency and welfare of the population at large, but also facilitates effective utilization of productive resources, thereby reducing the cost of capital (Sarma, 2012). In addition, it also improves the management of finances and prevents the growth of informal sources of credit supply (such as moneylenders), which are often found to be exploitative (Sarma, 2008).
On the basis of the above discussion, the definitions of financial exclusion/inclusion have been summarized in the Table 1.
Definitions of Financial Inclusion/Exclusion
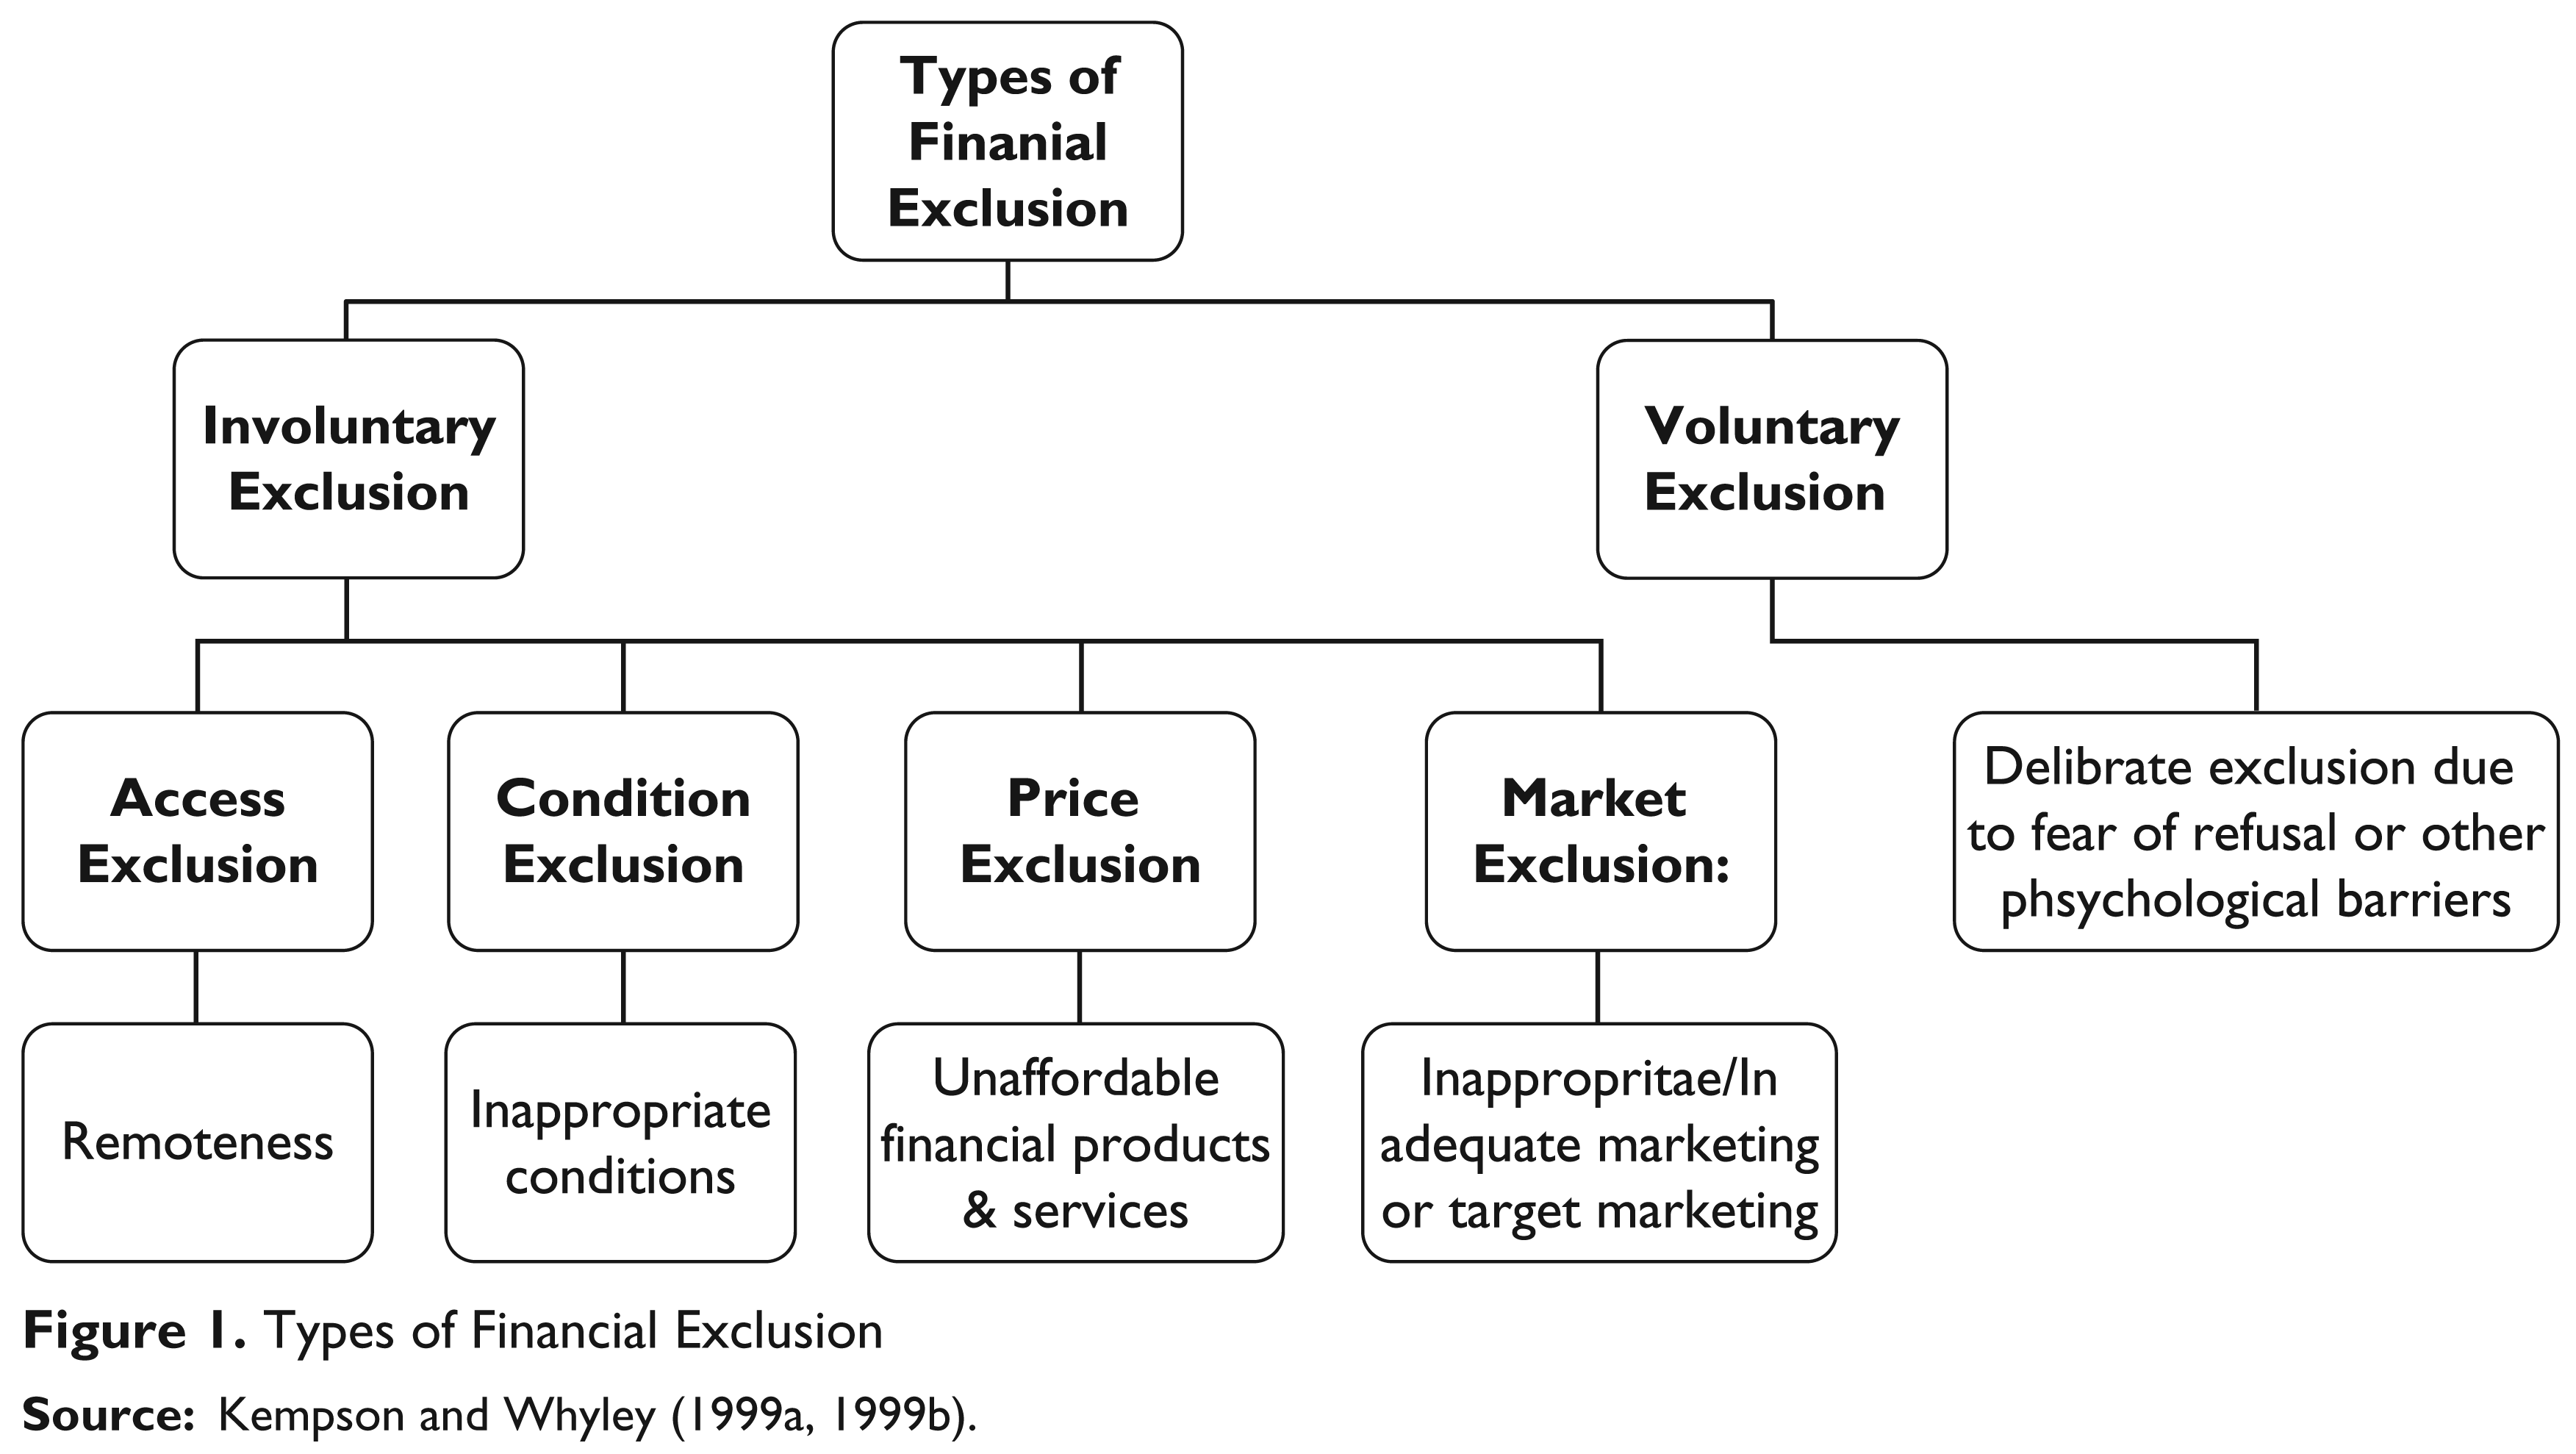
The literature has identified two major categories of financial exclusion, namely, involuntary and voluntary/self-exclusion. Figure 1 illustrates the two types and, further, the sub-types of exclusion. It goes ahead in iterating that remoteness, inappropriateness of conditions, unaffordability and inadequacy or target marketing force exclusion. Voluntary exclusion, on the other hand, emerges to be caused by fear, refusal or psychological barriers (Kempson & Whyley, 1999a, 1999b). Also, exclusion of such a type is notably largely associated with certain classes or income categories (Kodan & Chhikara, 2013; World Bank, 2008).
Although a magnificent quantum of academic literature has adequately discussed the relationship between financial development and economic growth (Levine, 1997), there has observably been a dearth of discussion on the relationship between financial inclusion and development (Sarma, 2010). It has been historically observed that even ‘well-developed’ financial systems have not succeeded to be ‘all inclusive’. Also, the ambit of formal financial systems has failed to completely span certain (low-income groups) segments (Sarma, 2010). However, financial inclusion is inevitably conducive to a country’s economic growth (Levine, 1997). It fosters higher access to finance, thereby encouraging greater production and even social protection (Kodan & Chhikara, 2011, 2013; Rajan & Zingales, 1998). Financial inclusion is also a measure of social development (Arora, 2010). By ensuring easy and affordable access to formal financial services, it helps to augment the pace of human development. Financial inclusion is therefore a road that needs to be traversed by countries for achieving inclusive and equitable growth (Kodan & Chhikara, 2013).
Review of Literature
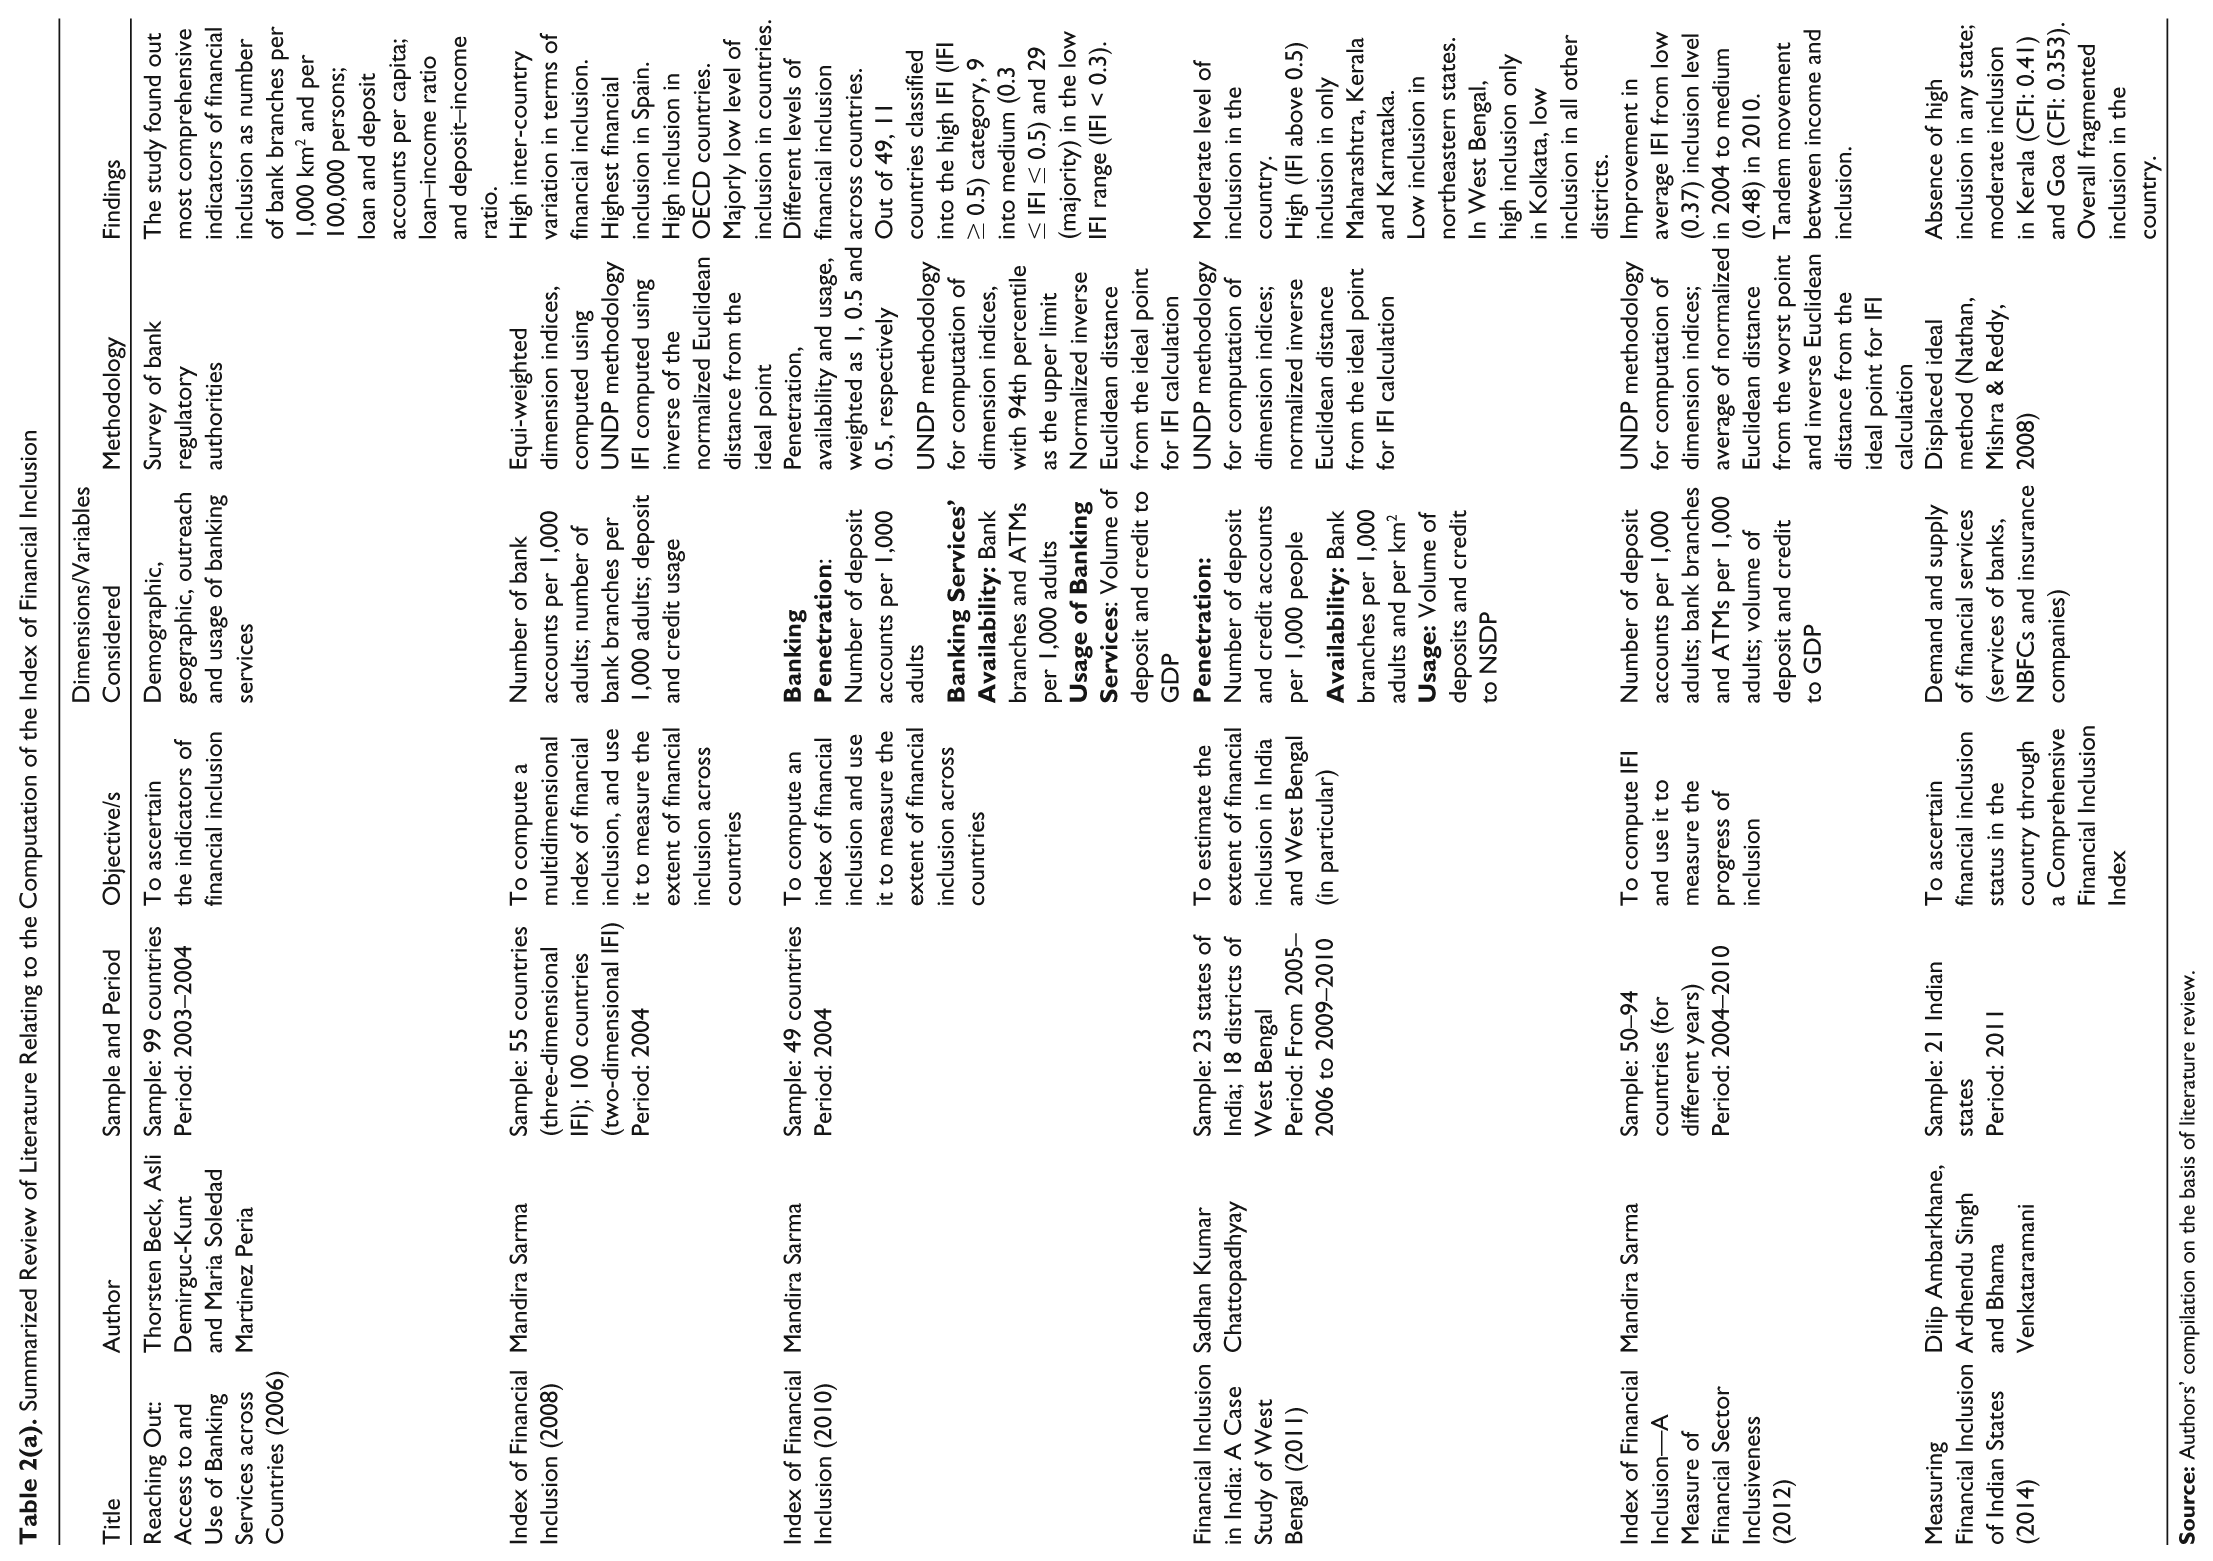
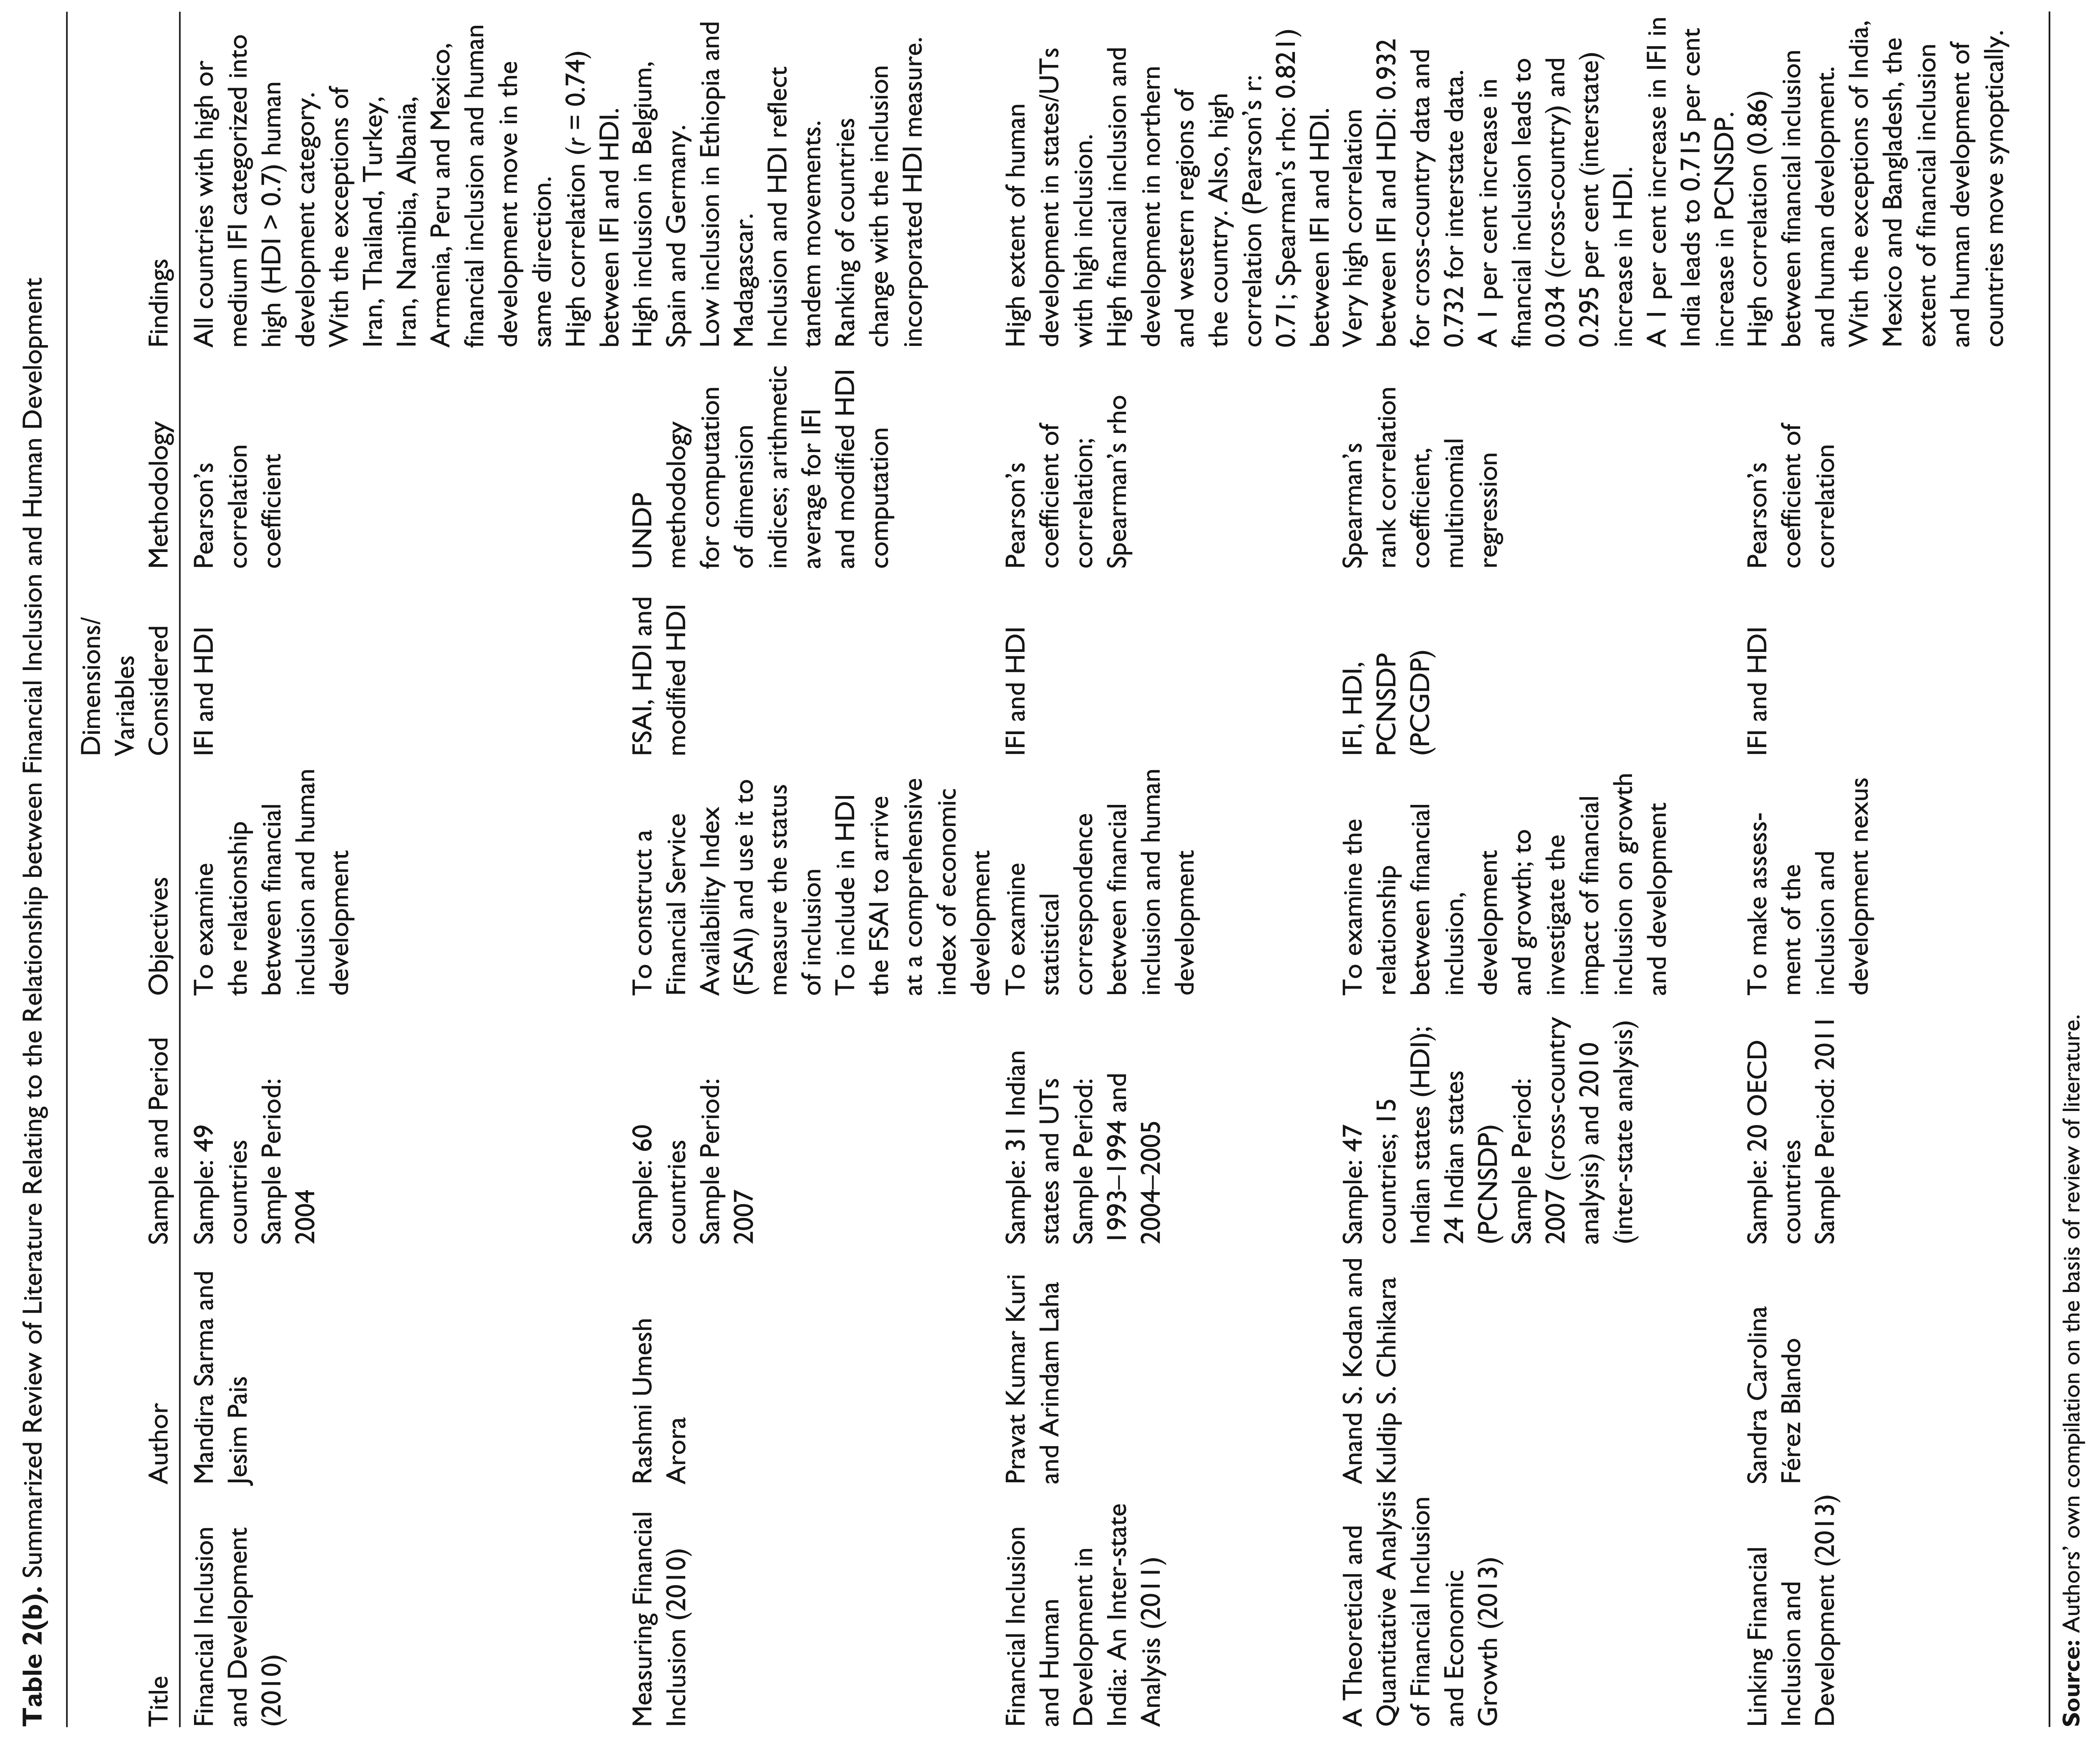
Review of suitable empirical literature spanning the computation methods for index of financial inclusion (IFI), and the relationship between financial inclusion and human/economic development has been presented in Tables 2(a) and 2(b), respectively.
Summarized Review of Literature Relating to the Computation of the Index of Financial Inclusion
Summarized Review of Literature Relating to the Relationship between Financial Inclusion and Human Development
Objectives of the Study
The study seeks to actualize empirically the following objectives:
To compute an index of financial inclusion for 68 countries
1
(based on data availability), and use it to measure the progress of financial inclusion across them from 2004 through 2008, to 2012. To compute the degree of association between financial inclusion and human development. To compute an IFI-incorporated modified index of human development, and use it to compare the level of socio-economic development of the various countries as measured by HDI alone and by such measure.
Index of Financial Inclusion
Literature has identified several indicators that can be suitably used to measure financial inclusion. The size of the banked population has generally been employed to capture the essence of the most preliminary and vital aspect of inclusion, that is, linkage to banks. It has therefore emerged as the most common indicator of financial inclusion (Sarma, 2010). Other indicators that have also been used include, demographic and/or geographic penetration of bank branches, demographic and/or geographic penetration of ATMs, number of point of sale (POS) terminals, amount of credit and deposit (percentage of GDP), affordability, ease and cost of banking transactions, etc. However, if these indicators are used individually, they can lead to misleading results (Sarma, 2008). Hence, the need to construct and use a comprehensive measure to examine the extent of inclusion arises. Also, the need of a macro-index having the ability to be applied on cross-country data over a period of time becomes inevitable. The index should, however, be such that it can be modified to suit the micro-context of a particular nation. Also, the index should try to reflect information on several dimensions of financial inclusion, preferably in a single number (Sarma, 2008). Thus, a good measure of financial inclusion should be:
Multidimensional: It should incorporate information on several aspects of financial inclusion. Lucid: It should be simple and easy to compute and interpret. Comparable: It should be comparable across countries and regions and also across different time horizons (Sarma, 2008).
Using methodological inputs from the research works of Sarma (2008, 2010), the index proposed in this article has been designed to fulfil the above criteria.
Indicators of Financial Inclusion
Banking Penetration (BP: Dimension 1)
Measuring the size of the banked population, banking penetration (BP) has been used as a dimension of financial inclusion. As a proxy to the dimension, the number of deposit accounts (per 1,000 adults) has been used as an indicator. 2 Ranging between 0 and 1, the dimension would measure 1 if every adult in an economy has a bank account.
Availability of Banking Services (BA: Dimension 2)
Accessibility in terms of availability of branches and ATMs has been used as the second dimension of financial inclusion. Consequently, the number of bank branches (per 1,000 persons) and number of ATMs (per 1,000 persons) have been considered as proxies for the dimension. The dimension index has in turn been computed by averaging the branch and ATM indices by weighing them 2/3 and 1/3, respectively.
Usage of Banking Services (BU: Dimension 3)
It has been observed that ‘in some apparently very highly banked countries, a number of people with bank accounts are nonetheless making very little use of the services on offer’ (Kempson, Atkinson & Pilley, 2004). These people are referred to as ‘underbanked’ or ‘marginally banked’ individuals. Notably, having merely a bank account does not ensure inclusiveness of the system. Hence, in order to incorporate usage as an indicator of inclusiveness, volume of outstanding credit and deposit as a percentage of a country’s GDP has been used as a proxy for it.
IFI: Methodology
Judging an inclusive financial system from several dimensions, a multidimensional approach (similar to the one adopted by the United Nations Development Programme [UNDP] for computation of IFI) has been adopted. The methodology is an adaption from ‘Index of Financial Inclusion’ by Sarma (2008, 2010). The index has been computed by first calculating a dimension index for each of the three dimensions of financial inclusion, and then in turn using them to calculate IFI. The dimension index for the ith dimension, di, has been computed by the following formula:

where Ai is the actual value of the dimension i, mi is the minimum value of the dimension i and Mi is the maximum value of the dimension i.
Selection of Lower and Upper Values
Lower/minimum value (mi) has been taken as the empirically observed minimum for each dimension for each year. Upper/maximum value (Mi), on the other hand, has been taken as the 94th percentile, as the empirically observed value may be an outlier and distort completely the scale of the index. If for a country the dimension value is greater than the upper limit, it has been set as equal to it. Thus, by setting the upper limit at 94th percentile, the limitation of country comparisons against excessively high benchmarks and outliers is removed. 3 Additionally, the formula has so been designed to ensure that 0 ≤ di ≤ 1. Hence, higher achievement of a country in dimension i would be represented by higher value of di.
The IFI has in turn been computed using the following equation:

In Equation (2), the numerator of the second component is iterative of the Euclidean distance Di from the ideal point I (1,1,1). Normalization of it by (n)1/2, and subtraction from 1 gives the inverse normalized distance. Normalization ensures the range of IFI to be 0–1. 4
Dimensions Other Than Those under Consideration
Apart from the dimensions under consideration, ‘affordability’, ‘timeliness’, ‘ease’ and ‘cost’ could have been other dimensions connoting important aspects of financial inclusion (Rangarajan Committee Report, 2008). However, data for measuring these dimensions were found to be inadequately available for many countries at large. Therefore, these dimensions were not incorporated in the current index.
Human Development Index and Modified Human Development Index
Human development index (HDI) is a composite measure of the three dimensions of human development, namely, life expectancy, adult literacy and enrolment at the primary, secondary and tertiary levels, and the country’s GDP index (UNDP, 2010). The three pillars, on the basis of which HDI is calculated for each country, are as follows. 5

Modified HDI: Modified HDI has been computed by incorporating in the three dimensions of human development, an additional dimension for financial inclusion (IFI), computed in the earlier section of the article. The modified HDI for the year 2012 has been computed using the following equation:

Analysis of Inter-country IFI
Table 3 presents computed IFI values for 68 countries (constrained by data availability for each of the 3 years under study). As evident from Table 3, there exists a fragmented level of inclusion across countries. Among 68 countries under study, IFI values range from a low of 0.004 for Guinea to a soaring 0.985 for Switzerland for 2004. While Guinea (2004 and 2008) and Central African Republic (2012) recorded the lowest levels of inclusion, Switzerland (2004) and Japan (2008 and 2012) were seen as top rankers. Depending on the IFI scores, countries have been placed in one of the following three categories:
0.5 ≤ IFI ≤ 1—high financial inclusion, 0.3 ≤ IFI ≤ 0.5—medium financial inclusion, 0.0 ≤ IFI ≤ 0.3—low financial inclusion (Sarma, 2008).
Inter-country Analysis of IFI
High IFI Countries: The number of countries recording a ‘high’ level of inclusion increased from 13 in the year 2004 to 16 in 2008 and 18 in 2012. Japan, Switzerland, Belgium, Malta, Korea, Spain, Ireland, Mauritius, Malaysia, Estonia, the Netherlands, Lebanon and Seychelles were noted to comprise the set of countries evidencing high values of financial inclusion. Notably, most countries in the category were observed to belong to ‘high-income OECD’ group. Largely, the countries exhibiting a ‘high’ or ‘medium’ level of income were evidenced to comprise this group. This, in turn, clarified a tandem movement between income levels of the country and the extent of financial inclusion. The only exception in this regard was Ukraine, which, irrespective of its low-income level, was attributed by high inclusion (0.540 in 2008 and 0.522 in 2012).
Medium IFI Countries: Latvia, Turkey, Thailand, Ukraine and Chile represented the set of countries recording a medium extent of financial inclusion in 2004 and/or 2008. However,these countries graduated to a higher status of financial inclusion in the subsequent year/s. Witnessing low inclusion in 2004, South Africa, Morocco, Samoa and Bosnia and Herzegovina upgraded from a low level of inclusion in 2004 to a medium stance in 2008 and 2012. On the other hand, Czech Republic, Kuwait, Costa Rica, Austria and Hungary were evidenced to compose the lot exhibiting a moderate level of financial inclusion throughout the period. The county of Tonga, on the flip side, was only seen to reflect a slippage in status from medium to low level. Countries in this category of IFI were largely seen to be the ones belonging to the high-, upper- or lower-middle-income group.
Low IFI Countries: From among the countries under study, a major number of countries belonged to this category. The number of countries, however, falling in the category witnessed a decline from 43 in 2004 to 37 and 34 in 2008 and 2012, respectively, thereby reflecting an elevation in the level of financial inclusion of countries. Observably, the list was dominated by middle- and low-income countries. The only exception in this regard was Equatorial Guinea, which, despite its high-income level, was smitten with the problem of low inclusion.
Table 4 presents descriptive statistics of computed IFI values for 68 countries for 2004, 2008 and 2012. The computations indicate a general improvement in the extent of financial inclusion, with the minimum IFI value increasing from 0.004 in 2004 and 2008 to 0.006 in 2012. Also, the mean IFI values upgraded from 0.292 (2004) to 0.332 (2012). While the number of ‘low IFI’ countries declined from 43 (62.319 per cent) in 2004 to 38 (55.072 per cent) in 2008 and 34 (49.275 per cent) in 2012, the ones falling in the ‘high IFI’ category rose from 13 (18.841 per cent) to 16 (21.74 per cent) and 18 (26.087 per cent) during the same time. Additionally, diminution in coefficient of variation (CV) values from 0.853 in 2004 to 0.703 in 2012 indicated convergence in IFI values.
Descriptive Statistics of IFI for Select Countries
Relationship between Financial Inclusion and Socio-economic Development
Financial inclusion and the extent of socio-economic development, as measured by the HDI, seem to move in the same direction. For instance, for the year 2012, Japan, Switzerland, Belgium, Malta, Republic of Korea, Spain, Ireland, Estonia, the Netherlands, Latvia and Chile reflected categorization in both high inclusion and very high human development categories (UNDP). Others in the high inclusion category, including Bulgaria, Mauritius, Malaysia, Lebanon, Turkey, Thailand and Ukraine, fell in the category of high human development. Countries recording lower levels of financial inclusion, including Uganda, Republic of Congo, Burundi, Cameroon, Madagascar, Myanmar, Guinea and Central African Republic, also exhibited low level of human development. Human (socio-economic) development, thus, like income level of countries emerged to be moving in the same direction as financial inclusion. Correlation results for the 3 years (2004, 2008 and 2012) further reveal a strong and positive association between the two. The computed values of Pearson’s (Spearman’s rho) correlation for the years 2004, 2008 and 2012 (Tables 5(a), 5(b) and 5(c)) were noted to be 0.802 (0.870), 0.841(0.888) and 0.831 (0.873), respectively. The values of Spearman’s rho further substantiated the dominance of countries with high (low) human development in the category of high (low) financial inclusion. Hence, financial inclusion and the extent of socio-economic development, as measured by HDI, seem to be strongly related to each other.
Modified HDI: An Illustration
As observed earlier, HDI is seen as a measure of economic development through development of human beings. Measured as an arithmetic average of life expectancy index, education index and GDP index for a country, it seeks to capture the essence of human development through a country’s achievement in providing a long and healthy life to its residents, the education level of the residents and its contribution to the domestic product. It, however, fails to encompass the index seeking to measure the progress of a country in being able to reach to the ‘bottom of the pyramid’ by ensuring availability of finance to the unbanked population. To capture this dimension, an attempt has been made to incorporate in HDI the IFI as computed in the earlier section of the article (for 2012). A similar attempt was made by Rashmi Umesh Arora, in her paper ‘Measuring Financial Access (2010)’, by incorporating the index for financial access in HDI for the year 2009.
Correlation between IFI and HDI (2004)
Correlation between IFI and HDI (2008)
Correlation between IFI and HDI (2012)
The ranking of the countries for HDI and modified HDI has been shown in Table 6. The results reveal that Switzerland leads the list of the countries in terms of both, HDI and its financial inclusion incorporated measure. Notably, the IFI score is less than the reported human development levels of the countries; hence, the value of modified HDI is lower than the HDI value. In this regard, whilst some countries (27) revealed rank improvements from HDI to modified HDI, there were others evidencing rank stagnation (11) or even deterioration (30). Major rank improvements were observed for Thailand (from 32 to 23), followed by Morocco (from 49 to 42), Ukraine (from 28 to 22) and Mauritius (from 22 to 16) reflecting the countries’ competence in extending finance to the unbanked masses and thereby improving human development. On the other hand, Argentina (from 16 to 24), Gabon (from 40 to 48), Venezuela (from 20 to 26) and Mexico (from 24 to 30) were among the countries that showed a downgrade in human development ranks owing to the incorporation of financial inclusion in the index. The ranking of Central African Republic, Tanzania, Uganda, Tonga, Peru, Bosnia and Herzegovina, Estonia, Czech Republic and Switzerland, however, did not reflect a change. Financial inclusion should therefore be used as an additional measure of economic/socio-economic development.
Modified HDI (2012)
Recommendations
As evidenced through the article, financial inclusion and development are closely associated. Financial inclusion should therefore be viewed as a policy priority by both, policy makers and providers. Policy makers can augment the pace of development by ensuring financial access to all through financial inclusion. Inclusion can thus be used by the government to supplement the policies on employment, security and education (Sarma, 2010). Additionally, financial inclusion is inevitably a road that countries need to transverse to become heralds of development.
Financial illiteracy is a major stumbling block that needs to be removed to further inclusion. The task of financial inclusion does not end by cajoling people to open a bank account, but involves actuating them to make full use of the services. Thus, financial inclusion, in harmony with other economic objectives of the country, can make a unique contribution to a country’s progress and development.
Limitations of the Study
Although the index computed for the purpose of this article is multidimensional and comprehensive, it, however, depends to a great extent on the availability of data. Data on all dimensions were available for only a few out of all the countries of the world. The analysis has, therefore, been conducted for the countries for which data on all dimensions were available for three years, namely, 2004, 2008 and 2012; the results may vary if all countries are taken into account. Additionally, the index is macro in nature, and hence lacks the ability to capture country-specific information. The study is also limited by the problem of lack of adequate data and information about technological advancements and improvements in the nature of banking. As an upgrade from conventional banking, Internet and telebanking have emerged as major drivers of the banking service; however, characterized by the dearth of data, the indicator for availability of banking services is composed of only branch and ATM penetration. Also, the indexes for financial inclusion could not span information on dimensions, such as affordability, timeliness and quality of financial services, due to data unavailability and inconsistency.
Conclusion
The article presents an illustrative example of determination and computation of IFI over time and across regions. The index computed for 2004, 2008 and 2012 indicates that countries around the world are at different levels of financial inclusion. The computations indicate a general improvement in the extent of financial inclusion, with the minimum IFI value progressing from 0.003 in 2004, to 0.004 and 0.006 in 2008 and 2012, respectively. Also, the mean IFI values reflected an upgrade from 0.292 (2004) to 0.331 (2012). Additionally, convergence in IFI values was evidenced by a diminution in CV values from 0.853 in 2004 to 0.703 in 2012. The HDI and the income level of countries seem to show a unidirectional movement with IFI. The countries reporting a high level of inclusion are observed to be the ones characterized by high income and high level of socio-economic development, the reverse is also true for the countries with a low level of financial inclusion (with only a few exceptions). Modified HDI, as an improvement over HDI, seeks to measure the level of socio-economic development by encompassing in addition to the life expectancy index, education index and GDP index for a country, the index for financial inclusion.
Footnotes
Appendix
Country-wise Index of Human Development (HDI)
| Country | 2004 | 2008 | 2012 |
| Algeria | 0.728 | 0.695 | 0.709 |
| Angola | 0.439 | 0.490 | 0.504 |
| Argentina | 0.863 | 0.777 | 0.799 |
| Armenia | 0.768 | 0.722 | 0.720 |
| Austria | 0.944 | 0.868 | 0.877 |
| Belgium | 0.945 | 0.873 | 0.877 |
| Bosnia and Herzegovina | 0.800 | 0.727 | 0.726 |
| Bulgaria | 0.816 | 0.766 | 0.773 |
| Burundi | 0.384 | 0.362 | 0.381 |
| Cameroon | 0.506 | 0.477 | 0.493 |
| Central African Republic | 0.353 | 0.344 | 0.355 |
| Chile | 0.859 | 0.805 | 0.808 |
| Congo | 0.520 | 0.548 | 0.565 |
| Costa Rica | 0.745 | 0.744 | 0.750 |
| Czech Republic | 0.885 | 0.856 | 0.858 |
| Ecuador | 0.765 | 0.697 | 0.701 |
| Egypt | 0.702 | 0.667 | 0.678 |
| Equatorial Guinea | 0.653 | 0.543 | 0.559 |
| Estonia | 0.858 | 0.832 | 0.830 |
| Fiji | 0.758 | 0.712 | 0.721 |
| Gabon | 0.633 | 0.654 | 0.662 |
| Georgia | 0.743 | 0.730 | 0.733 |
| Guinea | 0.445 | 0.377 | 0.380 |
| Guyana | 0.725 | 0.621 | 0.626 |
| Honduras | 0.683 | 0.604 | 0.612 |
| Hungary | 0.869 | 0.814 | 0.817 |
| India | 0.611 | 0.554 | 0.570 |
| Indonesia | 0.711 | 0.654 | 0.671 |
| Ireland | 0.956 | 0.902 | 0.899 |
| Jamaica | 0.724 | 0.710 | 0.712 |
| Japan | 0.949 | 0.881 | 0.884 |
| Kenya | 0.491 | 0.508 | 0.522 |
| Korea (Republic of) | 0.912 | 0.874 | 0.882 |
| Kuwait | 0.871 | 0.800 | 0.807 |
| Latvia | 0.845 | 0.813 | 0.809 |
| Lebanon | 0.774 | 0.750 | 0.759 |
| Madagascar | 0.509 | 0.487 | 0.494 |
| Malaysia | 0.805 | 0.760 | 0.766 |
| Malta | 0.875 | 0.809 | 0.821 |
| Mauritius | 0.800 | 0.741 | 0.753 |
| Mexico | 0.821 | 0.739 | 0.748 |
| Micronesia | – | – | 0.627 |
| Moldova (Republic of) | 0.694 | 0.652 | 0.652 |
| Morocco | 0.640 | 0.588 | 0.603 |
| Mozambique | 0.390 | 0.366 | 0.380 |
| Myanmar | 0.581 | 0.500 | 0.514 |
| Namibia | 0.626 | 0.598 | 0.610 |
| Netherlands | 0.947 | 0.901 | 0.904 |
| Nicaragua | 0.698 | 0.599 | 0.604 |
| Pakistan | 0.539 | 0.536 | 0.526 |
| Papua New Guinea | 0.523 | 0.467 | 0.479 |
| Peru | 0.767 | 0.707 | 0.722 |
| Philippines | 0.763 | 0.648 | 0.651 |
| Rwanda | 0.450 | 0.432 | 0.453 |
| Samoa | 0.778 | 0.683 | 0.688 |
| Seychelles | 0.842 | 0.766 | 0.763 |
| Solomon Islands | 0.592 | 0.506 | 0.489 |
| South Africa | 0.653 | 0.623 | 0.638 |
| Spain | 0.938 | 0.857 | 0.864 |
| Switzerland | 0.947 | 0.903 | 0.915 |
| Tanzania (United Republic of) | 0.430 | 0.451 | 0.464 |
| Thailand | 0.784 | 0.704 | 0.715 |
| Togo | 0.815 | 0.696 | 0.701 |
| Turkey | 0.757 | 0.710 | 0.738 |
| Uganda | 0.502 | 0.458 | 0.472 |
| Ukraine | 0.774 | 0.729 | 0.726 |
| Venezuela (Bolivarian Republic of) | 0.784 | 0.758 | 0.759 |