



Abstract
This article examines the determinants of underreporting (reticence) on randomized response questions. A simple model is created to describe the interview process and draw some conclusion as to why people might misreport their true status despite given the assurance of institutional and statistical confidentiality. By looking at the relationship between firm-specific reticence and other firm-specific and industry-location-specific variables, it is found that (mis)trust (proxied by the proportion of contracts arranged before delivery) is a significant predictor of reticence. Underreporting does not seem to be significantly related to a misunderstanding of the procedure, education, profit levels or guilt. This seems to suggest that firms which are more cautious in their business dealings are also more cautious with the randomized response (RR) technique. In such cases, weighted estimates of the prevalence of sensitive traits might be derived without the use of the RR technique but through the use of variables relating to the nature of firm-level contracts. Moreover, more accurate data on sensitive topics can be extracted from large homogeneous populations.
Introduction
The incentive for revealing information about illicit corporate practices might be increased by payments and/or offers of clemency; prosecutors might offer crown witness protection for those willing to reveal sensitive information that helps to prosecute a corrupt agent. The United States Securities and Exchange Commission requires all listed corporations and their subsidiary companies to have anonymous whistle-blower hotlines for company personnel and third parties. Encouraging whistle-blowing is thought to be an effective way of increasing the probability of catching agents involved in corruption. However, whistle-blowers must find credible people to contact, either within a company or outside a company.
Getting good data is crucial in empirical analyses of sensitive topics (Iarossi, 2006). However, many individuals are hesitant to directly reveal sensitive information. In response to the difficulty in getting sensitive data from individuals, researchers use different methods to overcome this barrier to data collection. Some of these methods include direct and indirect questioning methods. The randomized response (RR) method was designed to reduce the social desirability and non-response biases in the revealing of sensitive data. Answering questions via this method removes the stigma attached to revealing sensitive and/or negative information about oneself. This occurs because the response to the sensitive question(s) is determined by a randomizing device, making it impossible to tell if the answer received directly corresponds to the guilt/innocence of the interviewee.
Despite these considerations, the RR technique has failed in eradicating social desirability bias. Despite being assured of statistical anonymity, interviewees refuse to give a response that might implicate them in some wrongdoing or suggest that they do something considered immoral. This hesitance to follow the rules of the RR procedure when those rules might implicate an individual in wrongdoing is labelled ‘reticence’ (Azfar & Murrell, 2009).
Reticence amongst firm managers in the orchestration of the RR technique has been noted by numerous scholars in recent years (Azfar & Murrell, 2009; Clausen, Kraay, & Murrell, 2010; Karalashvili, Kraay, & Murrell, 2015). The idea that managers refuse to disclose information despite guaranteed statistical anonymity has caused researchers to search for reasons for this behaviour (Kundt, Misch, & Nerré, 2016). A natural response to the problem of reticence is to find out what determines the phenomenon and accordingly adjust the responses from RR questions. Statistical methods to describe the prevalence and effects of reticence have been developed (Kraay & Murrell, 2013). The research community also knows that reticent managers respond differently to non-reticent managers when asked non-sensitive survey questions. For example, evidence has been found for reticent managers reporting that they pay their workers higher wages, whilst in reality paying wages no higher than their competitors (Clarke, 2012); also, reticent managers are more likely to answer questions on corruption but less likely to report corruption (Clarke, Friesenbichler, & Wong, 2015).This article investigates the reasons for underreporting of sensitive acts by firms, even when those same firms have protection against being found guilty of those acts.
Whilst previous research has found that reticence increases with competition (Friesenbichler, Clarke, & Wong, 2014), the current study finds that when asking companies RR questions, reticence can decrease with competition. The role of trust and the perceived risk of detection is examined and found to have significant effects on the propensity to report truthfully.The results suggest that some of the factors which affect the nature in which companies engage in trade might also affect the exchange of sensitive information.
This study uses a set of seven sensitive RR questions in order to examine misreporting. Managers were given the instructions for the RR process before receiving the RR questions. The instructions stated that the managers were to privately flip a coin before answering each question. If the result of the flip was ‘Heads’, they were instructed to respond ‘Yes’ to the corresponding question regardless of the truth; if the result was ‘Tails’, they were instructed to respond with the truth. A firm is labelled as reticent if it responds ‘No’ to all seven questions because of the extremely low probability of getting seven Tails and being innocent of each act. 1 Firms which respond ‘Yes’ to at least one sensitive question are labelled as ‘Possibly Candid’ due to the possibility that they might have underreported on at least one question but still show some signs of cooperating with the procedure (Azfar & Murrell, 2009). The sum score is defined as the total number of Yeses that the firm reports. Therefore, reticent firms have a sum score of zero, whilst possibly candid firms have a sum score of at least one. There was no non-response in the sample; all firms gave an answer to all seven sensitive questions.
Framework
Firm managers are given protection from being identified as guilty of an act; this protection is through the statistical anonymity provided by attaching their response to the outcome of a coin toss. Managers are asked a sensitive question while they privately toss a coin and are told to respond ‘Yes’ if they got a ‘Heads’ or if they did the sensitive act in question. This occurs seven times. The same procedure is done for 3 non-sensitive questions making a total of 10 questions. This framework makes it impossible to tell whether a ‘Yes’ is a sign of guilt or a sign of getting a ‘Heads’. Despite this protection from their guilt being identified, firm managers still choose to misreport their status when asked sensitive questions. In this study, the manager is labelled as reticent if he/she answers ‘No’ to all seven non-sensitive questions. This study investigates the reason for reticence using the following potential solutions:
Potential Reasons for Reticence
A Misunderstanding of the Randomized Response Procedure
Despite the instructions that are given, many people are said to not understand the process (Lambsdorff, 2012). 2 A misunderstanding of the requirements of the procedure might cause people to report ‘No’ every time to a series of sensitive questions even when a ‘Yes’ is required. This misunderstanding might not be unrelated to the general miscommunication that can occur in surveys.
A Lack of Understanding of Probability or Statistics
The RR procedure is meant to protect interviewees from being identified as guilty, therefore allowing them to admit to sensitive acts without the stigma of revealing their true behaviour. If the interviewees understood what was required, they might still have misreported their status because they did not know that the probability of tracing guilt on an individual question back to them is zero. One might describe such a lack of knowledge as asymmetric information about the probability of observing a Yes/No in the RR procedure.
Firm Outcomes
A highly profitable firm might stand to lose a lot if it is prosecuted for business malpractice. Firm managers might be unwilling to admit to sensitive acts if they have a lot to lose by doing so. Therefore, firms with larger sales and profits might be more reticent that unprofitable firms.
Guilt
Firms which have something to hide might choose to be reticent. If this is the case then the reticent firms are guilty of most of the sensitive acts and the possibly candid are less guilty. There is evidence that reticent firms underreport when asked other sensitive questions (Clausen et al., 2010).
Trust
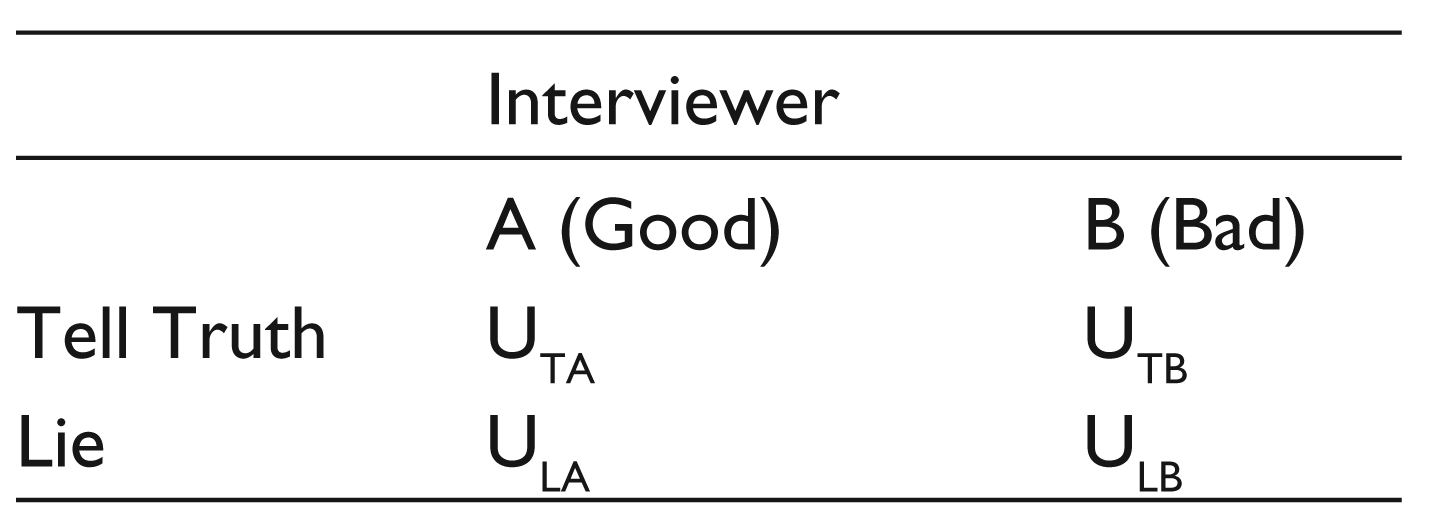
Despite firms being aware of the procedure, they might be suspicious about the whole process and believe that the technique is not safe from being used against them somehow. Firms might think that they are being tricked into saying ‘Yes’ and will be targeted or investigated by law enforcement officials despite a ‘Yes’ not revealing anything about the firm’s behaviour. This might be linked to the psychic cost of admitting that one has done an act which one has not done.
Detection
The surveys were anonymous, however, firms revealed information about themselves that could be used, in conjunction with information about the overall population of firms and their characteristics, to identify them. For example, if a firm is the only wood manufacturing firm of over 99 employees in Lagos state, then that firm would be more easily identifiable than a firm that was amongst 100 other competitors in its industry-location-size cell. Reticence might be a response to this increased perceived probability of detection.
Data and Construction of Variables
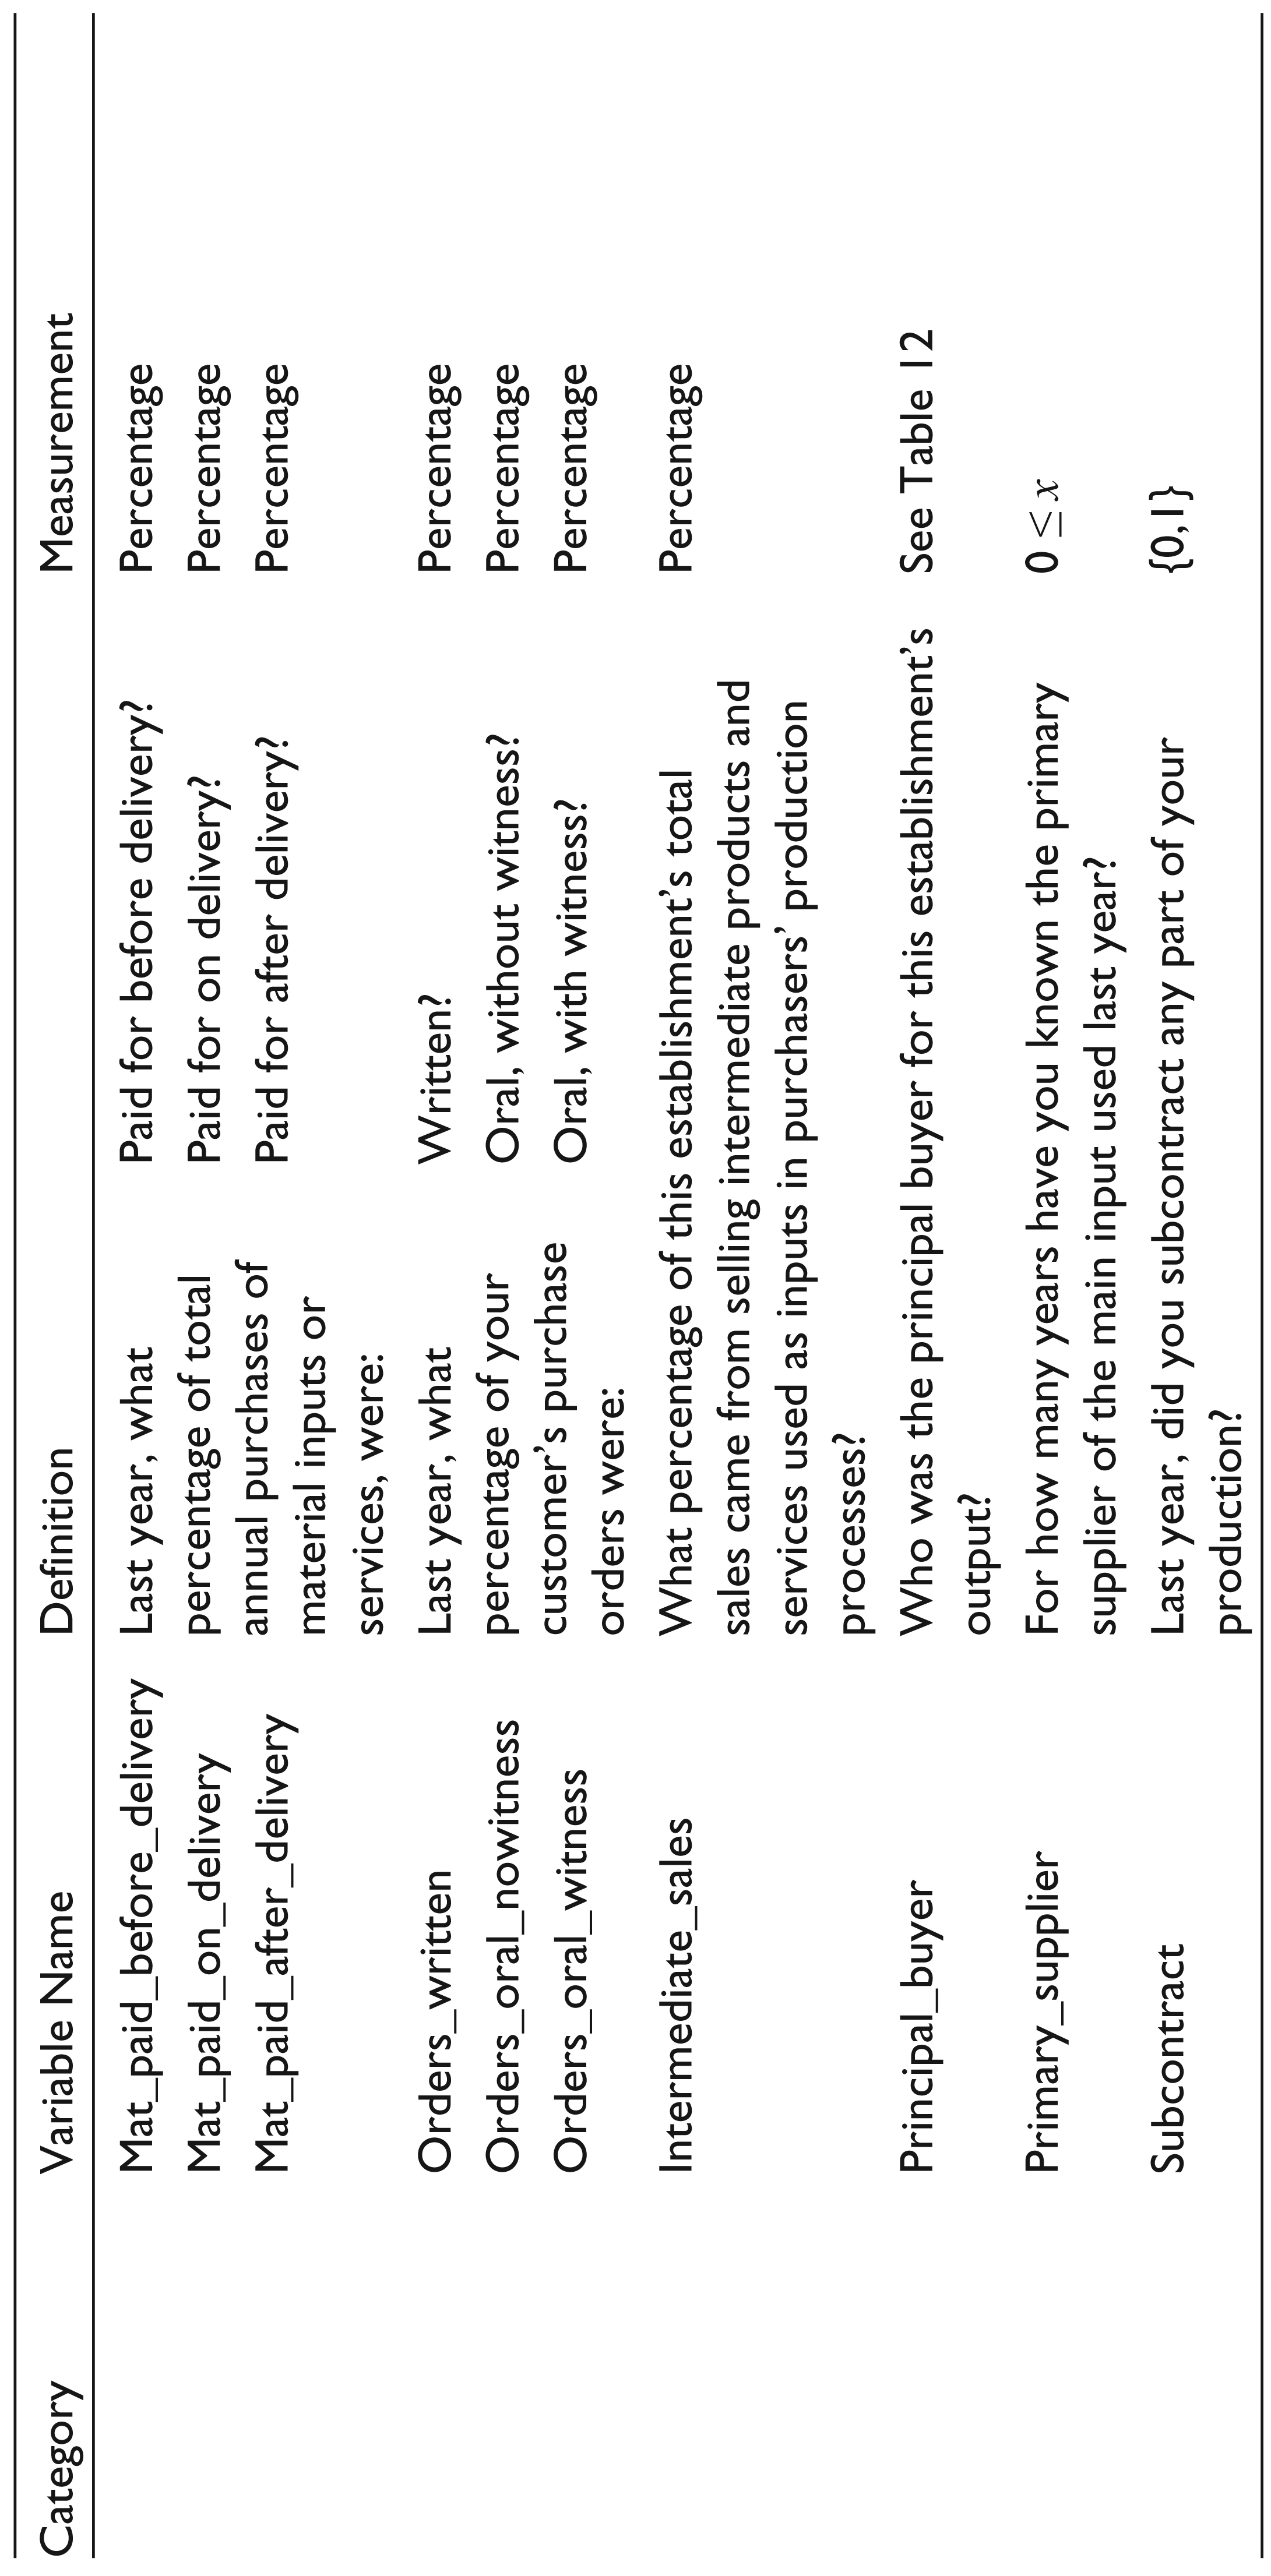
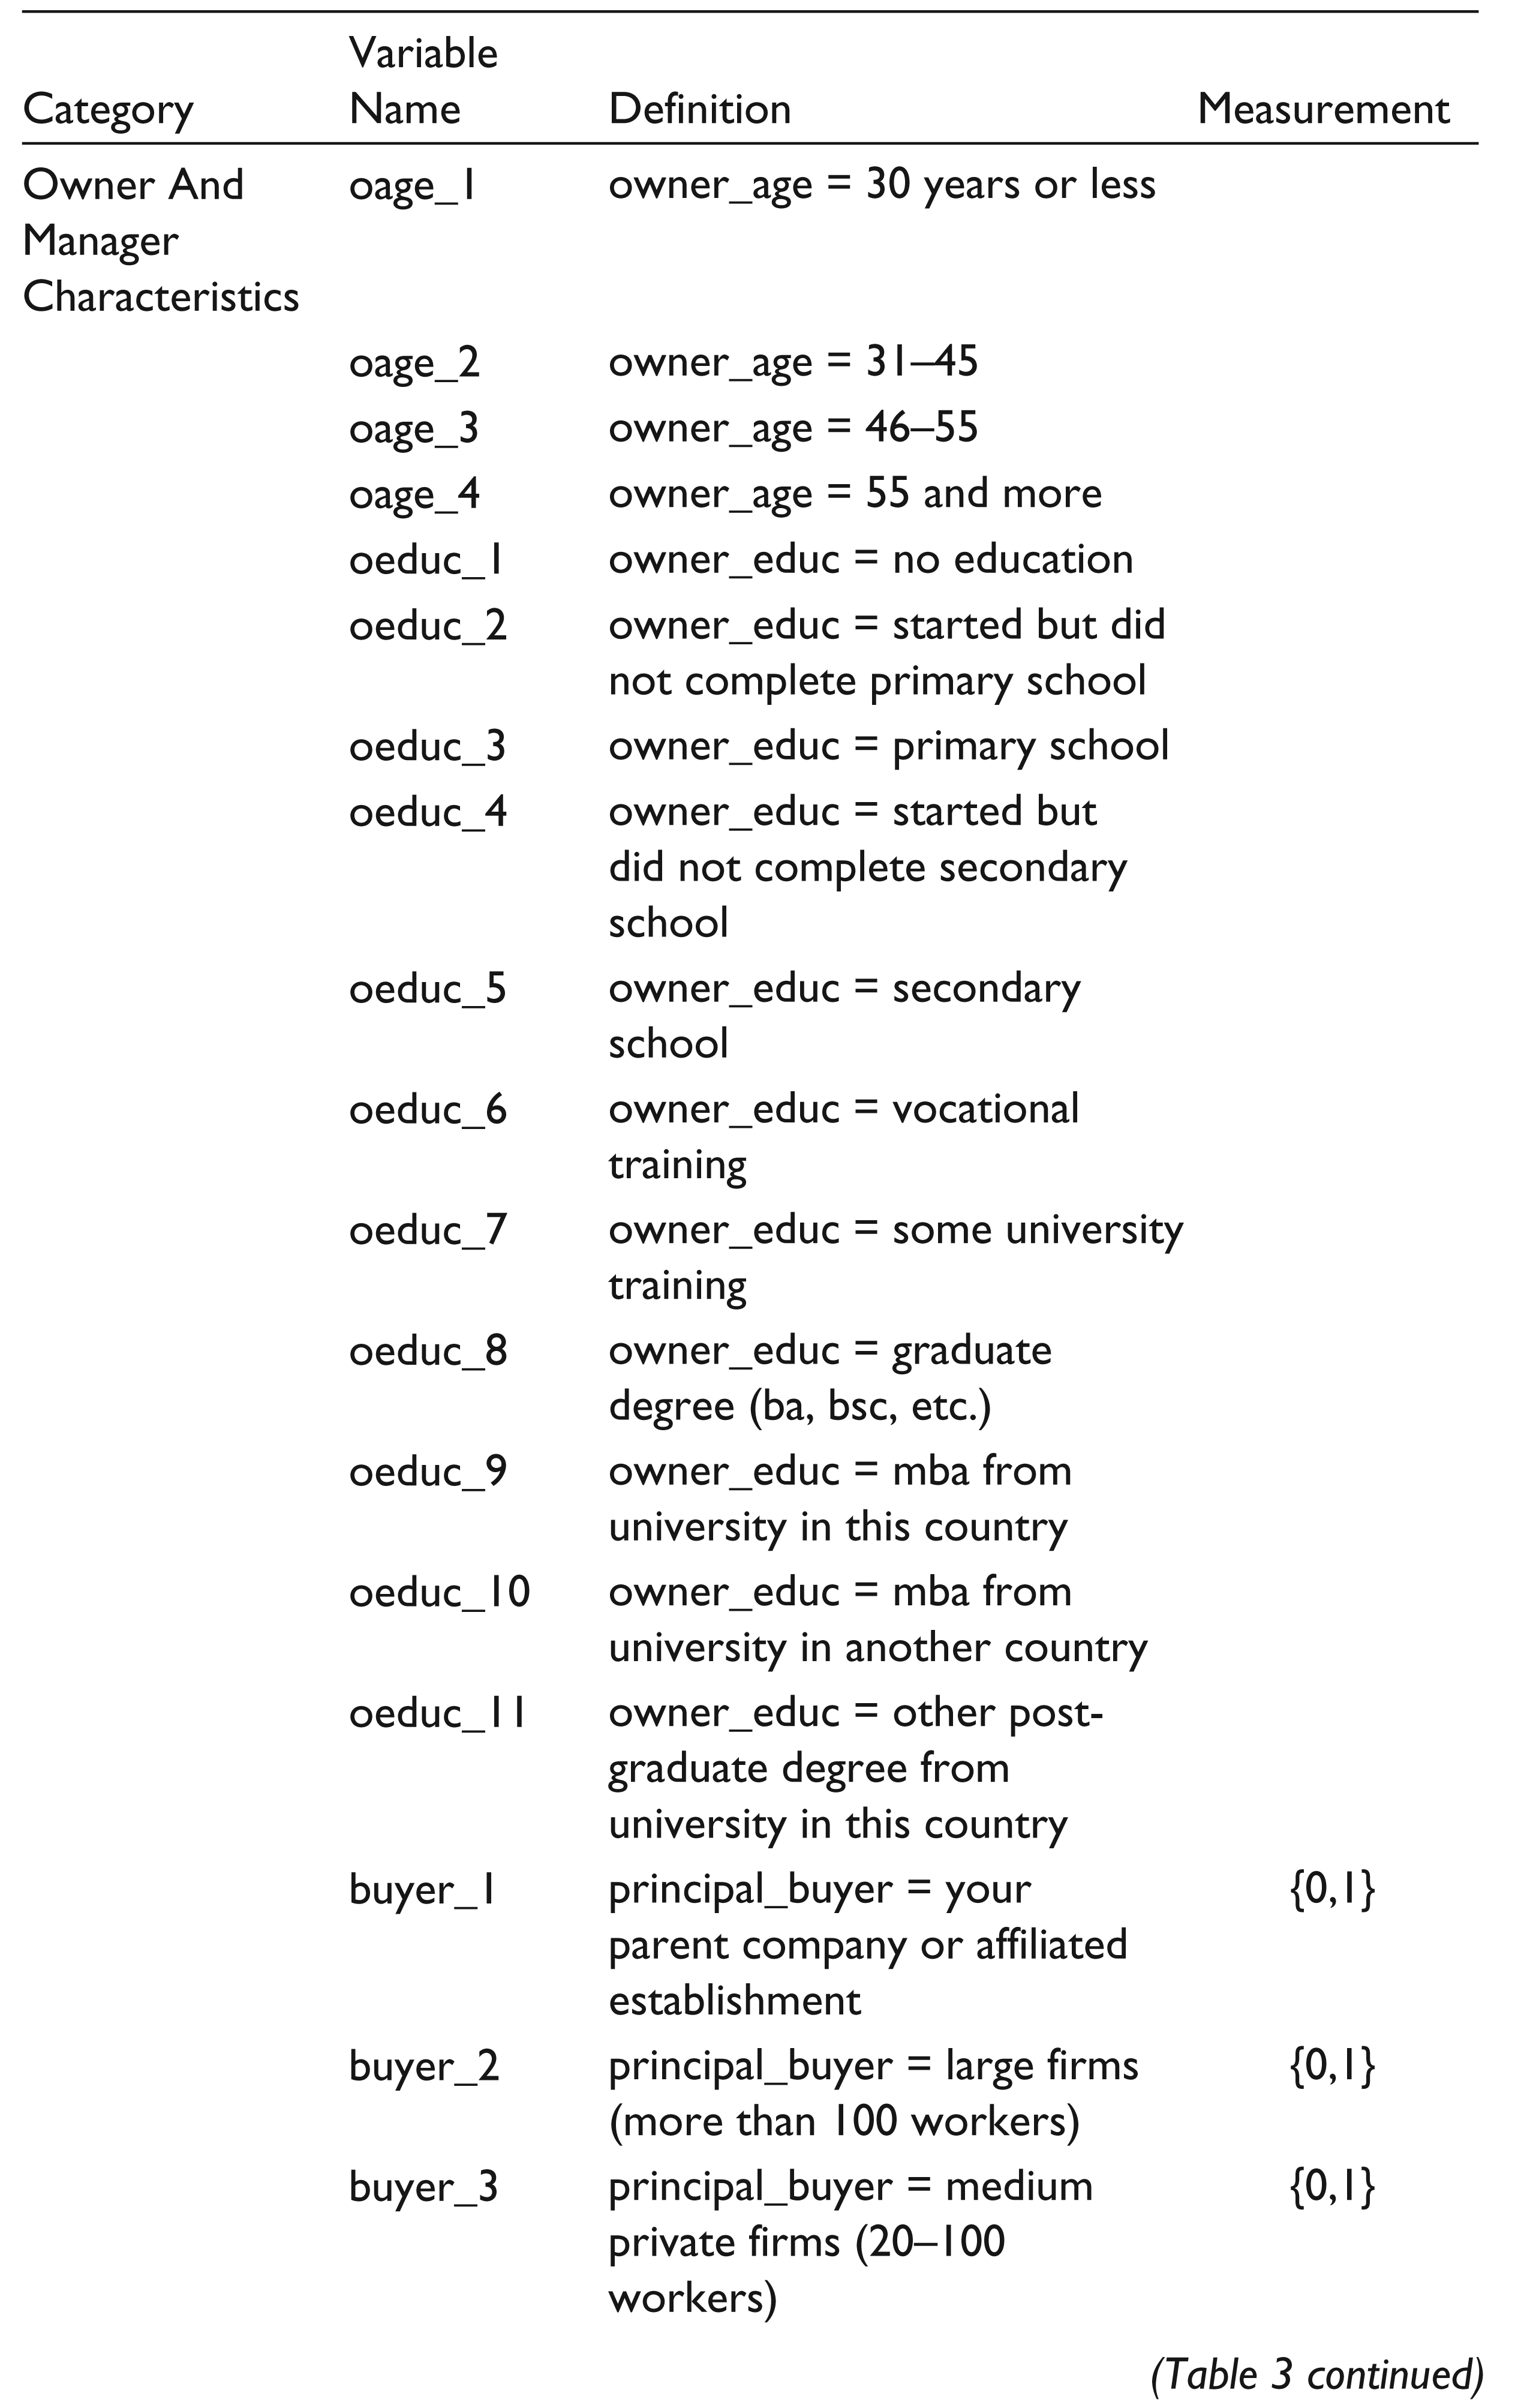
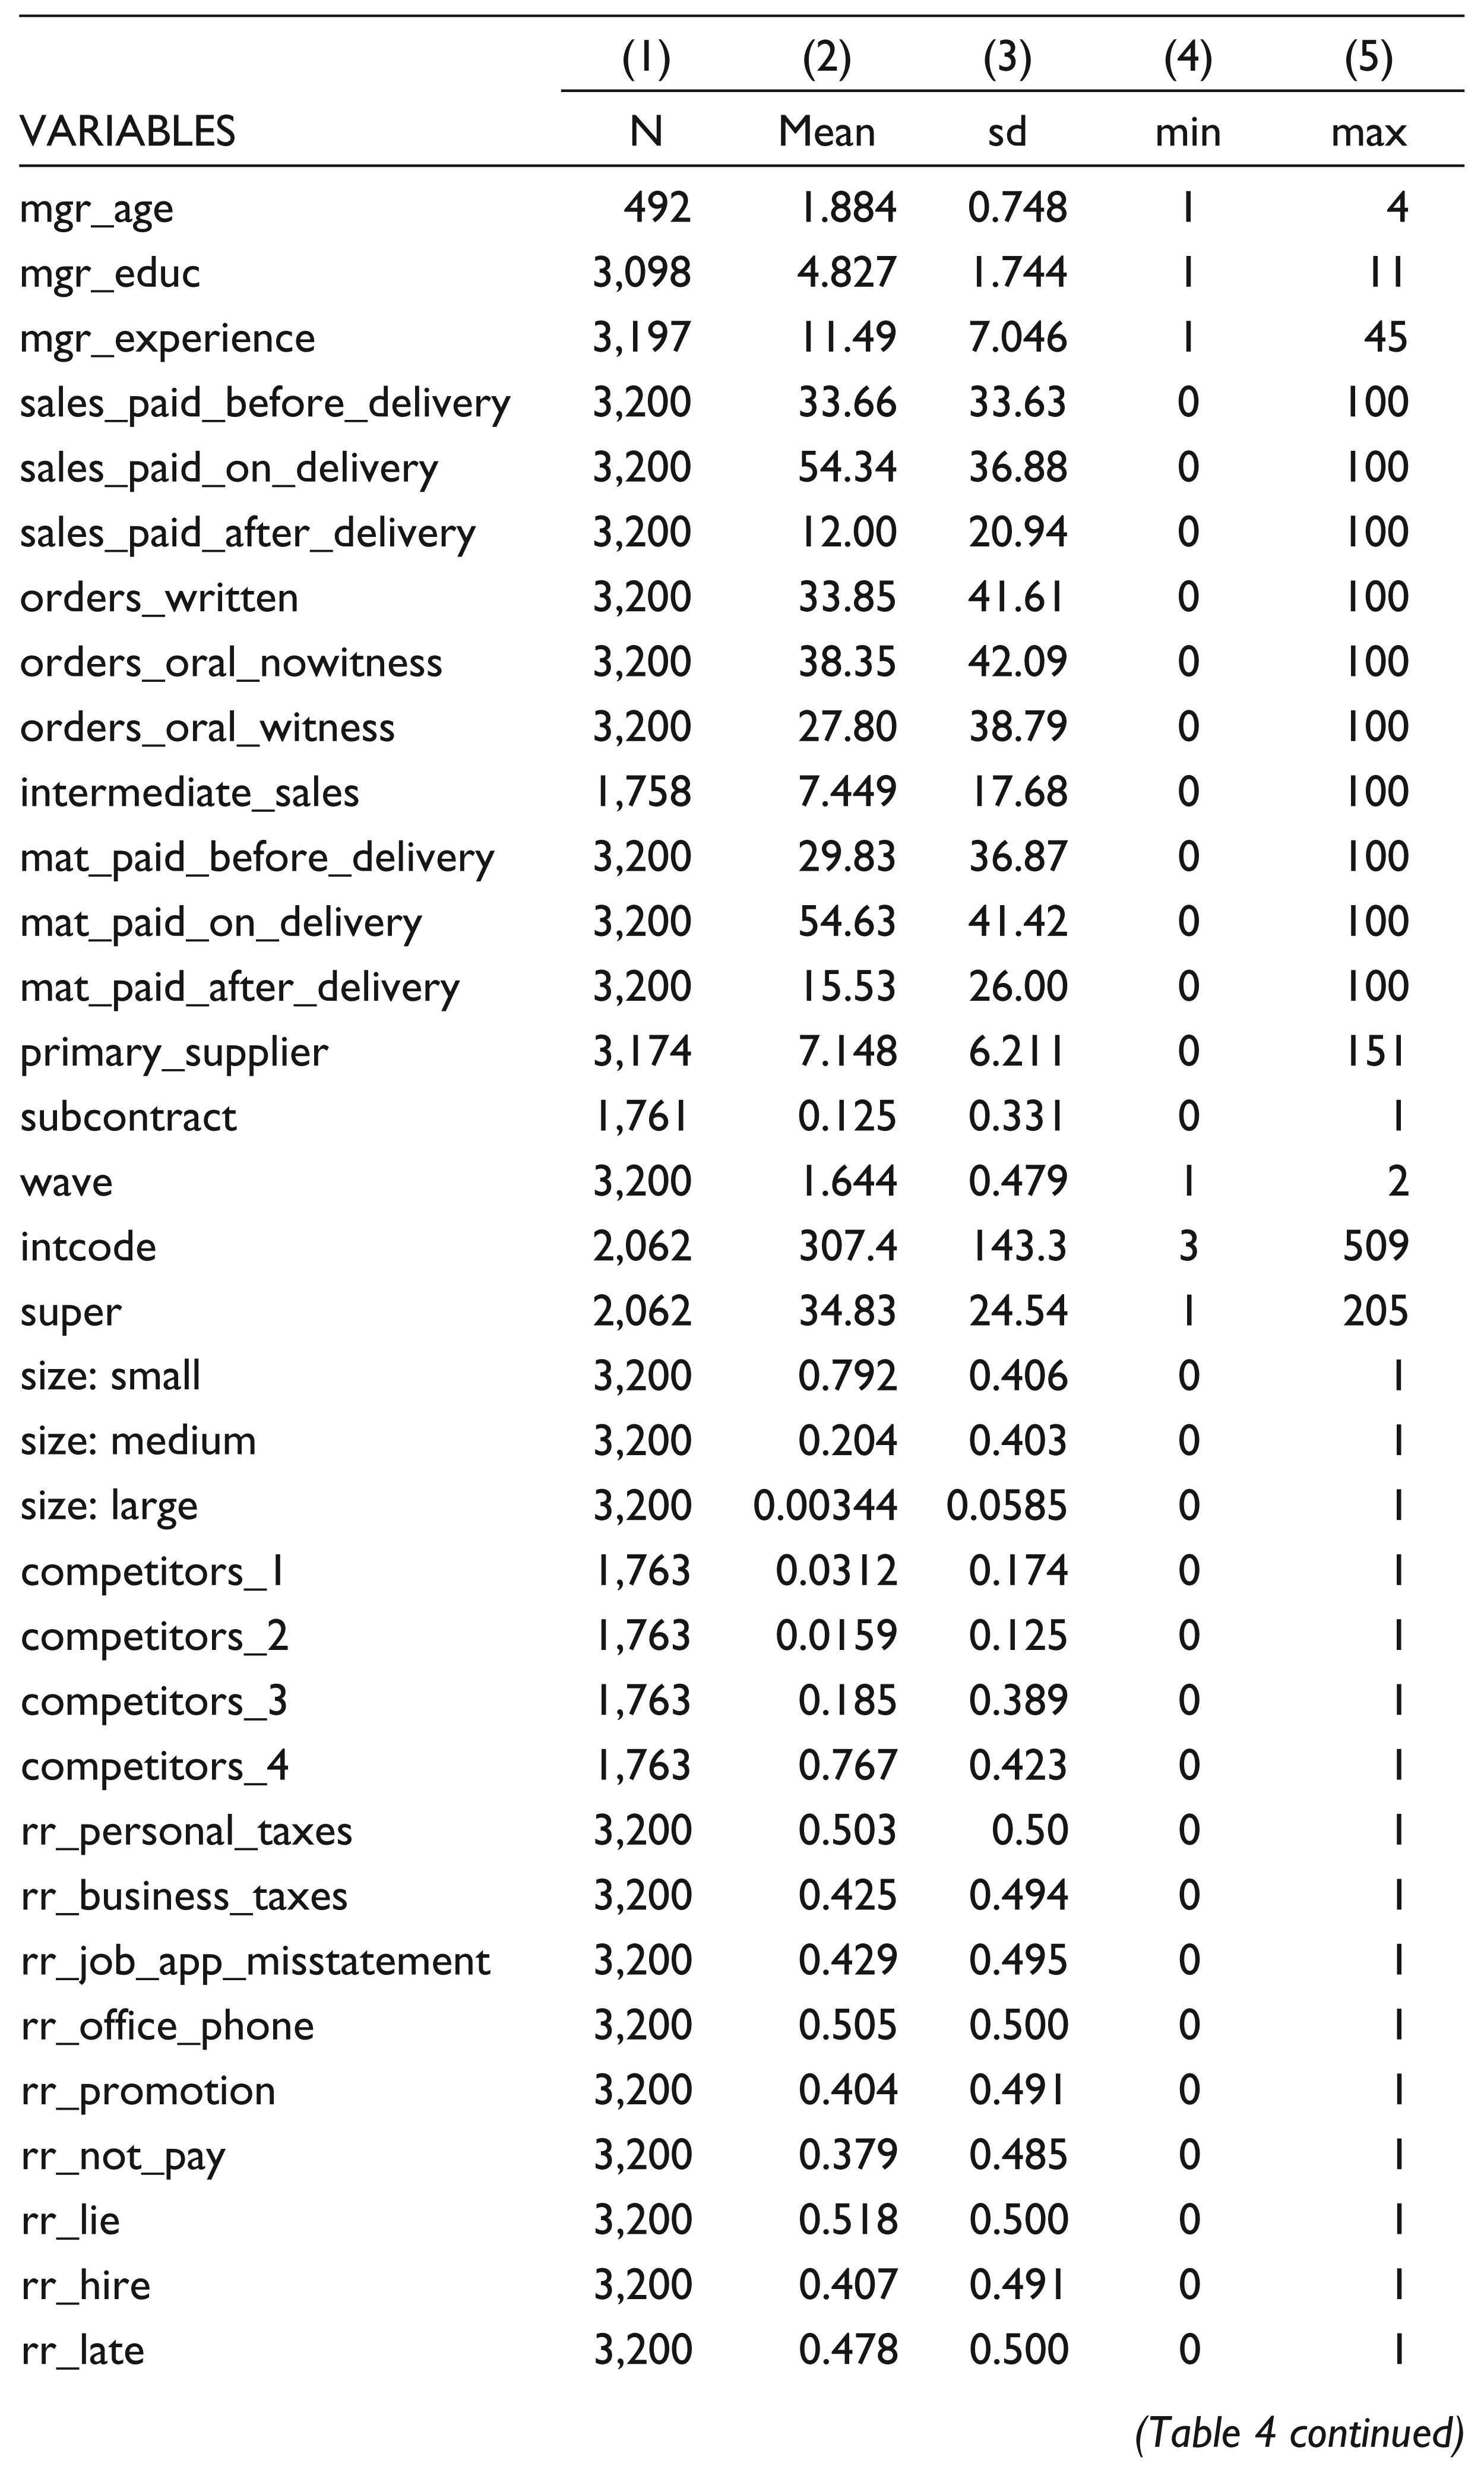
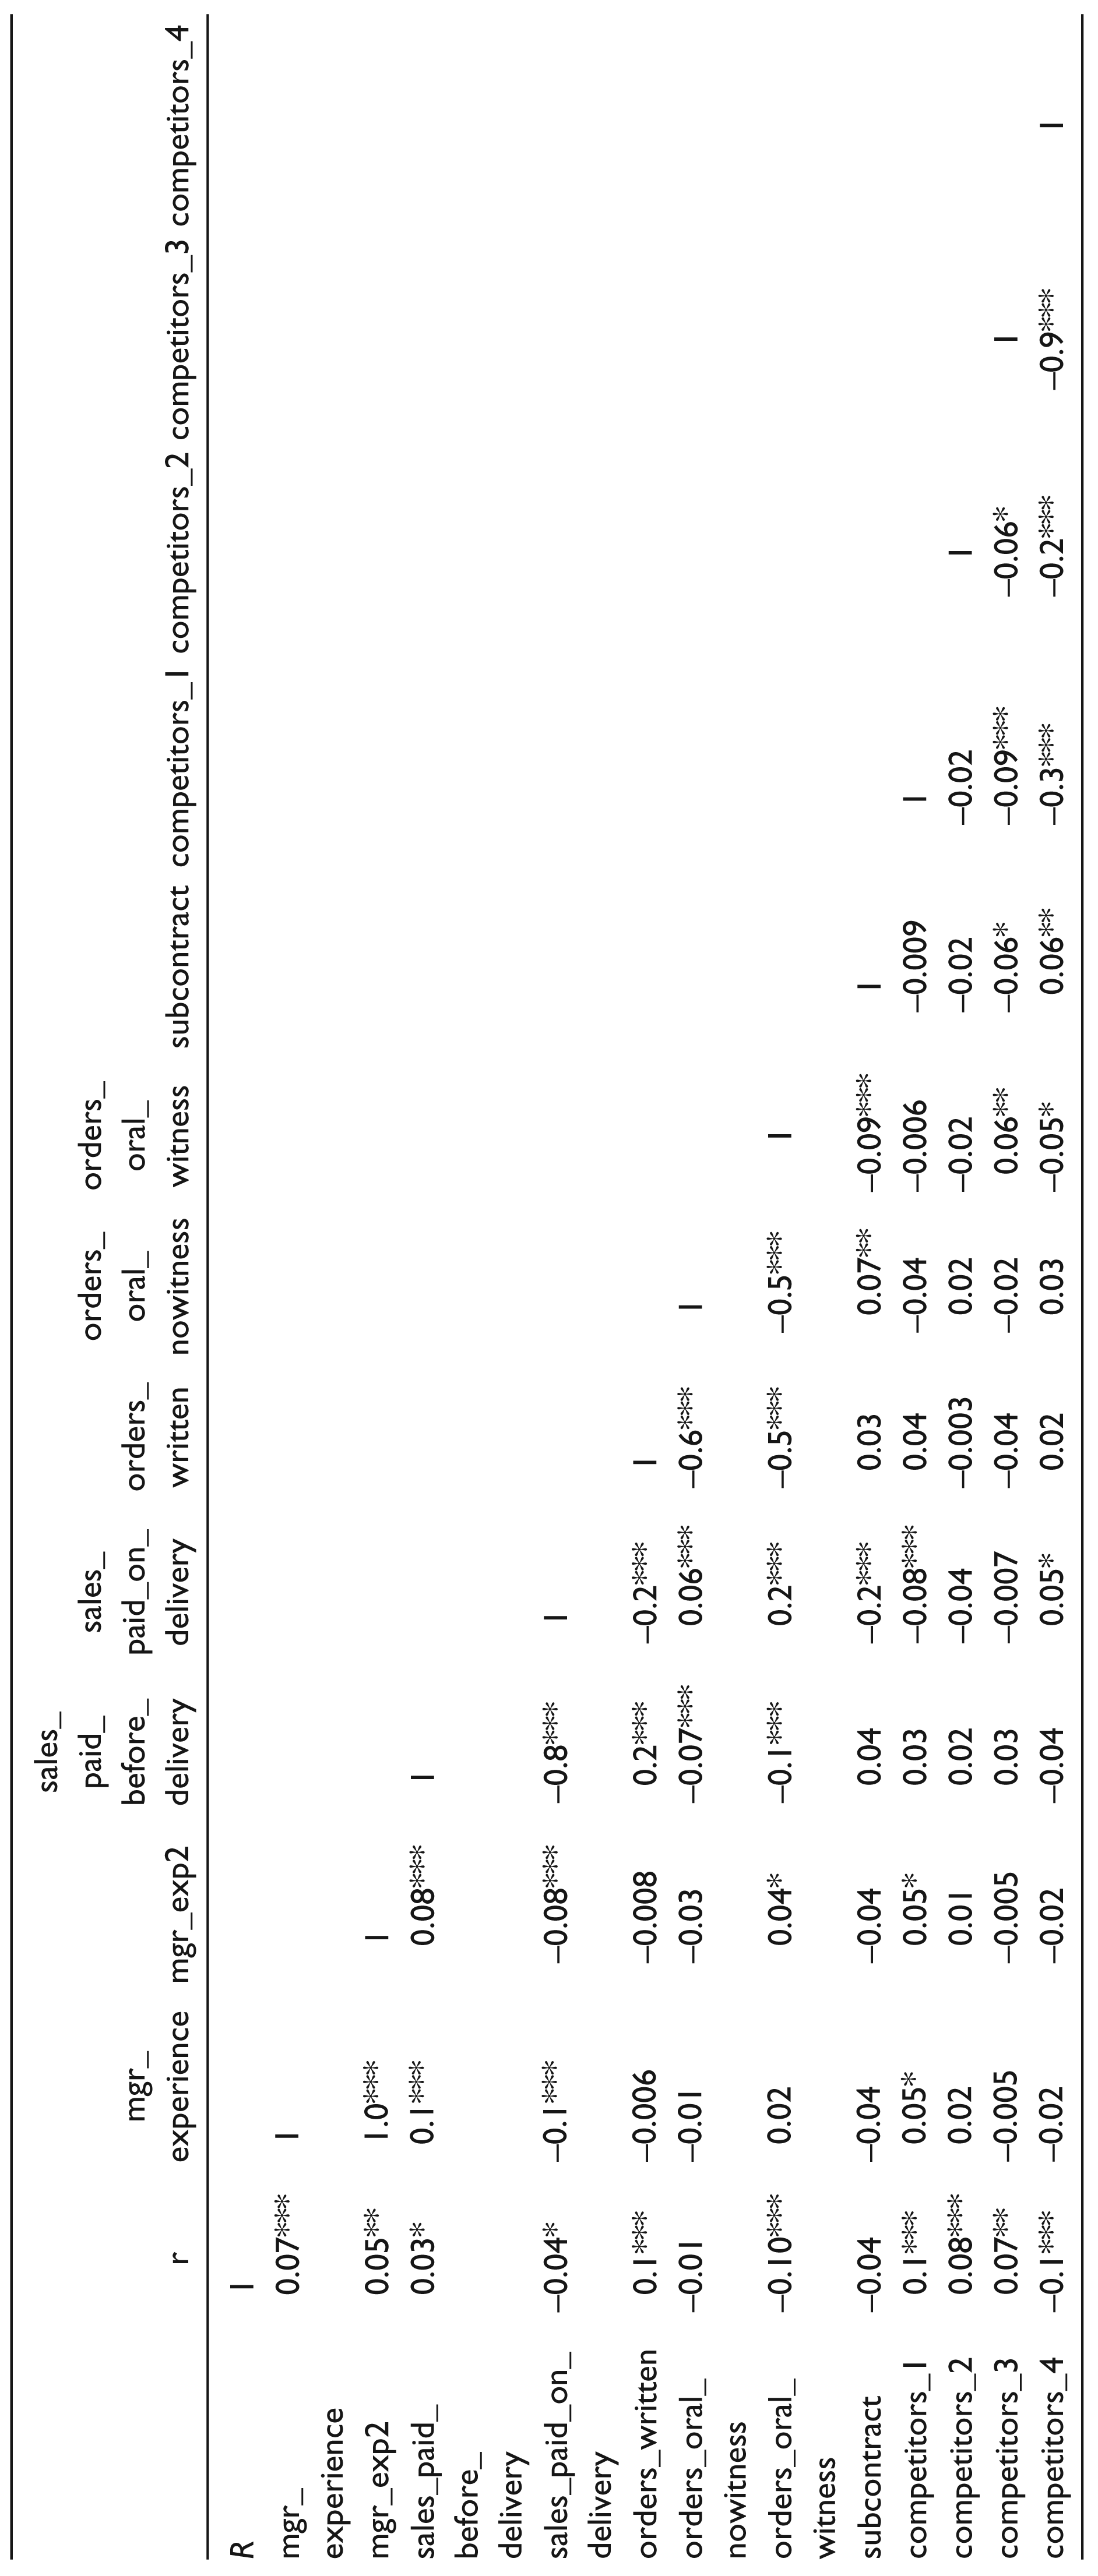
This section describes the data used in this study. The data used in this study comes from wave 1 and wave 2 of the World Bank Enterprise Survey for Nigeria, conducted in 2007/2008 and 2008/2009, respectively. The data set used in this study is the same data set that was used in Clausen et al. (2010). Descriptions of the variables used in the analysis and summary statistics are provided in the appendix. Tables 1, 2 and 3 contain descriptions of the data. Variables include owner and manager characteristics, the nature of contracts—the variables relating to trust, the RR questions and the created RR variables. Tables 4 and 5 show summary statistics for the data. Table 6 shows a correlation matrix for some of the variables used in this study.
Trust and Experience in the Business Environment
This study uses three variables as the main measures of trust. These are the percentage of total orders that are written, as opposed to oral with a witness and oral without a witness; the percentage of material orders that are paid for after delivery, as opposed to on delivery or before delivery; and the percentage of sales orders that are paid for before delivery, as opposed to on delivery or after delivery. These variables are chosen because they seem to represent things that a non-trusting company should care about.
This study also uses a dummy variable for whether or not a company subcontracted any part of its production process to another company. Subcontracting work to another company arguably requires a level of trust that the company will perform the work and do it to a certain standard. Also, the number of years that the company has known the primary supplier for its main input is used as an explanatory variable. This is meant to denote the level of mistrust. The years of experience of the senior manager and its squared term are also used to see the effect on reticence of business experience.
In addition, the previously mentioned measures of trust are also measures of whether others trust the manager. For example, whether the managers use a written contract will depend on how much the firm manager trusts the suppliers and how much the suppliers trust the firm managers. In general, for the variables that are used in this study, the trust of the manager towards other managers and the trust of other managers towards the managers are negatively correlated with each other. A manager who is less trusting is more likely to pay for a purchase order (provide a sales order) after receiving the goods (money) whereas the receipt of payment after provision of goods (payment of money before receiving the goods) is a signal of a trusting supplier of goods (purchaser of goods). Nevertheless, the measures of trust used in this study do not relate to trust in an individual supplier.
Data Description

Data Description


Data Description

Level of Anonymity and the Fear of Detection
One reason for reticence might be the fear of detection. Reticent companies might, arguably and irrationally, reason that the answers from the RR procedure might be used against them somehow. If so, since the surveys were carried out anonymously, the possibility of detection would be related to the possibility that the firm could be identified by observables. One of these is the number (population) of other companies in the industry-location cell. On the one hand, if a company is the only chemical manufacturing business in Bauchi state, then it might fear that this fact might make it identifiable. On the other hand, if a company is one of a 100 wood manufacturing businesses in Lagos, then it might be more at ease with answering sensitive questions, since the possibility of detection, as described above, would be reduced.
Summary Statistics


Summary Statistics

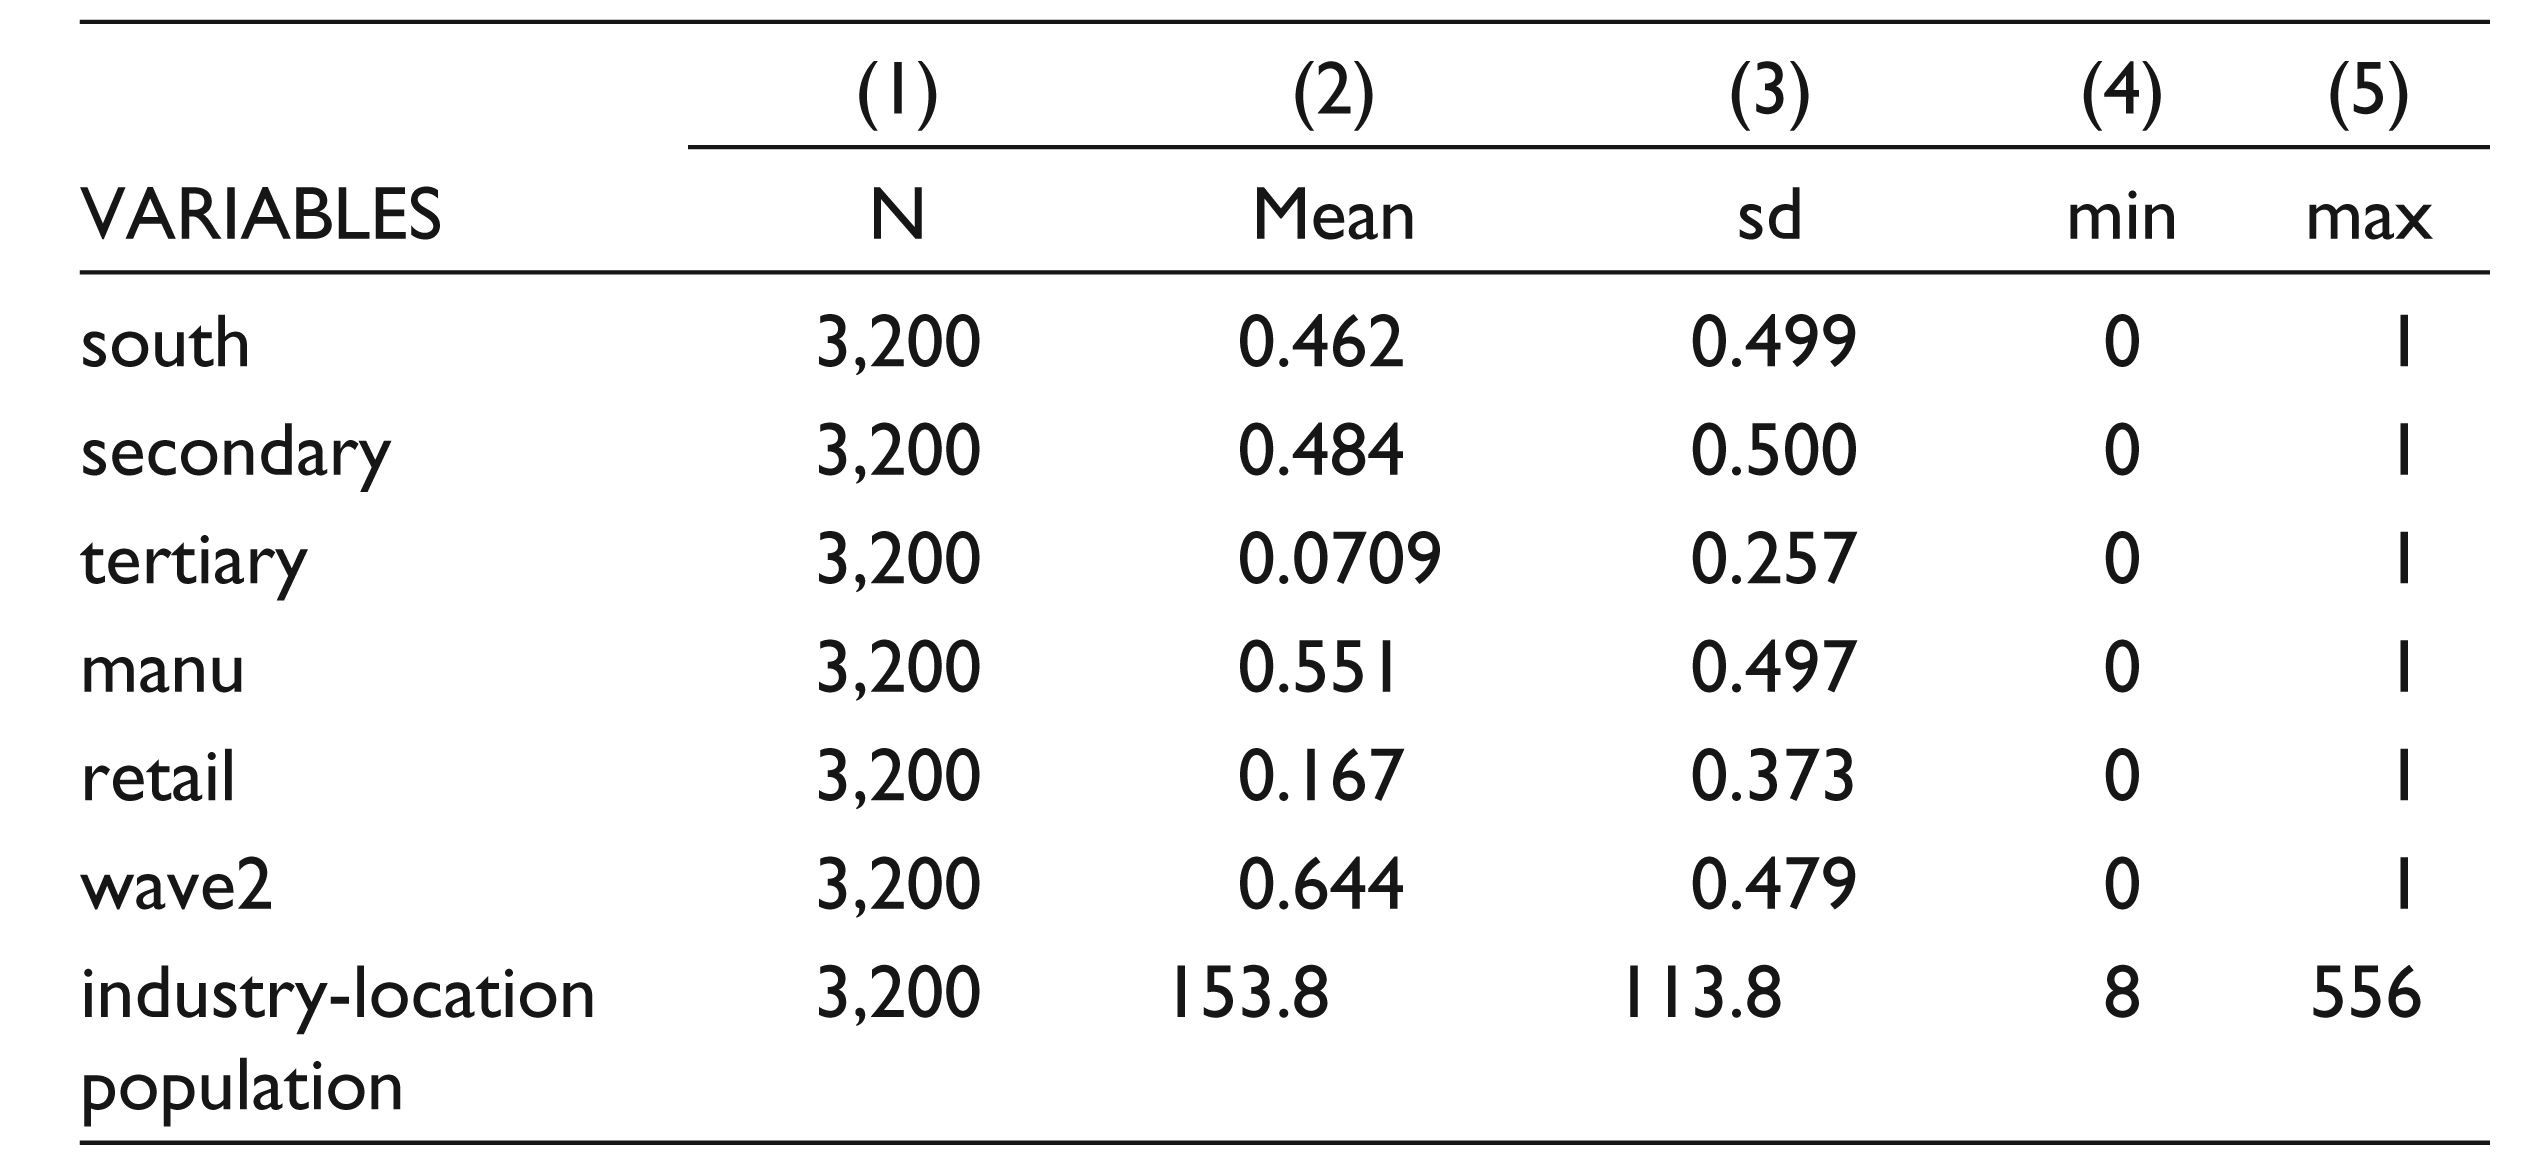
The preceding analysis suggests the use of the number (population) of companies in the industry-location cell as a variable to measure the level of identifiability of the company. The preceding analysis suggests that the larger the population of companies, the lower the propensity to be reticent. This study also includes the number of close competitors, as reported by the company itself, as an explanatory variable. Due to the fact that this variable is self-reported by the company, it might be more closely related to reticence than the total population of firms. The total population of firms is, arguably, less known to the individual company than the number of close competitors. Also, the total population in the industry-location cell might include somewhat different companies in terms of both product and location.
Empirical Methodology
Misclassification of Reticence
The definition of reticence is an interviewee that answers ‘No’ with a positive probability when they are supposed to answer ‘Yes’, when doing so might be interpreted as them having committed a socially undesir- able act. This definition does not require that reticent interviewees always give an untruthful response, but that they do so on at least some occasions. In practice, the measure of reticence that is used is the number of ‘Yes’ responses on a series of RR questions. An interviewee with zero Yeses is classified as reticent, and an interviewee with at least one Yes is classified as possibly candid.
Correlation Matrix
Choice for Each Manager
One potential problem with trying to find the causes of reticence is that the traditional measure of reticence might be misclassified. Labelling all firms which answer ‘No’ all the time as reticent and the rest of the sample as possibly candid potentially misclassifies some of the reticent as possibly candid. This can be described using the latent variable specification of a binary outcome model (Greene, 1990; McFadden, 1984) and the notation of Hausman, Abrevaya and Scott-Morton (1998), where

where is an independent and identically distributed error term. The observed response can be represented as follows:

where
This study first focuses on the type of misclassification in which the misclassification error depends on the true response,
The definition of reticence used previously can be represented as follows:
Tabulation of Sum Score and Median Level of Education of Largest Shareholder of the Companies


where r represents reticence and s is the number of Yeses to a series of randomised response questions. This criterion has the possibility that some firms are misclassified as 0 (possibly candid) when in fact they should be 1 (reticent). In such a case, where some 0s should be 1s:

where α1 is the false-negative misclassification error. Due to the relatively sensitive nature of the questions and the relatively low probability of getting seven tails from seven coin flips and being innocent of all acts, this study argues that the alternative misclassification error is not significantly different from zero:

Despite this, the false-positive misclassification error α0 will be incorporated into the analysis and tested for significance.
In the standard case of misclassification of a binary dependent variable, the expected value of the observed dependent variable is:

where F is the cumulative distribution function of . The probability of observing a zero is given by:

which collapses to the usual respective expressions:
In the present set-up, the measurement error is negatively correlated with the accurately measured variable; therefore, the classification error will lead to a downward bias in the estimates of the effect of x on y true (Bound, Brown, & Mathiowetz, 2001). To see this, note that the marginal effect of an explanatory variable on the observed response is as follows:

which is always less than the marginal effect on the true response,
The parameters α0, α1and β can be estimated via the maximum likelihood method by maximizing:

with respect to α0, α1and β.
An additional condition is required for identification of the parameters in the model. This condition, the monotonicity condition, states that the sum of the misclassification errors must be less than 1.
Monotonicity Condition (MC1): α0 + α1 < 1.
This can be seen when considering a symmetric function F where F (d) = 1 – F (– d).
Defining: ᾶ0 = 1 – α1, ᾶ1 = 1 – α0 and
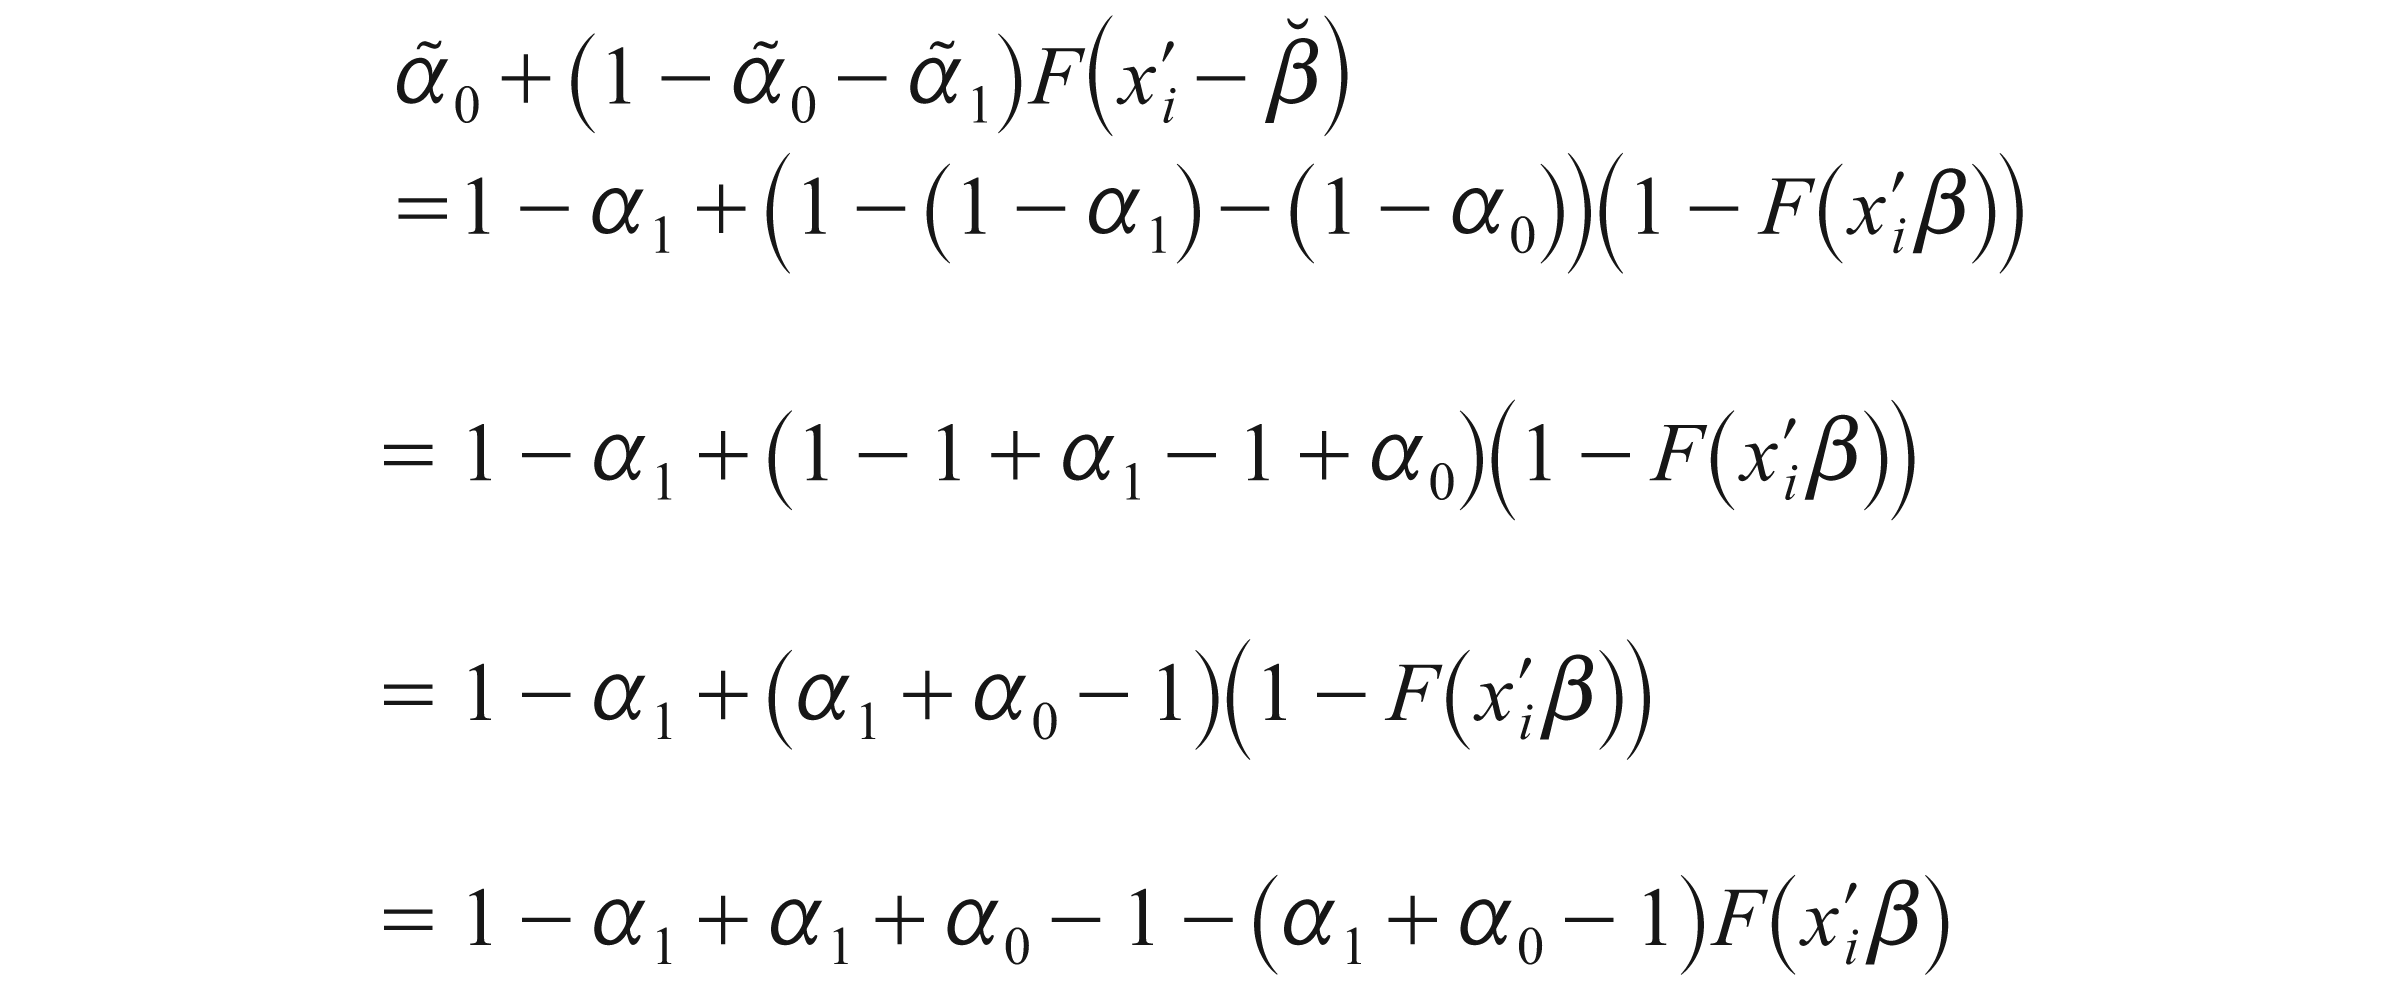

Therefore, any estimators based on Equation (1), such as maximum likelihood and non-linear least squares, cannot distinguish between (α0, α1 and β) and (1 – α1, 1 – α0, and – β ). MC1 rules out this possibility because if α0 +α1 < 1, then (1 – α1) +(1 – α0) > 1.
Since this study argues that α0 is not significantly different from zero, the MC1 condition implies that α1 < 1, which appears to be reasonable. The only way in which this could be violated is if α1 = 1, which does not agree with the data since the actual distribution of ‘Yes’ shows that more Yes are observed than expected under the angels assumption; therefore, at least some respondents appear to be answering truthfully. Using this result, it appears that the MC1 is satisfied in this study and the parameters (α0, α1 and β) can be identified using maximum likelihood estimation.
Empirical Results
This section looks at the empirical results of the analysis. Summary statistics from the data are discussed here. Results from an econometric exercise that models the propensity to be reticent are also analyzed.
Education: Lack of Understanding about the Probability of Detection
Results comparing profit levels amongst different sum score categories are shown in Table 9. Mean profit amongst reticent firms was 4,393,000 Naira and median profit amongst the same set of firms was 1,544,000 Naira. Both values are below the averages for the entire sample of 4,414,000 Naira and 1,713,000 Naira, respectively. On average, reticent firms have lower median and mean profits than possibly candid firms which said ‘Yes’ once. Both mean and median profit averages for reticent firms sit around the centre of the distribution of profits for all firms. These results provide evidence against the idea that the reticent firms have more to lose by revealing their business malpractices. Once again, these differences in profits disappear when controlling for the age of the owner, region, wave and industry; thus profits are not included in the probit analysis in Table 9.
Tabulation of Sum Score and Profit (N’000) Levels
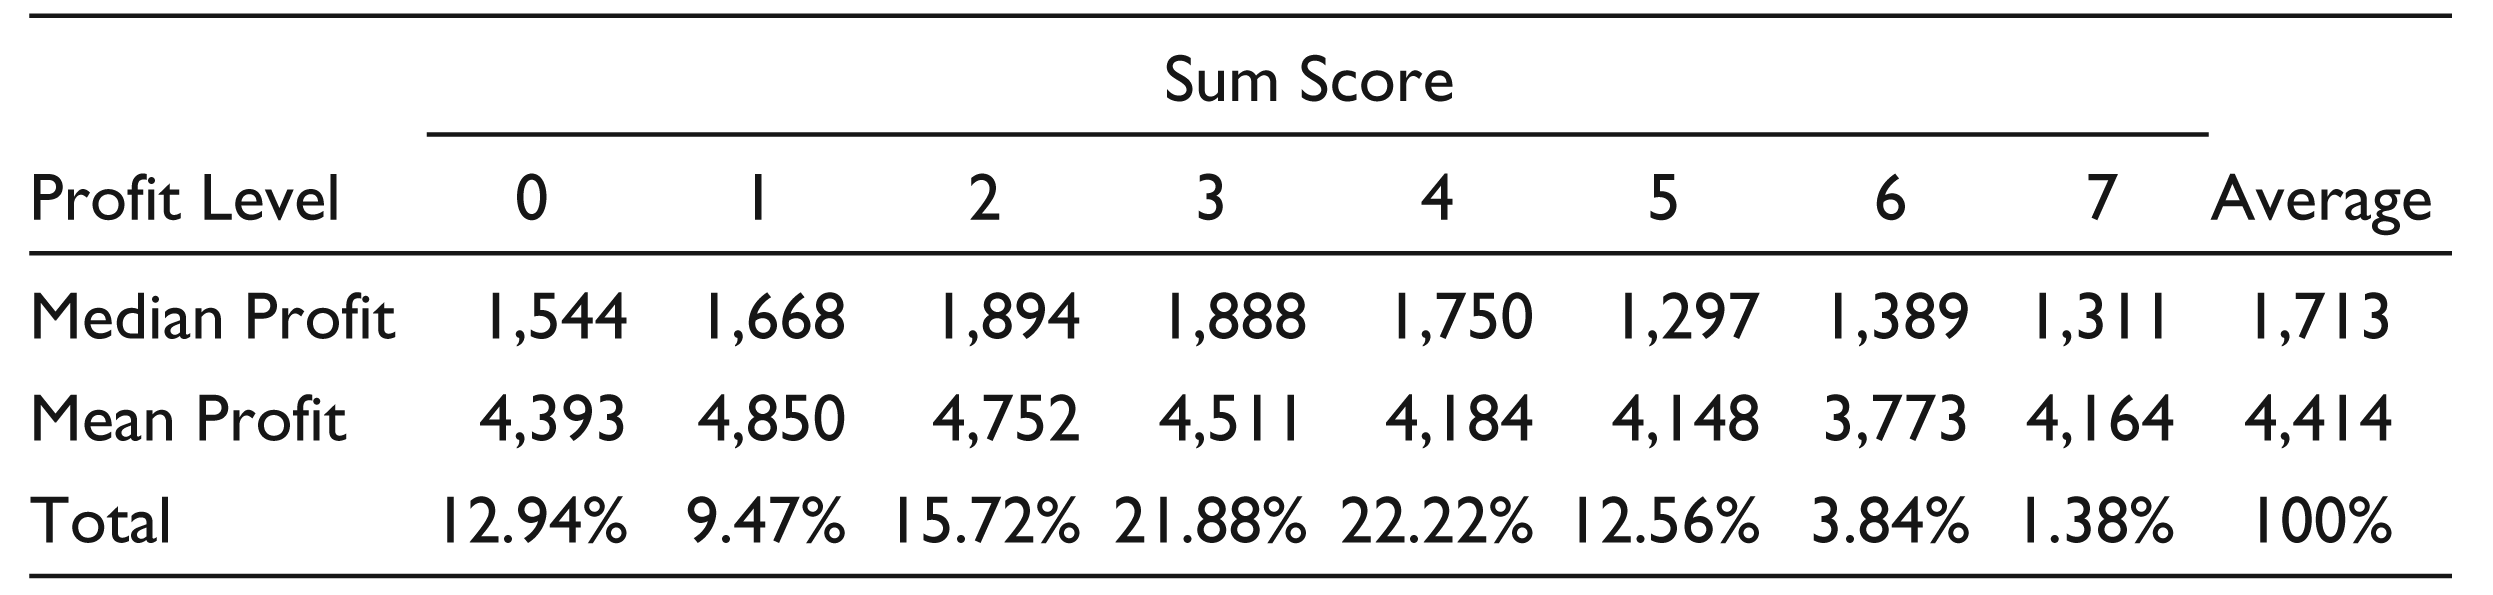
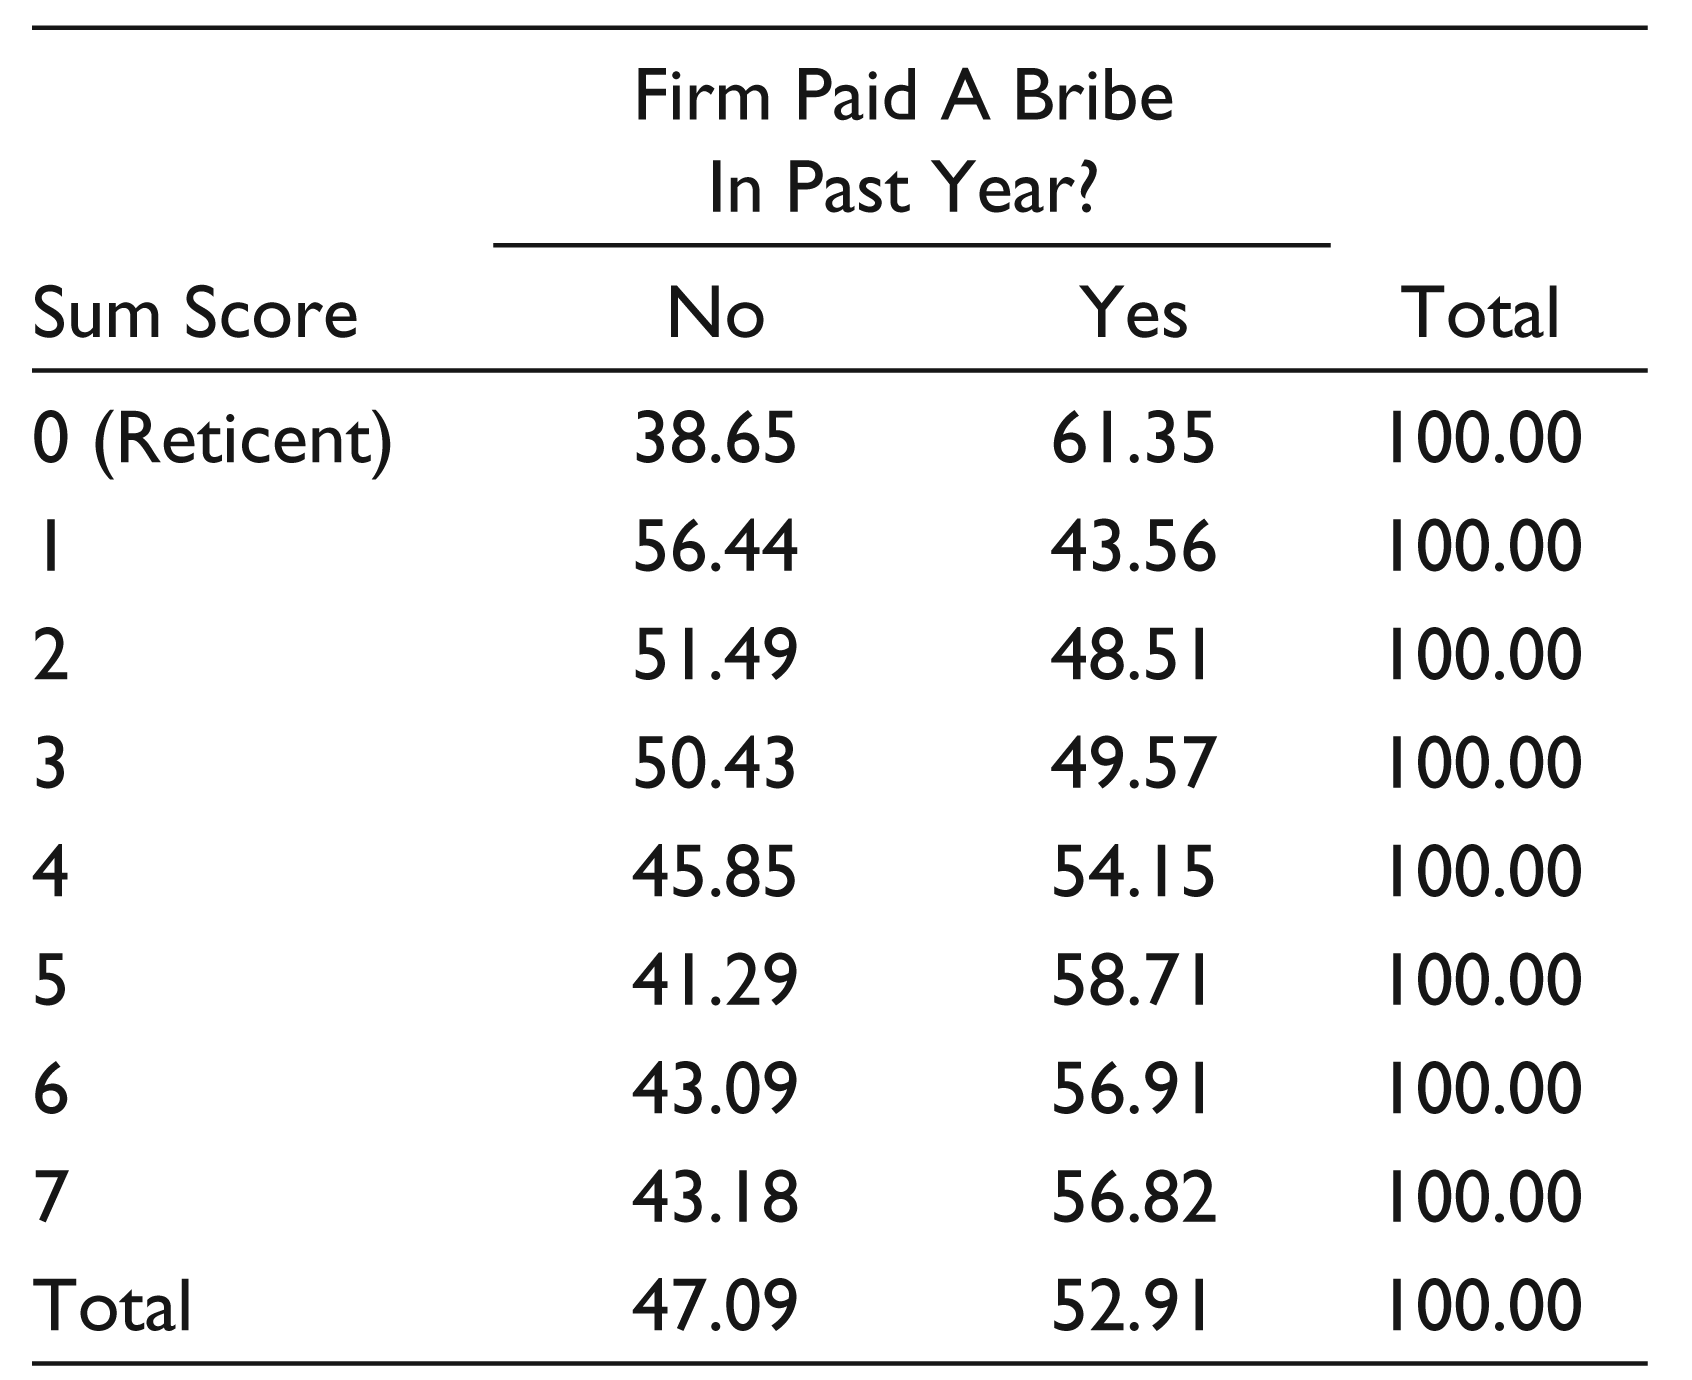
Table 10 investigates the idea that reticent firms are the guilty hiding their guilt. The results tend to refute this claim. Reticent firms are more likely to admit to engaging in bribery than all other (possibly candid) firms. This result remains when looking at all other firms as one group and when separating firms by their sum score. 61 per cent of reticent firms admitted to paying a bribe; this figure is significantly higher than the average of 53 per cent for the entire sample. Thus, it appears that firms are reticent for a reason other than trying to hide their guilt.
Tabulation of Sum Score and Bribery
Summary Statistics
Summary statistics for trust-related variables are shown in Table 11. Different sets of variables are presented within this table. The first set of variables relate to the companies’ orders. Companies were asked to state the percentage of their customers’ purchase orders that were written; oral, with a witness; and oral, without any witnesses. These respective percentages add up to 100 per cent. The second set of variables relate to the annual purchase of material inputs made by the companies. The companies were asked to state the percentage of total annual material inputs or services that were paid for before delivery, on delivery and after delivery. These percentages also add up to 100 per cent. The next set of variables relate to the sales of the establishment. Companies were asked the percentage of sales that were paid for before delivery, on delivery and after delivery. These percentages also add up to 100 per cent. Companies were also asked if they subcontracted any part of their production to another company. Finally, the survey asked the companies the number of years that they had known the primary supplier of the main input used in their production process.
The summary statistics in Table 11 are presented separately for the reticent and the possibly candid. On average, 45.3 per cent of the purchase orders from reticent companies are written. This is in comparison to 32.1 per cent for the possibly candid set of companies. Therefore, using this as a measure of trust, reticent firms seem to trust other companies less than possibly candid firms. The last column shows that the average ratio of written orders to oral-with-witness orders for reticent firms is 2.43,whereas the same ratio for the possibly candid companies is 1.05. This tends to suggest that the reticent are more cautious in their business transactions than the possibly candid group.
Means of Trust-related Variables, by Reticence
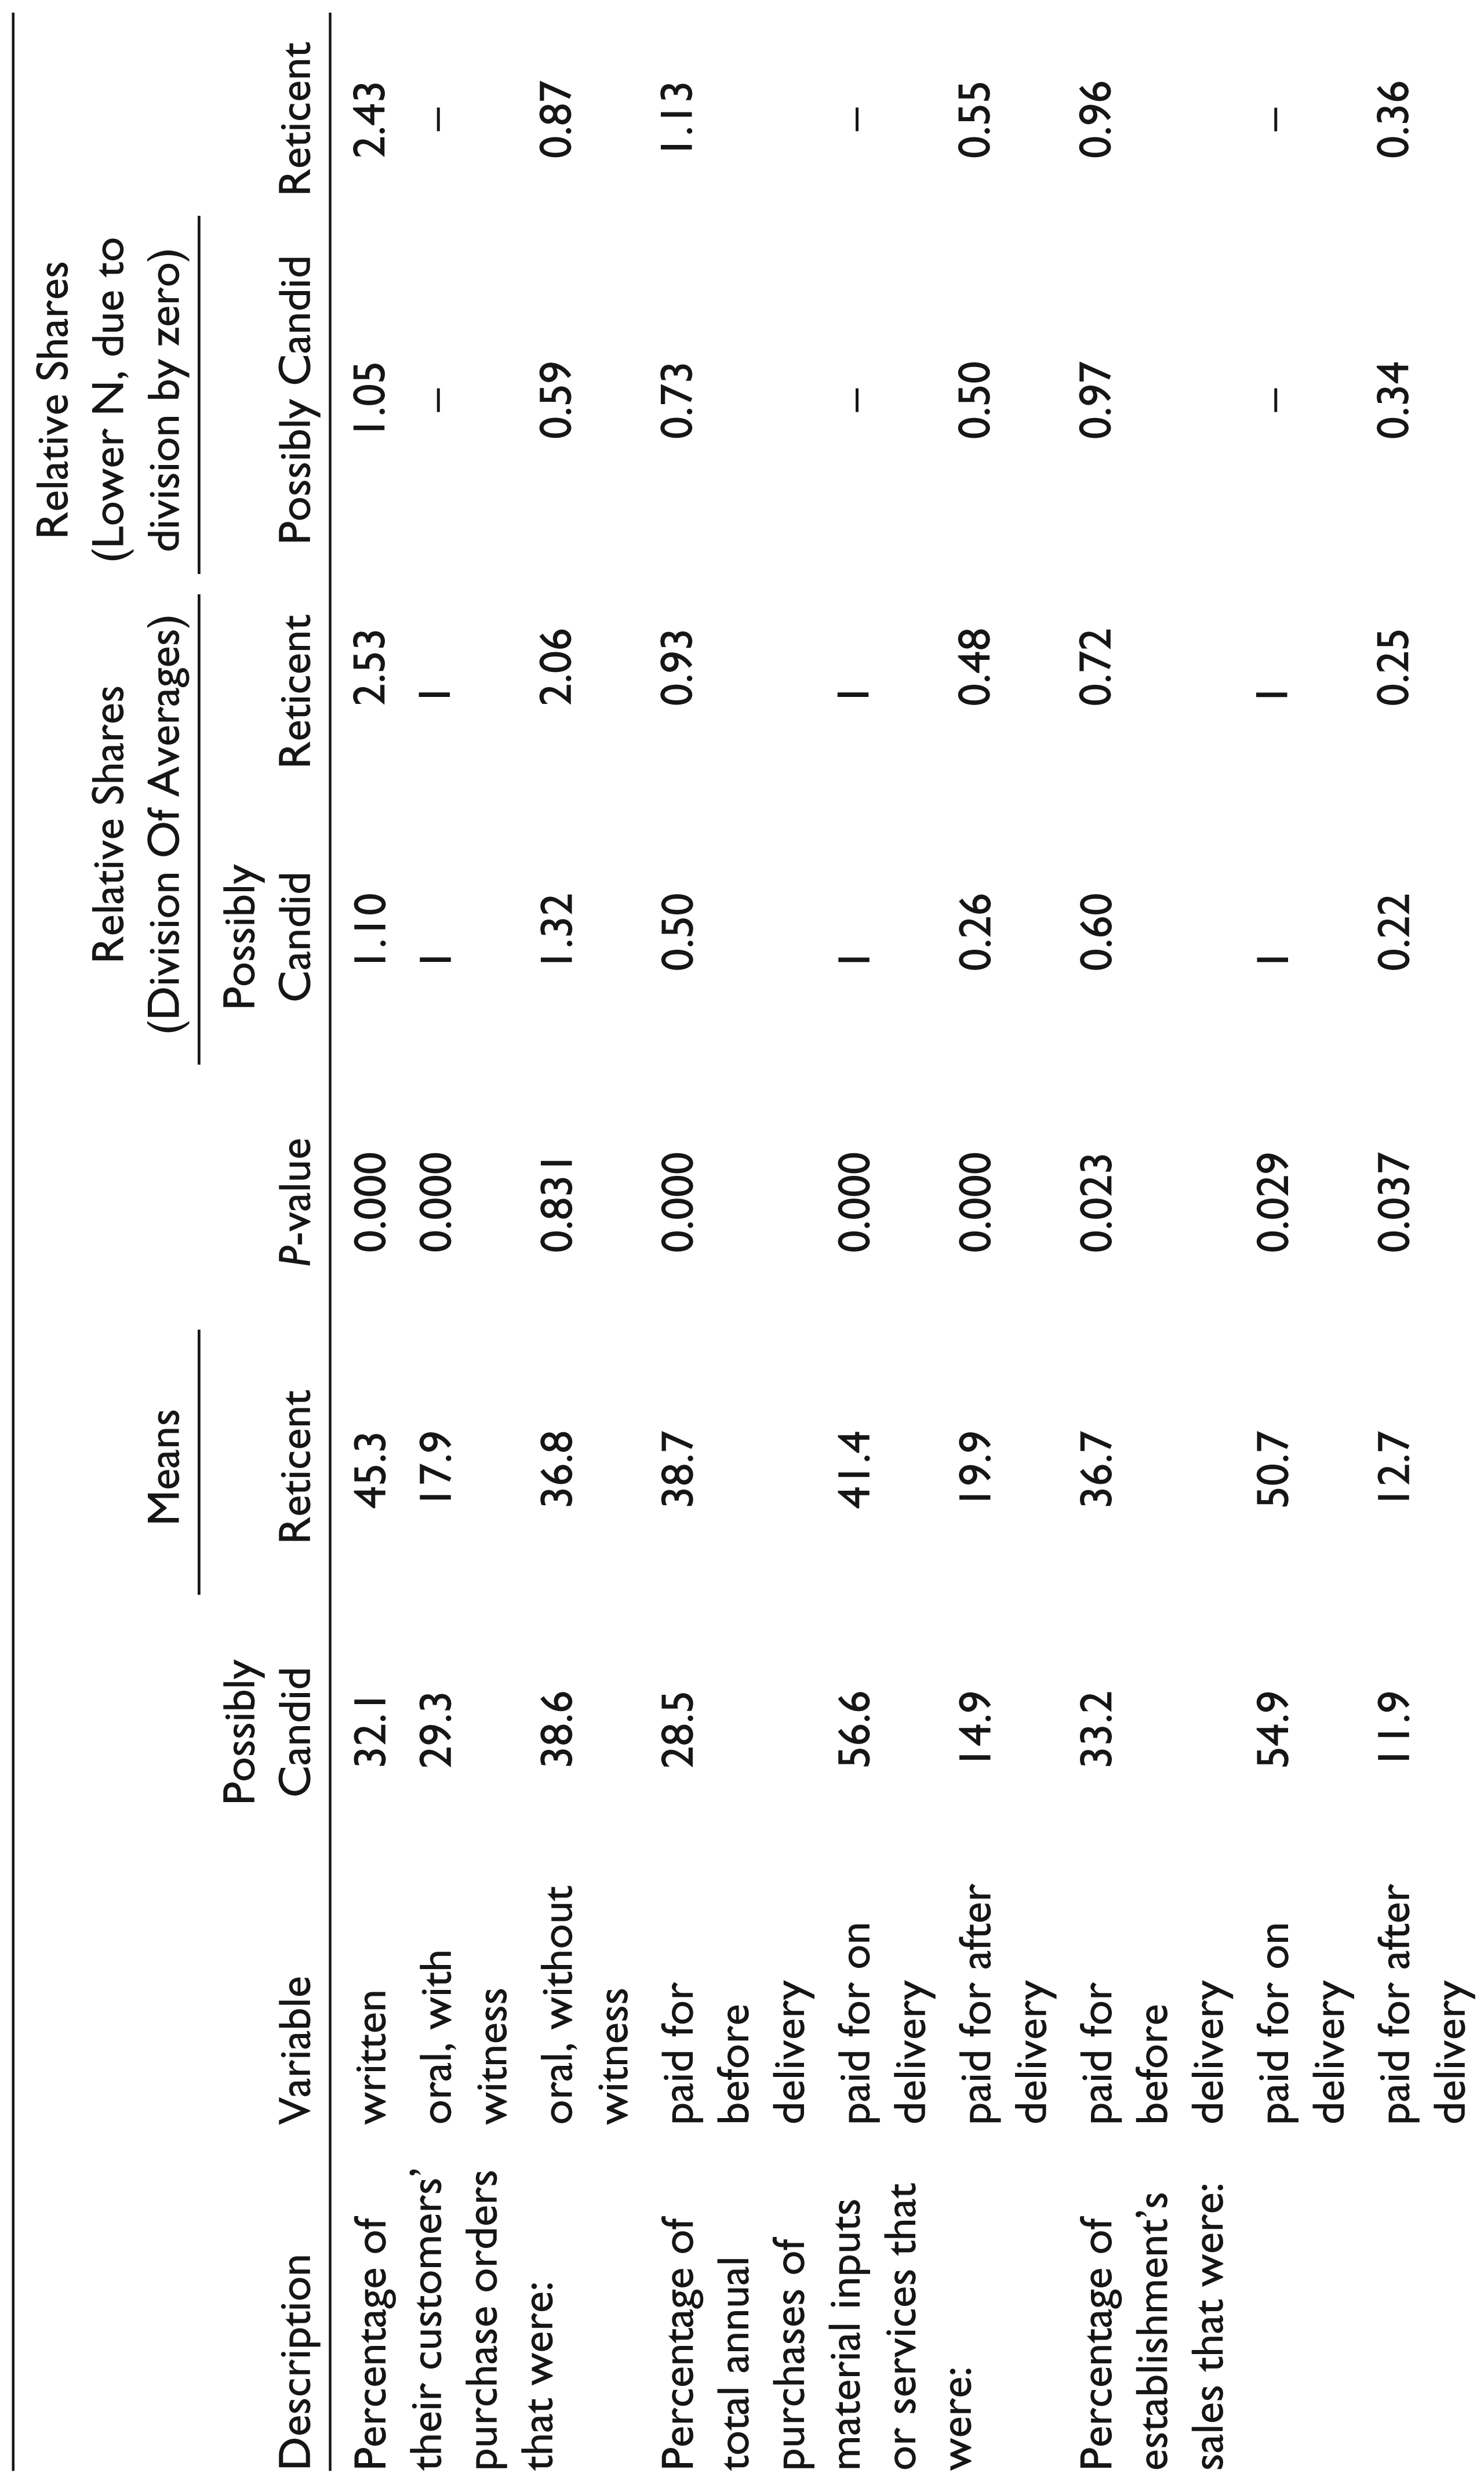
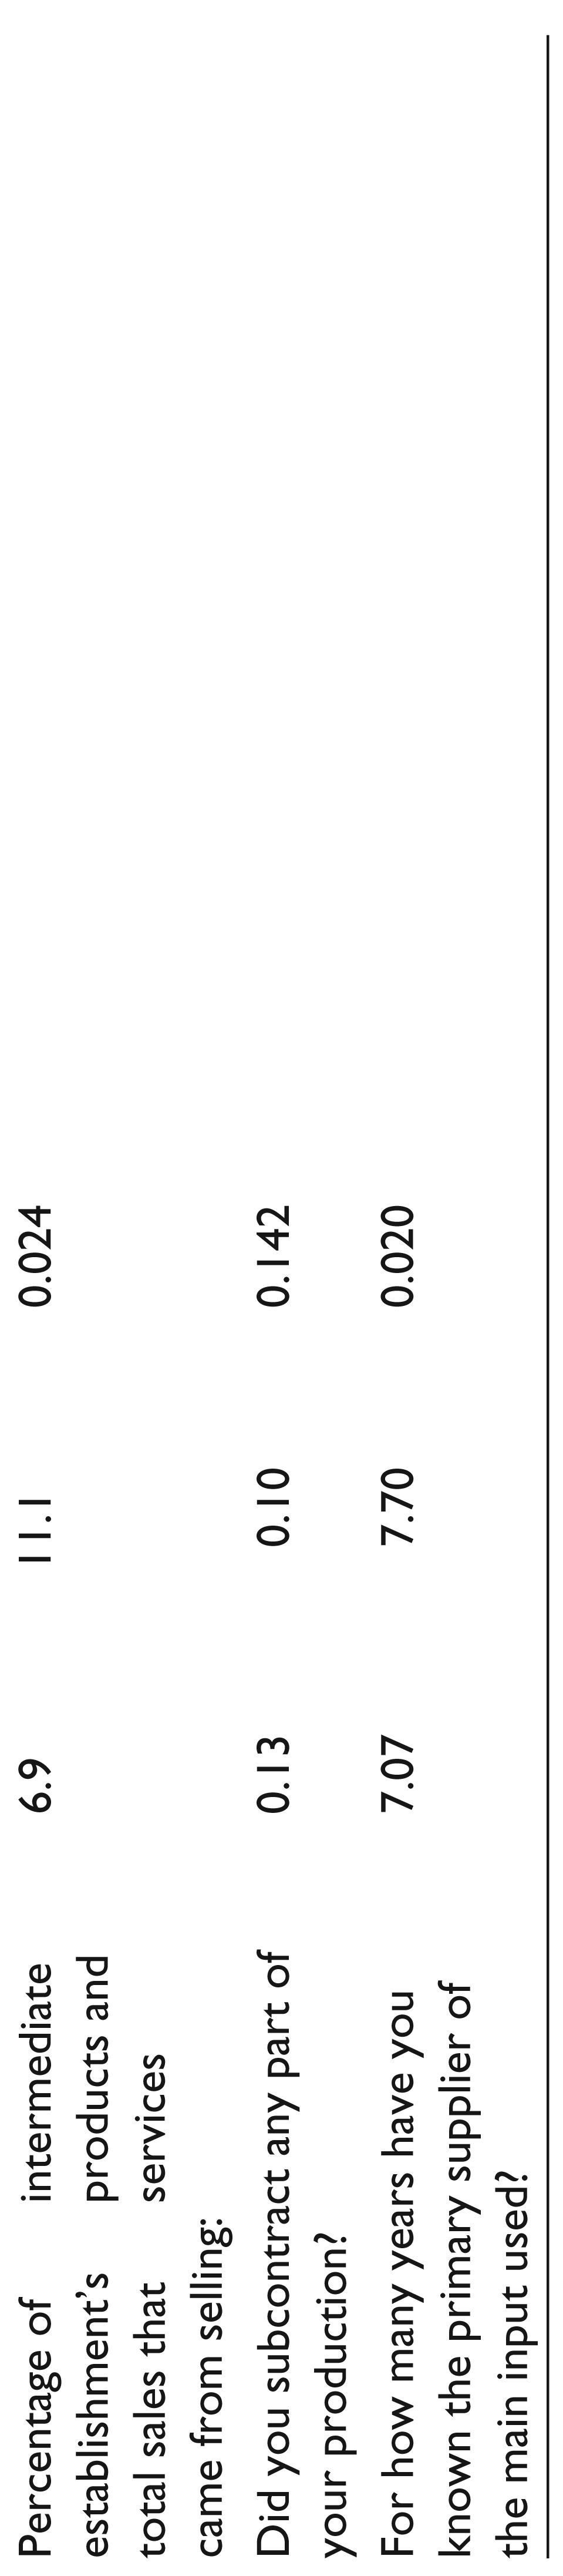
Both groups receive payment for the majority of their sales either before delivery or on delivery. Only 12–13 per cent of their payments are received after delivery. The reticent seem to know the primary supplier of their main input for a year longer than the possibly candid group. A tabulation of principal buyers of output for the reticent and possibly candid, respectively, is shown in Table 12.
Table 13 shows the means of population-related variables. The reticent seem to be in less populous industry-location cells than the possibly candid group. Additionally, the reticent report having fewer competitors.
Predicting Reticence
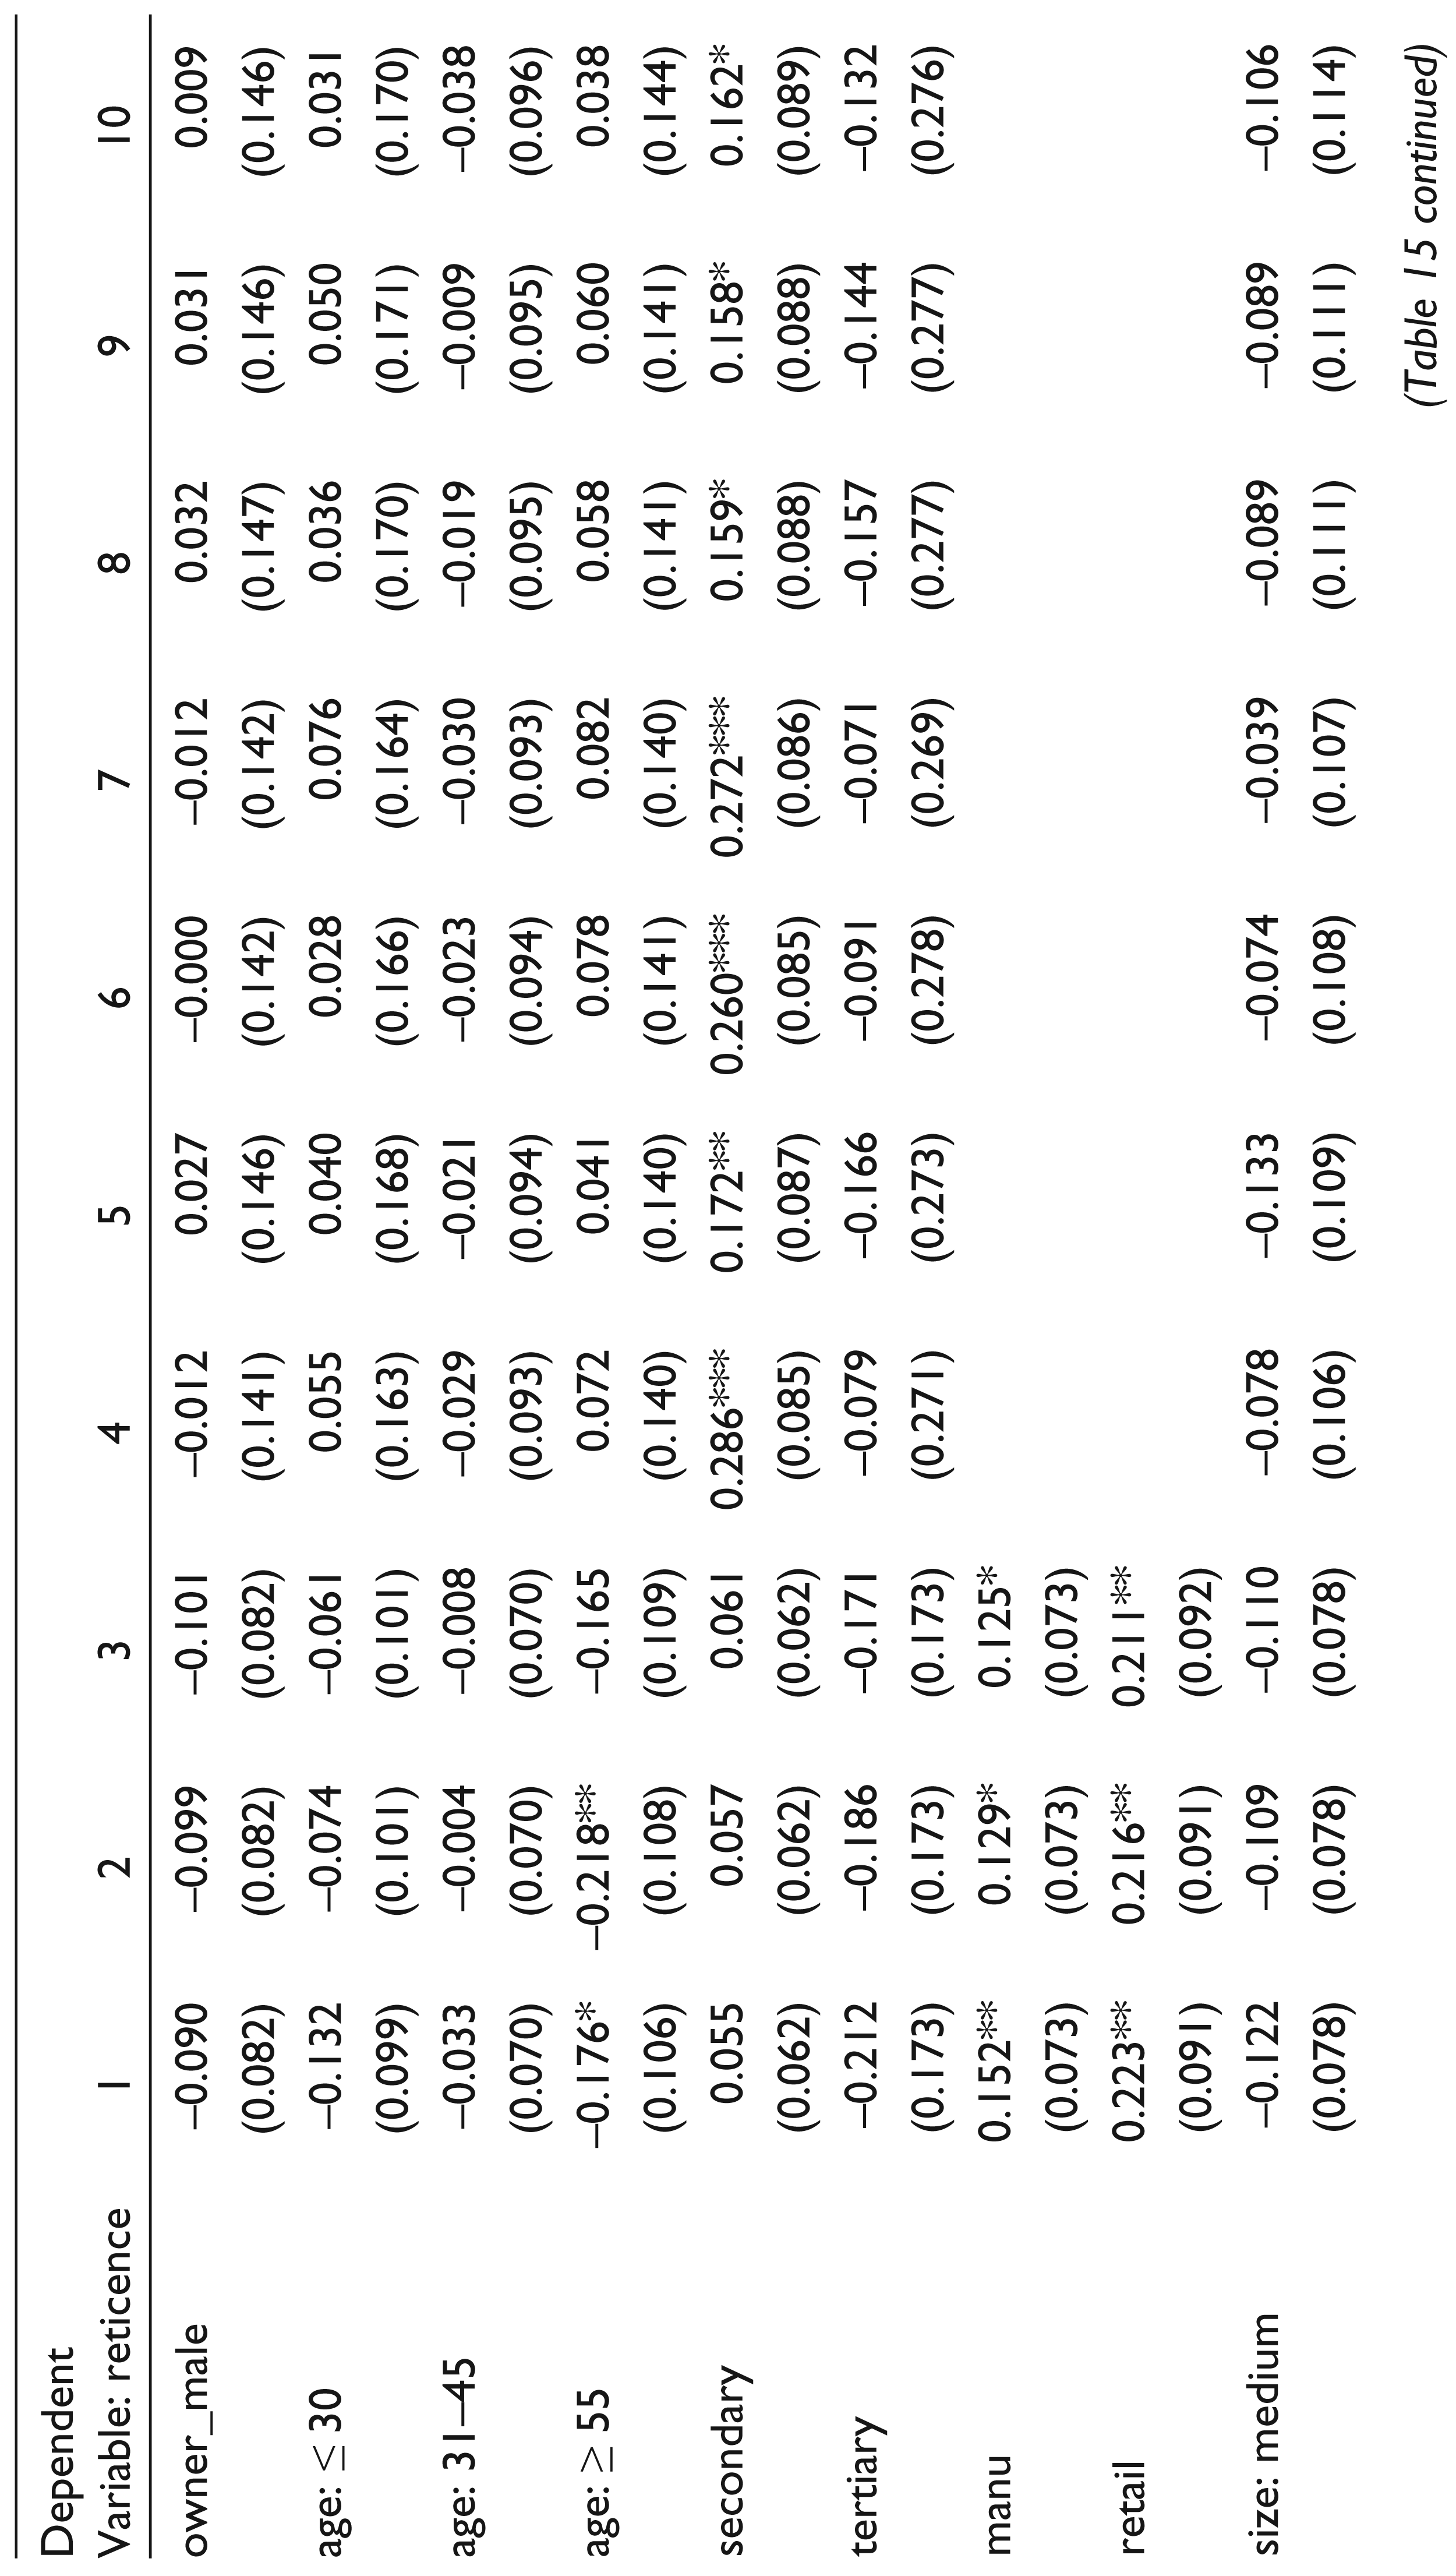
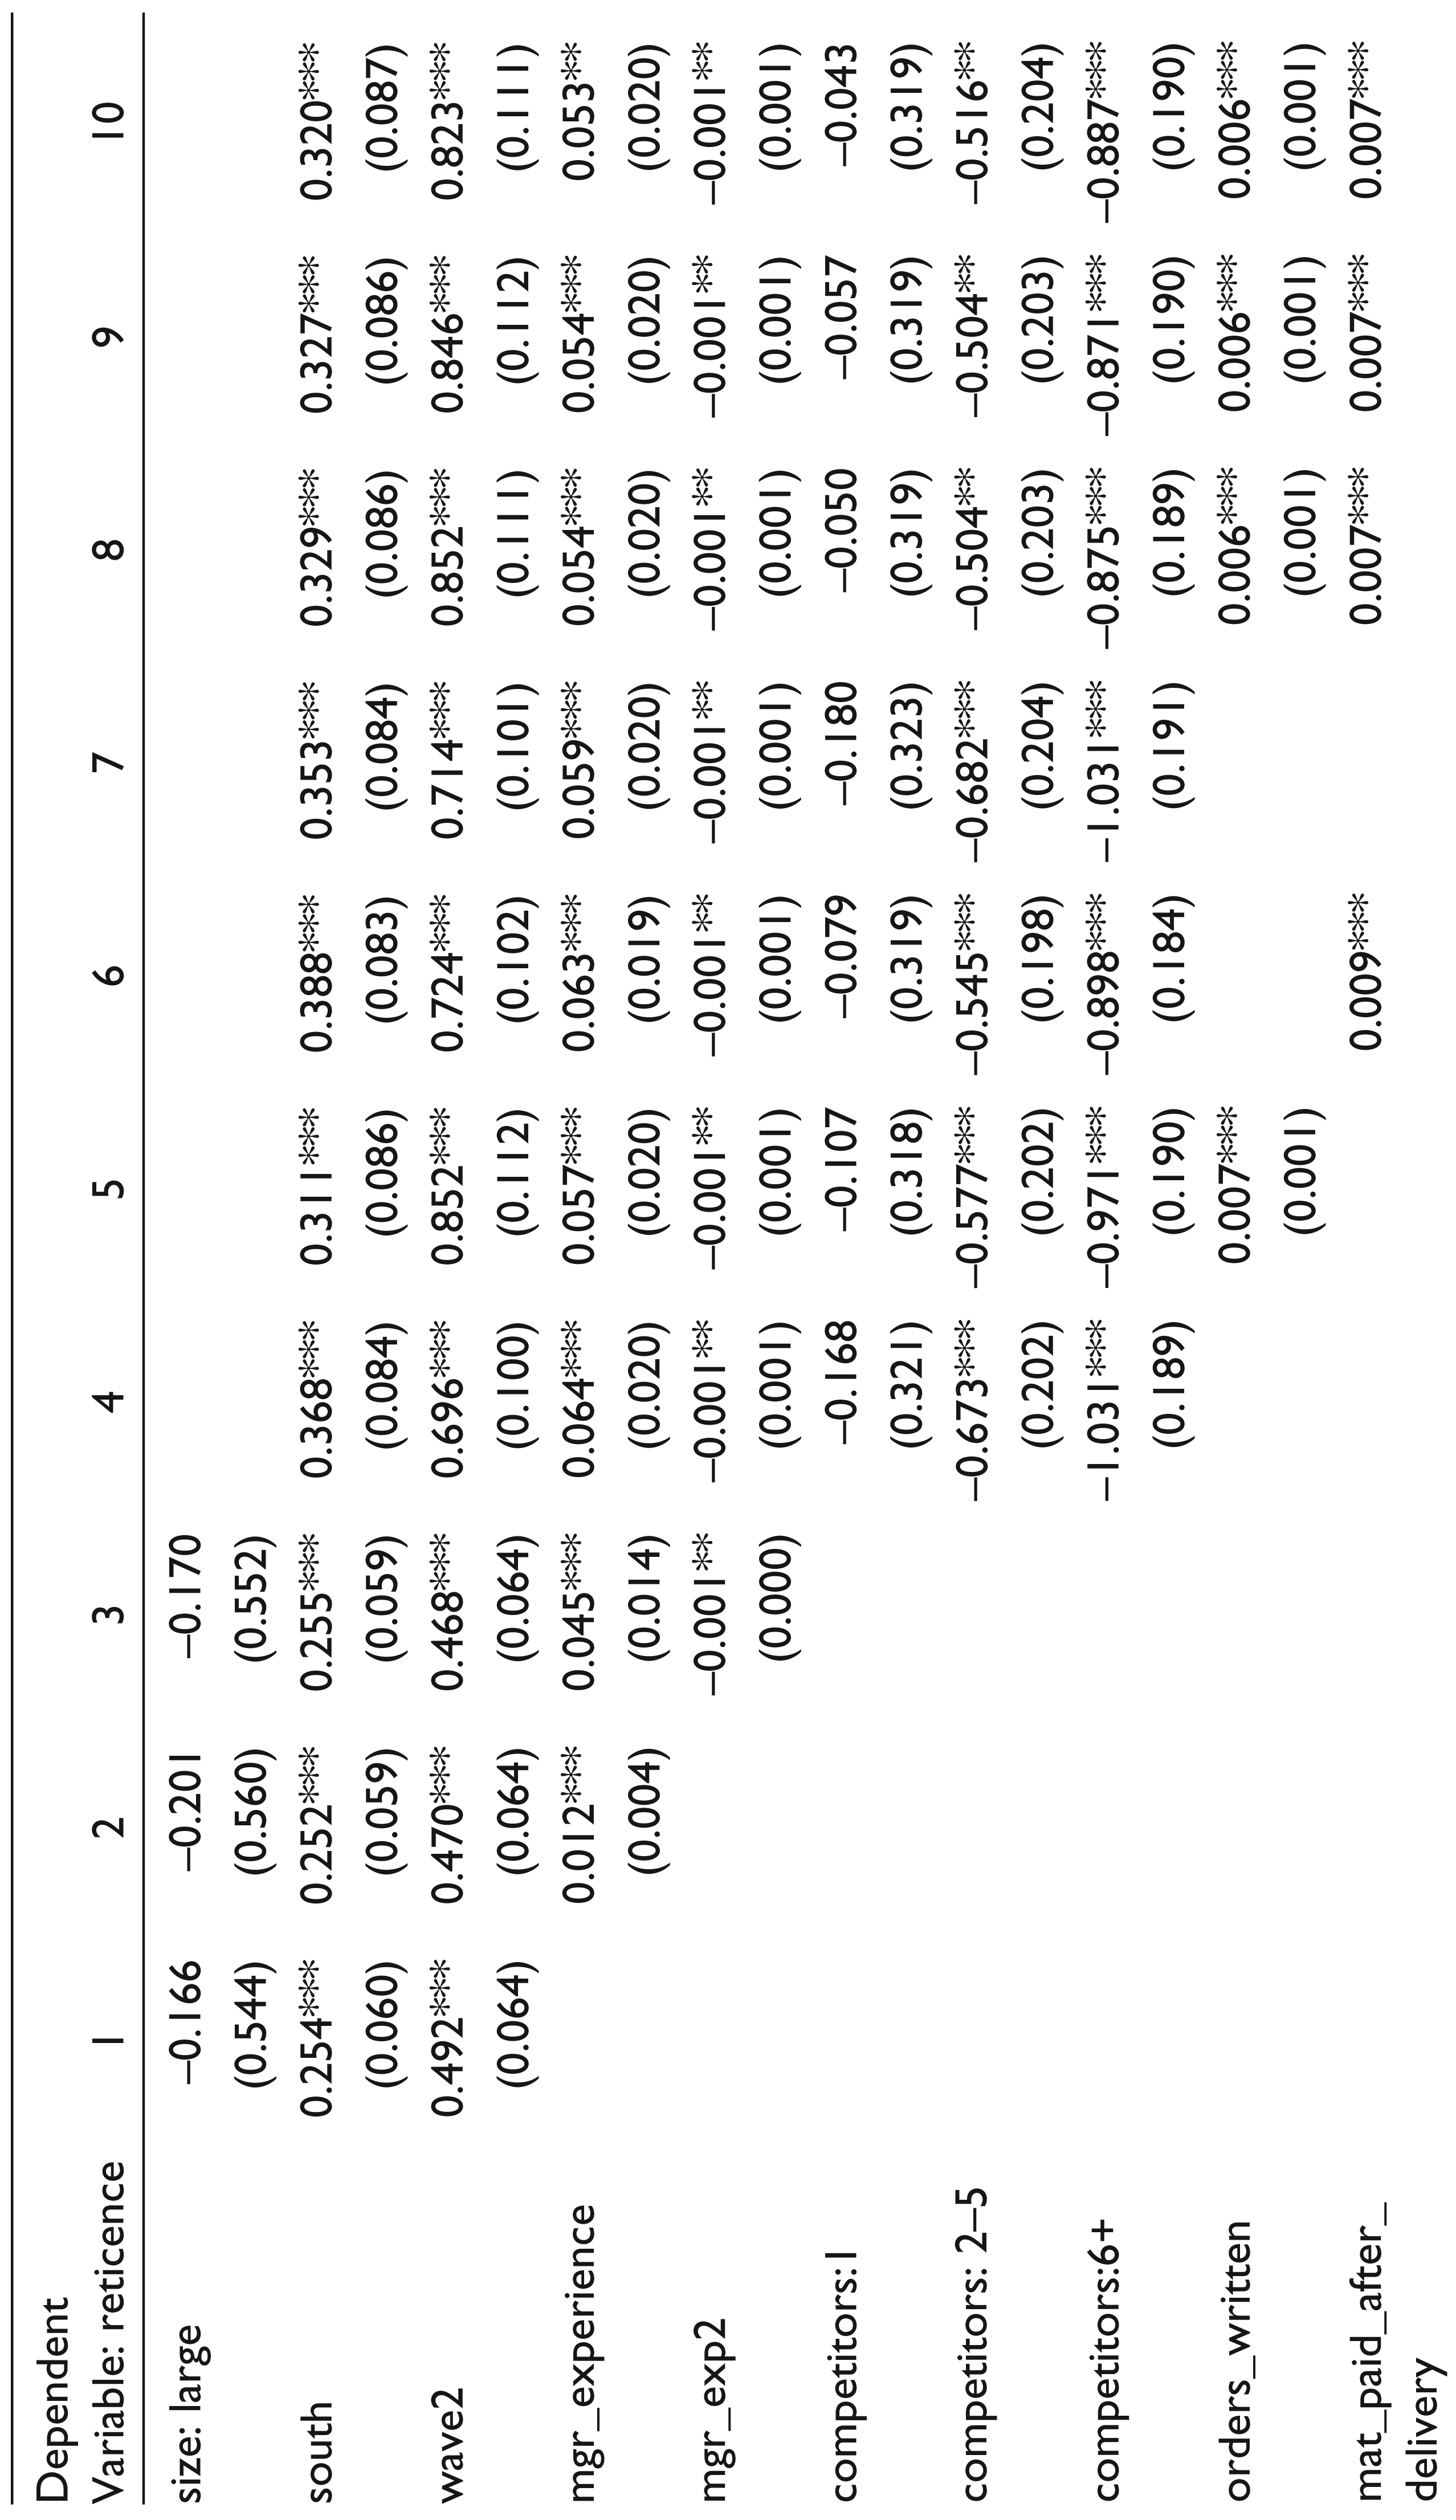
Tables 14 and 15 show probit estimations for reticence. The dependent variable in every model is a dummy equal to one if a company is reticent (as defined by Azfar & Murrell (2009)) and zero otherwise. Standard errors are calculated using the Huber–White heteroscedasticity-consistent estimator. The first set of variables are the same as those used in Clausen et al. (2010) as predictors of reticence, these are gender of owner, age of owner, formal education of owner, industry of company, size of company, region and wave of survey.
Companies with owners who are 55 years old or above are less likely to be reticent than the base group of 46–55. Companies in manufacturing and retail are also shown to be more reticent than the base group, other, which includes information technology, construction and transport, and hotels and restaurants. Companies located in the southern states of Nigeria are also more likely to be reticent than those in the northern states. Also, companies that carried out the survey in the second wave showed more reticence than those which participated in the first wave.
Tabulation of Trust-related Variables, by Reticence

Turning attention to the trust-related variables, the coefficients on the three main measures of mistrust have their expected sign, positive, and are statistically significant when they enter the model separately in Models 3, 4 and 5. The coefficients on percentage of written orders and the percentage of material purchases that were paid for before delivery are both significant at the 1 per cent level. The percentage of sales that were paid for before delivery is significant at the 10 per cent level. Furthermore, both the percentage of written orders and the percentage of material inputs that were paid for before delivery keep their sign and significance when all three variables enter jointly into the model (Model 6). Their size, in magnitude, is also similar to their size in the previous models where they enter separately into the estimation. The coefficient for subcontracting of production has its expected sign but is not statistically significant at the 10 per cent level. The number of years that the company has known its primary supplier also has the expected sign, positive, and is statistically significant at the 10 per cent level. The squared term for the length of time that the primary supplier has been known did not enter significantly into this model and is omitted from this table. These results add support for the idea that companies which are less trusting in their business operations are more likely to be reticent in answering RR survey questions.
Means of Population-related Variables

Turning attention to the variables representing the risk of detection, the population of the company’s industry-location cell had a zero effect on reticence. This effect did not change throughout the models in Table 14. In order to use a potentially better measure of the perceived risk of detection, the models in Table 15 use dummies for the number of competitors that the firm faces, as reported by the firm. These are 1 competitor, 2–5 competitors and more than 5 competitors. The excluded category is—no competitors. Hence, the dummy for 1 competitor is equal to 1 if the firm reported having 1 competitor, and 0 otherwise. The other dummy variables are constructed similarly.
The coefficient on the dummy for 1 competitor has its expected sign but is not significant in any of the models. Therefore, there is some evidence that, relative to the base group of no competitors, having 1 competitor decreases the probability of being reticent. However, this finding is not statistically significant at the 10 per cent level. Nevertheless, the coefficients for the 2–5 and 5+ dummies both have their expected signs and are both statistically significant at the 1 per cent level in most models. Furthermore, the coefficient on the variable for 5+ competitors is always larger, in absolute value, than the coefficient for 2–5 competitors, which, in turn, is also larger, in absolute value, than the coefficient for 1 competitor. This suggests that the more competitors in a market, the less likely a company is to be reticent. These results provide evidence for the perceived risk of detection as a determinant of reticence amongst companies.
Probit Estimates for Reticence
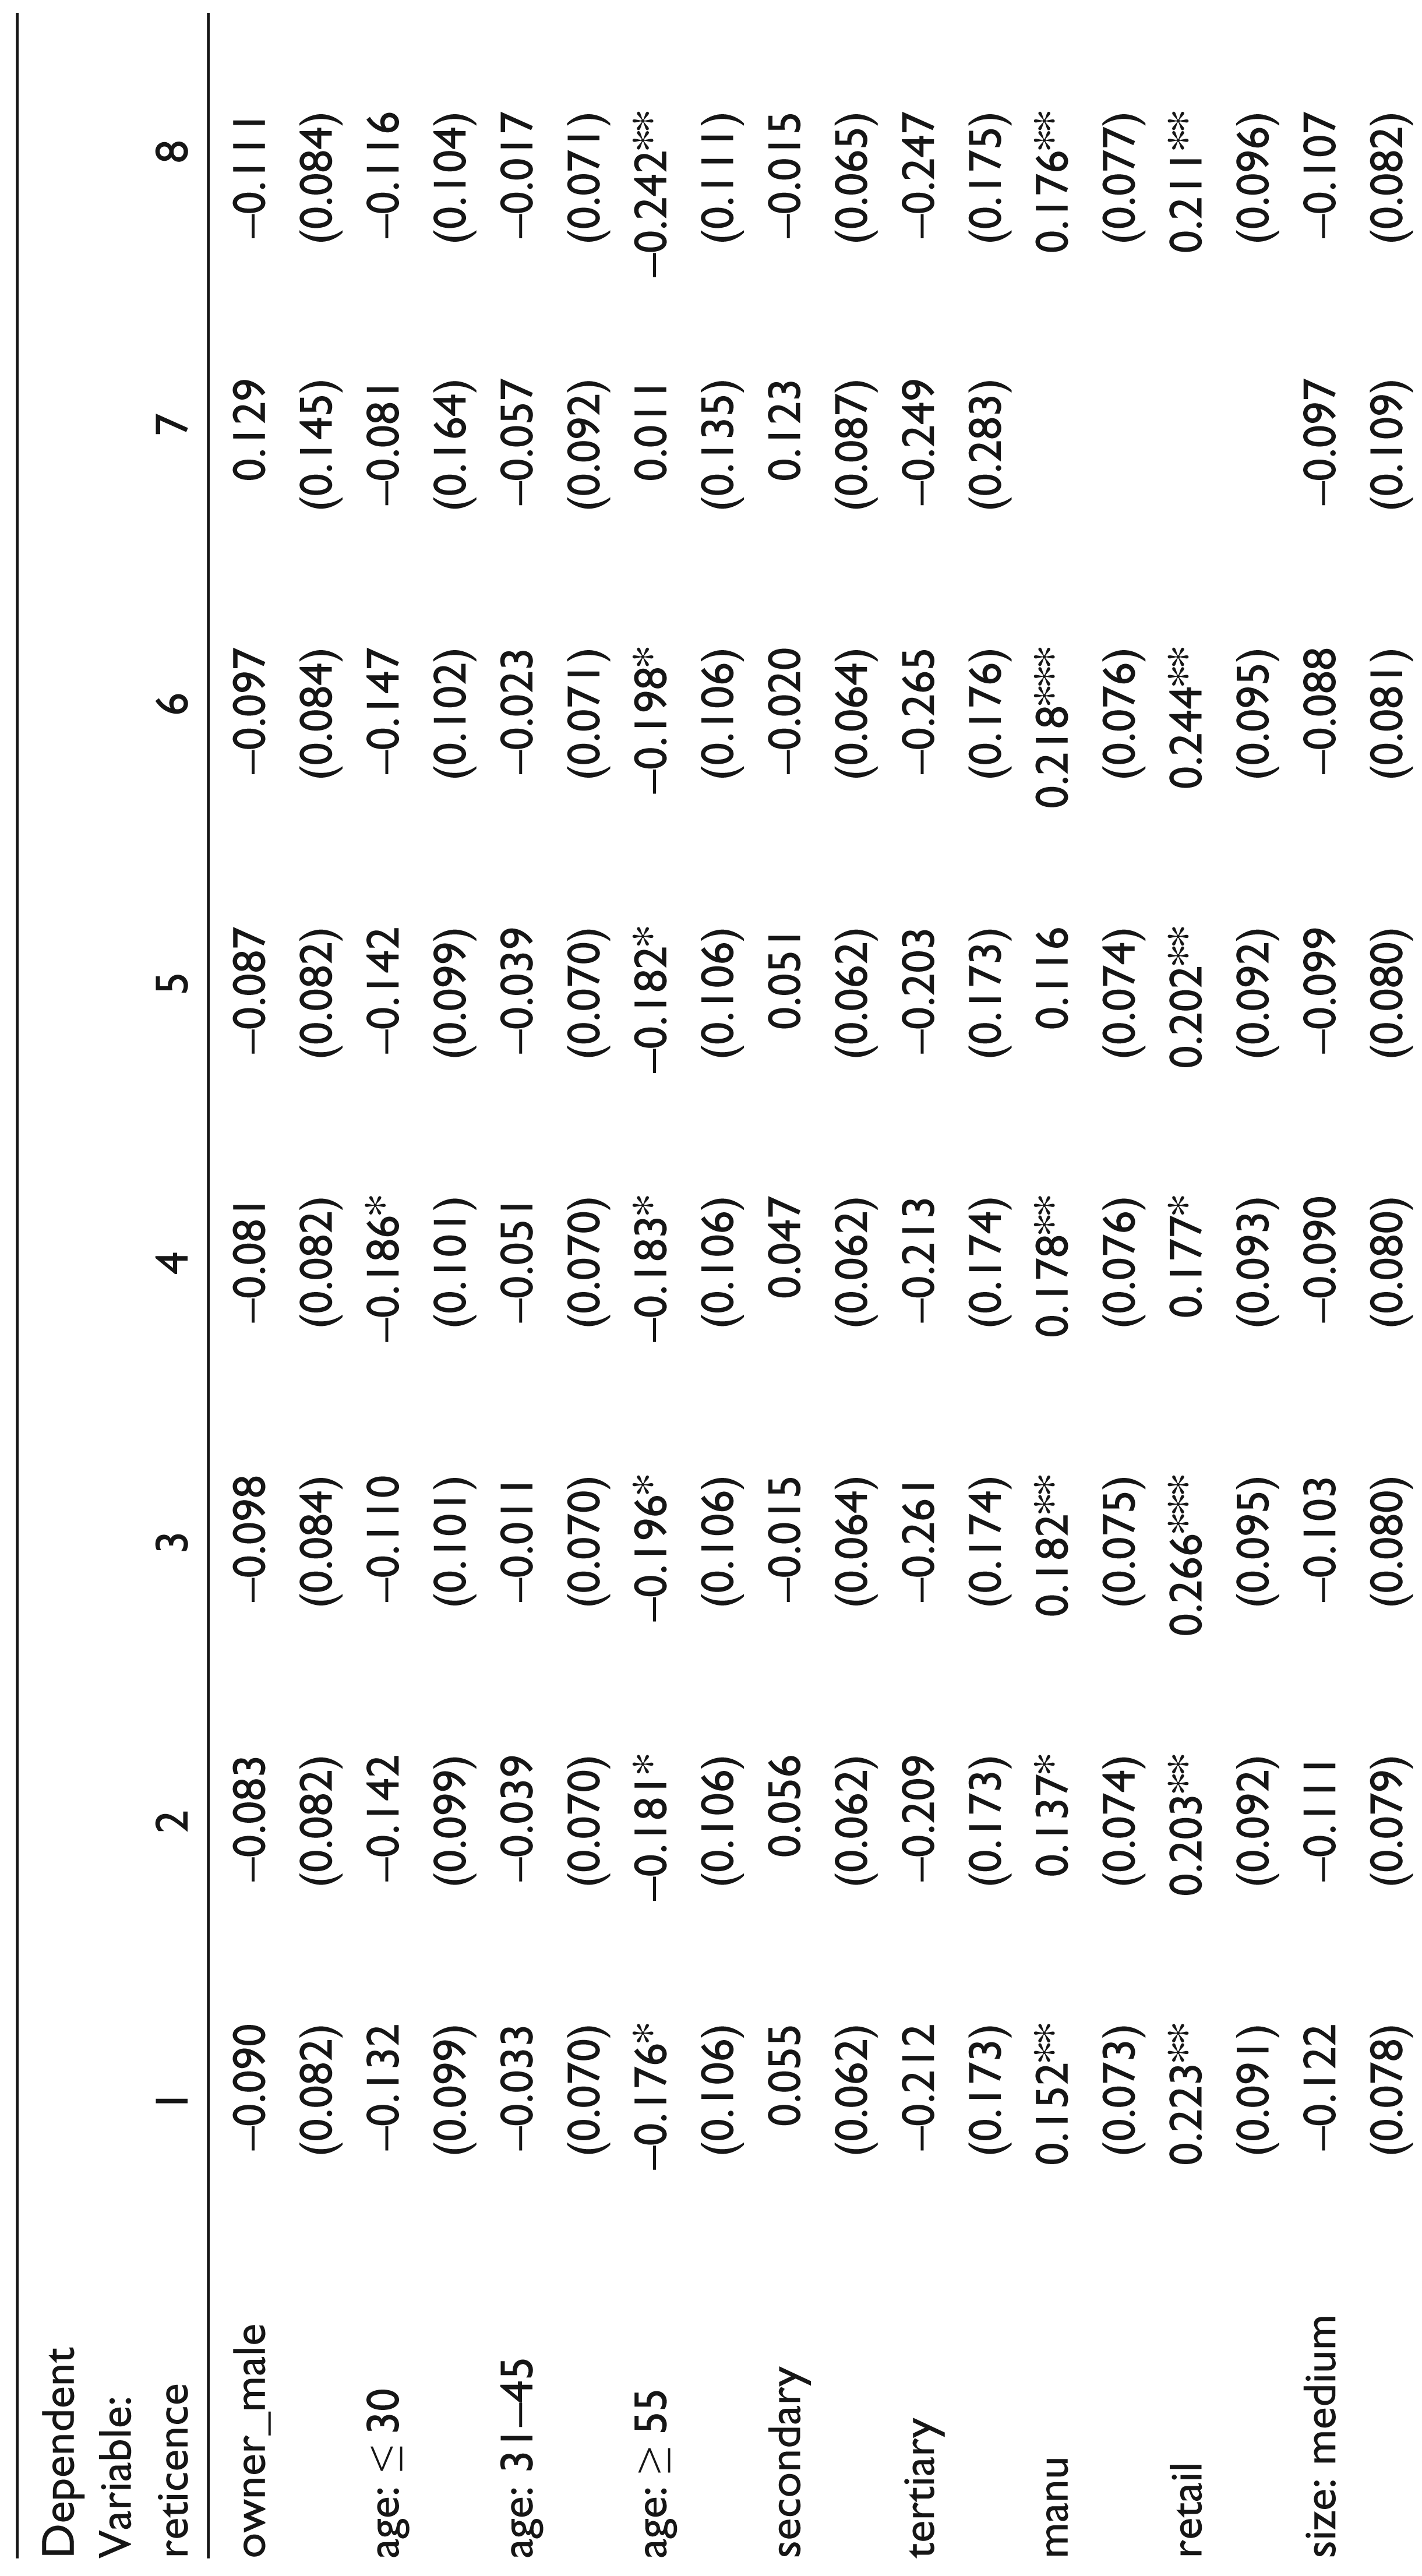

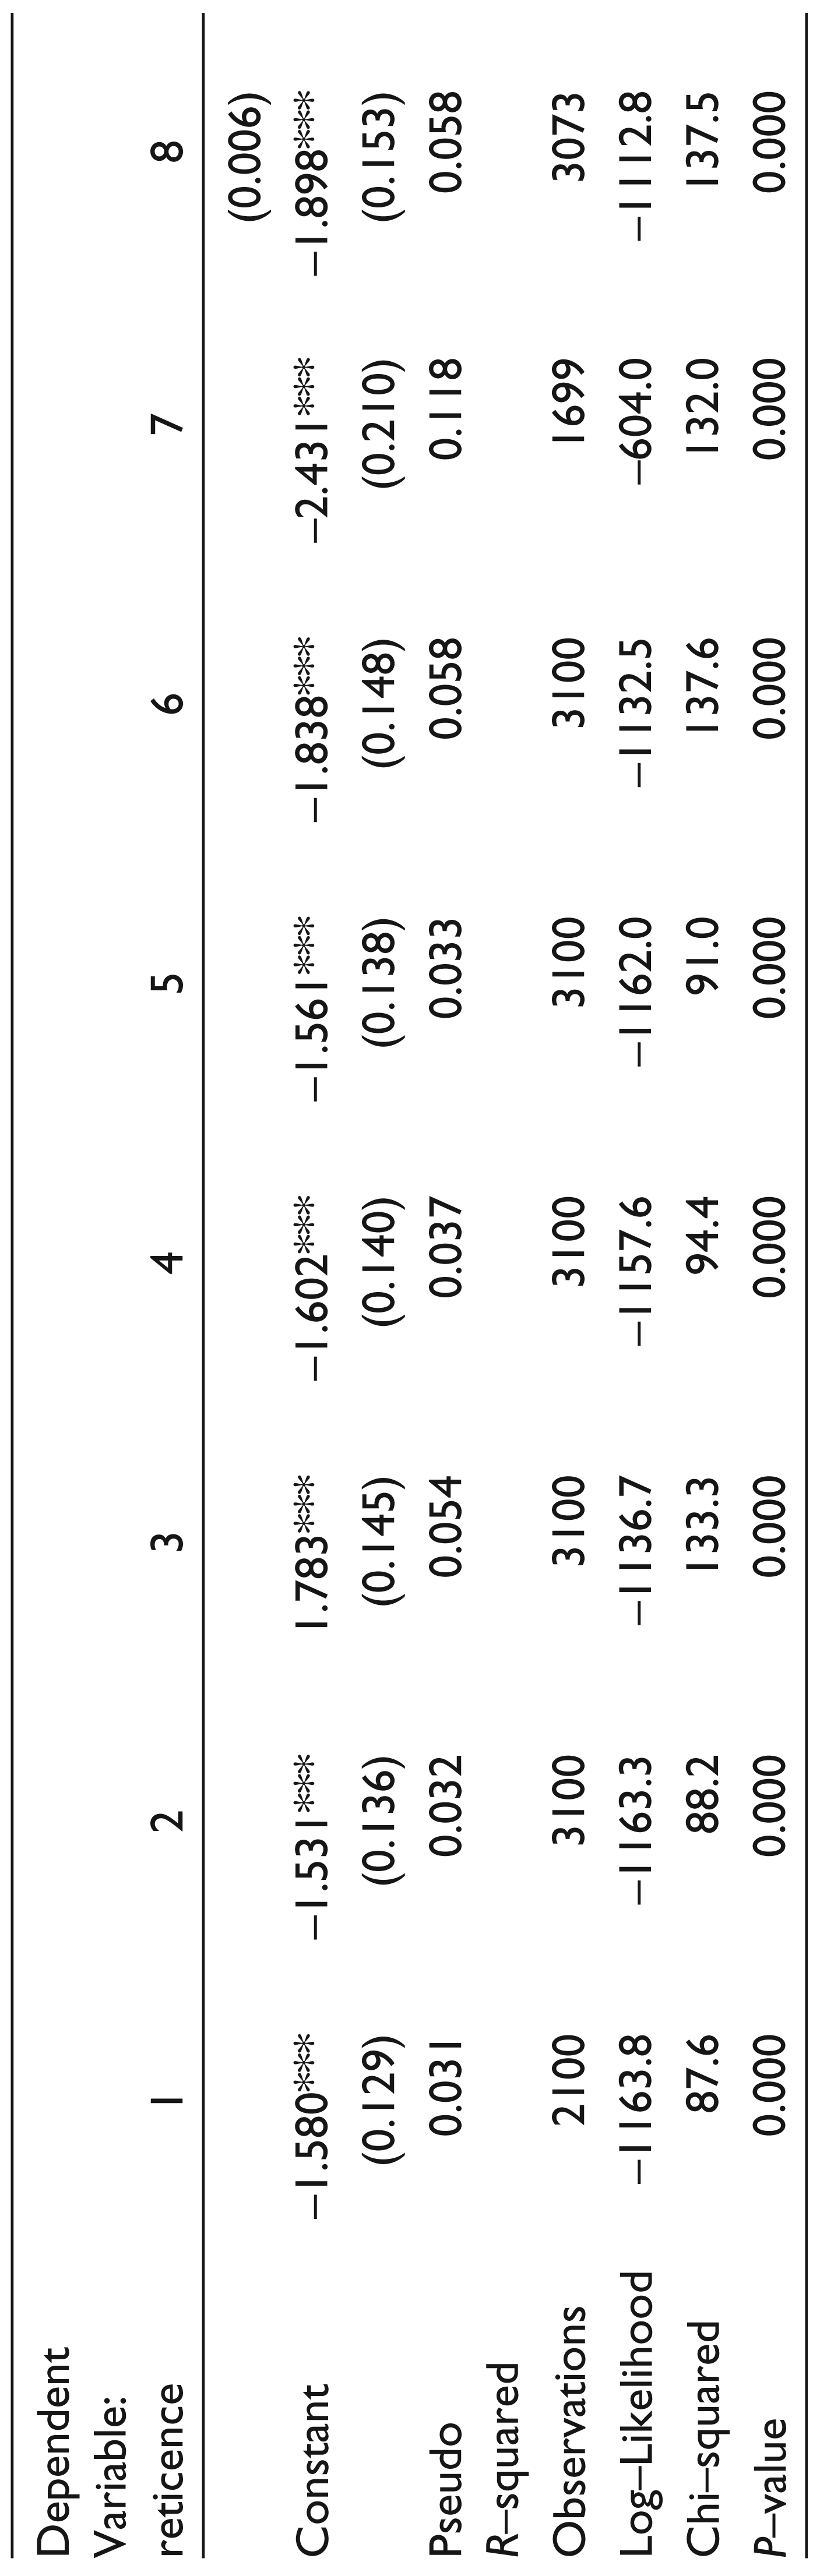
The three main trust variables, percentage of written orders, percentage of prepaid material orders and percentage of post-paid sales orders, all enter significantly into the models in Table 15 and all keep their expected signs. The variables for subcontracting work and length of time that the primary supplier is known for also keep their expected signs but do not enter significantly into these models. Finally, the coefficient on the number of years of experience of the senior manager has its expected sign, positive, and is significant in all models. The squared term for the years of manager experience is negative and significant in all specifications. This suggests that an increased level of experience is initially associated with an increased level of reticence, but that this relationship reverses after a point.
Probit Estimates for Reticence
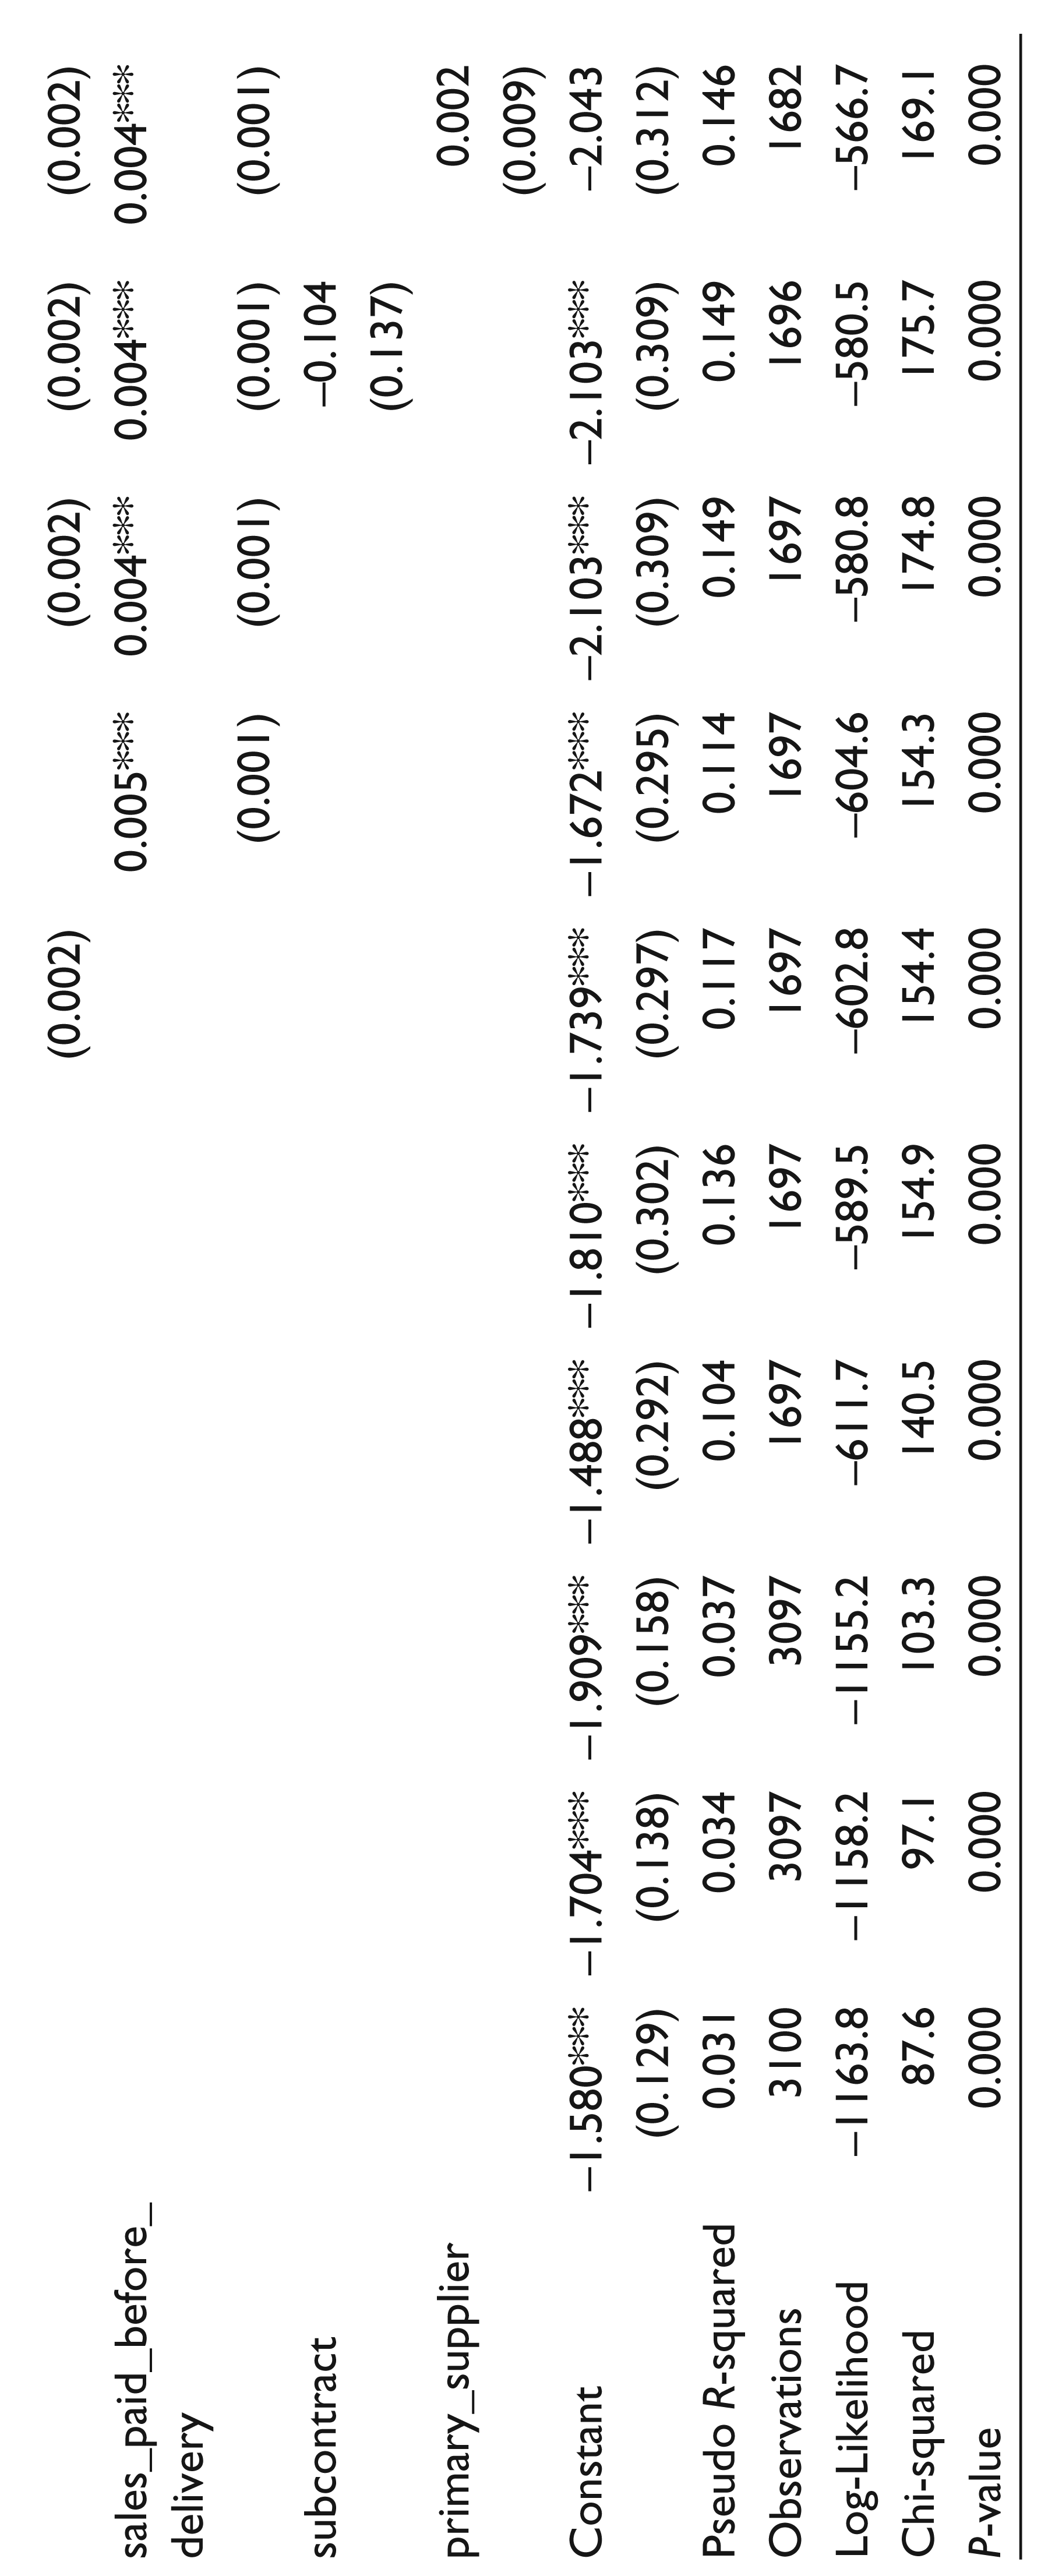
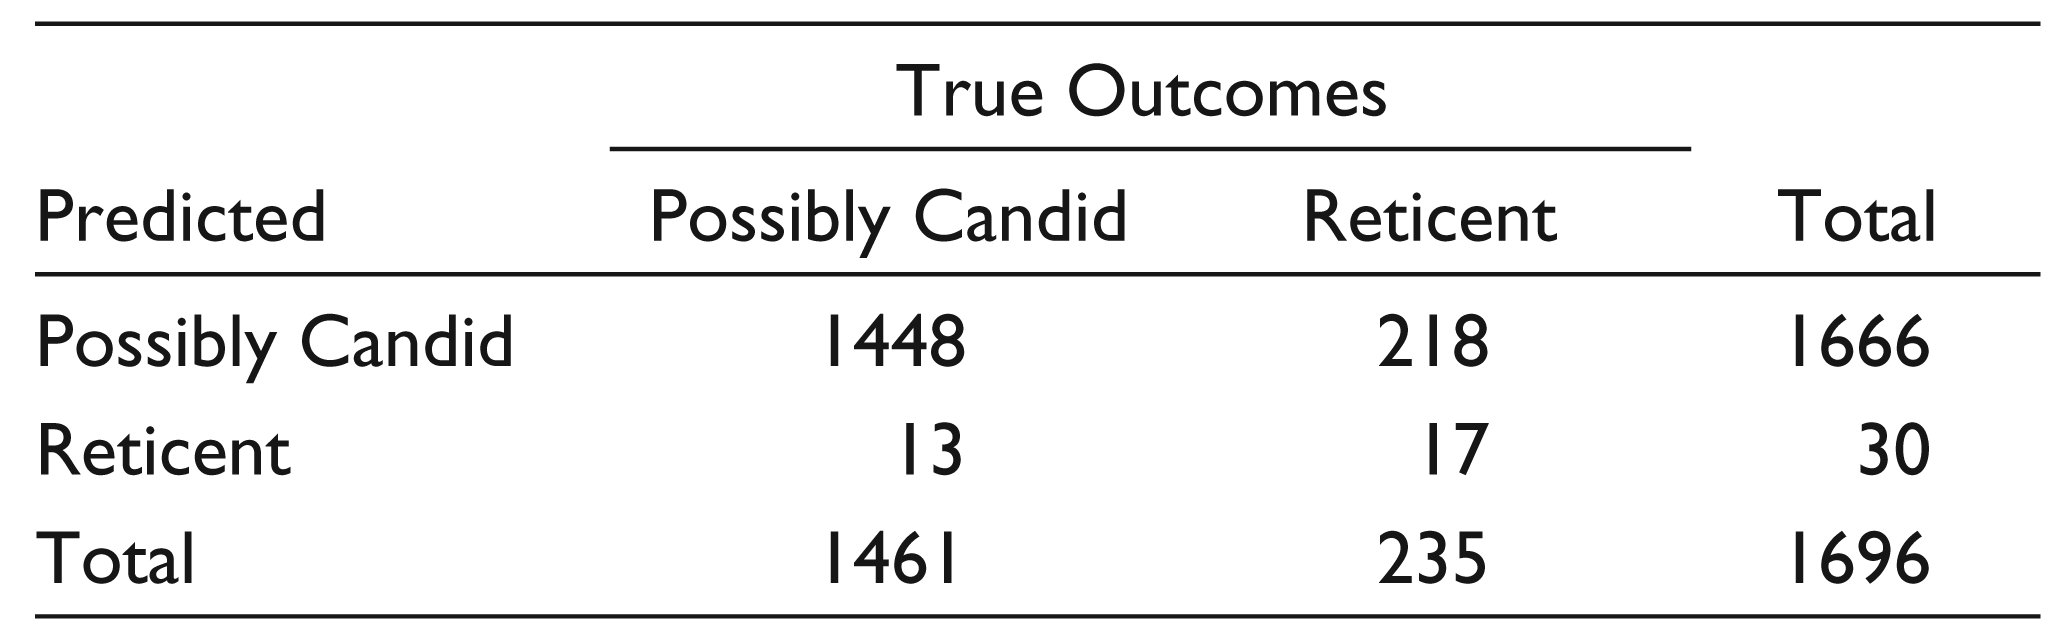
Using the information from the model with the highest Pseudo R-squared (Model 9), predicted values of the dependent variable are constructed. These values lie between 0 and 1. These values are transformed into predicted values for reticence using the following rule: if they lie below 0.5, they are converted to a 0; if they lie above or equal to 0.5, they are converted to a 1. Here, a 1 means that the firm is predicted to be reticent based on the explanatory variables, and a 0 means that the firm is predicted to be possibly candid based on the explanatory variables. Table 18 shows the results from this exercise. The predicted values are tabulated along with the actual values. Overall, this model is able to predict 86.4 per cent of the actual outcomes correctly. To be sure, these results only apply to the manufacturing sector (since only firms in manufacturing were asked about their perceived number of competitors); however, this provides some evidence in favour of the models presented in this study.
Probit Estimates for Reticence


HAS-probit Estimations for Reticence

Comparing Actual Outcomes with Predicted Outcomes from Probit (Model 9) Estimations
Controlling for Interviewer and Supervisor Effects
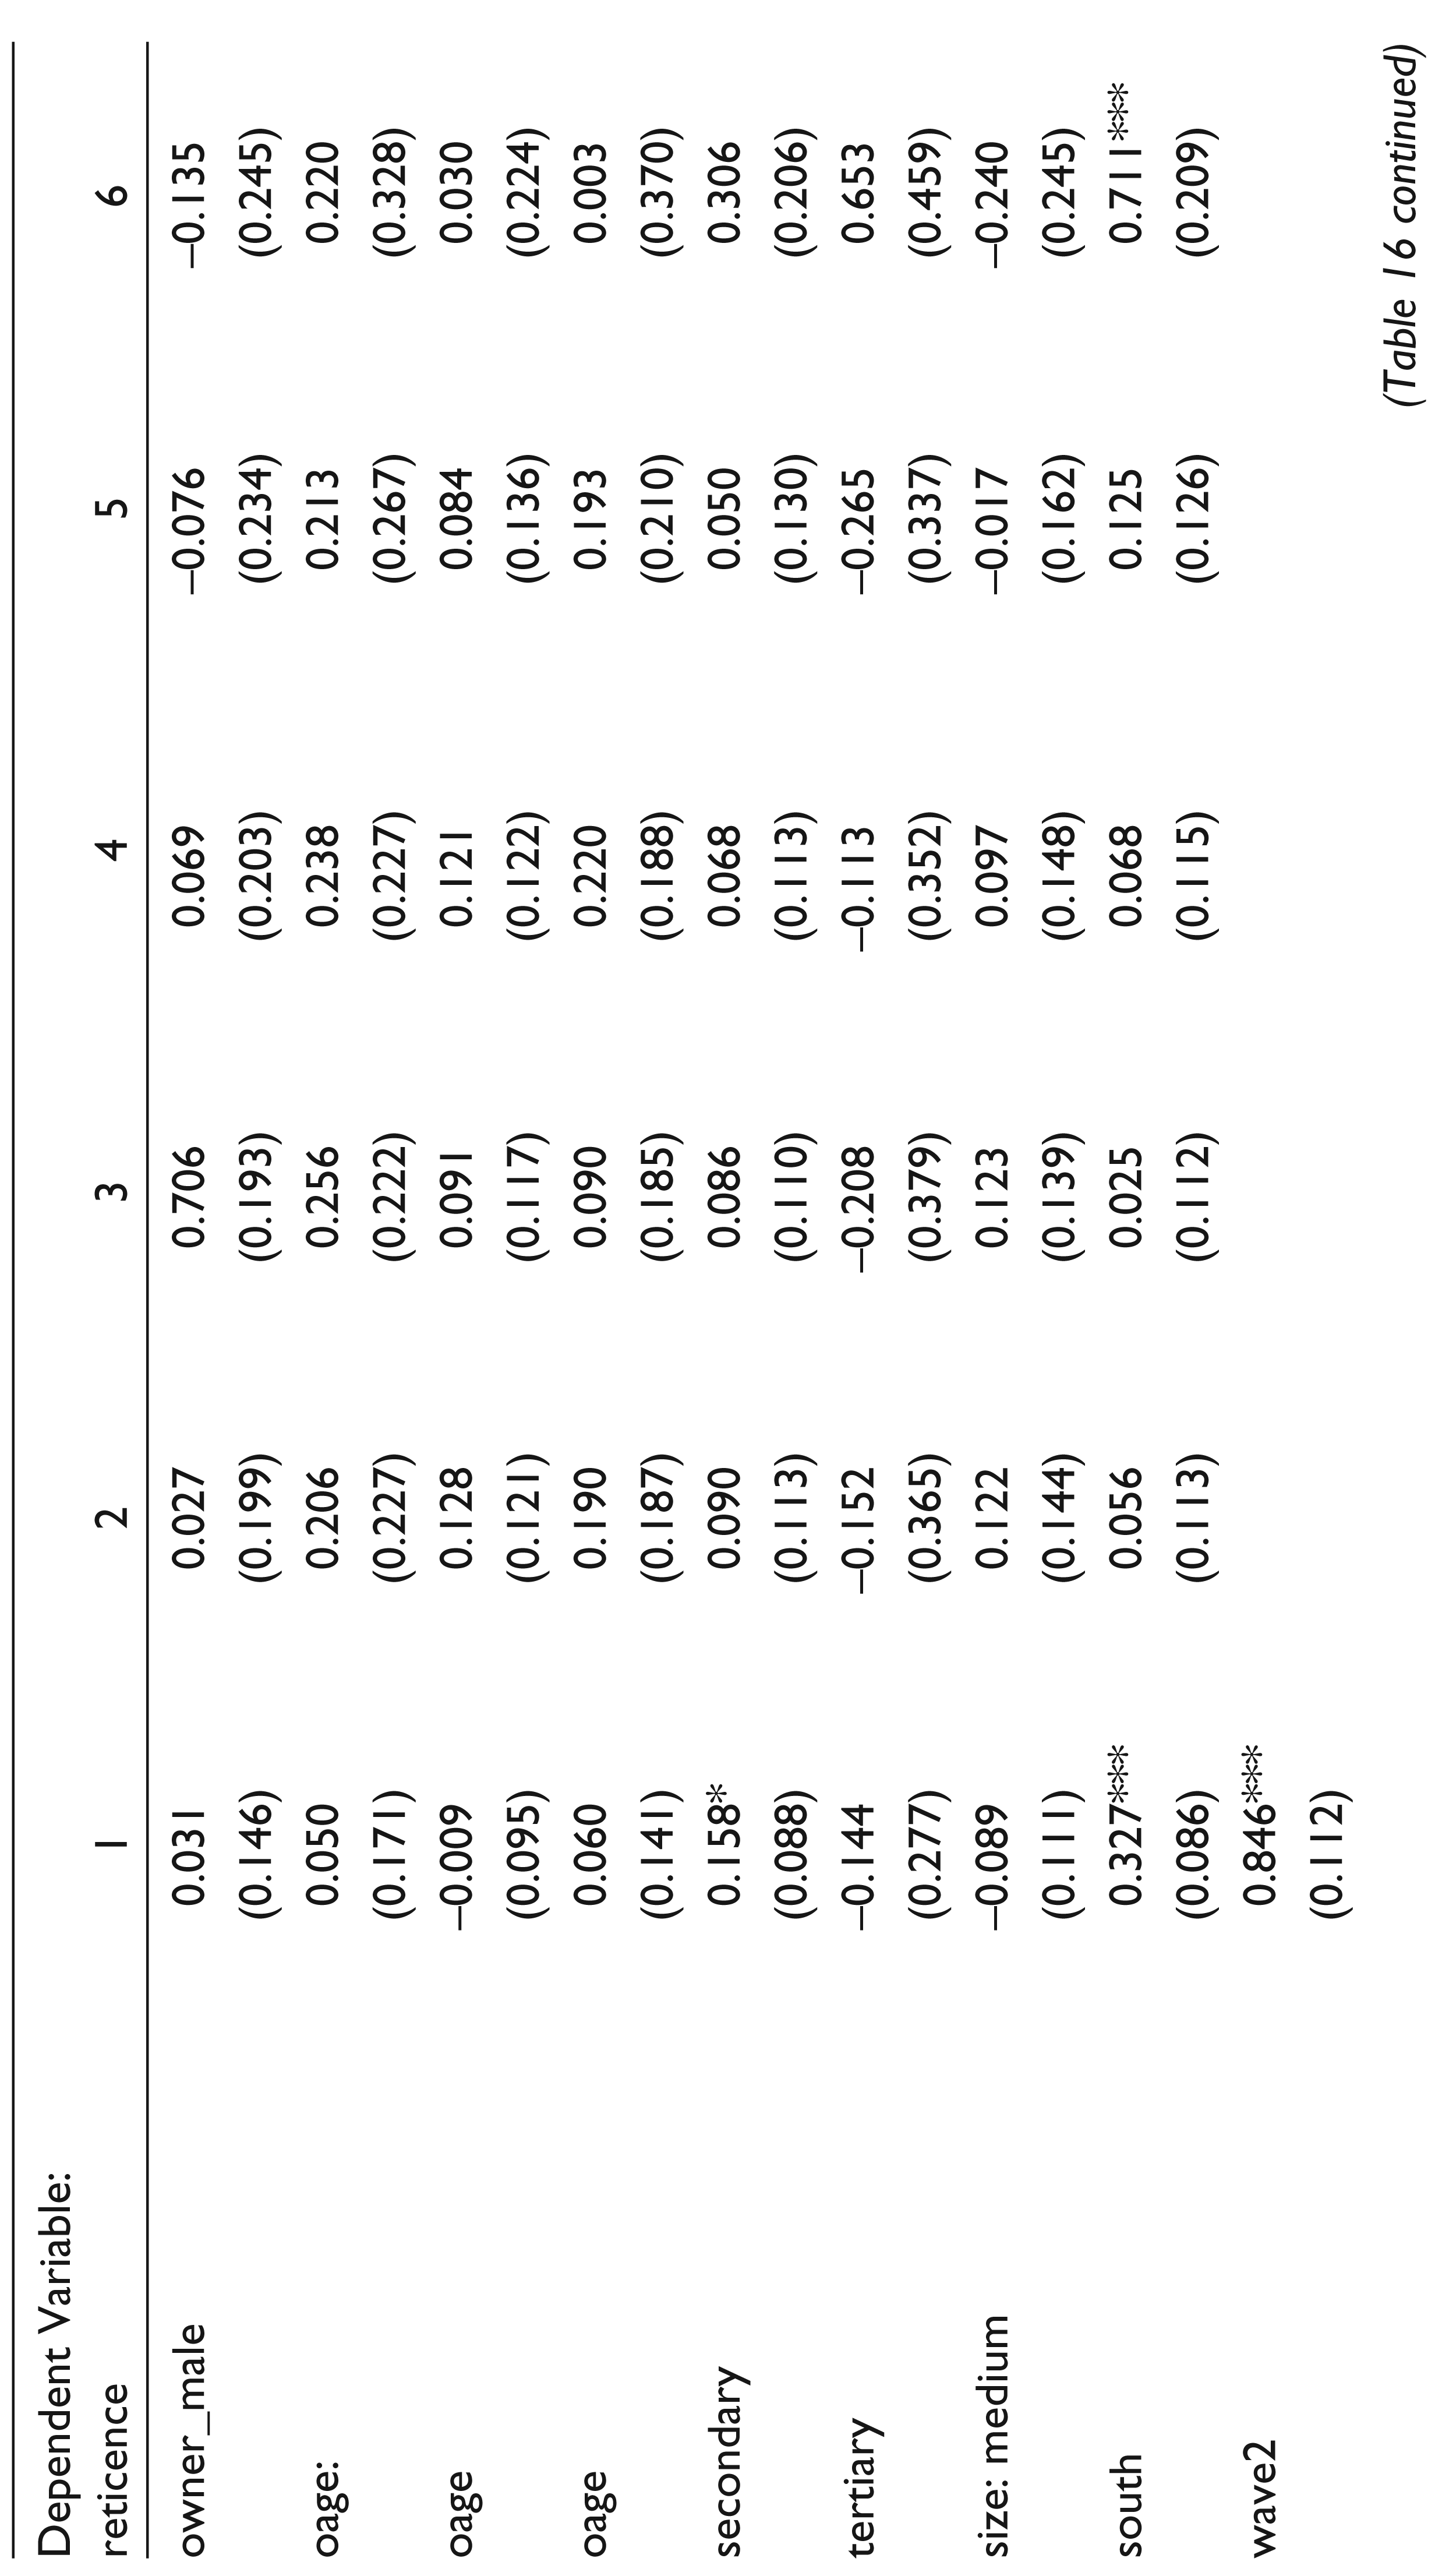
One potential cause of observed reticence amongst companies is the interviewer. It is possible that some firms chose not to answer honestly because they did not trust the interviewer that was asking the questions. Another possibility is that the interviewer did not understand the process. This also might have affected the responses of the companies. Finally, the interviewers had supervisors to make sure that the interview was being conducted correctly. It is possible that the supervisors had an effect on the reticence of the companies. To examine whether or not the interviewers and/or their supervisors had any effect on the reticence of companies, this study uses dummies for both interviewers and supervisors, respectively. Also, an interaction term is included for each interviewer–supervisor combination. These variables are only available for the second wave of the survey. Results of this analysis are shown in Table 16. The first column of results (Model 1) shows the coefficients from Model 9 of Table 15. When all three variables are included (Model 5), Wald tests for the equality of the coefficients on interviewer, supervisor, and combinations of interviewers and supervisors, respectively, are conducted. These tests fail to reject the null of equality of the respective coefficients at the 10 per cent level. This suggests that there were no statistically significant effects of interviewers, supervisors or combinations of interviewers and supervisors on the reticence of companies. However, the results in columns 2 and 4 in Table 16 suggest that interviewer effects are important. Including the interaction terms might be asking too much from the data. Nevertheless, these considerations do not affect the main results of the study.
Controlling for Potential Political Connections
Although there seems to be no observable relationship between guilt and reticence, there might be a possible relationship between companies with political connections and reticence. One potential scenario is that a company with very strong political connections would have less reticence because they could potentially admit to engaging in any act and get away with it due to their links with powerful people. Alternatively, a company with strong links with the government might want to hide all acts of wrongdoing so as to protect their associates in the government. Companies in the first wave of the survey were asked to give the reason that they chose to locate in their particular state. Multiple answers were allowed. One of these was that the government gave concessions and benefits which made it more attractive to locate there. In order to test the political connections hypothesis, this study uses the response to this question as a proxy for the political connections of the company. The result of this exercise is shown in Model 6 of Table 16. There seems to be no statistically significant relationship between this measure of political connectedness and reticence.
Controlling for Misclassification Error Using the HAS-probit Model
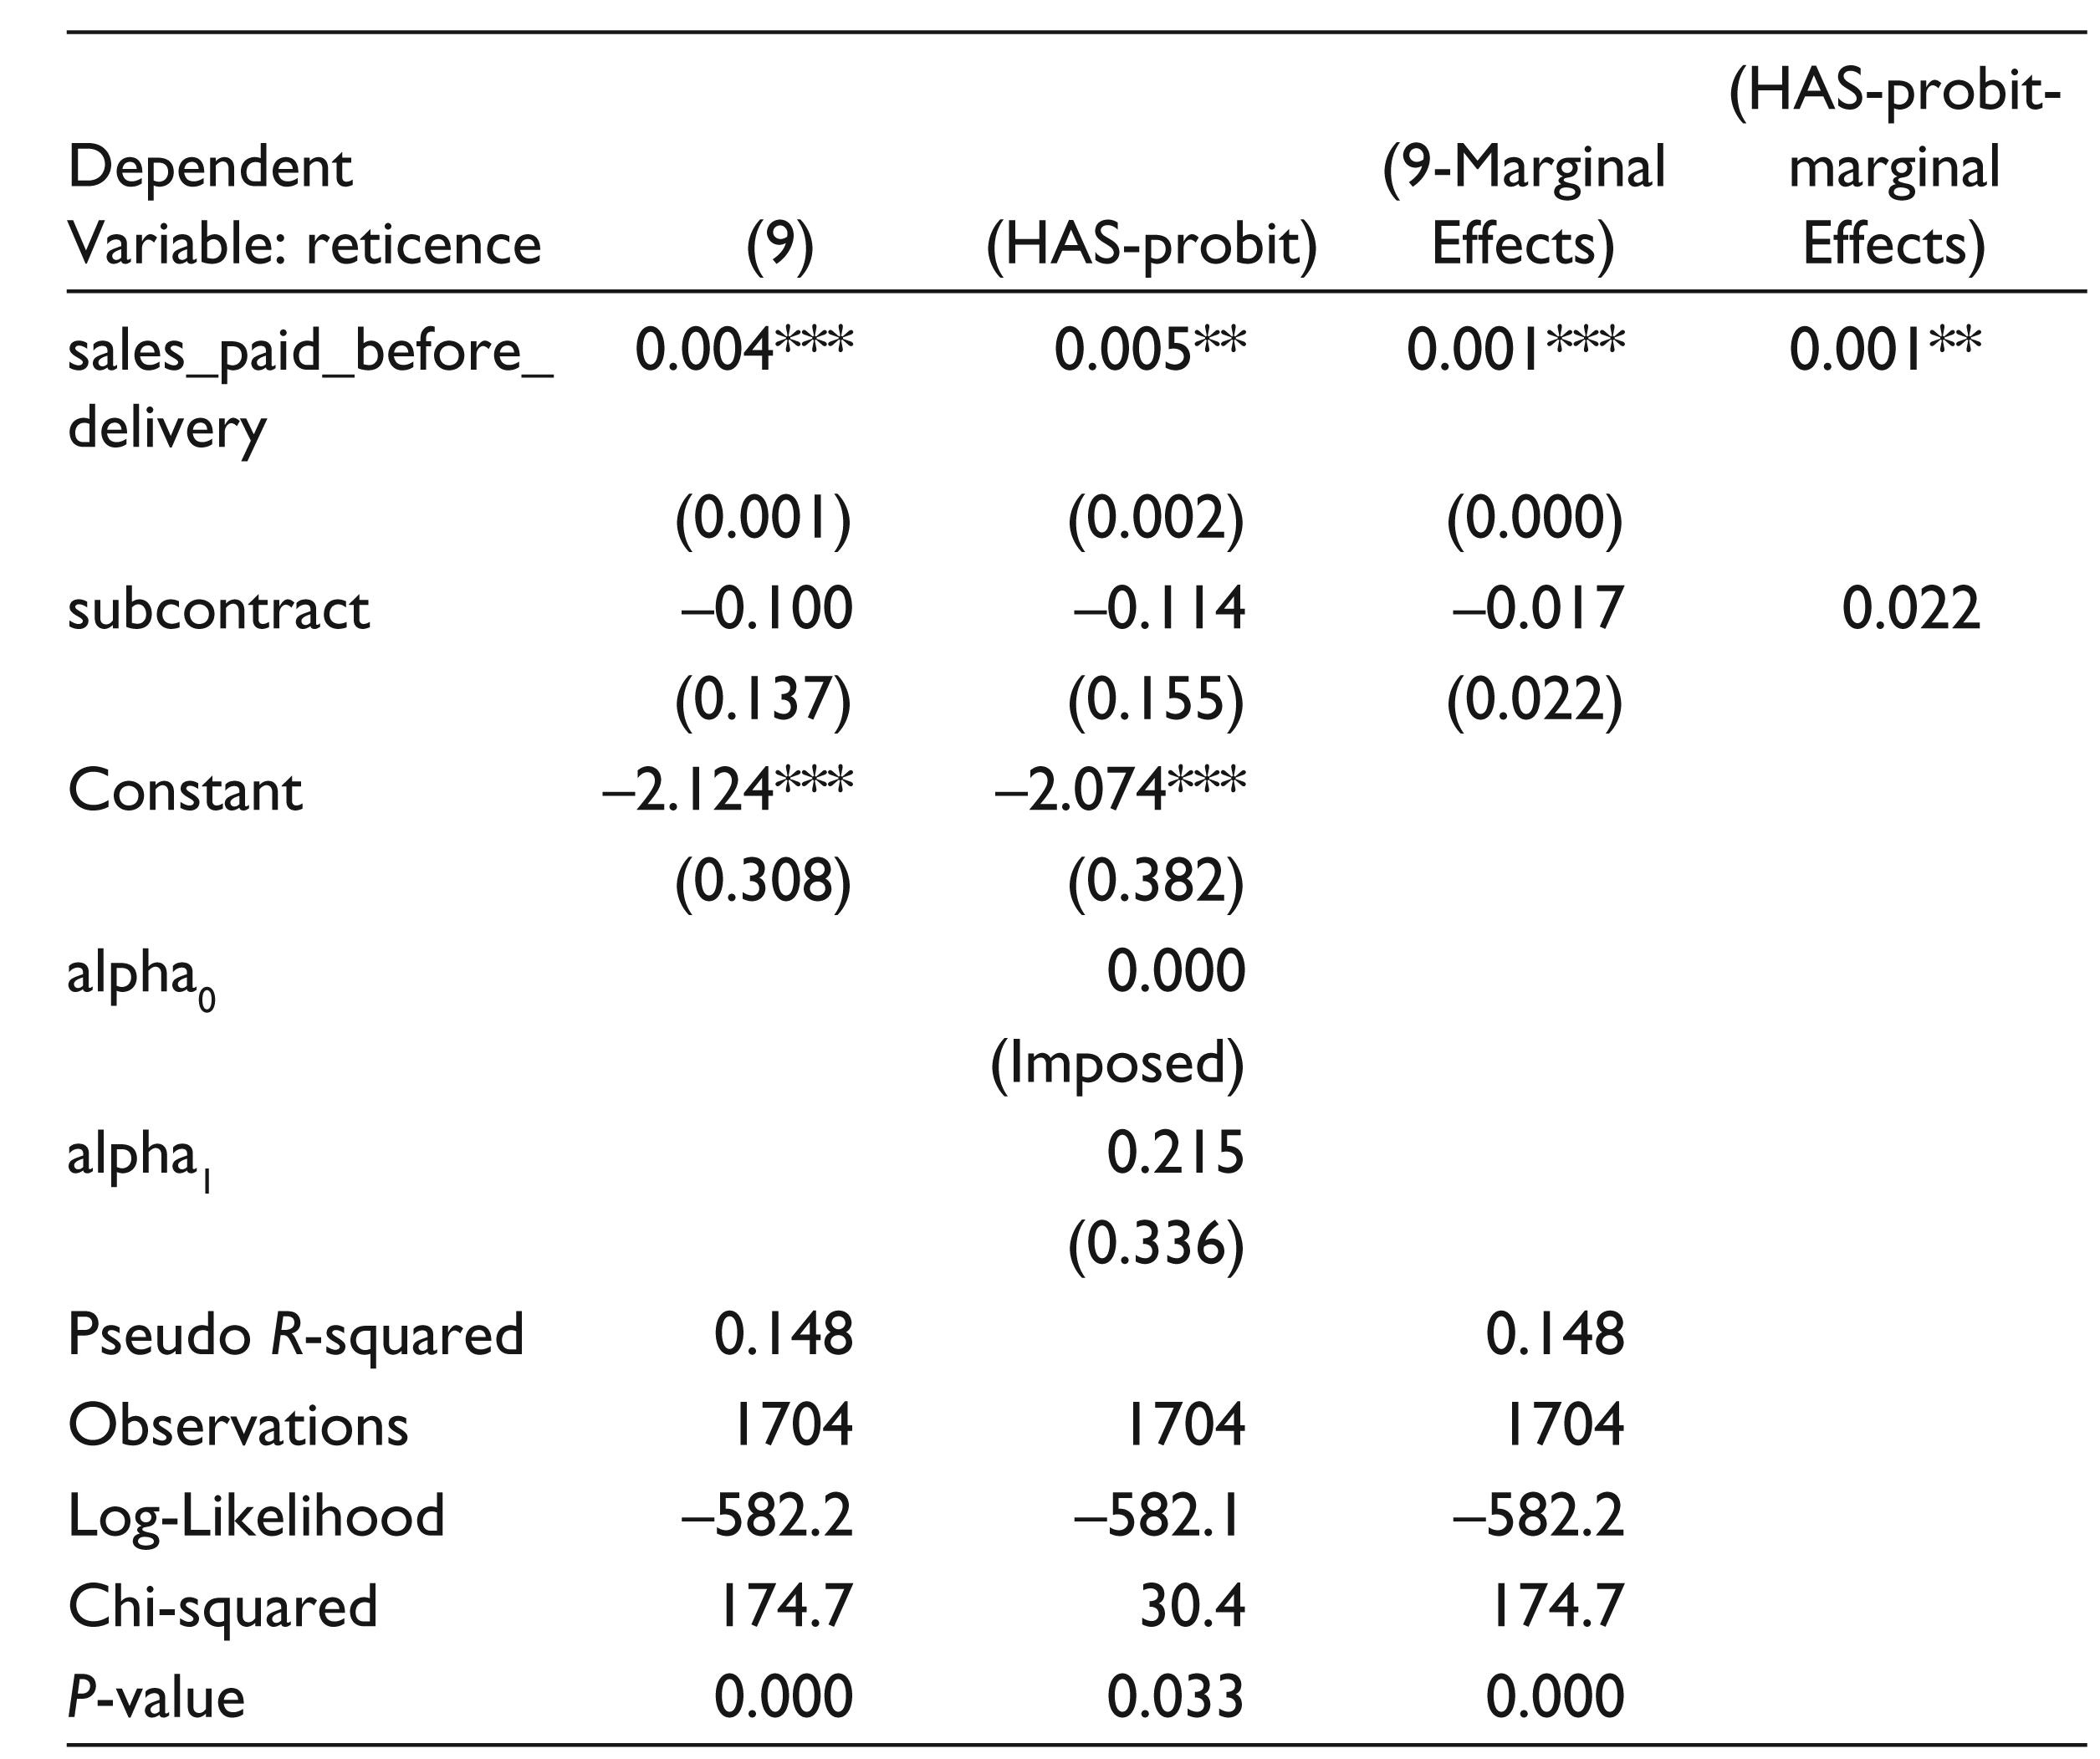
This study now turns to the potential problem of misclassifying some of the reticent interviewees as possibly candid. Using the methodology explained under ‘Misclassification of Reticence’ and in Equation (3), estimates are derived for the coefficients on the variables which are believed to affect reticence and also for the misclassification errors—α0 and α1. Results are shown in Table 17. Table 17 shows estimates from the ordinary probit estimation and the misclassification-adjusted probit estimates (labelled HAS-probit). Table 17 also shows the marginal effects from both models.
The ordinary probit model used in Table 17 is Model 9 from Table 15. Coefficients for the HAS-probit model are similar to those for the probit model. Imposing the restriction that the probability of observing a false positive is 0, the estimate of the probability of a false negative is 0.216. This is taken to mean that possibly 21.5 per cent of the sample were misclassified into the possibly candid group when they were in fact reticent. This value is consistent with the previous result that the proportion of reticent firms must be at least 16.9 per cent. Furthermore, using this result suggests that the level of guilt required to give rise to the observed distribution for the number of Yes must be 6.0 per cent. 3
As expected, the absolute value of the marginal effects from the HAS-probit model is larger than those of the ordinary probit model. Results from the HAS-probit model suggest that a 10 percentage point increase in the percentage of written orders is associated with an increased probability of being reticent of 0.01 probability points. This also applies to the percentage of material paid for after delivery and the percentage of sales paid for before delivery. The coefficients on these three variables have the same sign, the same sized marginal effect and are all significant at (at least) the 5 per cent level.
The largest marginal effect from the HAS-probit model came from the dummy variable for having more than 5 close competitors. A company with more than 5 perceived close competitors is 25 percentage points less likely to be reticent compared to a company with no perceived close competitors.
Conclusion
The aim of this study was to investigate the factors that drive reticence amongst companies when answering RR questions. The impact of misunderstanding, ignorance, firm outcomes, guilt, trust and the risk of detection were examined, respectively. Evidence was found for both trust and perceived detection to influence reticence; no evidence was found for the other variables to be significantly related to reticence. This seems to suggest that companies are more willing to exchange potentially sensitive information with another agent if they have trust in that agent and if there is relatively little chance of them being identified. In the context of corruption, this suggests that people are more likely to admit to something if there is less of a chance that the information they pass on can/will be used against them. These results imply that more accurate data might be acquired from large populations (where the members of the populations are aware of the large size of the population).
Footnotes
Acknowledgements
The author acknowledges Richard Dickens, Alan Winters and participants at the 2012 EUDN PhD workshop for useful comments. This study was conducted whilst the author was at the Department of Economics in the University of Sussex; the author thanks the University and the Department for letting the author use their resources.
This work was carried out with support from the Economic and Social Research Council. The author thanks the team at the World Bank Enterprise Survey Unit for making the data available. He also thanks participants of the Economics of Corruption course, University of Sussex DPhil Seminar, University of Sussex Research in Progress Seminar, Spring Meeting of Young Economists and the European Survey Research Association for their useful comments. All remaining errors are my own.