



Abstract
The purpose was to study the effect of physical activity (PA) on mental health according to self-reported vision categories among adolescents. The study was conducted in Nord-Trøndelag, Norway, during the period 1995–1997, with a follow-up 4 years later. Self-reported measurements were used to assess PA and vision at baseline, and mental health problems and well-being at follow-up. The main linear regression analyses included 1417 adolescents between the age of 12 and 17 years, of which 46 had reported visual impairment. Among those reporting no impairment, conducting <1 day per week of PA was significantly associated with having lower levels of well-being at follow-up compared to those conducting ⩾1 day of PA. Among those reporting visual impairment, the mental health benefits of conducting weekly PA compared with conducting non-weekly PA were observed only among those who were more emotionally unstable or introvert at baseline. In conclusion, further longitudinal studies are warranted to examine whether the mental health responses of PA may be dependent on the adolescent’s vision status.
Keywords
Introduction
Adolescence is a sensitive period of life, and adolescents living with visual impairment not only have to cope with the same developmental challenges as sighted peers but also with difficulties related to visual functioning (Pfeiffer & Pinquart, 2011). Moreover, factors associated with higher risks of lifestyle-related disorders either start or intensify in this life stage, and the way that adolescents handle the challenges may impact health-related outcomes later in life (Sawyer, Drew, Yeo, & Britto, 2007).
One of the major health-related challenges faced during adolescence is the more risk factors related to mental health (e.g. substance abuse), and up to one in five adolescents may have a mental health problem that is severe enough to be classified as a mental disorder (Merikangas, Nakamura, & Kessler, 2009). In the association between vision status and mental health, studies have found that adolescents with visual impairment have reported a lower quality of life compared with sighted adolescents (Chadha & Subramanian, 2011). However, inconsistent results have been found for well-being and symptoms of anxiety and depression (Huurre & Aro, 1998; Kef, & Deković, 2004; Pinquart & Pfeiffer, 2011, 2012).
Another health-related concern is the higher prevalence of physical inactivity in adolescents compared to children in the general population (Armstrong & Welsman, 2006; Kolle, Steene-Johannessen, Andersen, & Anderssen, 2010) and in populations of individuals with visual impairment (Kozub & Oh, 2004). Furthermore, the physical activity (PA) levels of children and adolescents with visual impairment are evidently lower than those of children and adolescents with no visual impairment (Kozub & Oh, 2004; Houwen, Hartman, & Visscher, 2009). The PA levels of adolescents with visual impairment may be explained by the fact that they are likely to experience multiple barriers to their involvement in such activities and some of the barriers stem directly from having a visual impairment (Lieberman, Ponchillia, & Ponchillia, 2013).
The lower levels of PA found among adolescents with visual impairment may be related to their mental health status. The association between PA and mental health has been widely investigated in adolescent populations in general (Ahn & Fedewa, 2011; Camero, Hobbs, Stringer, Branscum, & Taylor, 2012), but has not been studied among adolescents with visual impairment. All studies from Westernized and non-Westernized countries have included adults and used either a cross-sectional design (Di Cagno et al., 2013; Holbrook, Caputo, Perry, Fuller, & Morgan, 2009; Labudzki & Tasiemski, 2013; Valliant, Bezzubyk, Daley, & Asu, 1985) or a qualitative design (Pereira, Osborne, Cabral, & da Silva, 2011). Hence, population-based studies with prospective designs and including a sample of adolescents are needed.
The underlying goal of our study was to examine the effect of leisure-time PA on symptoms of mental health problems and subjective well-being (SWB) among adolescents with self-reported no impairment (SRNI) and self-reported visual impairment (SRVI). The International Classification of Disability and Functioning and Health: Children and Youth Version (ICF-CY) framework was used as a theoretical framework and for terminology (World Health Organization, 2007).
Materials and methods
Design and sample
Data were collected from the adolescent part, Young-HUNT, of a prospective population-based health study carried out in Central Norway, namely, the Nord-Trøndelag Health Study, also known as the HUNT Study (Holmen et al., 2014). During the period 1995–1997, all students attending middle school (seventh to ninth grade) and high school (first to third grade) were invited to participate in the first wave of the survey (Young-HUNT 1). All students, regardless of any impairment status, were integrated in state schools in Norway at the time of the study. A questionnaire was handed out at school and completed during one school hour. Help was provided by teachers to those struggling with reading the questions. The questions covered public health issues such as mental health, somatic health, and health behaviors. Within one month of the completion of the questionnaire, a medical examination of all eligible students was conducted at the school by a qualified nurse. A total of 8983 (88%) adolescents completed the questionnaire in the first wave of the study.
The second wave of the Young-HUNT Study was conducted in the period 2000–2001, and the study protocol was similar to that of the Young-HUNT 1 Survey. The youngest participants from the first wave of the study were invited (seventh and eighth grade at baseline) to participate in the follow-up. Among the 3124 eligible adolescents, 2399 (77%) completed the questionnaire.
As shown in Figure 1, a total of 348 participants were excluded from the analyses due to missing information on vision, PA, or mental health. A further 634 participants who reported either “a little” or “somewhat” to the question about vision impairment were excluded in order to include adolescents with the most severe visual impairment and compare them to their contrast, namely, no impairment. Therefore, the main analyses included 1371 adolescents who had reported no impairment and 46 adolescents who had reported severe visual impairment.
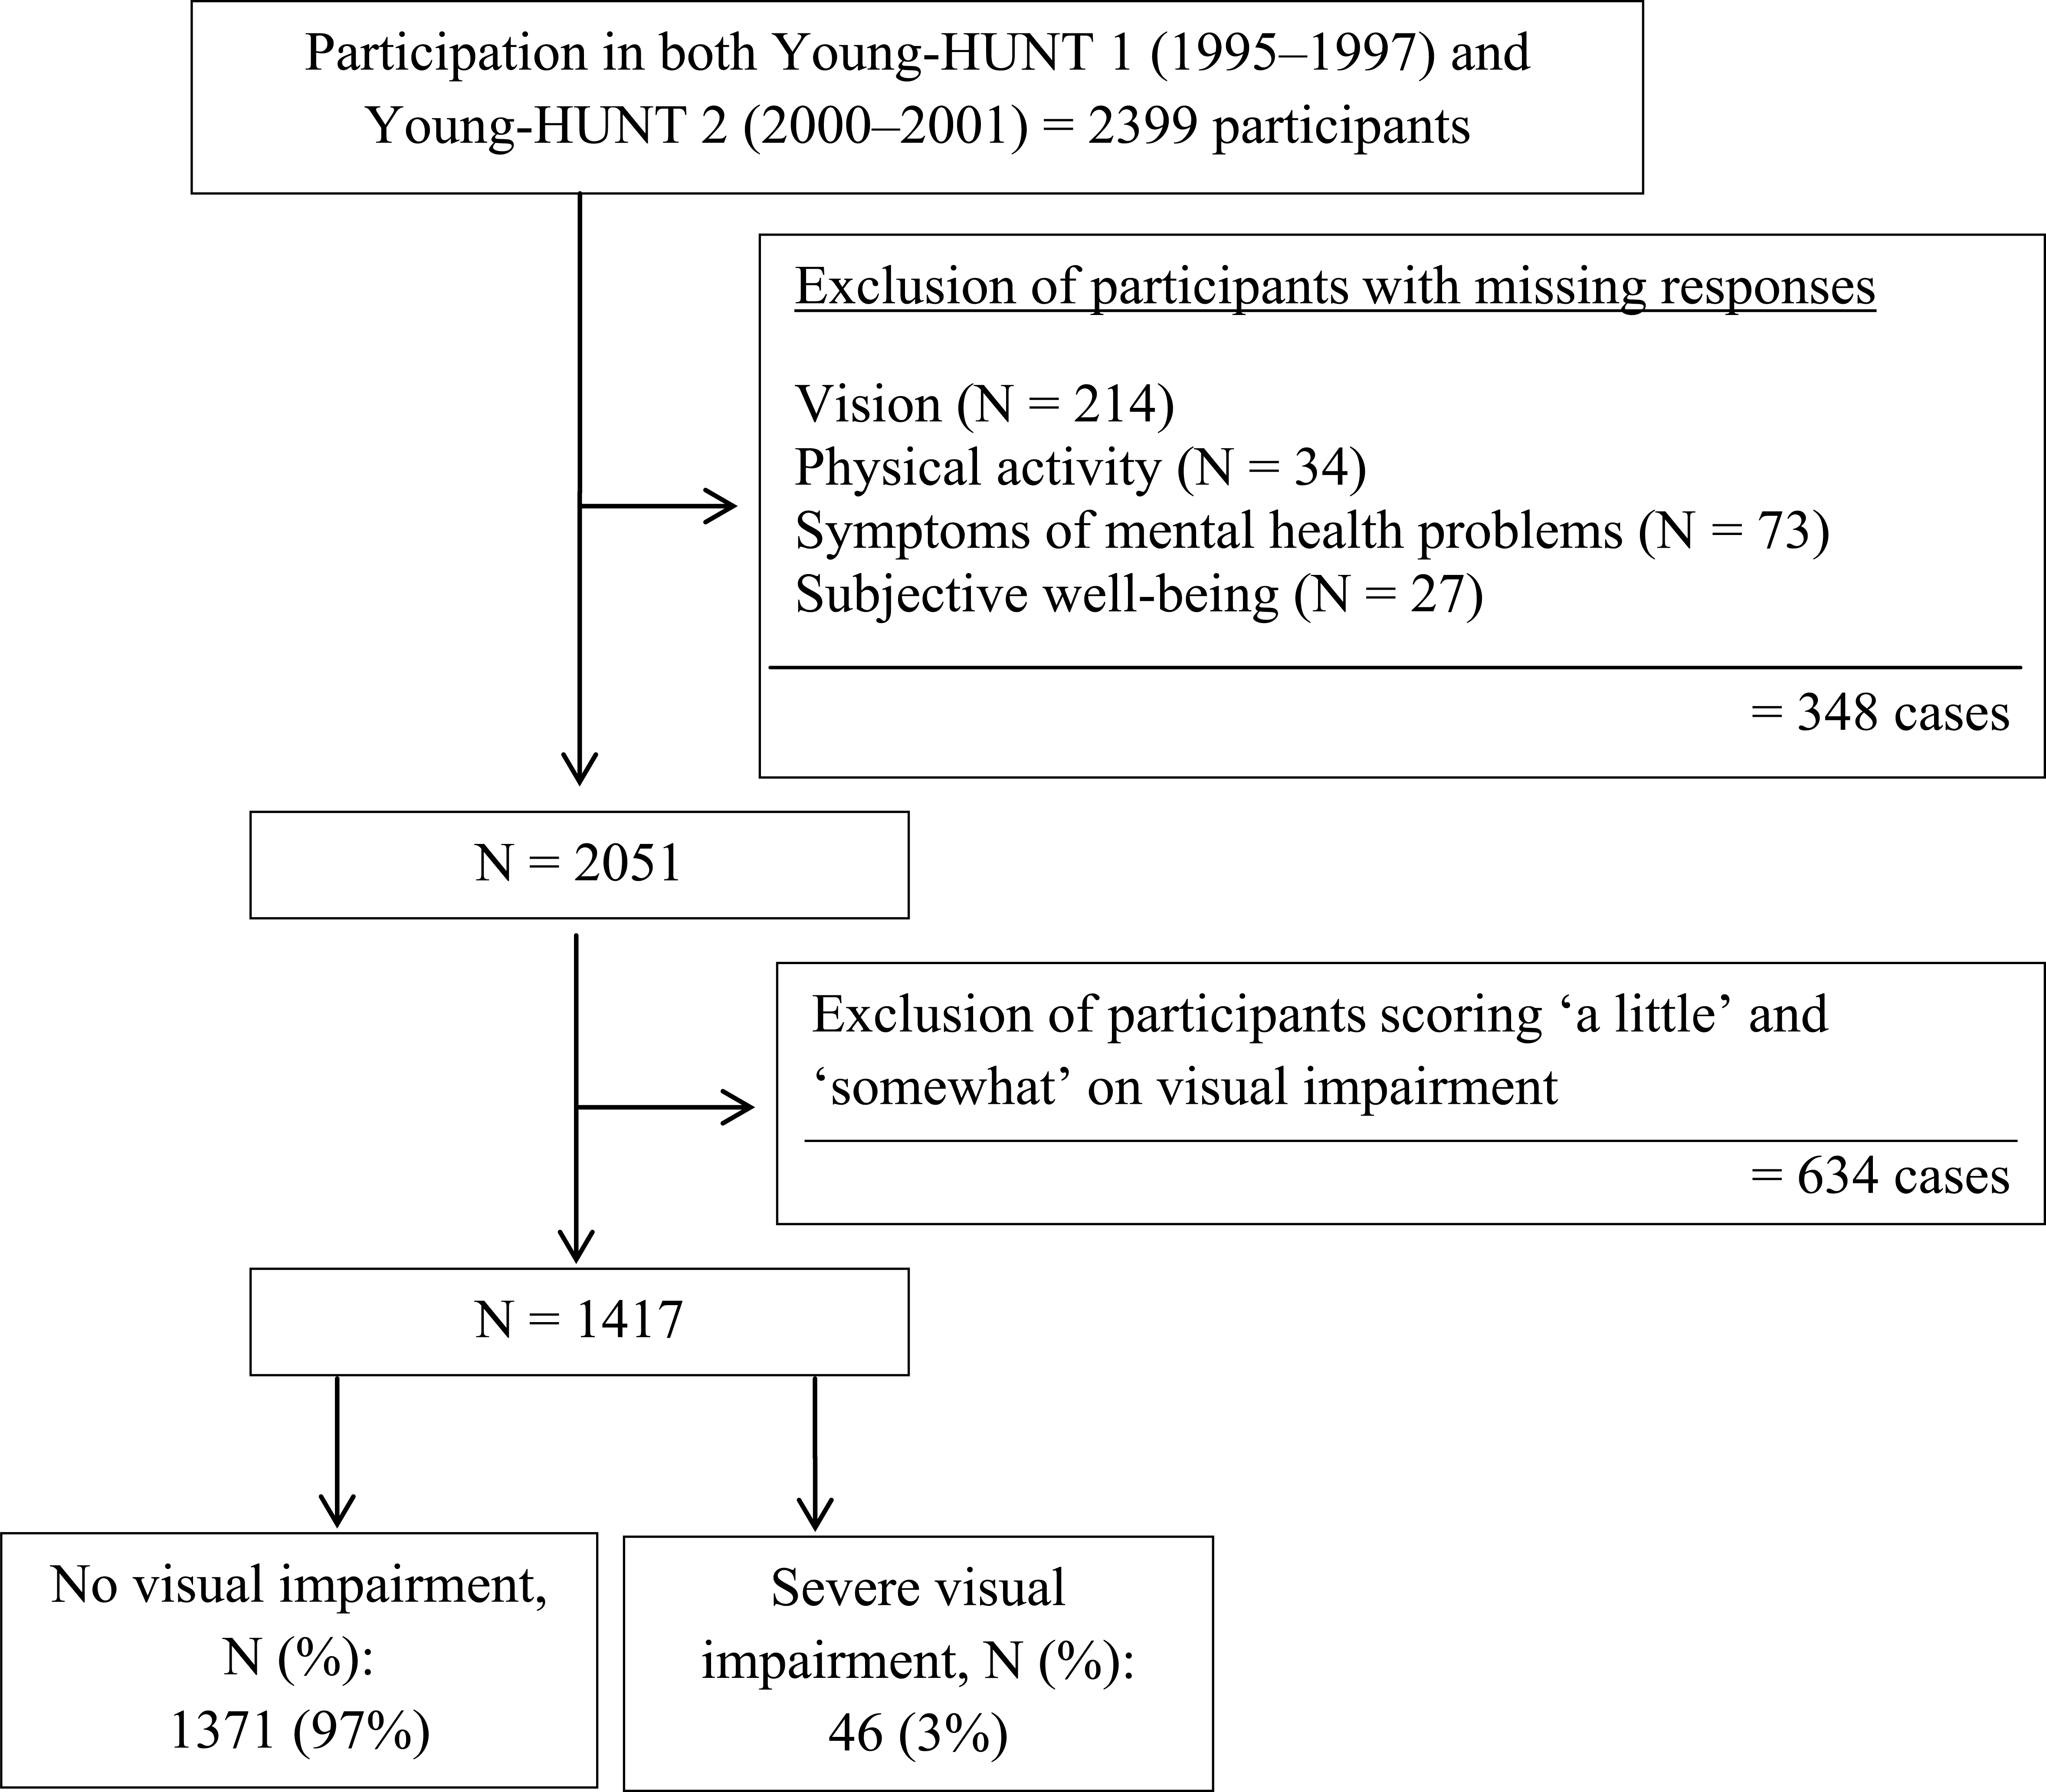
Flow chart of the subject selection and exclusion process.
Measures
Vision
Self-reported measures of vision have been used more frequently in large studies (Whillans & Nazroo, 2014). Compared to direct measures of vision, self-reported measures have the advantage of low costs, being less prone to oversimplification of vision status, and providing a more complete understanding of an individual’s interpretation of visual abilities (Whillans & Nazroo, 2014). In our study, the presence and severity of visual impairment were assessed at baseline by a single question: “How would you describe your visual impairment?” The question had four response alternatives: “no,” “a little,” “somewhat,” and “severely.” The study included participants with SRNI with respect to vision and SRVI that was severe.
Physical activity
Leisure-time PA is activity undertaken in the individual’s spare time “that leads to any substantial increase in the total daily energy expenditure” (Bouchard, Blair, & Haskell, 2012, p. 12). In Young-HUNT 1 and 2, days and hours of moderate to high intensity of weekly leisure-time PA were measured. The questions were derived from the World Health Organization’s Health Behavior in School-aged Children (WHO HBSC) study (King, Wold, Tudor-Smith, & Harel, 1996). For our study, frequency of PA was chosen for the main analyses because the question was found to yield slightly more reliable and accurate responses than the question about hours of PA (Rangul, Holmen, Kurtze, Cuypers, & Midthjell, 2008). Frequency of PA has been found to have a substantial reliability (r = .73) and fair validity compared with VO2-peak (r = .39) among Norwegian adolescents (Rangul et al., 2008).
The item includes an 8-point response scale: “never,” “less than once a month,” “not every 14th day, but more than once a month,” “not every week, but at least once every two weeks,” “1 day a week,” “2–3 days a week,” “4–6 days a week,” and “every day.” For our study, a category named “non-weekly physical activity” was created by including those reporting “not every week, but at least once every two weeks” or being physically active less frequently. The category “weekly physical activity” included those who responded that they were physically active 1 day per week or more frequently.
Mental health
Tudor (1996) claimed that mental health is divided into two separated and correlated dimensions: a mental illness dimension and a mental well-being dimension. In our study, the mental illness dimension of mental health was assessed using the Hopkins Symptom Checklist (SCL). The SCL was used to measure the combined symptoms of anxiety and depression at baseline and follow-up (Strand, Dalgard, Tambs, & Rognerud, 2003). The scale assessed how each participant had felt in the past 14 days and the participant reported on a 4-point Likert scale, ranging from 1 (not at all bothered) to 4 (extremely bothered). The 25-item version of the checklist (SCL-25) has been found to identify 50% of anxiety and depression cases as to the diagnoses assessed by the Composite International Diagnostic Interview (Tambs & Moum, 2007). For our study, a shortened 5-item version (SCL-5) was included at baseline and follow-up that correlates highly (r = .92) with the 25-item scale (Tambs & Moum, 2007). In accordance with a recommendation by Strand et al. (2003), sum scores from the five items were added up and divided by the number of items. The sum score had a Cronbach’s alpha of .82.
SWB scale was included at both time points and it assessed the mental well-being dimension of mental health. In accordance with a recommendation by Diener, Oishi, and Lucas (2009), our SWB scale included questions of affect and satisfaction with life. The SWB scale had the following three items: (1) “When you think about the way your life is going at present, would you say that you are by and large satisfied with life or are you mostly dissatisfied?”; (2) “In general, do you feel strong and in a good mood or tired and worn out?”; and (3) “Are you generally happy or sad?” The responses for each item were measured on a 7-point Likert scale. A sum score was created by adding up the scores from the three questions and then the summarized scores were divided by three. A higher score on the sum score indicated higher levels of well-being. The sum score had a Cronbach’s alpha of .78.
Covariables
All included covariables were assessed at baseline (1995–1997). Possible confounding were identified from existing literature (Bauman et al., 2012; Diener et al., 2009; Miettinen & Cook, 1981; Sallis, Prochaska, & Taylor, 2000; Strauss, Rodzilsky, Burack, & Colin, 2001) and a priori reasoning. We identified the following variables from the study as potential confounders: gender, age, smoking status, alcohol consumption, age and gender-specific body mass index (Cole, Bellizzi, Flegal, & Dietz, 2000; Cole, Flegal, Nicholls, & Jackson, 2007), personality, self-esteem, self-rated health, feeling lonely, involved in sports, and chronic somatic diseases. Chronic somatic diseases comprised asthma, cardiovascular diseases, kidney disease, pulmonary disease, bowel disease, rheumatism, allergy, epilepsy, musculoskeletal disease, cancer, cerebral palsy, nervous disease, and other unspecified chronic diseases. Those who did not report any diseases were coded as “no.”
Statistical methods
Generalized linear models (GLMs) were used to estimate the association between PA levels measured at baseline and the SWB scale measured at follow-up. The estimated beta coefficient and its standard error were used to calculate the 95% confidence interval (CI). Model fit was evaluated using residual plots. The SWB variable had a slightly negatively skewed distribution (−.47), but was used as an untransformed variable in the model since the results were similar to those obtained using SWB as a transformed variable.
A generalized linear regression model with a gamma distribution and log-link relationship was used to estimate associations between the SCL-5 score at follow-up with baseline levels of PA because the SCL-5 scores were right-skewed. Model fit was examined using residual plots.
Treating PA either as a dichotomous variable (<1 day per week, ⩾1 day per week) or as a continuous variable had identical results with the SWB scale. For SCL-5 among those with SRNI, the association was somewhat weaker for PA as a linear term as to PA included as a categorical variable. We chose to report the results of the analyses using PA as a categorical variable and ⩾1 day per week was used as a reference category. All two-way statistical interactions were tested between the exposure and each covariate. Additional analyses were conducted that included vision as a product term with PA in the regression model.
Multiple imputation chained equations (MICE) were used to evaluate potential biases in the main analyses including complete data. The MICE yielded complete data sets for the respondents that had no missing data on primary variables at baseline and were eligible to participate at follow-up (N = 2028). In total, 50 data sets were imputed with 10 cycles for each data set in order to fulfill the variability criteria set by White, Royston, and Wood (2011). The imputed data sets were then averaged using Rubin’s rules (Rubin, 2004). More details regarding the imputation model are found in Appendix 1.
To check the robustness of the main analyses, three types of sensitivity analyses were conducted. First, since power might have been an issue in the SRVI category, we included all participants who responded “somewhat” to the question about visual impairment at baseline in the SRVI category (N = 222). Second, since PA may change in time, the main analyses were supplemented by running PA measured at follow-up (2000–2001). Third, we used a logistic model as an alternative statistical model to study the association of having possible mental health problems or having low levels of well-being with baseline PA category (<1 time per week, ⩾1 time per week). Accordingly, we dichotomized the SCL-5 scale (<2, ⩾2) and the SWB scale (⩾4, <4), based on the coding used in earlier literature (Fløtnes, Nilsen, & Augestad, 2011; Strand et al., 2003).
For most analyses, separate analyses were conducted for those with SRNI and SRVI. An alpha level below .05 or a 95% confidence level that did not include the zero value was considered statistically significant. Statistical Package for the Social Sciences (SPSS) Version 21 (IBM Corp., New York, USA) was used for the main statistical data analyses and sensitivity analyses, while the MICE were carried out using Stata Version 13 (Stata Corp., College Station, TX, USA).
Ethics
All participants gave their written consent to take part in the study. For pupils younger than 16 years, written consent was obtained from one of their parents or guardians. The study was approved by the regional medical ethical committee (Regional Etisk Komite for Medisinsk og Helsefaglig Forskning, REC). The HUNT Research Centre granted us permission to analyze the data from Young-HUNT 1 and 2.
Results
Table 1 lists the numbers and percentages relating to baseline characteristics, mental health, and PA among adolescents with SRNI and SRVI. Results from two-tailed independent t-tests showed that those with SRNI had non-significantly fewer symptoms of anxiety and depression at follow-up compared to those with SRVI (M = 1.49 vs 1.64, df = 1415, p = .06, 95% CI = [−0.30, 0.01]). There was no significant difference in well-being scores measured in Young-HUNT 2 among those with SRNI compared to those with SRVI (M = 5.25 vs 5.07, df = 1415, p = .22, 95% CI = [−0.11, 0.45]).
Number and percentage of baseline characteristics according to self-reported vision categories.

MHPA: moderate-to-high intensity physical activity; EPQ: Eysenck Personality Questionnaire.
Age- and gender-specific cut-offs (Cole, Bellizzi, Flegal, & Dietz, 2000; Cole, Flegal, Nicholls, & Jackson, 2007).
Cut-off at midpoint of the scale and higher scores indicate higher levels of that particular characteristic.
Cut-off according to previous literature (Fløtnes, Nilsen, & Augestad, 2011). Higher scores indicate higher levels of well-being.
Cut-off according to previous literature (Strand, Dalgard, Tambs, & Rognerud, 2003). Higher scores indicate more symptoms of mental health problems.
In the unadjusted regression analyses of the entire study sample, the associations between PA and mental health were similar within levels of self-reported vision for both symptoms of mental health problems (χ2(1, 1413) = 1.93, p = .17) and well-being (F(1, 1413) = 0.01, p = .91). In the vision-specific analyses, those with SRNI and reporting non-weekly PA had a significantly higher unadjusted mean score on the SCL-5 (β = .08, p = .01, 95% CI = [0.02, 0.14]) and a significantly lower unadjusted mean score on the SWB scale (β = −.45, p < .001, 95% CI = [−0.61, −0.29]) compared with those with SRNI and reporting weekly PA. Among adolescents with SRVI, similar associations were seen as among adolescents with SRNI for the SCL-5 (unadjusted β = .22, p = .04, 95% CI = [0.02, 0.43]), but for the SWB scale the association was statistically insignificant (unadjusted β = −.41, p = .17, 95% CI = [−1.00, 0.18]).
As shown in Tables 2 and 3, the adjusted betas turned more towards the null compared to the unadjusted betas. Moreover, the association between PA and SCL-5 became non-significant in the adjusted models for those with SRNI and SRVI. There were too few adolescents with SRVI to run full-adjusted models, even in the models using multiple imputations.
Results of general linear regression analyses for well-being (Young-HUNT 2) in relation to physical activity (Young-HUNT 1) according to self-reported vision categories.

CI: confidence interval; MHPA: moderate-to-high intensity physical activity; MICE: multiple imputation chained equations.
Non-weekly PA is coded as less than 1 day per week of MHPA and weekly PA is coded as 1 day per week or more of MHPA.
Model I: adjusted for age and gender.
Model II: Model I + extroversion, neuroticism, chronic somatic diseases (no, yes), and baseline SWB score.
Model III: Model II + body mass index (underweight, normal weight, overweight), feeling lonely (no/rarely, sometimes, often/very often), self-rated health (poor/not so good, good, very good), self-esteem (<2.5, ⩾2.5), and involved in sports (no, yes).
MICE I: Model III.
MICE II: Model II.
Results of adjusted gamma regression analyses for symptoms of mental health problems (Young-HUNT 2) in relation to physical activity (Young-HUNT 1) according to self-reported vision categories.

CI: confidence interval; MHPA: moderate-to-high intensity physical activity; MICE: multiple imputation chained equations.
Non-weekly PA is coded as less than 1 day per week of MHPA and weekly PA is coded as 1 day per week or more of MHPA.
Model I: adjusted for age and gender.
Model II: Model I + extroversion, neuroticism, chronic somatic diseases (no, yes), and baseline SWB score.
Model III: Model II + body mass index (underweight, normal weight, overweight), feeling lonely (no/rarely, sometimes, often), self-rated health (poor/not so good, good, very good), self-esteem (<2.5, ⩾2.5), and involved in sports (no, yes).
MICE I: Model III.
MICE II: Model II.
In this study, personality was measured using the Eysenck Personality Questionnaire–Neuroticism (EPQ-N) scale and Eysenck Personality Questionnaire–Extroversion (EPQ-E) scale. Each scale was dichotomized into a binary variable using the mid-value of the scale (Brunes, Augestad, & Gudmundsdottir, 2013). We observed a two-way statistical interaction between PA and the EPQ-N for both the SCL-5 (χ2(1, 38) = 8.99, p = .03) and the SWB scale (F(1, 38) = 3.34, p = .07). Moreover, a two-way statistical interaction was found between PA and the EPQ-E with the SCL-5 (χ2(1, 40) = 9.92, p = .02) and the SWB scale (F(1, 40) = 9.88, p = .009). Among adolescents with SRVI and classified as being more emotionally unstable (EPQ-N score ⩾3) or as being more introverted (EPQ-E score < 3), scoring non-weekly PA was significantly associated with more mental health problems and lower levels of well-being than scoring weekly PA (Figure 2). No other important two-way interactions were observed for SRNI or for SRVI.
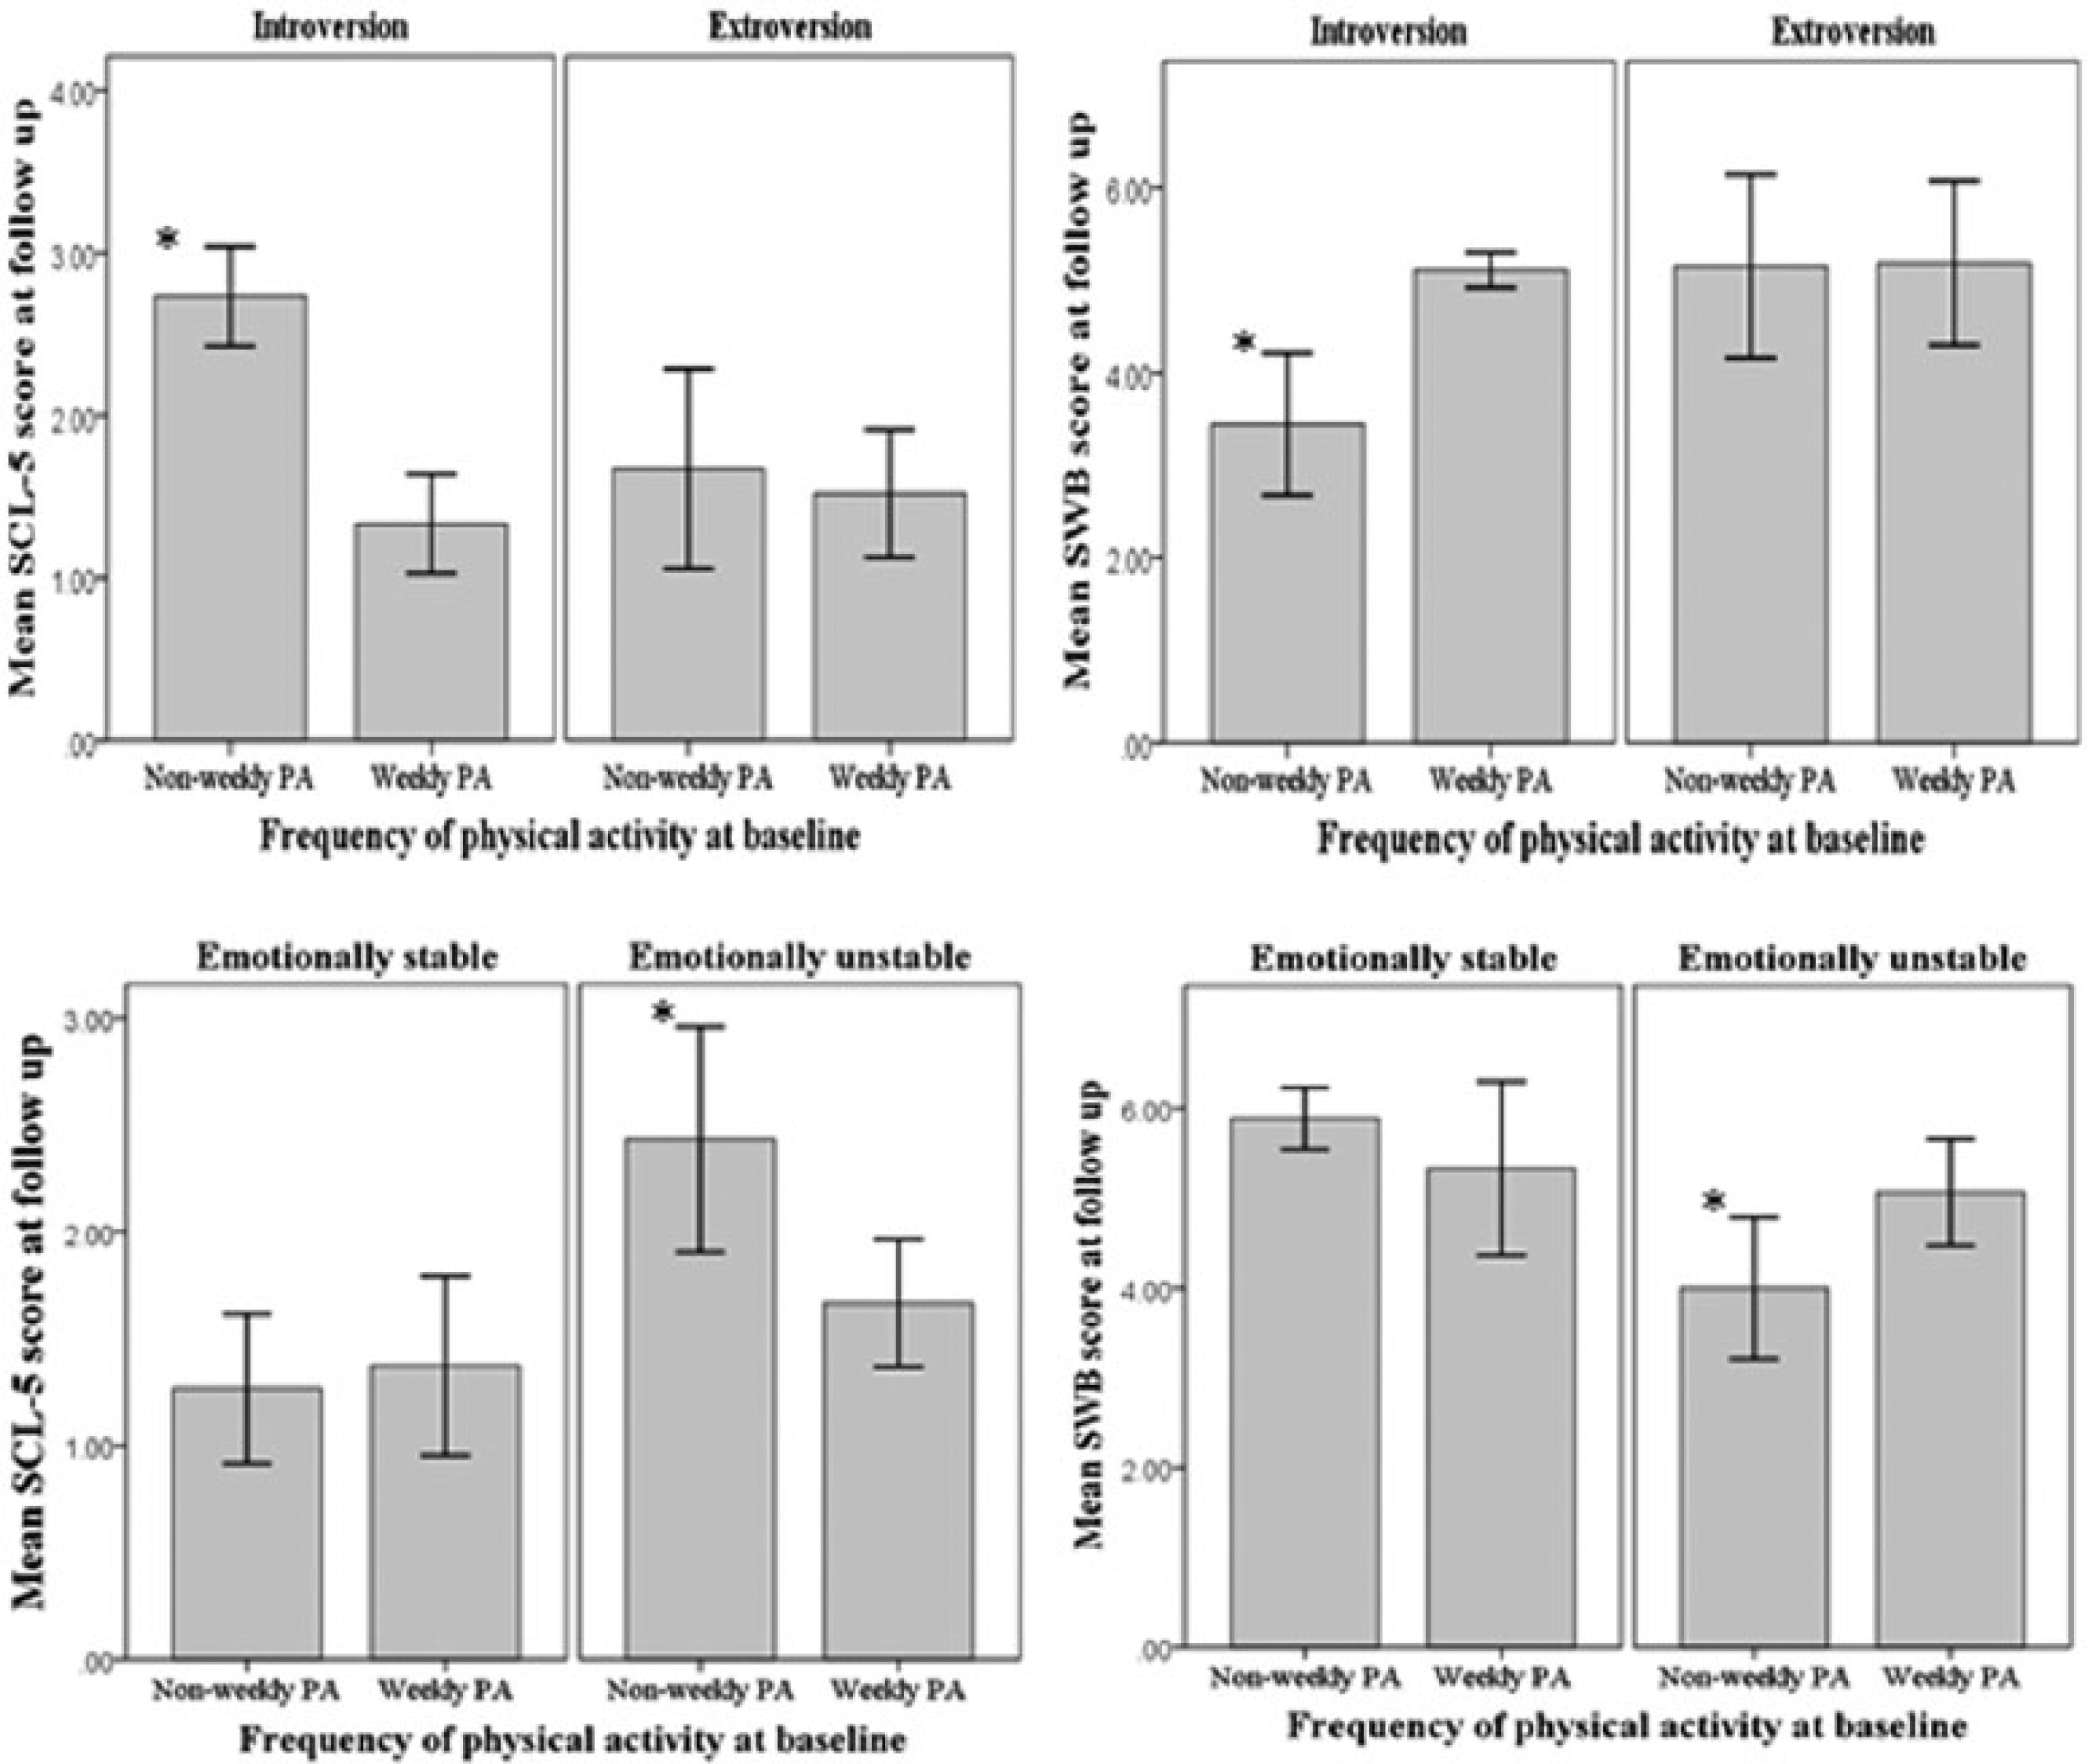
Crude mean mental health scores (SCL-5 and SWB) at follow-up with baseline physical activity according to personality traits among adolescents reporting severe visual impairment.
We checked the robustness of the results in our sensitivity analyses. First, the association between PA and mental health was not significant after including participants who responded “somewhat” to the question about visual impairment in the SRVI category (results not shown). Second, PA measured in Young-HUNT 2 was significantly associated with concurrent mental health status (SCL-5 and SWB score) also measured in Young-HUNT 2 only among adolescents with SRNI (results not shown). Third, in the full-adjusted logistic model among those with SRNI, the risk of mental health problems (SCL-5 score ⩾2.0) was 1.31 (p = .36, 95% CI = [0.74, 2.30]) and the risk of scoring below <4.0 on the SWB scale was 2.11 (p = .02, 95% CI = [1.15, 3.84]) among the non-weekly PA category compared with weekly PA category. For those with SRVI, the age-adjusted risk of a SCL-5 score of 2.0 or higher was 1.91 (p = .21, 95% CI = [0.70, 5.21]) among those reporting non-weekly PA compared with those reporting weekly PA. There were too few cases with a SWB score of 4.0 or less to run the age-adjusted logistic model for SWB among those with SRVI (Table 1).
Discussion
The results showed that adolescents with SRNI reported more days a week of PA and fewer symptoms of mental health problems at baseline compared to adolescents with SRVI. Those with SRNI and scoring one day or more per week of PA at baseline had significantly higher levels of well-being at the 4-year follow-up than those scoring lower levels of PA. Among those with SRVI, the mental health benefits of weekly levels of PA compared to non-weekly levels of PA was statistically significant among those scoring as more emotionally unstable or introvert at baseline.
Three of the cross-sectional studies that included adults with visual impairment found that PA was significantly associated with mental health (Di Cagno et al., 2013; Labudzki & Tasiemski, 2013; Valliant et al., 1985), while one study found no association between daily step counts measured by accelerometer and quality of life (Holbrook et al., 2009). Similar to our results, high levels of positive mental health was reported in the studies above (e.g. Labudzki & Tasiemski, 2013). However, we observed that adolescents with SRVI scored high on symptoms of mental health problems at both time points, and our SCL scores are higher than what was observed among 30 Italian male athletes and non-athletes with visual impairment also using the SCL as a measure of mental health problems (Di Cagno et al., 2013). Nevertheless, the higher levels of mental health problems among adolescents with visual impairment may be multifactorial, but some studies have found more problems coping with developmental tasks such as building social relationships (Huurre & Aro, 1998; Kef & Deković, 2004; Pinquart & Pfeiffer, 2012). This corresponds well to our finding that those with SRVI reported more often feelings of loneliness at baseline as to those with SRNI.
We found that baseline PA levels were significantly associated with mental health benefits 4 years later among adolescents with SRVI and scoring to be more emotionally unstable or introvert. Previous studies have shown that positive personal factors are strongly associated with a physically active behavior and mental health of individuals with visual impairment (Garaigordobil & Bernarás, 2009; Saebu & Sørensen, 2011). Moreover, individuals scoring high on neuroticism and low on extroversion have been reported as less physically active and more mentally distressed than their counterparts (Brunes et al., 2013). Among adolescents with SRVI and scoring to have a more stress-reactive personality, PA may have influenced the individual’s resilience to stress through emotional or instrumental support from parents, peers, and significant others (Kef & Deković, 2004; Sawyer et al., 2007; Yeung & Towers, 2013). We found that 50% of the adolescents with SRVI reported at baseline to participate in organized sports. Therefore, the experience of social support by being physically active may have been due to the fact that the adolescents practiced organized forms of leisure activities. On the other hand, the lower levels of mental health among adolescents with SRVI who reported a stress-reactive personality and non-weekly activity at baseline may reflect psychosocial barriers to their involvement in leisure-time PA such as overprotection and social isolation (Ayvazoglu, Oh, & Kozub, 2006; Lieberman et al., 2013). Still, we cannot be cartain of a synergy between PA and personality on mental health because of statistical and methodological issues (Greenland, Lash, & Rothman, 2008).
Adolescents with SRNI and reporting levels of PA of moderate to high intensity were consistently significantly associated with higher levels of well-being. Our finding is comparable with the results from a meta-analysis published by Ahn and Fedewa (2011). They concluded that 1–2 days or more per week of exercise intervention resulted in significant small improvements in mental health scores from baseline to follow-up compared with the control group among children and adolescents. PA of moderate to high intensity may provide adequate physiological responses and psychological rewards to improve well-being (Biddle & Mutrie, 2015). For example, the endorphin hypothesis states that physical exercise results in pleasurable feelings and euphoria due to the release of endogenous opioid peptides (Hoffmann, 1997). PA could also be indirectly related to well-being through fewer passive activities or experiencing positive social interactions (Biddle & Mutrie, 2015). Moreover, there could be a bidirectional association between PA and well-being, such that well-being influences PA level (Biddle & Mutrie, 2015). However, we did not test the possibility of reverse causality in our study.
We did not observe any clear association between PA and mental health problems for adolescents with SRNI. This finding is in contrast to the results from epidemiologic studies and reviews of intervention studies including a population of adolescents (Ahn & Fedewa, 2011; Camero et al., 2012; Fløtnes et al., 2011; Stavrakakis, de Jonge, Ormel, & Oldehinkel, 2012). The increase in SCL-5 scores that we observed from baseline to follow-up in the SRNI category might have been unrelated to their levels of PA, but connected to other biological, social, and environmental factors. Moreover, our results could have been different if we had included specific symptoms of mental health problems (Stavrakakis et al., 2012), carried out gender-specific analyses (Fløtnes et al., 2011), known the total amount and type of PA (Ahn & Fedewa, 2011; Camero et al., 2012), or had information on the social context in which the activity was conducted and the subjective experience of the activity (Whitelaw, Teuton, Swift, & Scobie, 2010).
This reported study is the first prospective population-based study conducted that has examined the long-term effects of PA levels on positive and negative aspects of mental health among adolescents with perceived visual impairment. One of the limitations of the study is confounding. We were unable to adjust for all identified covariates that may be confounding factors because of low sample sizes in the SRVI group and some measured variables had a high number of missing responses (e.g. current smoking status). Including variables that were possible mediators in the regression models may have turned the parameter being estimated more toward the null compared to the true value.
The Young-HUNT Study had a low rate of missing data, but selection bias can occur even with small fractions of missing data (White et al., 2011). However, our multiple imputation analyses were comparable to the results from the complete case analyses. Using information from the invitation list, Holmen et al. (2014) found that non-participants were older, more often boys, and were more often dropouts from upper secondary school compared with the respondents. Moreover, adolescents with mental health problems may be more reluctant to participate in research studies. Finally, non-response may be caused by the embarrassment of answering some of the questions or that adolescents with visual impairment find it difficult to complete a questionnaire. We therefore assume that it was a low to moderate chance that the missing at random (MAR) assumption was obtained for the included variables (Appendix 1).
Since the information on the dependent and independent variables was self-reported, information bias could have influenced the results of the study. The misclassification of PA is expected to be non-differential and the observed association is likely to be more toward the null than the true effect. Although the accuracy levels of self-reported information among adolescents may be lower than among adults, reliable information regarding self-reported PA and mental health has been found in earlier studies (Haugland & Wold, 2001; Rangul et al., 2008). In addition, adolescence is a sensitive period of life and we cannot rule out fluctuations during the study period in the adolescent’s PA levels, mental health status, and self-rated vision status. Finally, based on the findings of a previous study (Whillans & Nazroo, 2014), we expect that the SRVI category included adolescents who corrected their sight with glasses or contact lenses.
When considering the practical implications of the study, it should be borne in mind that the study period ended in 2001 and hence the historical context within which the data were collected might not be completely comparable with the situation today. However, based on the results of this study and more recent study data (Kozub & Oh, 2004; Holbrook et al., 2009; Houwen et al., 2009), efforts are needed to increase participation in leisure-time PA among individuals with visual impairment. Organizing leisure activities for groups of adolescents with visual impairment in Nord-Trøndelag County is challenging because there are very small numbers of such adolescents in the county. Leisure-time PA provides an arena for building friendships and for social interactions. Therefore, in rural areas, it is essential that trainers, parents, and involved others focus on integrating adolescents with visual impairment in leisure activities together with their sighted peers. Furthermore, those in charge of organizing activities including individuals with visual impairment are recommended to modify sports or exercises to the needs of adolescents with visual impairment by taking into consideration visual, personal, social, and environmental factors. This may not only nurture the adolescent’s feelings of enjoyment and mastery but could also remove some barriers to participation in regular PA (Lieberman et al., 2013).
Future studies should aim to replicate the findings from our study of vision-specific associations between PA and mental health by including a larger sample of adolescents, using a randomized controlled design, using objective measures of visual impairment, and measuring various aspects of leisure-time PA (e.g. the interpersonal context of the activity). It is also recommended that future studies include a measure of personality when examining the link between PA and mental health in samples of individuals with visual impairment.
Conclusion
Our results showed that adolescents with SRNI had significantly higher levels of moderate-to-high intensity PA and fewer symptoms of mental health problems at baseline than adolescents with SRVI. We found that the association between PA and mental health was dependent on the adolescent’s self-reported vision status. Leisure-time PA was only significantly associated with higher levels of well-being among adolescents with SRNI. Among adolescents with SRVI, conducting PA on a weekly basis was associated with fewer mental health problems and higher levels of well-being 4 years later for those who scored having a more stress-reactive personality, probably because of enhanced resilience to stress by participating in organized sports. However, for both vision categories, it is likely that the observed association between PA and mental health does not reflect the true causal relationship and further studies are warranted.
Footnotes
Appendix 1
Acknowledgements
The Nord-Trøndelag Health Study (The HUNT Study) is a collaboration between HUNT Research Centre (Faculty of Medicine, Norwegian University of Science and Technology (NTNU)), Nord-Trøndelag County Council, Central Norway Health Authority, and the Norwegian Institute of Public Health. The authors would also like to thank the language editing of Catriona Turner.
Declaration of conflicting interests
The authors declared no potential conflicts of interest with respect to the research, authorship, and/or publication of this article.
Funding
This work was supported with internal funding from the Norwegian University of Science and Technology (NTNU).