



Abstract
Walking is the most common mode of physical activity for individuals who are blind. However, this population tends to be physically inactive, possibly due to alterations in coordination patterns during walking. Therefore, the purpose of this study was to examine lower extremity coordination patterns during walking in persons who are blind, and age-, sex-, and body mass index–matched sighted controls. Five persons who are blind performed level walking independently (with a cane) and with a human guide. Sighted controls walked at matched speeds for both conditions. A 10-camera motion capture system was used to record segmental kinematics during both walking conditions. Angle–angle plots and modified vector coding was used to present inter-limb (left/right thigh) and intra-limb (ankle–hip, ankle–knee, and knee–hip) couplings across both walking conditions for each group. Frequency of coupling patterns was compared between groups using Mann–Whitney’s U tests. Inter- and intra-limb coordination patterns were similar between both groups during independent and guided walking conditions (all p > .05). Angle–angle plots depict reduced segmental and joint motion in persons who are blind compared with sighted controls. Although the visual feedback system is integral for coordination during complex tasks, persons who are blind perform level walking with similar lower extremity coordination patterns to sighted controls. Reductions in spatiotemporal and range of motion are likely linked to a more hesitant stepping pattern due to unfamiliarity with the environment.
Introduction
For youth and adults who are blind, physical activity has been identified as an important health-related behavior related to mental health (Ackley-Holbrook et al., 2016; Brunes et al., 2015) and quality of life (Haegele et al., 2019; Haegele & Zhu, 2019). Blindness (visual acuity < 3/60) is a low-incidence disability, with a global age-standardized prevalence for all ages of 0.48% in 2015 (Bourne et al., 2017; Keefe, 2019). Since walking has been identified as the most likely physical activity for individuals who are blind to engage in (Jaarsma et al., 2014), it may be particularly relevant to understand what factors influence walking behaviors among this population.
While much is known regarding the gait mechanics of sighted persons across all ages (Bennett et al., 2017; Chiu & Wang, 2007; Chung & Wang, 2010; Freedman Silvernail et al., 2013; Lythgo et al., 2009; McKay et al., 2017), little information exists regarding those who are blind. Research on persons who are blind in the field of biomechanics is scarce, possibly due to the low-incidence level and complexities with travel for this population. The few studies that have been performed found persons who are blind walk more slowly with shorter strides, increased energy expenditure and mechanical work, and reduced kinematics compared with the sighted controls (Bennett et al., 2019; Hallemans et al., 2010; Knutzen et al., 1985; Kobberling et al., 1989; Nakamura, 1997). Perhaps due to the low-incidence characteristics of this population, all but one of these studies (Nakamura, 1997) have been conducted with fewer than five participants who are completely blind. It is also important to note that many of the previous studies did not match participants based on anthropometrics (e.g., sex, height, mass, body mass index [BMI]) and/or walking speed. As most of the previously examined variables are related to anthropometric measures and walking speed (Browning & Kram, 2007; Freedman Silvernail et al., 2013; Jordan et al., 2007; Nilsson & Thorstensson, 1987; Schwartz et al., 2008), the previous work must be regarded with caution. In addition, research has rarely included both types of locomotion for this population: guided (animal/human) and independent (e.g., cane). Thus, additional research is certainly warranted to understand locomotion in this population.
In contrast to the discrete variable assessments performed in the previous studies, a dynamical systems approach evaluates human movement based on the human body being a complex system with many components (e.g., joints) that are interrelated. An aspect of dynamical systems pertinent to walking is an analysis of coordination and variability using modified vector coding. Modified vector coding, a subset of dynamical systems, has advanced our understanding of running injuries (Heiderscheit et al., 2002), running speed (Hafer & Boyer, 2017), differences between anticipated/unanticipated during sidestepping (Weir et al., 2019), and the impact of coordination and sport specialization on injury susceptibility during landing tasks (DiCesare et al., 2019). As visual feedback plays a central role in locomotion (Faquin et al., 2018; Patla, 2011), it is possible that a lack of visual feedback could result in altered gait mechanics, namely, lower extremity coordination patterns. Thus, the purpose of this preliminary study was to examine lower extremity coordination profiles of persons who are blind, and age-, sex-, BMI-matched controls during their two modes of walking: independent (with a cane) and with a human guide.
Methods
Participants
This study was approved by the University Institutional Review Board. Inclusion criteria for participants who were blind are as follows: (1) must have self-reported complete blindness with a visual acuity < 3/60, (2) experienced blindness that was not a result of cortical visual impairment (CVI), and (3) must not have any additional disabilities or health impairments. Due to the previously defined difficulties in recruitment with this population, this study recruited from an age range of 13, when gait mechanics match those of adults (Cupp et al., 1999; Ganley & Powers, 2005), to 55 years. Exclusion criteria for both groups were no (1) self-reported injury in the last 6 months, (2) prior major joint surgery, (3) joint replacement, and (4) diagnosed joint arthritis. Five otherwise healthy persons with a visual impairment (VI) that resulted in complete blindness (visual acuity < 3/60) were recruited from the surrounding community over an 11-month period. Four participants had congenital blindness, whereas one subject lost his vision during adulthood (adult male, age 47 years). Five sex-, age-, and BMI-sighted controls were recruited from the surrounding community. Participant demographics are provided in Table 1. All participants were verbally informed of study procedures and provided consent to participate.
Subject demographics.

BMI: body mass index; M: male, F: female.
Protocol
All participants donned spandex shorts and standardized shoes (Nike Airmax Glide). A 10-camera motion capture system (200 Hz; Vicon Motion Analysis, Inc., Oxford, UK) and three in-line force platforms (2000 Hz, Model FP-4060; Bertec, Columbus, OH, USA) were used to collect three-dimensional (3D) marker trajectories and ground reaction forces during all tasks. Reflective markers were placed on anatomical landmarks across the pelvis and bilateral lower extremities: anterior and posterior superior iliac spines, greater trochanters, medial and lateral femoral epicondyles, medial and lateral malleoli, and the first and the fifth metatarsal heads. Clusters of four markers were securely attached to the pelvis, thighs, shanks, and feet for motion tracking during all tasks.
Participants who were blind were asked to walk under two conditions: independent (using a long cane) and with a human guide. During the guided walking, participants who were blind were guided by an experienced, sighted guide, and walked a half step behind the guide. The guide, who received training on sighted guide techniques and has worked in educational and recreational contexts for individuals who are blind for over 12 years, was placed on whichever side the subject preferred. For both conditions, participants were given several warm-up trials to acclimate to the sighted guide and to the data collection space. Average self-selected speeds were recorded during the warm-up. All trials were required to be within ±5% average self-selected speeds. Control participants walked independently within ±5% average speed of the independent and guided walking conditions for their counterpart who was blind.
Data analyses
Marker trajectory data and ground reaction force data were imported into Visual3D Biomechanical Software Suite (v6.0; C-Motion, Germantown, MD, USA) and filtered at 8 Hz using a zero-lag fourth-order Butterworth low-pass filter (Bennett et al., 2017). A seven-segment inverse dynamics model (pelvis and bilateral lower extremities) was created for each participant using the marker trajectories (Bennett et al., 2018). Hip joint centers were created based on the greater trochanter method (Bennett et al., 2016). Knee and ankle joint centers were defined as the midpoint of the femoral epicondyles and malleoli, respectively. An X–Y–Z (flexion–adduction–internal rotation) Cardan rotational sequence was used for 3D angular kinematics computations. Both segmental and joint angles are reported as the angle relative to anatomical position (0°).
Kinematic data for the left- and right-thigh segments, right ankle, right knee, and right hip joints were imported to MATLAB (R2016b; MathWorks, Inc., Natick, MA, USA). Angle–angle plots were constructed for left–right thigh, ankle–knee, ankle–hip, and knee–hip (distal segment/x-axis and proximal segment/y-axis) combinations spanning a complete stride (heel strike to heel strike of the same foot). Ensemble figures were created for each group/condition by finding the circular mean for each instant in time (Batschelet, 1981).
Modified vector coding was performed to determine the relationship between the angle–angle combinations across sequential time points. For each instant in time (i), the coupling angle (

The coupling angle was corrected to provide a value between 0° and 360°. Mean coupling angles and standard deviations across trials for each frame were derived using circular statistics (Batschelet, 1981). Coupling angles for each individual time point were then classified following previous methodology (Chang et al., 2008). The frequency that each of the classifications occurred during the time period was determined for each participant/condition as a percentage of the stance and swing phases. Frequency data were used for statistical comparisons between groups.
Statistical analyses
The two most frequent coupling patterns for right–left thigh, ankle–hip, ankle–knee, knee–hip variables were compared between groups using Mann–Whitney’s U tests with alpha level set at .05. In cases where the two most frequent patterns expressed were not the same for each group, additional Mann–Whitney’s tests were performed.
Results
Spatiotemporal characteristics
Average walking speeds for persons who were blind during independent and guided conditions were 1.01 ± 0.3 m/s and 1.18 ± 0.3 m/s, respectively. Average stride lengths during independent walking were 1.14 ± 0.31 m for the persons who were blind and 1.29 ± 0.18 m for the controls. Average stride lengths during guided walking were 1.25 ± 0.26 m for the persons who were blind and 1.32 ± 0.17 m for the control group.
Inter-limb coordination
Coupling angle and angle–angle plots are for right–left thigh at independent and guided walking speeds are presented in Figures 1(a) and 2(a). Inter-limb coordination patterns were consistent between groups. The most frequent patterns for the VI and control groups during the stance and swing phases at independent walking speeds for left–right thigh coupling (Figure 1(a)) were left-thigh dominance (40.3 ± 14.2% vs 45.8 ± 24.5% stance, p = .79), right-thigh dominance (23.6 ± 8.1% vs 22.7 ± 4.4% stance, p = .97), right-thigh dominance (53.5 ± 7.6% vs 65.9 ± 16.2% swing, p = .31), and anti-phase coupling (22.4 ± 14.2% vs 12.4 ± 5.3% swing, p = 1.00). Left-thigh dominance (40.3 ± 14.2% vs 46.4 ± 14.2% stance, p = .45), anti-phase coupling (22.4 ± 14.6% vs 23.3 ± 6.1% stance, p = 1.00), right-thigh dominance (53.5 ± 7.6% vs 63.5 ± 18.9% swing, p = .68), and anti-phase coupling (22.4 ± 14.2% vs 13.5 ± 5.7% swing, p = .33) were the most frequent patterns when walking at guided speeds.
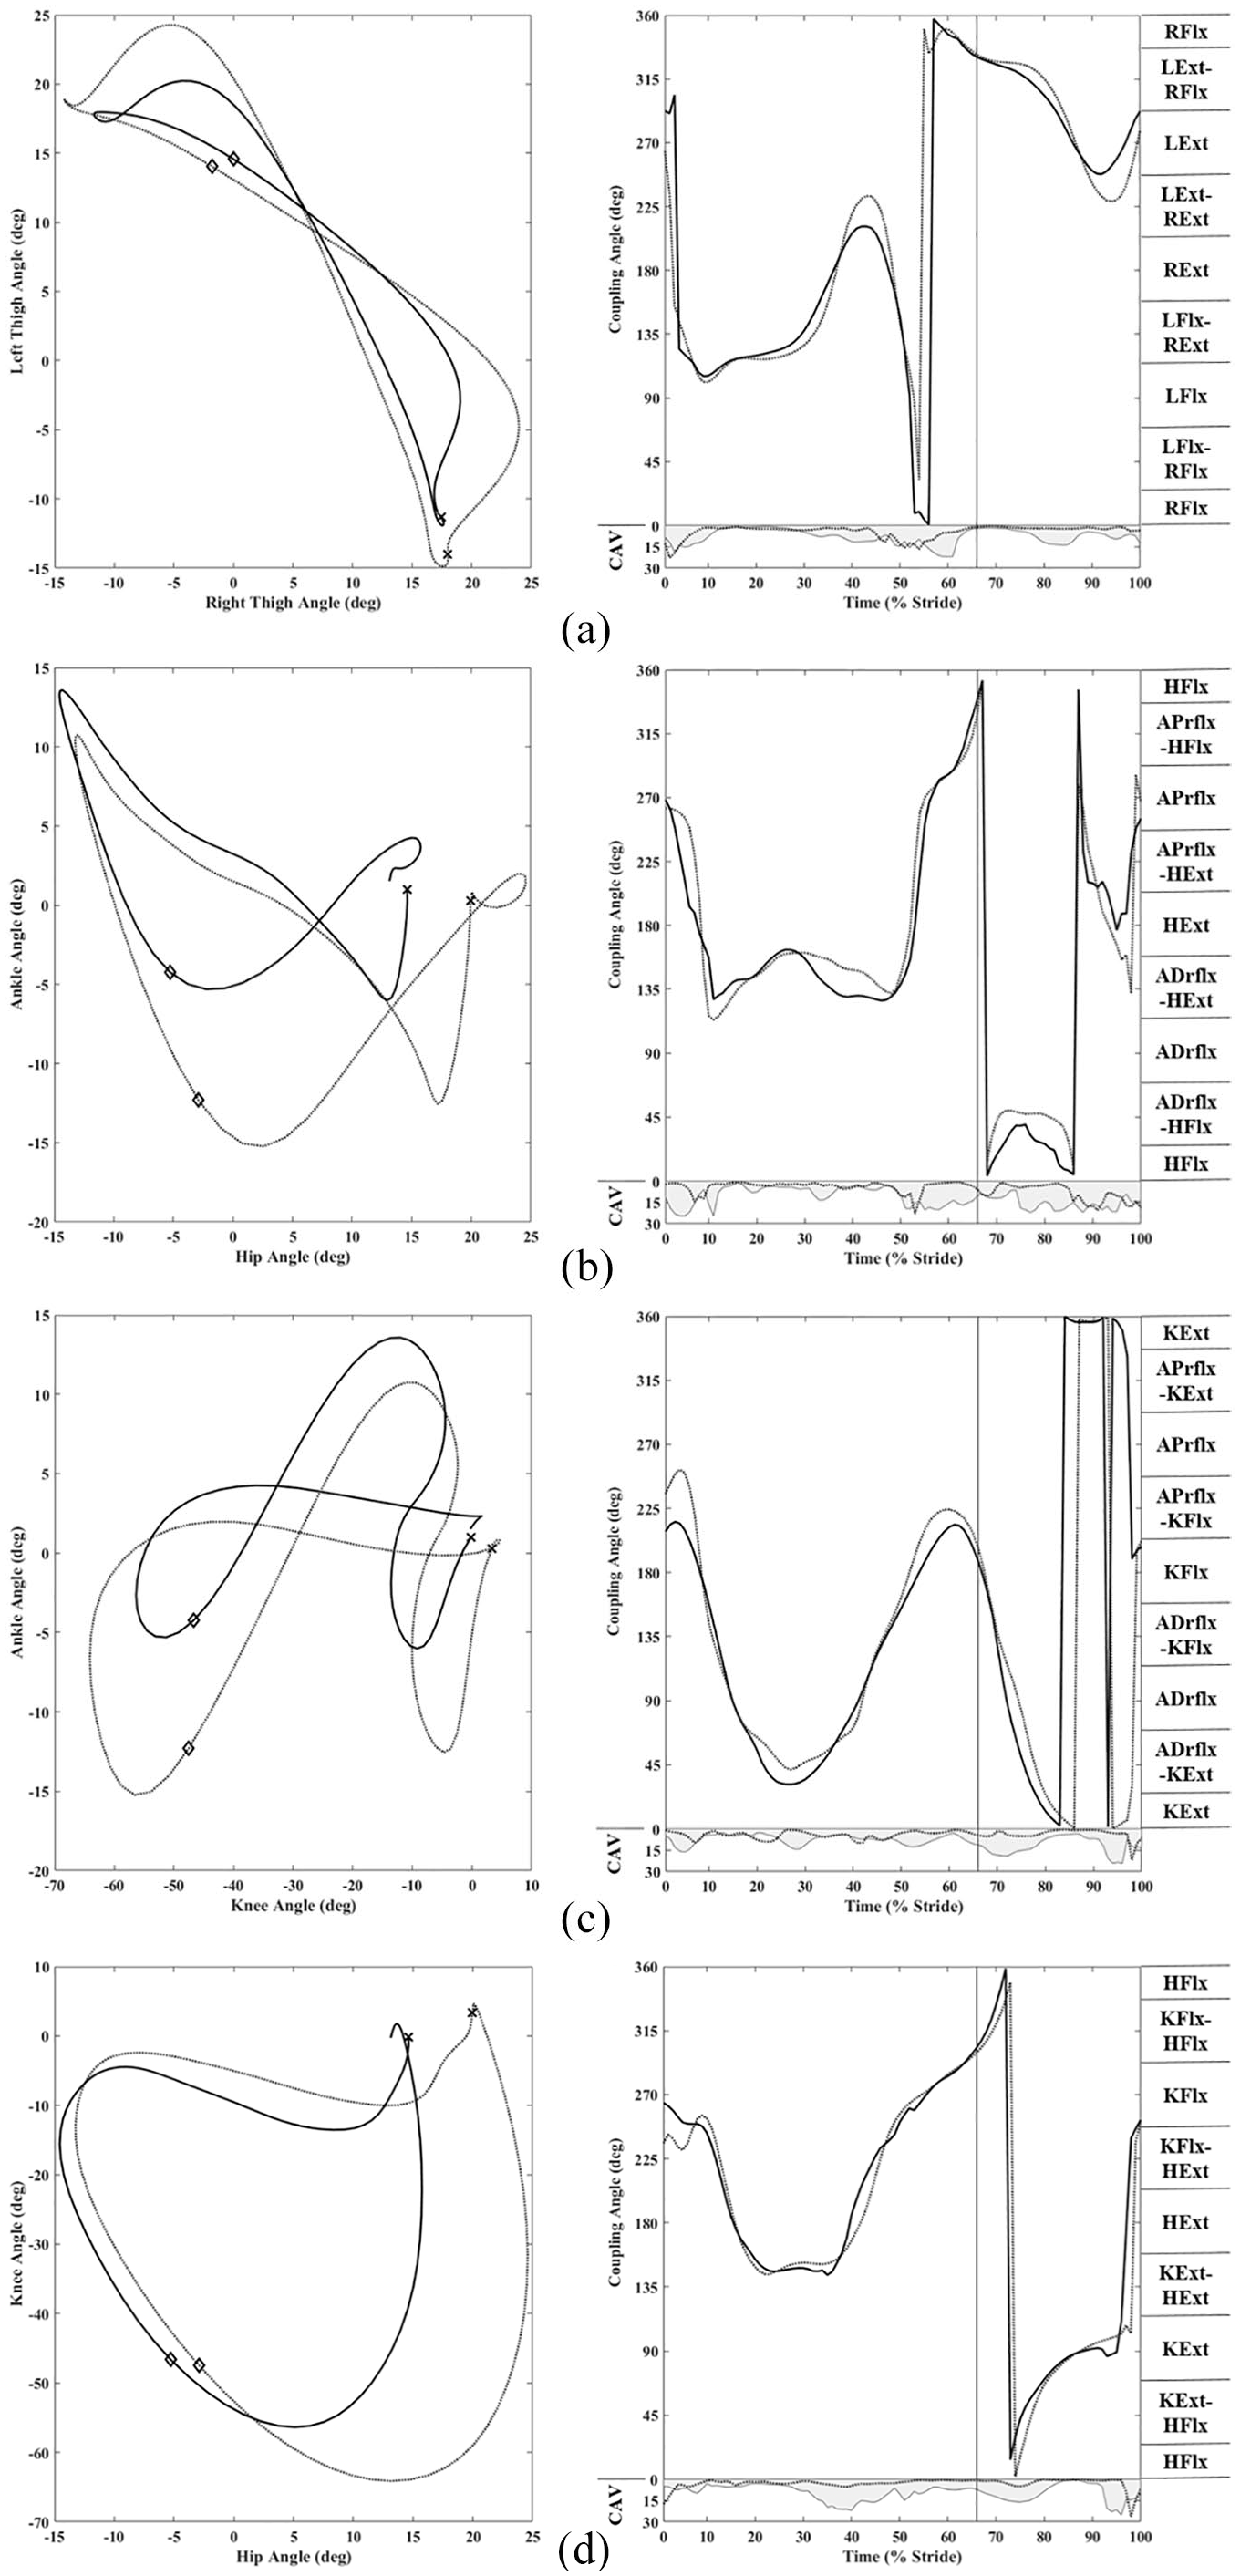
Ensemble angle–angle and coupling angle plots for (a) left–right thigh, (b) ankle–hip, (c) ankle–knee, and (d) knee–hip are presented for the persons who are blind (solid lines) and controls (dashed lines) at matched speeds during independent walking. The “x” and diamond notations on angle–angle plots represent heel strike and toe-off events, respectively. The solid vertical line on coupling angle plots represents toe-off. Coupling angle variability (CAV; degree) is also provided for each angle–angle grouping (persons who are blind: solid line and shading, controls: dashed line).
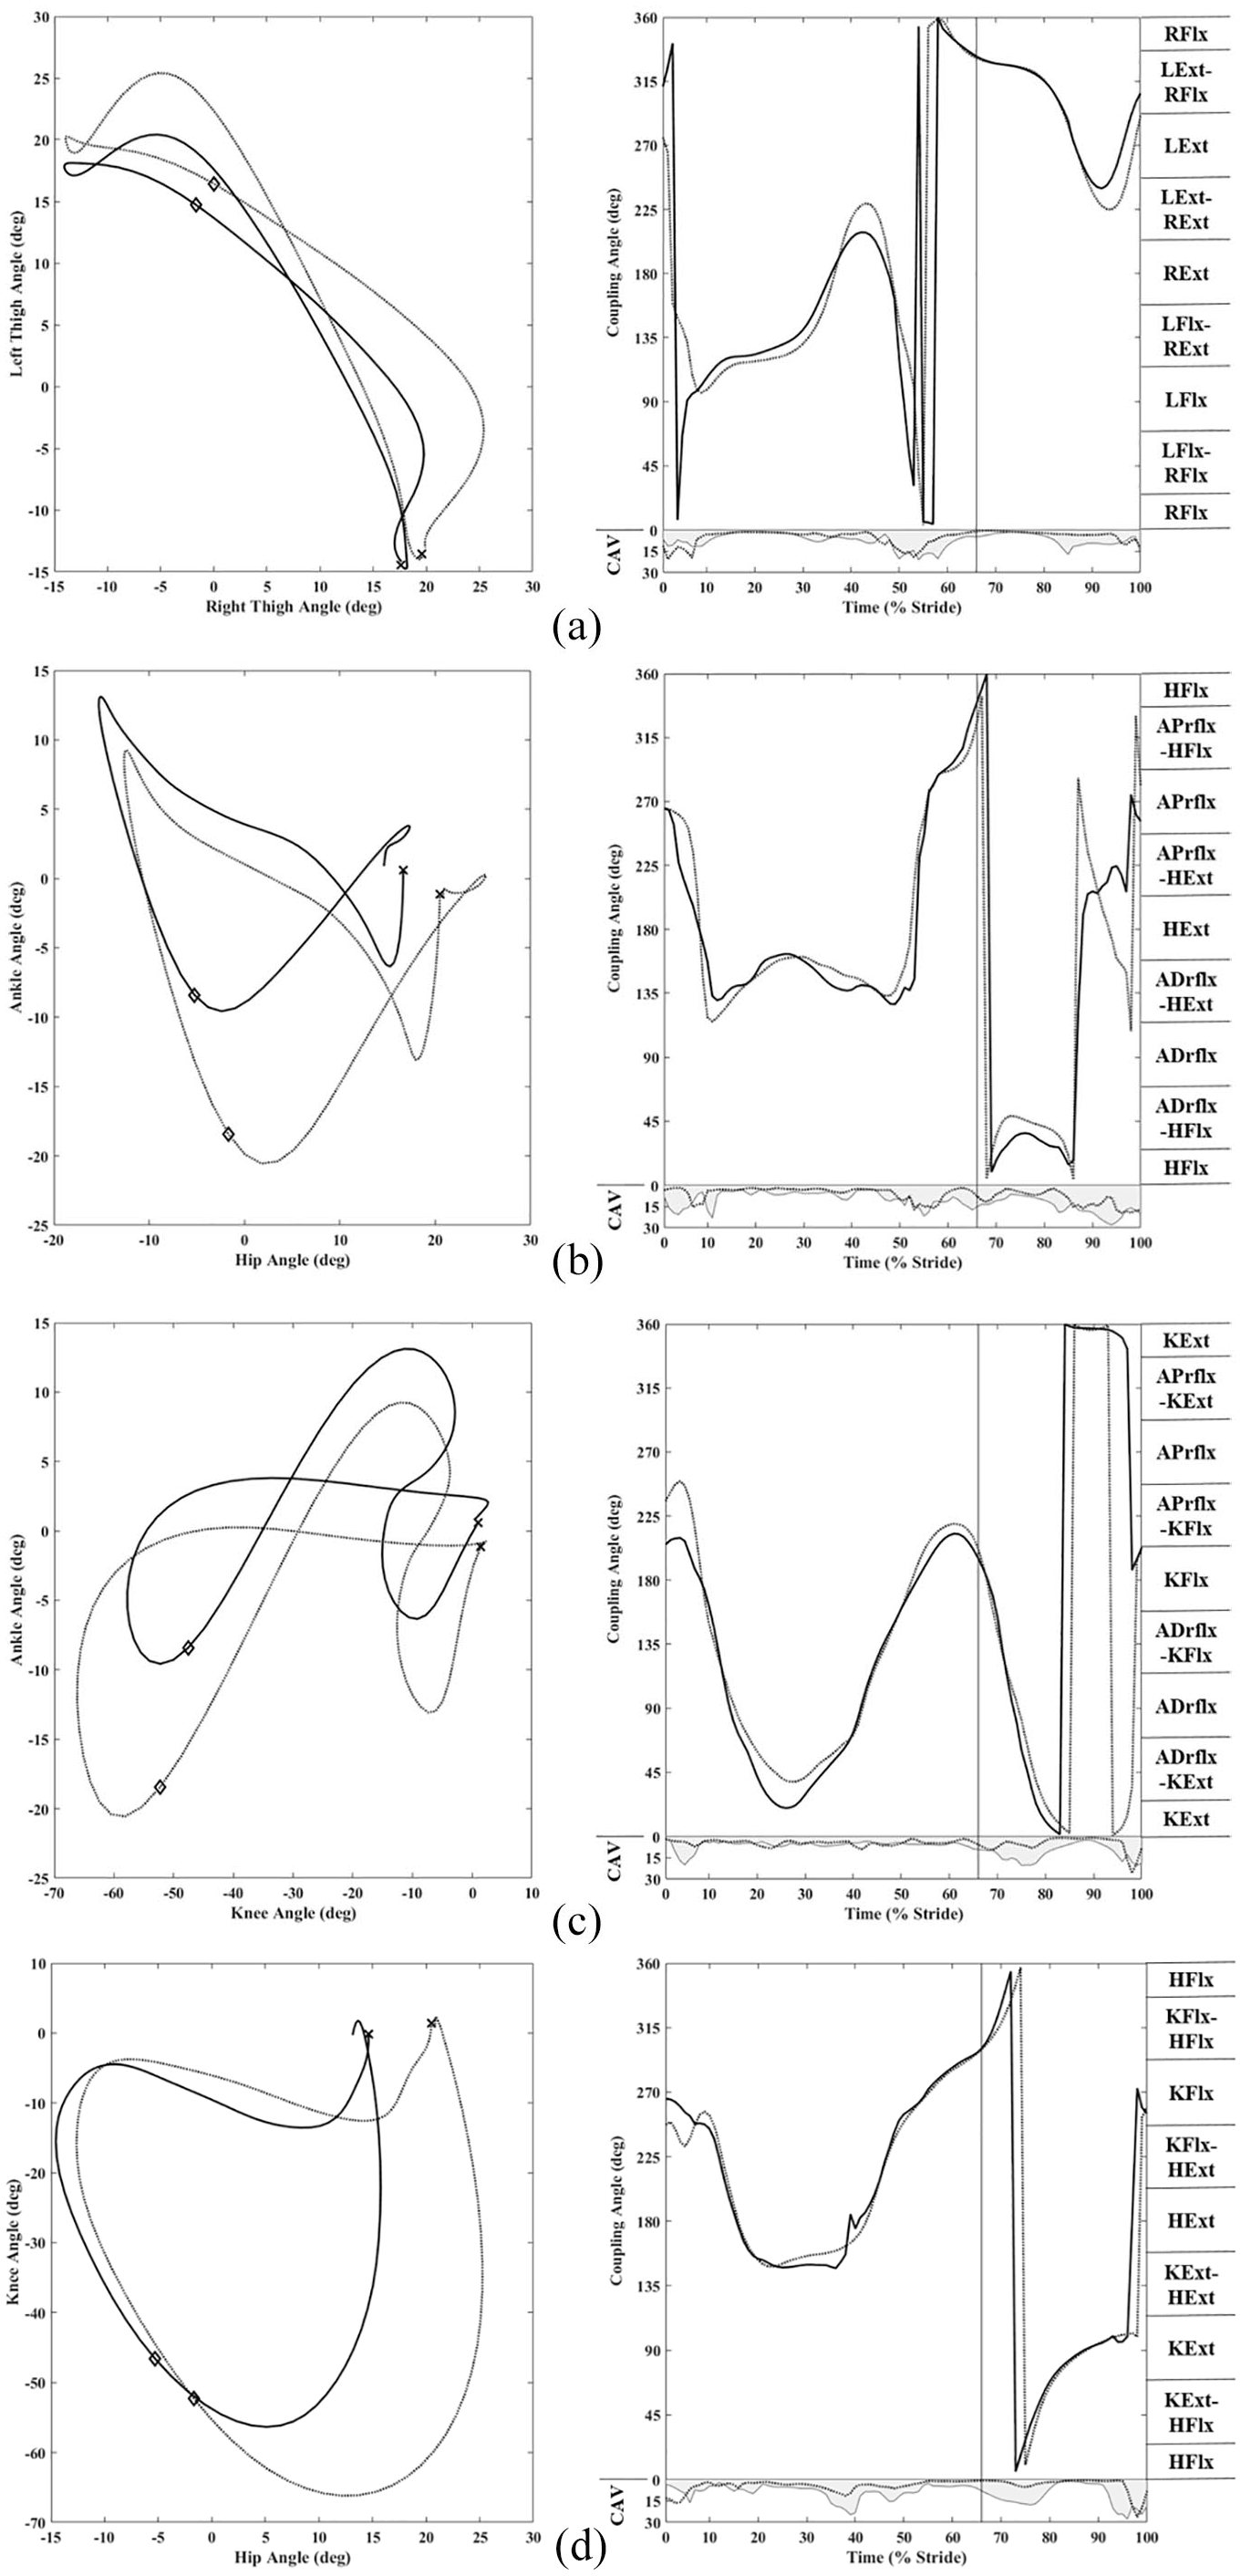
Ensemble angle–angle and coupling angle plots for (a) left–right thigh, (b) ankle–hip, (c) ankle–knee, and (d) knee–hip are presented for the persons who are blind (solid lines) and sighted controls (dashed lines) at matched speeds during guided walking. The “x” and diamond notations on angle–angle plots represent heel strike and toe-off events, respectively. The solid vertical line on coupling angle plots represents toe-off. Coupling angle variability (CAV; degree) is also provided for each angle–angle grouping (persons who are blind: solid line and shading, controls: dashed line).
Joint coupling
Overall, there were no statistically significant differences in frequency of coordination patterns between groups when walking at independent or guided speeds (all p > .05; Figures 1(b)–(d) and 2(b)–(d)).
Ankle–hip
The most frequent patterns for the VI and control groups for ankle–hip at independent walking speeds (Figure 1(b)) were hip dominance (31.2 ± 10.3% vs 29.4 ± 8.0% stance, p = 1.00), anti-phase (28.8 ± 14.1% vs 30.6 ± 14.6% stance, p = .42), in-phase (45.9 ± 14.2% vs 27.1 ± 11.3% swing, p = .55), hip dominance (27.6 ± 7.9% vs 20.0 ± 13.4% swing, p = .82), and ankle dominance (16.5 ± 13.3% vs 42.4 ± 22.6% swing, p = .32). Similarly, hip dominance (31.2 ± 10.3% vs 29.4 ± 8.0% stance, p = 1.00), anti-phase (28.8 ± 14.1% vs 30.6 ± 14.6% stance; W(23): p = .42), in-phase (45.9 ± 14.2% vs 27.1 ± 11.3% swing, W(31): p = .55), hip dominance (27.6 ± 7.9% vs 20.0 ± 13.4% swing, W(29): p = .82), and ankle dominance (16.5 ± 13.3% vs 42.4 ± 22.6% swing, W(22.5): p = .32) were the most frequent patterns during walking at guided speeds (Figure 2(b)). Although no coordination patterns were different, the persons who were blind appear to maintain increased ankle dorsiflexion, reduced hip flexion angles, and reduced ranges of motion compared with their sighted matches throughout the stride.
Ankle–knee
Ankle–knee coupling for walking at independent and guided conditions is provided in Figures 1(c) and 2(c). Anti-phase (27.0 ± 13.3% vs 33.9 ± 14.2% stance, p = .73), ankle dominance (25.8 ± 14.3% vs 34.5 ± 4.7% stance, p = .17), knee dominance (43.5 ± 22.5% vs 37.6 ± 27.5% swing, p = .79), and anti-phase coupling (31.8 ± 19.6% vs 33.5 ± 9.4% swing, p = .75) were the most frequent patterns during walking at independent speeds. Similarly, ankle dominance (25.8 ± 14.3% vs 34.5 ± 3.9% stance, p = .81), anti-phase (27.0 ± 13.3% vs 30.0 ± 13.8% stance, p = .84), knee dominance (43.5 ± 22.5% vs 37.1 ± 24.3% swing, p = .65), and anti-phase coupling (31.8 ± 19.6% vs 32.9 ± 11.5% swing, p = .59) were the most frequent patterns during walking at guided speeds.
Knee–hip
Knee–hip coordination was similar between groups at independent (Figure 1(d)) and guided (Figure 2(d)) speeds. Hip dominance (37.6 ± 18.5% vs 38.5 ± 18.5% stance, p = .84), anti-phase coupling (32.7 ± 13.2% vs 32.1 ± 13.4% stance, p = .60), knee dominance (27.5 ± 13.4% vs 53.5 ± 25.2% swing, p = .84), and anti-phase coupling (31.2 ± 9.7% vs 26.5 ± 16.4% swing, p = .79) were the most frequent patterns during walking at independent speeds. Hip dominance (37.6 ± 18.5% vs 35.2 ± 16.1% stance, p = .90), anti-phase (32.7 ± 13.2% vs 29.7 ± 10.7% stance, p = .73), knee dominance (27.6 ± 13.4% vs 52.4 ± 25.2% swing, p = .21), and anti-phase coupling (31.2 ± 9.7% vs 26.5 ± 16.4% swing, p = .44) were the most frequent patterns during walking at guided speeds. For both groups, the stance phase began with the knees near neutral and with the hips flexed. However, from heel strike throughout the stance phase, persons who were blind appear to maintain greater hip extension. During the swing phase, persons who were blind also appear to utilize reduced knee flexion and an even larger reduction in hip flexion.
Discussion
Interestingly, this preliminary study found that lower extremity coordination patterns do not appear different between persons who are blind and matched sighted controls when walking at matched speeds. However, persons who are blind appear to walk with reduced stride lengths and joint ranges of motion compared with matched sighted controls. In addition, persons who are blind performed independent walking with shorter strides and ranges of motion compared with walking with a sighted human guide. Although this is a preliminary report, the joint/segment coupling presented here match those reported in the literature (Heiderscheit et al., 2002; Lamb & Barlett, 2017; Van Emmerik et al., 2014). Overall, the results of this study suggest that although the visual feedback system does provide crucial information regarding the environment in which we walk, lower extremity coordination patterns governed by central pattern generators appear robust without visual feedback.
Previous studies have found reduced stride length and sagittal plane kinematics and increased energetic costs of walking in persons with varying levels of vision (Bennett et al., 2019; Hallemans et al., 2010; Kobberling et al., 1989; Nakamura, 1997). Although these previous studies illustrate some important differences between those with a VI and sighted controls, this preliminary study is the first to control for both walking speed (matched speeds for both independent and guided tasks) and subject anthropometrics (age, sex, and BMI). This is also the first report of joint coordination for persons with complete blindness. In agreement with previous studies (Bennett et al., 2019; Hallemans et al., 2010; Nakamura, 1997), differences between persons who are blind and sighted controls found in this report appear to be mainly reduced stride length and joint ranges of motion, but occur without alterations of inter/intra-limb coordination. The findings from this preliminary report are interesting as proper locomotion (e.g., walking and running) mechanics are not formally taught in structured physical activity contexts (e.g., physical education settings) for persons who are blind (Holland et al., 2020). Thus, the lack of coordination differences found here suggest that lower extremity locomotion patterns are robust even without visual feedback. However, future work in the area of locomotion in persons who are blind should consider examining how incremental changes to stride length and range of motion affect walking efficiency from physiological and mechanical perspectives in persons who are blind.
Figure 3 presents angle–angle plots for each variable for independent and guided walking together person who are blind. Only slight increases in stride length and range of motion are apparent when walking with a human guide compared with independent (with a cane). However, these variations appear to occur without differences in inter- and/or intra-limb coordination. Thus, despite the advantages a human guide can provide during walking (Bennett et al., 2019; Soong et al., 2000), independent walking could seemingly be just as efficient provided persons who are blind were able to increase their stride length and decrease stride to stride variability.
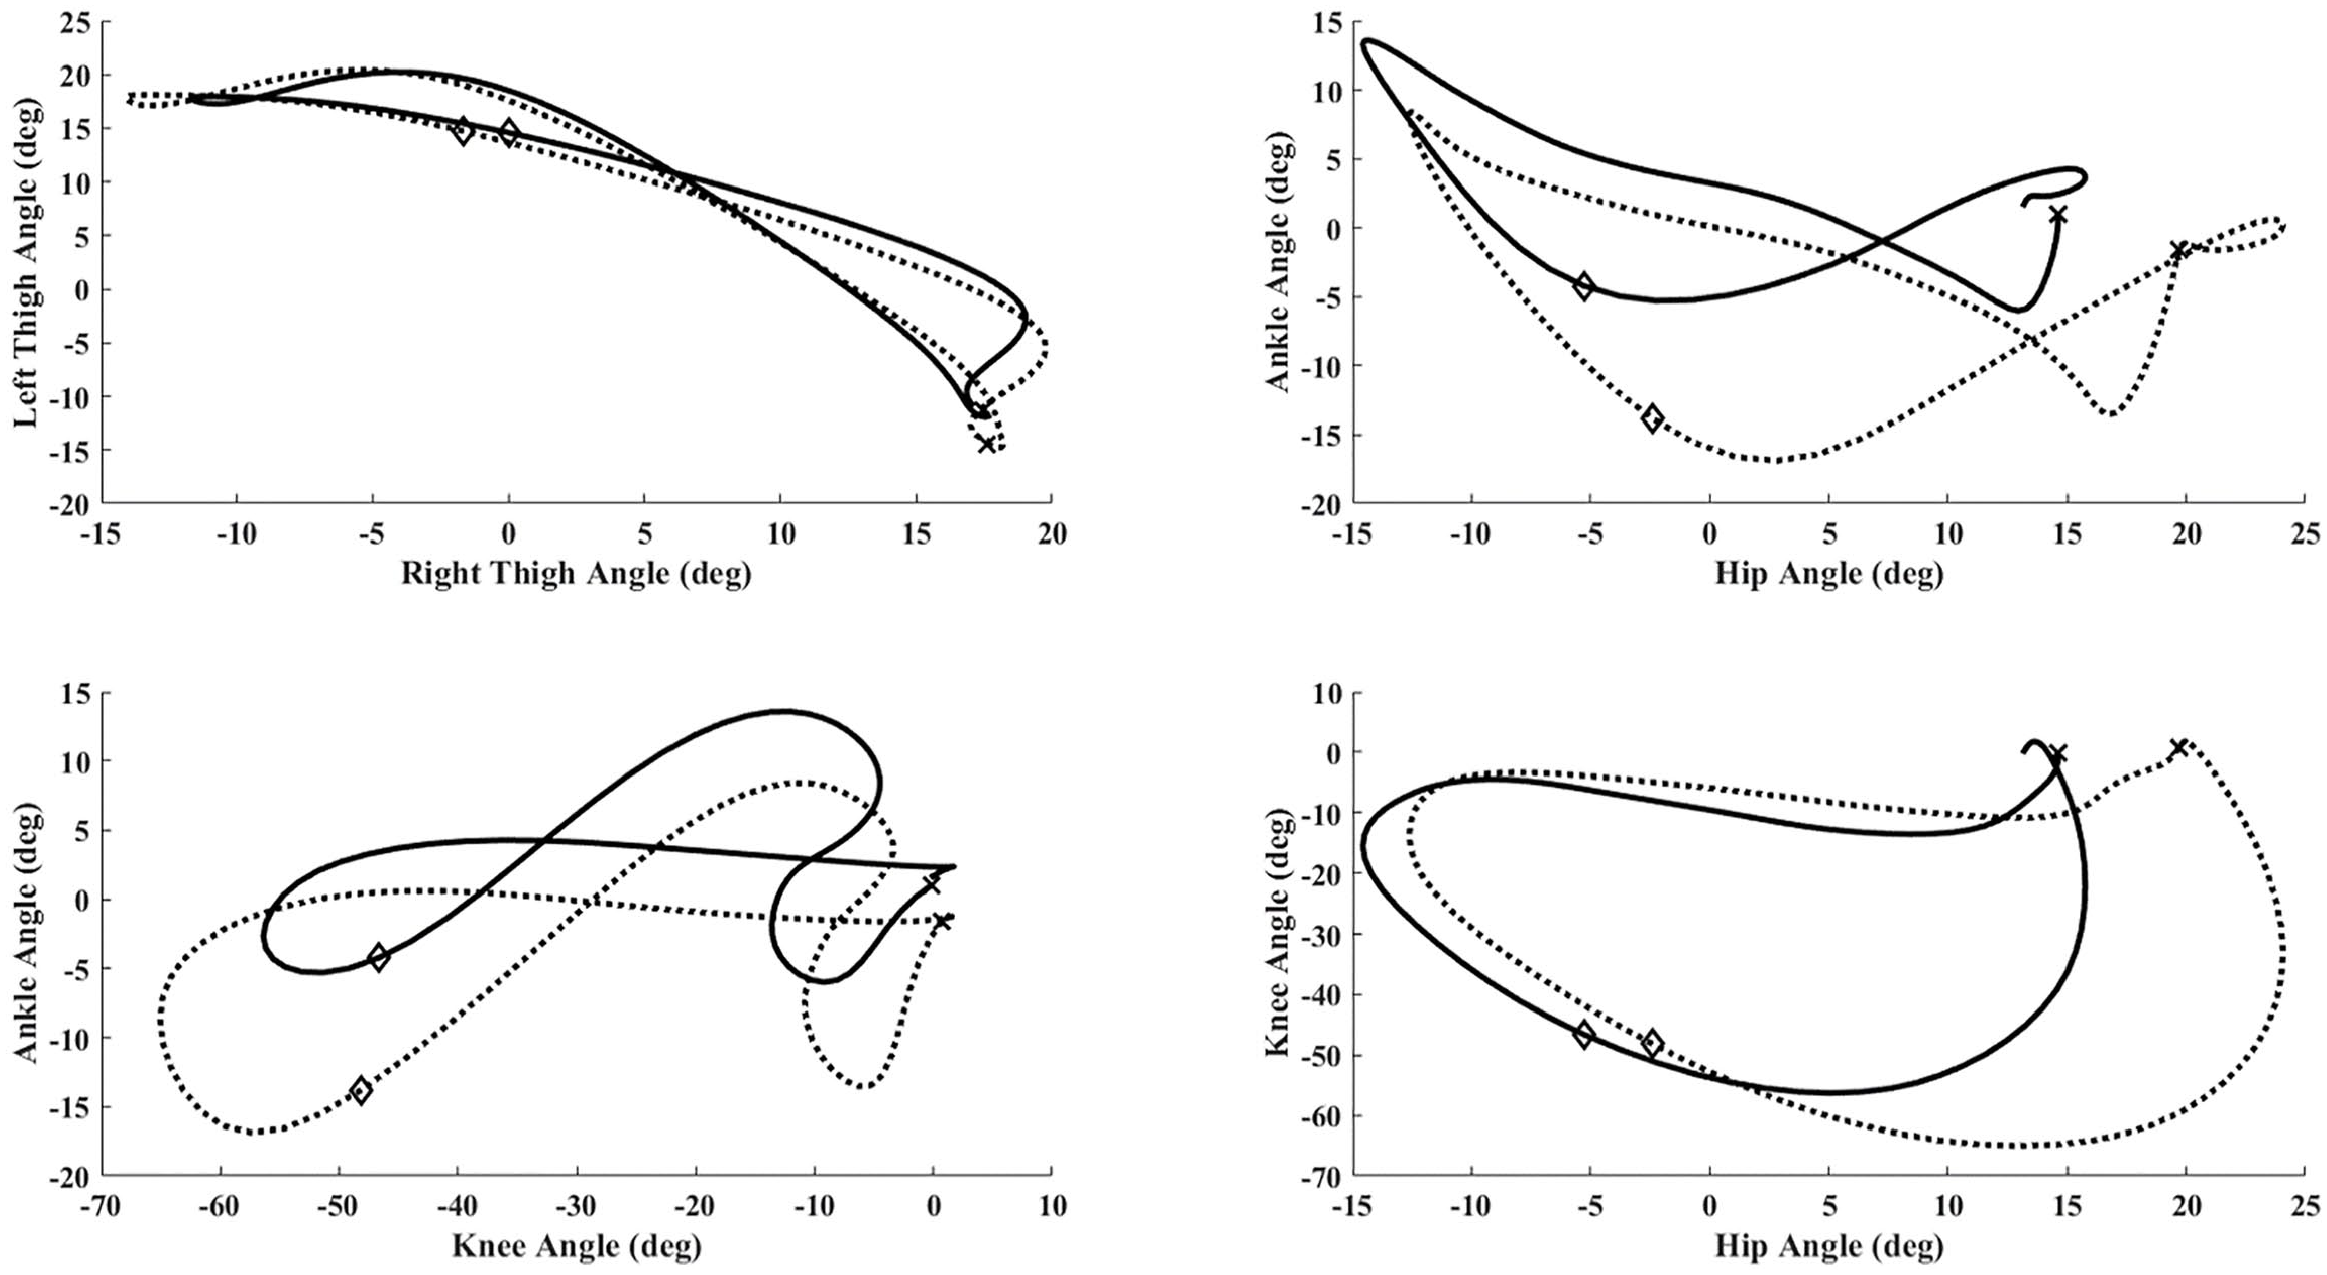
Reading clockwise from top left are ensemble group left/right thigh, ankle–hip, ankle–knee, and knee–hip plots during independent (solid black line) and guided (dashed black line) walking conditions. The “x” and “diamond” notations reflect heel strike and toe-off events, respectively. All angles follow the right-hand rule, with anatomical position denoting a zero/neutral angle for all segments/joints.
This preliminary study has several limitations to note. First, the sample consists of five participants and was restricted to those with a visual acuity < 3/60. Although our sample size appears small, this sample provides a large representation of similar persons in the surrounding community considering the incidence rate of complete blindness. Second, given the current study focused specifically on those who are blind, the results of this study should not be generalized to individuals experiencing lesser severities of vision loss. Future work should consider expanding the study populations to include a range of persons with vision loss. Third, although we matched for several anthropometrics between groups (sex, age, and BMI), differences in limb lengths and physical activity levels could affect walking mechanics. Thus, future work could also examine the effects of these parameters on walking mechanics in persons who are blind. Finally, this preliminary work included ages from adolescence (10–19 years) to adults (20–59 years). Although gait mechanics are likely established by an age of 14 years (Cupp et al., 1999; Ganley & Powers, 2005), future work should examine age-related differences in walking patterns in persons who are blind.
Conclusion
This preliminary report addresses a widely ignored area of biomechanics/human movement research. This study advances the current literature by (1) providing the first comparison of persons who are blind with anthropometric matched sighted controls and (2) comparing these groups across the two forms of locomotion for persons with a VI: independent and with a human guide. This study indicates that there are likely no coordination concerns that should limit movement or physical activity engagement of persons who are blind. Given that persons who are blind have been demonstrated to be inactive, perhaps further exploration into environmental and attitudinal barriers to physical activity engagement are warranted.
