
Abstract
Weekly and consistent physical activity can help minimize the risk of preventable disease and improve mental health and cognitive function among adults. Despite these benefits, adults with visual impairments tend to not meet physical activity recommendations. The purpose of this preliminary study was to examine how neighbourhood walk score (walkability) is associated with weekly walking minutes in adults with visual impairments. Participants were recruited from two visual impairment–related listservs in the United States. A total of 88 participants (aged 22–85 years; 78% female) were included. Participants completed an online survey including demographic, walking duration, and zip code questions. Linear regression analyses were performed to determine whether there were significant associations between walkability and weekly walking minutes. Walkability scores were not significantly related to walking minutes per week (p = .84), but age was negatively associated with walking minutes per week (β = −.16), holding other factors constant. Neighbourhood walkability was not significantly associated with walking minutes per week among adults with visual impairments in this study. As these adults age, the amount of walking decreased. Future research in this line of inquiry should expand to include other variables that may influence the relationship between walkability and walking minutes per week and examine the barriers to physical activity among individuals with visual impairments.
Introduction
Weekly and consistent physical activity can help minimize the risk of preventable disease and early death and improve mental health and cognitive function (Centers for Disease Control and Prevention [CDC], 2021). Given these benefits, the CDC (2021) recommends that adults accumulate at least 150 min of moderate-intensity physical activity or 75 min of vigorous-intensity physical activity, combined with at least 2 days of strength training, per week. Physical activity is multifaceted and is also composed of light physical activity, which has gained attention as having a dose–response relationship with various health outcomes (Ross et al., 2020). For adults with visual impairments specifically, research has demonstrated that engaging in various levels of physical activity can be associated with enhanced health-related quality of life, lower body mass index, and decreased rates of anxiety and depression (Haegele et al., 2021; Haegele & Zhu, 2021). Being independent and physically active have also been associated with higher life satisfaction (Good et al., 2008). However, and despite these benefits, adults with visual impairments tend to not engage in sufficient physical activity (Holbrook et al., 2013; Marmeleira et al., 2014), and therefore tend to be at a higher risk of experiencing psychological and physiological health-related concerns (CDC, 2021).
For adults with visual impairments, a number of barriers have been identified that can reduce engagement in regular physical activity, such as dependence on others, transportation, a lack of physical activity possibilities in the neighbourhood, and access to facilities (Devine, 2016; Jaarsma et al., 2014; Kirk et al., 2021). One variable that has yet to receive much attention in the literature is neighbourhood walkability. Walkability, for the purpose of this study, is the ease at which one can walk around in a particular area and access goods and services (Forsyth, 2015). Neighbourhood walkability has been identified as an important factor that positively impacts physical activity participation, and in particular walking, among sighted adults (Berke et al., 2007; Shimura et al., 2012; Sundquist et al., 2011; Twardzik et al., 2019). That is, adults are more likely to walk within their neighbourhood for transportation if grocery stores, retail stores, and restaurants are within close proximity (Berke et al., 2007; Shimura et al., 2012; Sundquist et al., 2011). Jaarsma et al. (2014), who surveyed adults with visual impairments about facilitators for physical activity, found walking to be a predominant form of physical activity, as well as health, social contacts, and fun were among the highest facilitators for participating in physical activity, such as walking, for adults with visual impairments. However, the relationship between neighbourhood walkability and weekly walking among adults with visual impairments, to our knowledge, has not yet been examined. As such, the purpose of this preliminary study was to examine how neighbourhood walk score (walkability) is associated with weekly walking in adults with visual impairments.
Methods
Data collection
This cross-sectional study utilized an online survey methodology. Participants were recruited from two visual impairment–related listservs housed in the United States in the Spring of 2021. The two organizations that house the listservs allow external researchers to contact potential participants. Both organizations independently distributed the study information to potential participants via email. The first organization is located in the Southern United States at a research university and distributed two emails; the second organization is a national association which distributed one informational email. Data collection took place between 15 February and 15 April 2021. A cover letter was included and detailed the purpose, methodology, inclusion criteria, projected time commitment, and incentive to participate in this study. As incentive, potential participants were notified that those who completed the online survey would be eligible to enter a prize drawing to win one of four US$25.00 gift cards. Inclusion criteria required participants to be 18 years of age or older and self-report that they had a visual impairment. Participants were assured that their information would be kept confidential, and participation was voluntary. Once participants read and agreed to the consent form, they were directed to the online questionnaire. Approval for this research was obtained from the authors’ university institutional review board (IRB) committee.
Measures
Two questionnaires, totalling 14 questions, were used in this study: (a) a demographic questionnaire and (b) the International Physical Activity Questionnaire–Short Form (IPAQ-SF).
Sociodemographic questionnaire
A demographic questionnaire asked participants to report their age, sex, race/ethnicity, visual impairment classification level, other health conditions, and self-rated health status. Age was reported by numerical value, participants chose male or female for sex, and race was divided into six categories: White, Hispanic or Latinx, Asian or Pacific Islander, African American or Black, American Indian or Alaskan Native, and other. Visual Impairment descriptors were broken into four categories as defined by the International Blind Sport Federation (IBSF, 2021). These were listed as follows: no light perception in either eye or some light perception with an inability to recognize the shape of a hand at any distance or in any direction (B1); visual acuity of up to 20/600 and/or a visual field of less than 5° in the best eye with the best practical eye correction (B2); visual acuity above 20/600 but less than 20/200 and/or a visual field between 5° and 20° in the best eye with the best practical eye correction (B3); and low vision between 20/200 and 20/60 in the best eye with the best practical eye correction (B4). One comorbidity question was used to measure whether participants currently or recently experienced additional health conditions. Finally, one question was used from the 12-item Medical Outcomes Study Short Form Health Survey (SF-12) to inquire about participants’ self-related health rating. According to Fleishman et al. (2006), this question performs comparatively to the entire survey and lessens the participation burden associated with the entire questionnaire.
In addition to the aforementioned six questions, a seventh item on the demographic questionnaire asked participants to provide their home zip code to calculate walkability score. WalkScore.com (Walk Score, 2021) was used by imputing the participant’s zip code into the search engine, which then provided a score from 0 to 100. According to WalkScore.com, Walk Score measures the walkability of a zip code by analysing walking routes to destinations such as grocery and retail stores, parks, schools, and restaurants. The highest points are given to destinations within a 5-min walk, and subsequently decline with no points being given for destinations that are further than a 30-min walk. A score of 90–100 represents a ‘walker’s paradise’, 70–89 is ‘very walkable’, 50–69 is ‘somewhat walkable’, 25–49 is ‘car-dependent, most errands require a car’, and 0–24 is ‘car-dependent, almost all errands require a car’ (Walk Score, 2021). Duncan et al. (2011) found Walk Score to be valid for measuring some aspects of walkability, such as retail destinations, intersection, and residential density. C. M. Hall and Ram (2018) asserted that reliability and validity have been inconsistent when using WalkScore.com but recommended its use for convenience. WalkScore.com (Walk Score, 2021) also claims to be the only international measure of walkability and therefore can be seen as a more consistent measure across studies.
International Physical Activity Questionnaire–Short Form
Physical activity was measured using the IPAQ-SF. The IPAQ-SF is a self-reported seven-item, 7-day recall instrument that asks participants to report planned and unplanned time spent (a) walking, (b) engaging in moderate physical activity, (c) engaging in vigorous physical activity, and (d) sitting (Craig et al., 2003). Reliability (ρ = .76), criterion validity (ρ = .30) and concurrent validity (ρ = .67) for the IPAQ have been noted as acceptable by Craig et al. (2003). This questionnaire has been used extensively with adults with visual impairments and has been shown to have moderate criterion validity ranging from r = .38 to r = .57 (Marmeleira et al., 2013; Sadowska & Krzepota, 2015).
Analysis
Prior to data analysis, three reported walking levels were Winsorized to adjust for outliers. Walking minutes per week was calculated for each individual by multiplying the days per week the individual participated in walking and the minutes per day. A descriptive analysis was completed, which computed the percentage of participant characteristics such as visual impairment levels and sex, as well as the means and standard deviations for walking minutes per week and walkability scores. In addition, we examined the distribution statistics of the variables on skewness and kurtosis. Considering that the skewness ranged from 0.30 to 1.74 and kurtosis ranged from −1.10 to 2.01 which suggested that the data distribution was approximately normal, we proceeded with parametric data analyses. Specifically, linear regression analyses were performed to determine whether there were significant associations between walkability and walking minutes per week. In addition, walkability and walking minutes per week were run when controlling for additional health conditions, visual impairment level, sex, age, race, and self-reported health rating. Significance levels were set at p < .05. The data were analysed using the Statistical Package for the Social Sciences (SPSS, version 28.0.1.0).
Results
One hundred and fifteen individuals voluntarily entered and completed part of the online survey. Of those, 88 surveys were identified prior to data analysis as being unique, complete, and usable. The other 27 responses were excluded because they (a) were duplicate responses, (b) did not provide zip code data, or (c) lived outside of the United States. As such, this study included 88 participants, aged 22–85 years (M = 49). A complete breakdown of demographic variables can be found in Table 1.
Participant profile.
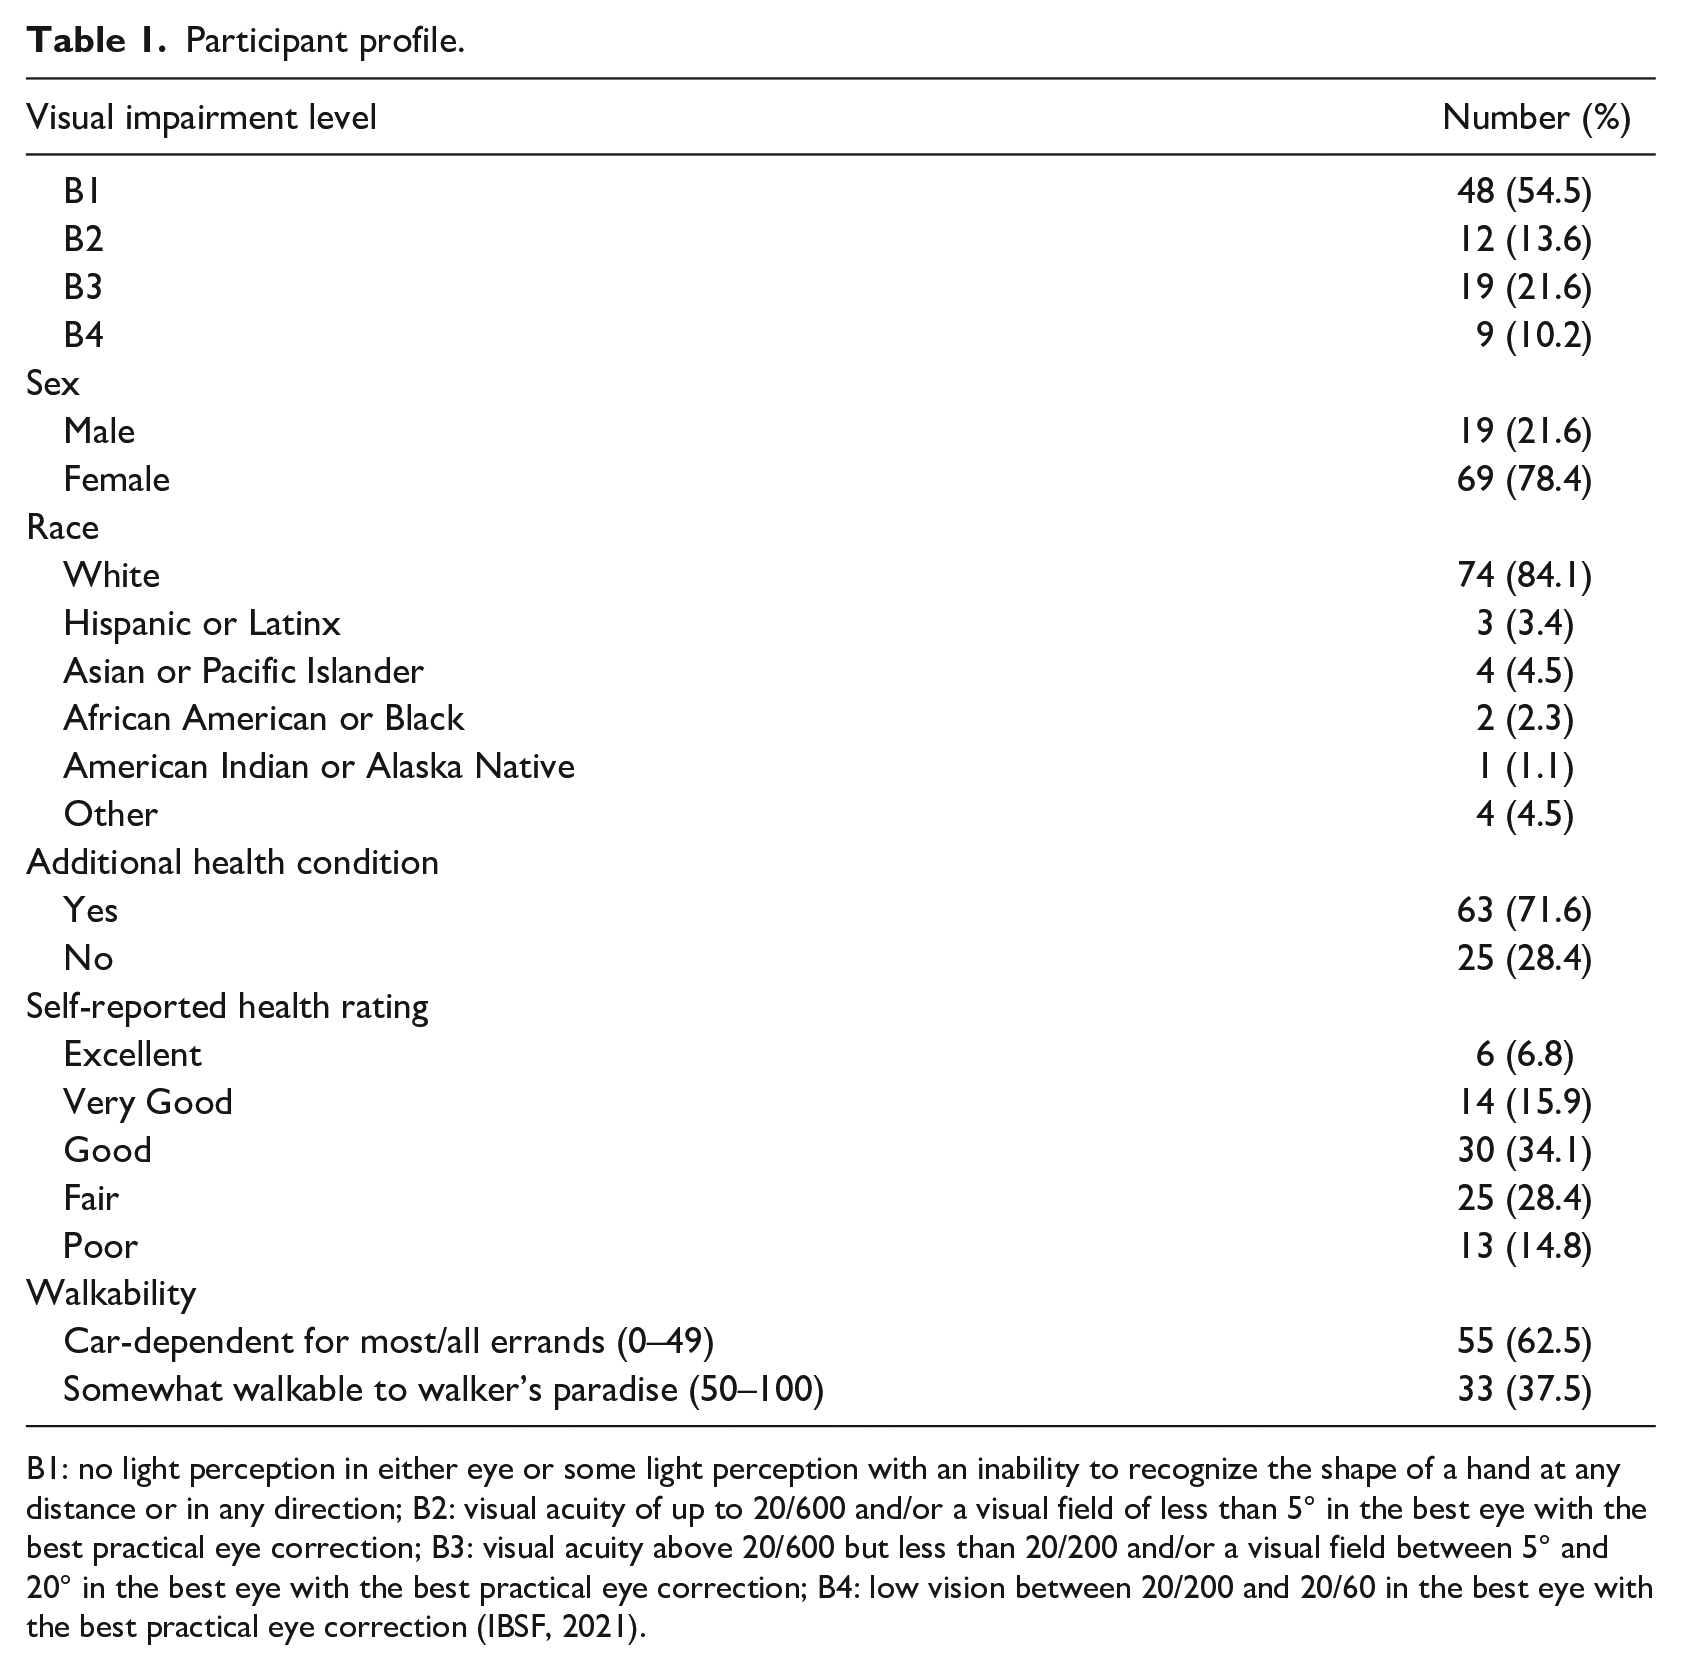
B1: no light perception in either eye or some light perception with an inability to recognize the shape of a hand at any distance or in any direction; B2: visual acuity of up to 20/600 and/or a visual field of less than 5° in the best eye with the best practical eye correction; B3: visual acuity above 20/600 but less than 20/200 and/or a visual field between 5° and 20° in the best eye with the best practical eye correction; B4: low vision between 20/200 and 20/60 in the best eye with the best practical eye correction (IBSF, 2021).
On average, the participants reported 195.80 ± 227.05 min per week of walking time. The walkability score for their residential zip code averaged 37.07 ± 30.72, suggesting that many participants lived in areas that were ‘car-dependent’, with 62.5% of the participants living in a zip code Walk Score ⩽49 (Table 1). When controlling for additional health conditions, visual impairment level, sex, age, race, and self-reported health rating, walkability scores were not significantly associated with walking minutes per week, F(6, 81) = .934, p = .84, R2 = .08. As seen in Table 2, the regression model showed that age was a significant negative predictor for participant’s walking minutes per week (β = −.22, p = .046); however, residential walkability score did not predict total weekly walking minutes for adults with visual impairments.
Regression results predicting participant walking minutes per week.
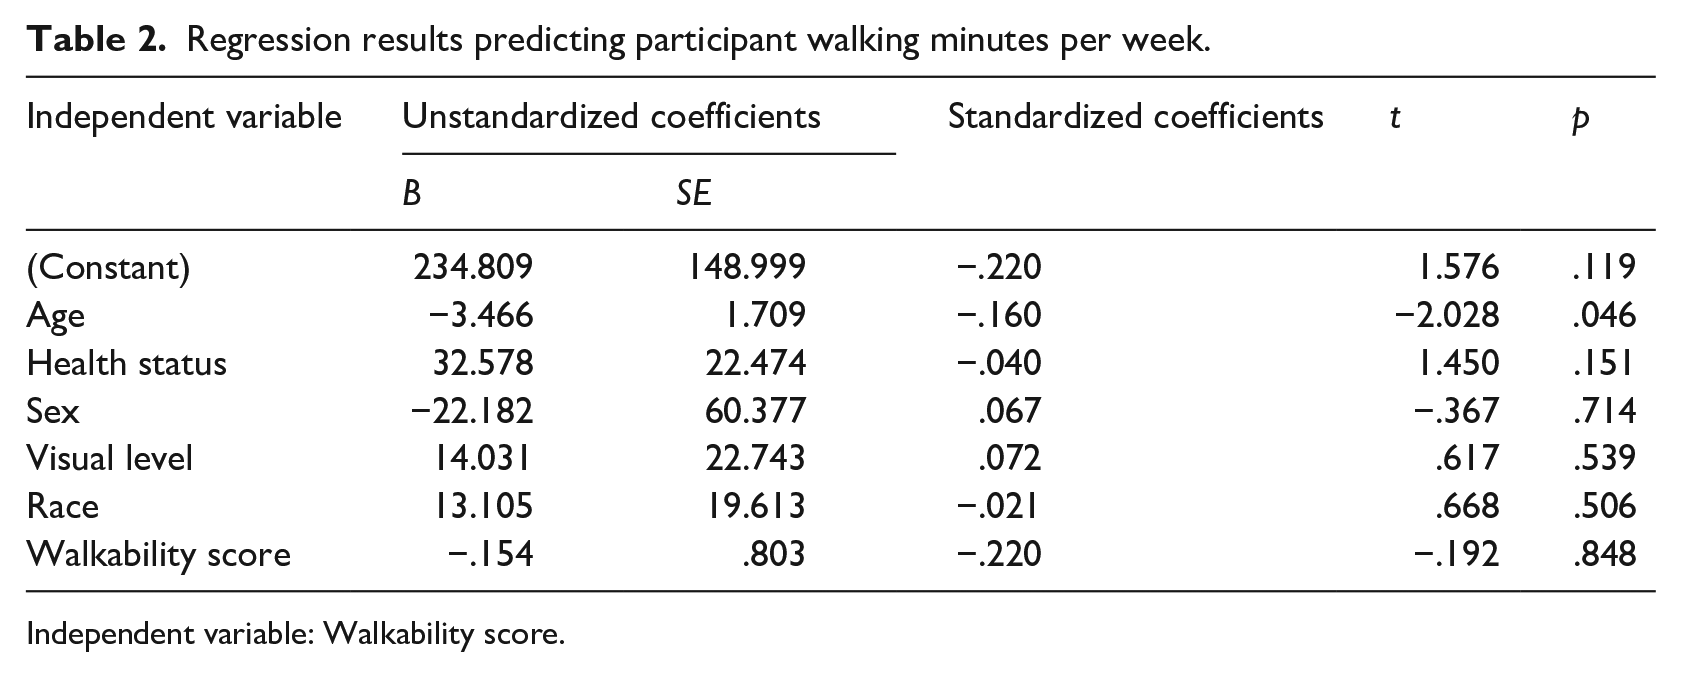
Independent variable: Walkability score.
Discussion
In this study, we focused on examining neighbourhood Walk Score and how this factor may associate with walking minutes per week among adults with visual impairments. This sample of participants reported moderate levels of physical active according to the CDC (2021), averaging 195.80 ± 227.05 min per week of walking time. However, and despite their activity levels and the positive associations in prior research among sighted adults (Berke et al., 2007; Shimura et al., 2012; Sundquist et al., 2011; Twardzik et al., 2019), associations between walking and walkability scores were unfounded among adults with visual impairments in this study.
The null findings of our study on the relation between Walk Score and walking minutes reported may suggest that there are additional barriers more powerful than neighbourhood walkability that may deter adults with visual impairments from engaging in walking within their neighbourhood. For example, social support is a psychosocial construct that may intersect with built environment to compound barriers. Narrow sidewalks cannot easily accommodate two people and may further limit the ease or convenience for individuals to walk or exercise with a partner. Furthermore, a lack of social support may be a standalone barrier for some and therefore require support from other individuals to promote physical activity (Haegele et al., 2017).
Other barriers that have been explored and can influence physical activity for individuals with visual impairments may include accessibility or personal barriers (Kirk et al., 2021). Accessibility is paramount to physical activity participation and may especially impact participants who are not currently active (Shaw et al., 2012). However, areas being accessible is not enough, as persons with visual impairments must also know that areas are accessible. That is, the knowledge of the accessibility of a location or resource must also be available and can impact the user if the prior knowledge of the area does not exist and information about the area is not accessible (Kirk et al., 2021). Personal barriers may include factors such as the perception of one’s skill level or self-beliefs about physical activity (Kirk et al., 2021). As indicated in the findings, ageing may also be a factor that can influence the walking behaviour of adults with visual impairments. Age has been noted as a factor that influences physical activity throughout the literature (Griffin et al., 2016; K. S. Hall et al., 2017; Suryadinata et al., 2020). These considerations may impact the confidence of an individual to participate in physical activity, especially in a public setting. A further examination into the barriers of participation within walkable areas may help increase physical activity levels in adults with visual impairments and should be included in future studies.
Several limitations should be considered when interpreting the results of this study. For example, the sample of participants was very homogeneous, limiting generalizability. The study was also based on self-report data, which have been shown to overestimate desirable variables, such as physical activity levels. In addition, not all participants provided a complete home address; therefore, Walk Score (2021) was calculated using zip code. Zip code is less accurate than using a home address because it provides a Walk Score for a broad area, while Walk Score using a home address provides a more accurate score from the subject’s specific address (Walk Score, 2021).
The findings from this study were surprising, as hypothesized associations between walkability and walking minutes were unfounded. While surprising, there are logical explanations for why these findings may also be incongruent with prior work. Chief among them may be the instrument used to measure walkability, Walk Score (2021), which may have missed key elements required for adults with visual impairments to access their neighbourhood safely and easily. Twardzik et al. (2019) asserted that Walk Score does not represent the true physical environment which may impact these results. These elements may include, but are not limited to safety, sidewalks, parks, and flat and illuminated streets (Paiva Neto et al., 2021). While amenities and locations may have been within close proximity as determined by Walk Score, these amenities may not have been accessible to adults with visual impairments. As such, it is logical to suggest that Walk Score may not be a sensitive enough or an appropriate measure to explore walkability for adults with visual impairments and their specific needs. Future research in this line of inquiry may consider using other measures of walkability, perhaps the Neighbourhood Environment Walkability Survey (NEWS), that provides a more detailed assessment or supplemental measures for this population when examining walkability (Cerin et al., 2006).
Footnotes
Funding
The author(s) disclosed receipt of the following financial support for the research, authorship, and/or publication of this article: The development of this manuscript was partially supported by a grant from the US Department of Education (H325H190001). However, the contents do not necessarily represent the policy of the US Department of Education, and you should not assume endorsement by the Federal Government. Project Officer Louise Tripoli and Richelle Davis.