



Abstract
Low-vision quality-of-life questionnaire (LVQOL) has not been developed in the Arabic language, and none has been translated into Arabic. This study would demonstrate the effectiveness of the translated questionnaire. The English LVQOL was translated into Arabic (ARB-LVQOL) through five stages. A total of 52 low vision and 30 normally sighted individuals participated in this study. The internal consistency reliability, item-total correlation reliability, construct validity, convergent validity, discriminative validity, and respondent burden of the ARB-LVQOL were calculated. The translation team recommended that the ARB-LVQOL replicated the meaning of the LVQOL. The cultural differences were also noted during the translation process. Cronbach’s coefficient was α = 0.90 in both low vision (LV) and simulated groups. The item-total correlation ranged from 0.50 to 0.70 in both groups. The intra-class correlation coefficient indicated good test–retest reliability (LV group, ranged 0.82–0.93; control group ranged 0.83–0.94). The factor analysis, using varimax rotation, of the ARB-VQOL identified seven factors. A moderate to a strong relationship between the score of each domain with the total index score was observed, indicating an adequate convergent validity. The ARB-LVQOL discriminated between normally sighted and simulated low-vision participants and also to some extent between the simulated and real low-vision individuals. The respondent burden was less than 15 min in most responses. The ARB-LVQOL was found to relate well with patients’ visual functions and some patients’ characteristics, providing further evidence of the validity of ARB-LVQOL. The ARB-LVQOL showed psychometric properties analogous to the English version. The ARB-LVQOL could be used in clinical settings and research in adults with low vision in Arabic populations.
Introduction
Low vision can be defined as a chronic reduction of vision, and if uncorrectable, it can affect daily life (Dandona & Dandona, 2006). Individuals with low vision have residual sight that can be used for everyday activities (Dandona & Dandona, 2006). Those individuals suffer from imperative limitations in psychological distress, functioning, and challenges in daily activities (Leissner et al., 2014; Swanson & McGwin, 2004). In the Middle East region, there are approximately 580.2 million inhabitants (Pascolini & Mariotti, 2012). Out of those, 4.9 million are blind people (0.85% of the population) (blindness was defined as visual acuity < 3/60), 18.5 million (3.2%) individuals with low vision (defined as visual acuity < 6/18 and ⩾ 3/60), leaving the total to be 23.5 million (4.05%) individuals with a visual impairment (both blindness and low vision combined) (Pascolini & Mariotti, 2012). In Saudi Arabia, 0.70%–6% of the population are estimated to be blind, and 7.8%–14% are estimated to be visually impaired (Al Ghamdi et al., 2012; Alghamdi, 2016; Al-Ghamdi, 2019; Al-Shaaln et al., 2011; Hajar et al., 2015). Low-vision rehabilitation was suggested to improve health-related quality of life (QOL) (Binns et al., 2012; Ehrlich et al., 2017).
The QOL refers to person’s aims, potential, concerns, standards, and perceptions of their life, the cultural environment, and value systems of the area in which they live (The WHOQOL Group, 1994). The QOL became essential as a valuable tool of clinical outcome measure as well as an in research studies (O’Boyle, 1997). These questionnaires can be used to detect the impact of an intervention or the consequence of losing a function on the patient (Terheyden & Finger, 2019). It is also believed that the clinicians’ decision of successful effect is occasionally different from the patients’ perspective (O’Boyle, 1997). Clinicians mainly depend on objective criteria, like visual acuity and visual field, while patients are generally more focused on issues related to self-perception, and their performance of daily activities (Felce & Perry, 1995). Considering a patient-centered outcome would improve clinical decision, assist in management alternatives, increase the identification of services, and in allocating resources (O’Boyle, 1997).
In clinical practice, the efficacy of treatment typically evaluates the change after an intervention; and whether there is a statistical significance between the intervention group and control group or before and after the intervention. However, statistical significance may not entirely represent the “clinical significance” (Ranganathan et al., 2015). Using other assessment tools, including the QOL questionnaire, will thus be of high importance.
The available vision-specific health-related QOL measures were developed for targeted applications (Paz et al., 2013). Some questionnaires, for example, were directed to Amblyopia (Bian et al., 2015; Carlton & Kaltenthaler, 2011) retinal detachment (Smretschnig et al., 2016) and glaucoma (Spaeth et al., 2006). Specifically, low vision has impact on daily activities functioning and well-being and thus their QOL (Habib & Irshad, 2018; Langelaan et al., 2007; Paz et al., 2013; Wong et al., 2009). Given the patient-centered approach that is advocated in low vision rehabilitation, it is of crucial importance to use a patient-centered outcome related to the treatment objective (Goldstein et al., 2015). Finally, interdisciplinary low-vision rehabilitation was suggested to improve person’s QOL (Hinds et al., 2003).
One of the most widely cited patient-centered outcomes, in both clinical practice and research, is the low vision QOL questionnaire (LVQOL) (Wolffsohn & Cochrane, 2000a). The LVQOL questionnaire was designed to capture the self-reported level of difficulty across functional performances of vision-dependent activities. The questionnaire items assessed task performance and were chosen based on interviews with a multidisciplinary group of low vision rehabilitators. The questionnaire targeted the adult population with low vision, severe low vision, or blindness. It was developed for and validated in a representative sample of Australian residents. The LVQOL comprises 25 items measured on a 6-point Likert-type scale. It showed good psychometric properties and is relatively short and easy to complete. The LVQOL questionnaire has been validated using Rasch analysis (Van Nispen et al., 2011) and its sensitivity to variation with visual worsening have been investigated by a multi-level item response theory (IRT) model (Van Nispen et al., 2010). The LVQOL questionnaire has been tested for interviews, telephone, and self-administration (Wolffsohn & Cochrane, 2000a).
The interviewee expected to respond to LVQOL items by rating them between 1 (to have a great difficulty with the task because of poor vision) and 5 (to have no difficulty with the task) or as 0 (could not perform the task because of poor vision). Furthermore, the respondents were given the possibility to rate the item as “non-relevant” where they felt it is not part of their daily activities. Wolffsohn and Cochrane (2000a) suggested giving an average score to each item so that those who marked several as non-relevant did not receive lesser sum scores and then a worse QOL. Average score were also given to missed items, which can be found in less than 0.5% of questionnaires. All items in this study were scored on the same 6-point Likert-type scale (Wolffsohn & Cochrane, 2000a). The LVQOL has been translated into Chinese, Turkish, Indian (though not formally validated), and Thai (as a preliminary report) (Do et al., 2014; Idil et al., 2011; Yingyong, 2007; Zou et al., 2005).
The majority of QOL instruments have been developed for applications in Western countries and mainly in the English language (de Boer et al., 2004). Slevin and colleagues explained how a physician could not accurately determine a patients’ QOL and suggested that to produce a reliable and consistent outcome, measurements must come from the patients themselves (Slevin et al., 1988). It has further been suggested that the self-administration of QOL instruments produces more favorable ratings compared with face-to-face and telephone presentations (Weinberger et al., 1996). Therefore, it would not be possible to self-administer these English questionnaires in populations with predominantly Arabic-speaking citizens. In addition, since cultural barriers would also disrupt the accuracy and reliability of face-to-face administration, we believe that using a validated Arabic version of the questionnaires would enable comparison with other international studies and contribute to the standardization eye care quality.
There are more than 580 million native Arabic speakers in the Middle East, and tens of millions across the world. Although there are several vision-related Arabic QOL questionnaire (Abdelfattah et al., 2014; Bokhary et al., 2022; Dawoud et al., 2020; Mousa et al., 2012). To our knowledge, only one Arabic QOL questionnaire was found that specifically directed to patients with low vision, this recent study translated the Impact Visual Impairment On Children (IVI-C) questionnaire (Bokhary et al., 2021). Thus, there is present need to validate more tools to assess vision-related QOL of Arabic speaker adults with low vision. This study aimed to translate the LVQOL into the Arabic language and investigate its validity. We suggest using the tool in Arabic populations in a clinical setting, complementary to the objective clinical measures of visual function in optometry, evaluating therapies of interventions, as an outcome instrument in research, and monitoring and evaluating the efficacy of low vision rehabilitation strategy and management. This study was performed among an adult population, aged over 18 years, with heterogeneous causes of low vision.
Methods
Participants and procedures
The study was conducted in Riyadh, Saudi Arabia. An approval from institutional ethical committee was obtained. Informed consent was acquired from the participants (or their parents/guardians) to take part. The Declaration of Helsinki was followed in full and study details and the possible consequences were completely explained.
Study design
This study design was a cross-sectional study and conducted in three phases.
Phase I
This phase comprised the translation of the LVQOL questionnaire into Arabic, following standardized guidelines involving five stages (Beaton et al., 2000; Tsang et al., 2017). First, two independent professionals conducted a forward translation of the questionnaire from English into Arabic. Although Arabic was their mother tongue, they could also speak and understand English fluently. One was a non-medical translator and the other was a researcher and clinician working with patients living with low vision, and thus aware of the concept of functional vision. Each translator worked on the questionnaire items and scale without communication. The second stage was to synthesize the LVQOL translations. The two forward translations were compared, and their discrepancies were discussed between the translators and through consultation of a third researcher. Based on the original LVQOL, and the two drafted translations, a synthesized version was produced, resulting in one unified translation. Third, two other translators, both fluent English speakers who had never seen the original questionnaire, back-translated the drafted ARB-LVQOL. These people were not familiar to both the original LVQOL and with the concept of functional vision and low vision. In the fourth stage, a committee, including a principal investigator and the four translators, reviewed the drafts, resolved discrepancies, and reached a consensus on the final version of the ARB-LVQOL questionnaire. Finally, cognitive debriefing of the drafted ARB-LVQOL questionnaire was carried out on five normal participants to test their interpretation and understanding of the questionnaire.
Phase II
Phase two was to conduct a pilot study of the drafted ARB-LVQOL in a control group with simulated vision loss. A total of 30 normally sighted participants were recruited. All of them were native Arabs, aged from 21 to 26 years (23.50 ± 1.65), their binocular VA was better than 6/7.5 (0.03 ± 0.11 logMAR), their mean contrast sensitivity was 1.72 ± 0.06 Log CS, and all of them have normal and intact visual field. The participants were asked to experience various activities included in the LVQOL, under habitual normal vision and simulated low vision conditions (randomly selected for each participant). Low vision simulators produced different ocular conditions involving peripheral field loss, central loss, hemianopia, overall blur (or cataract), and Cytomegalovirus retinitis. The ARB-LVQOL was presented to this group twice, once under their habitual normal vision status and then with low vision simulators. The objective of this phase is to assess the responsiveness of ARB-LVQOL to distinguish between both responses after a change in the visual functions that were caused by the low vision simulators.
Phase III
This study recruited random low vision participants with the following inclusion criteria: (1) aged 18 years and older; (2) visual acuity of less than 0.50 logarithm of the minimum angle of resolution (logMAR) (or 6/18), in the better eye with the best possible correction under WHO manual of the international classification of disease, injuries, and causes of death (World Health Organization, 1977); (3) native Arabic speakers; and (4) the capability to understand and complete the questionnaire. This study recruited a total of 52 patients with low vision from an institute for blind and partially sighted patients. This blind and partially sight institution host patients from the age of 15 to 50 years.
The ARB-LVQOL was intended to be self-administered. Similar to the method used by Wolffsohn and Cochrane (2000a), the questionnaire was printed with sufficient font size (equivalent to N20) to allow most participants with low vision to be able reading them. If needed, a trained research investigator read the questionnaire to participants who were unable to read it and recorded the responses.
Data collected
The patients’ background information was collected on a structured form; including their personal information (like whether they use vision aids), visual complaints, general and ocular history, causes of reduced vision (type of eye disease), duration of ocular pathology, and date of interview. The gathered data were managed by ID number and analyzed to maintain the anonymity of all participants. Specifically, distance and near visual acuity, contrast sensitivity, and central visual field were collected to confirm that the participants have the criteria to be included in this study and to be used in any future study comparing findings.
Distance and near visual acuity
The distance visual acuity was assessed monocularly, with habitual corrections if any, using the 4-m non-illuminated Early Treatment Diabetic Retinopathy Study chart (Precision Vision, Illinois, USA). It was recorded based on the smallest complete line of letters identified, taking out the number of letters not identified in that line, or adding the number of letters identified beneath that line.
Practical near acuity chart was used and previously suggested to be a fast but accurate tool to measure near acuity (Wolffsohn & Cochrane, 2000b). It was measured at 25 cm, with the best distance correction, and a +4.00 diopter addition (or with magnification aids if any).
Contrast sensitivity
Mars contrast sensitivity chart (Mars Perceptrix, Chappaqua, NY, USA) was conducted in a well-lit room (illumination level approximately 85 cd/m2). The chart distance was at 50 cm with the participant wearing their habitual correction, when necessary. They were requested to read across the lines going down the chart. The Mars test was suggested to produce reliable outcomes that is comparable with Pelli-Robson test (Dougherty et al., 2005).
Central visual field
Amsler chart (Keelers, UK) was used to assess any visual field loss or disruption within the central 20°. Each participant presented with chart number one, tested monocularly while wearing correction as required. They were asked to fixate on the dot in the center and note the lines of the square. The participants were requested to report any bending lines or gap in-between them.
Analytic methods
The collected data were analyzed using the IBM SPSS Statistics (IBM Corp, USA). Statistical significance was considered when p < .05. The Kolmogorov–Smirnov test was conducted to investigate the data normality, which was not normally distributed, and a median ± interquartile range was used in reporting the outcomes. Descriptive statistics were also used to summarize participants’ characteristics.
The ARB-LVQOL internal consistency (reliability) was examined using Cronbach’s α (internal consistency should be between 0.70 and 0.90) and the item-total correlation (correlation of one item with its sub-scale without that item, previous studies suggested cutoff point of 0.40 for total correlation) (Cronbach, 1951; Gliem & Gliem, 2003).
Construct validity was investigated using the intra-class correlation coefficient and carrying out a factor analysis – principal component with varimax rotation (Streiner et al., 1996). The Kaiser–Meyer–Olkin measure of sampling adequacy (the suggested cut of point was 0.50) and Bartlett’s test was used to investigate the data suitability for factor analysis (or structure detection). Furthermore, communalities represented the percentage of item variance explained by the extracted factors which could refer to the suitability of conducting confirmatory factor analysis – a cut-off of 0.5 was suggested to be practical (Hair et al., 2009). Factor analysis identified latent factors within groups of variables but did not interpret their meaning. In psychometrics analysis practice, it is important to ascertain the primary theme of a factor through examining the content of the fundamental items, or those with the highest loadings (DeVellis, 1991). Hair et al. suggested that a factor loading of ⩾0.50 is practically significant in a study using the same cut-off criteria (Hair et al., 2009). The summed score of the ARB-LVQOL items were considered, as has been recommended for QOL questionnaire analysis (Dodds et al., 1991).
The convergent validity was evaluated by exploring relationship between the scores of the total score and each domain (Bian et al., 2015). The discriminative validity was conducted using the Mann–Whitney U investigating the difference between the median sum scores of the participants with low vision with individuals of simulated eye diseases group and by comparing the scores of visually normal participants with the scores in the simulated low vision group using the Wilcoxon Signed Rank Test (Bian et al., 2015).
Finally, the respondent burden can refer to the loads placed on the participants. This respondent burden can be perceived in terms of time, emotional strain, or energy. In research, the maximum administration time to disabled people was proposed to be within 15 min (Andresen, 2000; de Boer et al., 2004). We have categorized a response with “+” if the administration time was less than 15 min or “–” if it was the opposite (de Boer et al., 2004).
Results
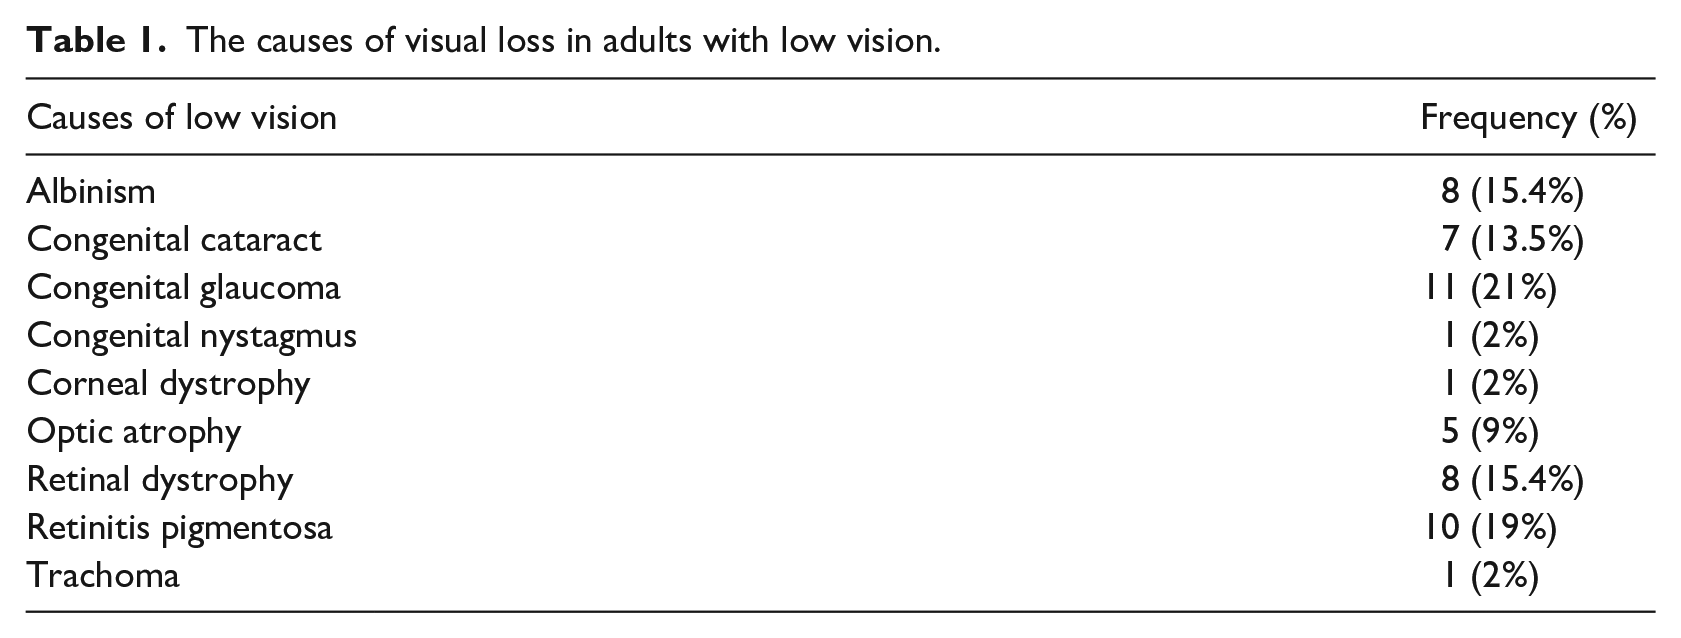
Of the 90 adults with low vision who were invited, 52 (57%) gave a written informed consent to participate. The main deterrents were time constraints and a preference against participating. The causes of the low vision are presented in Table 1. Thirteen participants (25%) had a previous ocular procedure including cataract surgery, corneal transplant, and retinal detachment repair. Furthermore, five (10%) have some general health history involving asthma, cholesterol, hypertension, and diabetes. The demographic and clinical characteristics of the low vision and normally sighted participants are summarized in Table 2.
The causes of visual loss in adults with low vision.
The median ± interquartile range of demographic and clinical characteristics of the participants with low vision and visually normal participants.

LV: low vision; LVQOL: low-vision quality-of-life questionnaire; logMAR: logarithm of the minimum angle of resolution.
Comparing scores between groups using Mann–Whitney U test.
Comparing scores within simulated group using Wilcoxon Signed Rank test.
Statistical significance.
Reliability and internal consistency
For all 25 items in the ARB-LVQOL, Cronbach’s α showed the questionnaire to reach strong reliability of α = 0.90 in both real and simulated low vision groups. In both groups, all items appeared to merit retention, as item-total statistics showed that deleting any of the 25 would not result in a decrease in the value of α. The item-total correlation ranges between 0.50 and 0.7 in the tested groups, indicating that the ARB-LVQOL holds good homogeneity.
Construct validity
The intra-class correlation coefficients in the low vision and simulated groups were 0.88 (95% confidence interval ranged 0.82–0.93) and 0.89 (95% confidence interval ranged 0.83–0.94), respectively.
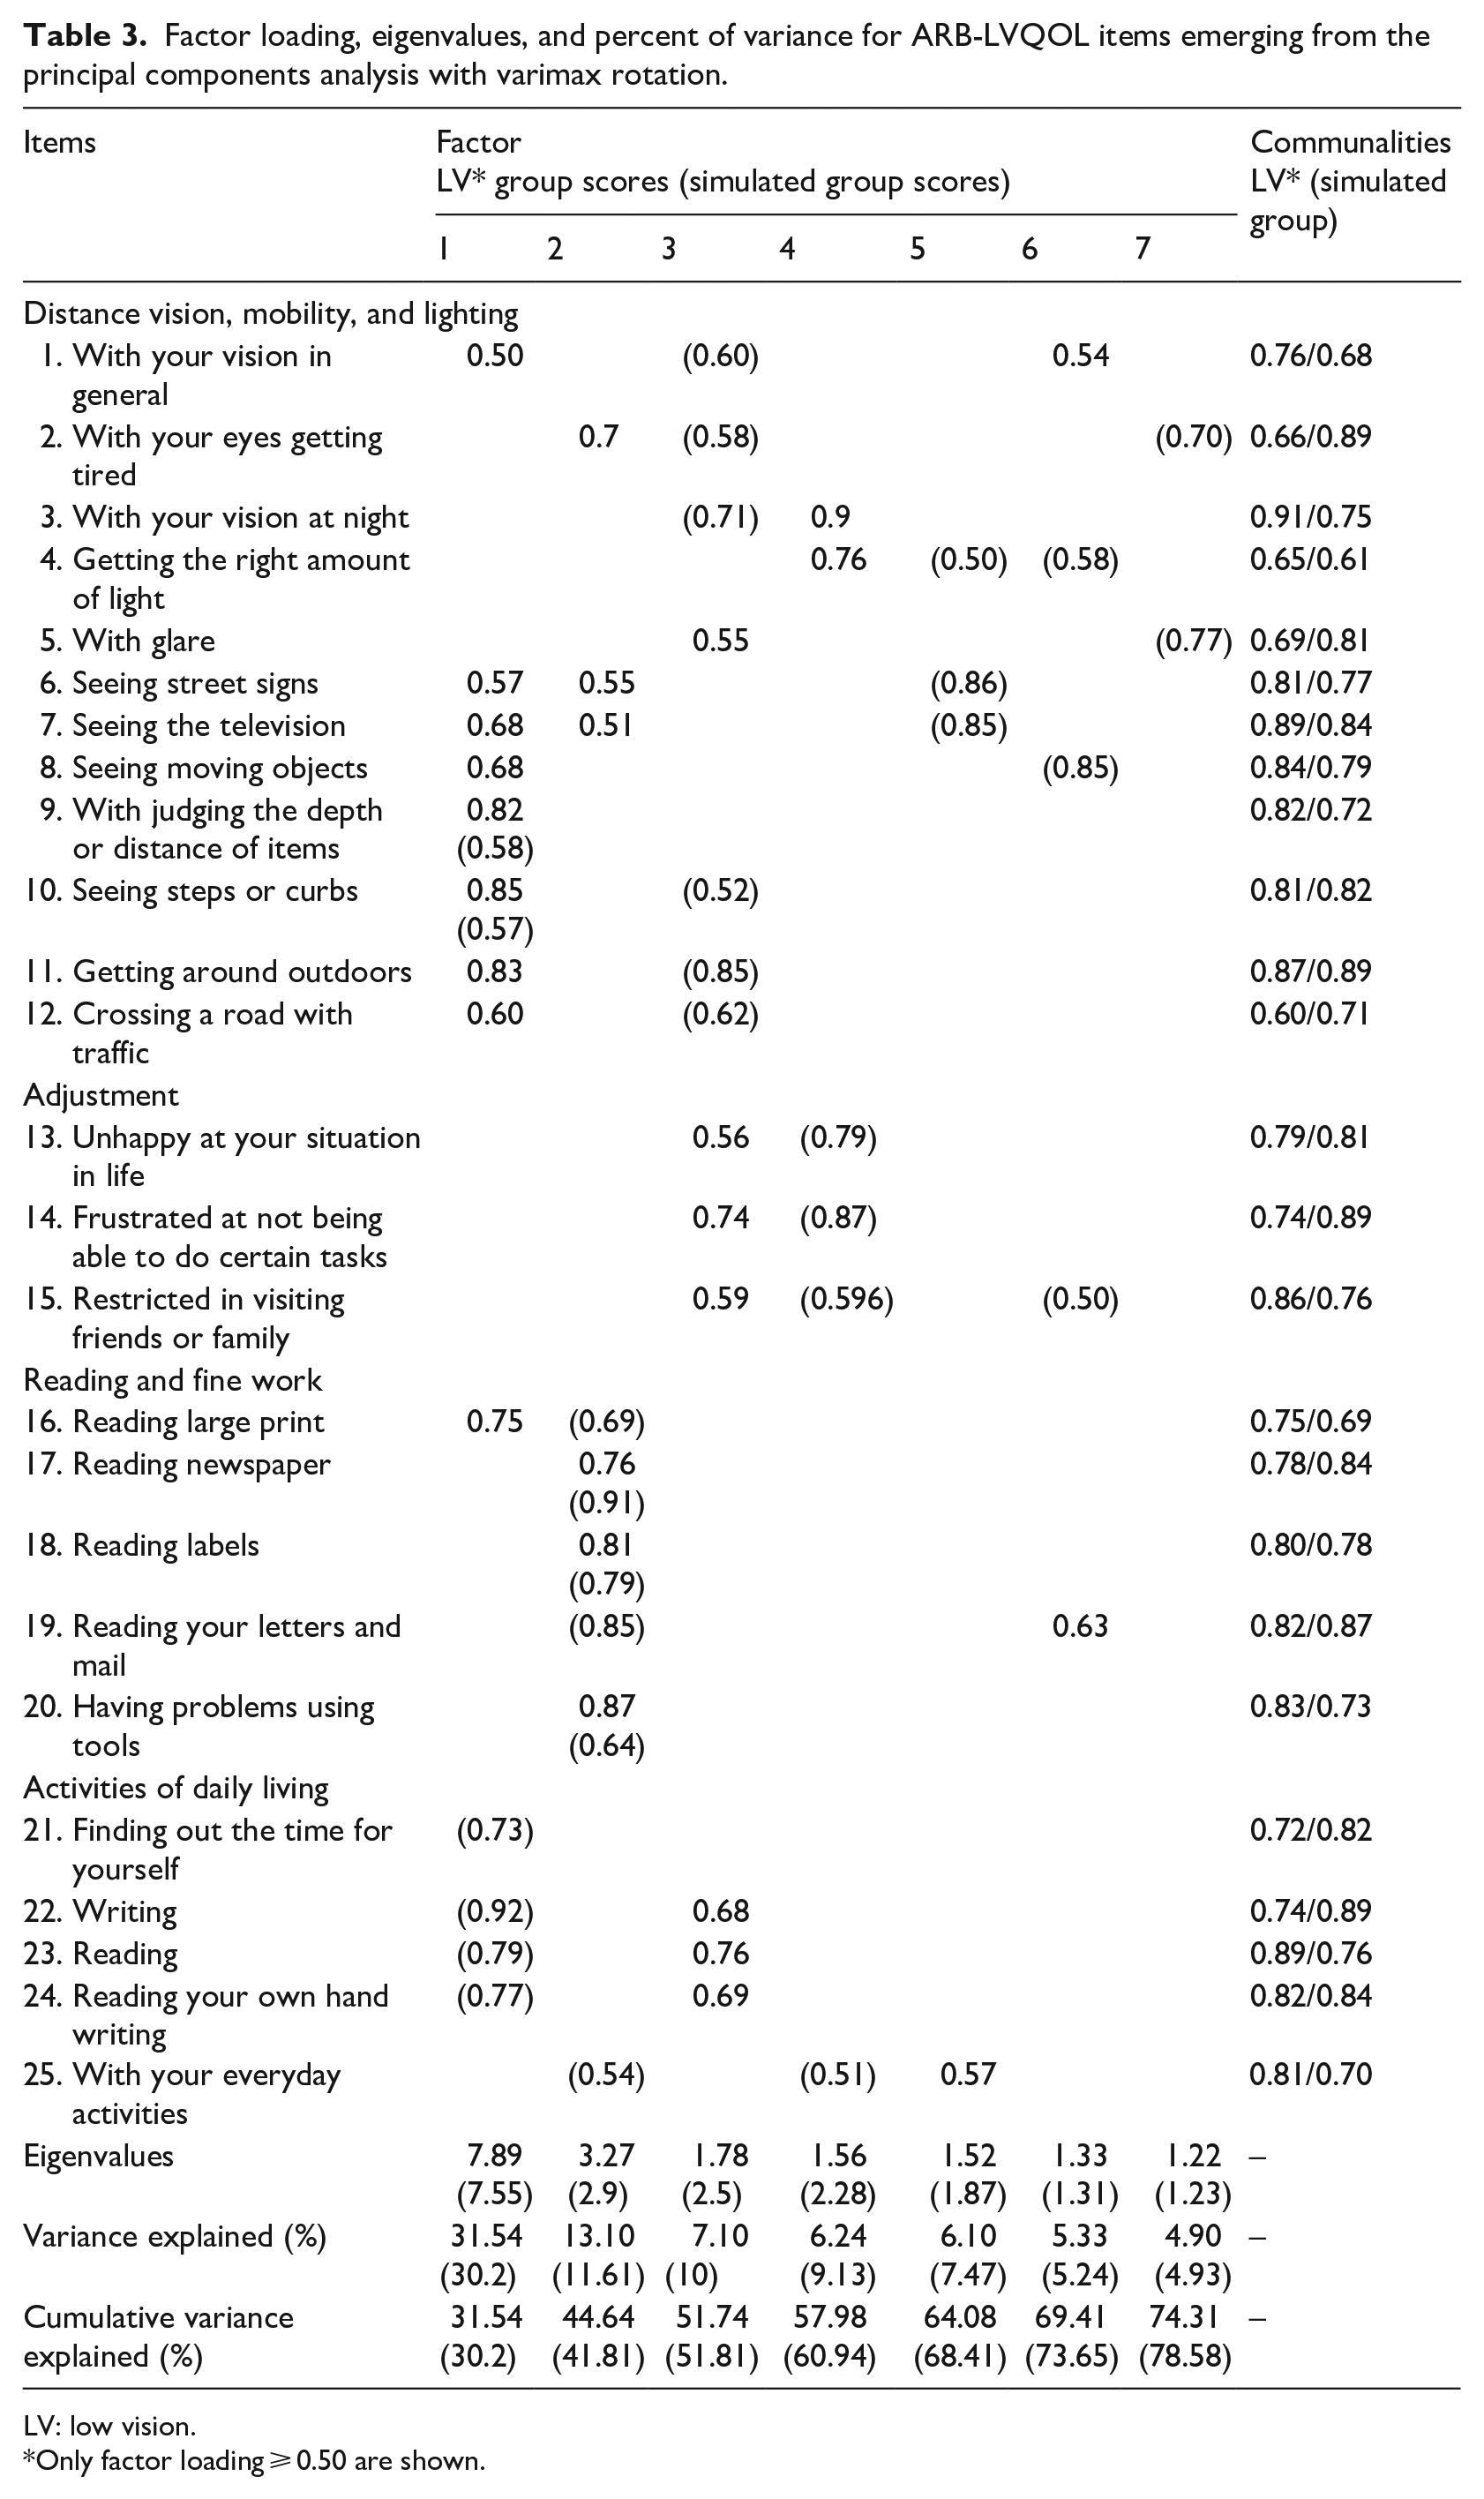
Factorial analysis of the Kaiser–Meyer–Olkin showed respective values of 0.60 and 0.53 in the low vision and simulated groups, respectively. Bartlett’s test of sphericity was significant in low vision and simulated groups, χ2(300) = 654, p < .0001, χ2(300) = 625, p < .0001, respectively. The communalities were all above 0.50 and listed in Table 3, confirming that each item shared some common variance with others. The overall results indicated that the sampling is adequate and suitable for factor analysis with all 25 items.
Factor loading, eigenvalues, and percent of variance for ARB-LVQOL items emerging from the principal components analysis with varimax rotation.
LV: low vision.
Only factor loading ⩾ 0.50 are shown.
In the low vision group, seven factors were extracted which had eigenvalues greater than 1.0. Those factors explained 74.3% of the total variance (Table 3). The total variance was examined and found that the first factor, domains of “distance vision, mobility, and lighting,” and Item 16 accounted for 31.54% of the total variance; the second factor, “ reading and fine work” and Items 2, 6, and 7 accounted for 13.10%; the third factor, “adjustment” and Item 5 accounted for 7.10%; the fourth factor, Items 3 and 4 in “distance vision, mobility, and lighting” loaded well together and accounted for 6.24%, the fifth factor; only item 25 loaded above 0.50 and accounted for 6.1%, the sixth factor, Items 1 and 19 also loaded well together and accounted for 5.3%; and the seventh factor, with no item loaded above 0.50, accounted for 4.90%. All items except for item 21 demonstrated at least a score of ⩾0.50 representing moderate loading on one of the seven factors (Table 3).
In the simulated group, seven factors were extracted which had eigenvalues greater than 1.0. Those factors explained 78.58% of the overall total variance (Table 3). When the total variance was examined, the first factor, the domain of “activities of daily livings” and Items 9 and 10 in “distance vision, mobility, and lighting” accounted for 30% of the total variance; the second factor, “ reading and fine work” and Item 25 accounted for 11.6%, the third, fifth, sixth, and seventh factor, items in “distance vision, mobility, and lighting” loaded well together and accounted for 10% and 7.47%, 5.24%, and 4.93%, respectively; the fourth factor, items in “adjustment” and Item 25 also loaded well together and accounted for 9%. Similar to result found in the low vision group, all items demonstrated at least a score of ⩾0.50 representing moderate loading on one of the seven factors (Table 3).
Convergent validity
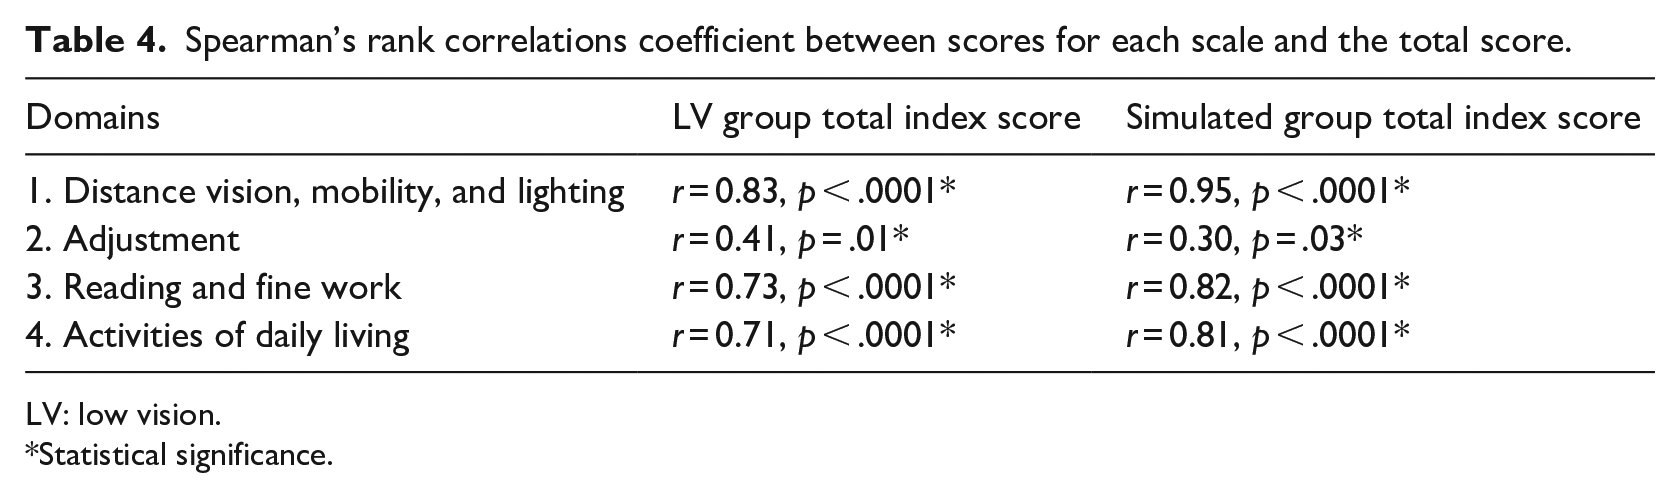
Spearman’s rank order correlation were conducted to explore the relationship between the scores of the total score and each domain of the ARB-LVQOL in low vision and simulated group (Table 4). The test findings show that the questionnaire had a moderate to a high relationship between the total index score and the score of each domain, suggesting convenient convergent validity.
Spearman’s rank correlations coefficient between scores for each scale and the total score.
LV: low vision.
Statistical significance.
Discriminative validity
This part was conducted to evaluate how well the ARB-LVQOL differentiated between the low vision and simulated group and the stimulated group and visually normal adults. The median sum score of ARAB-LVQOL for the low vision patients was lower (worse QoL) than the simulated group but did not reach the statistical significance level (62.50 vs 66.35; p = .12) (Table 2, Figure 1). The median sum score of the simulated group was statistically significantly poorer than the scores of the adults with normal vision (66.35 vs 125; p < .001) (Table 2), indicating that the ARB-LVQOL discriminating between visually normal/anomalous participants.
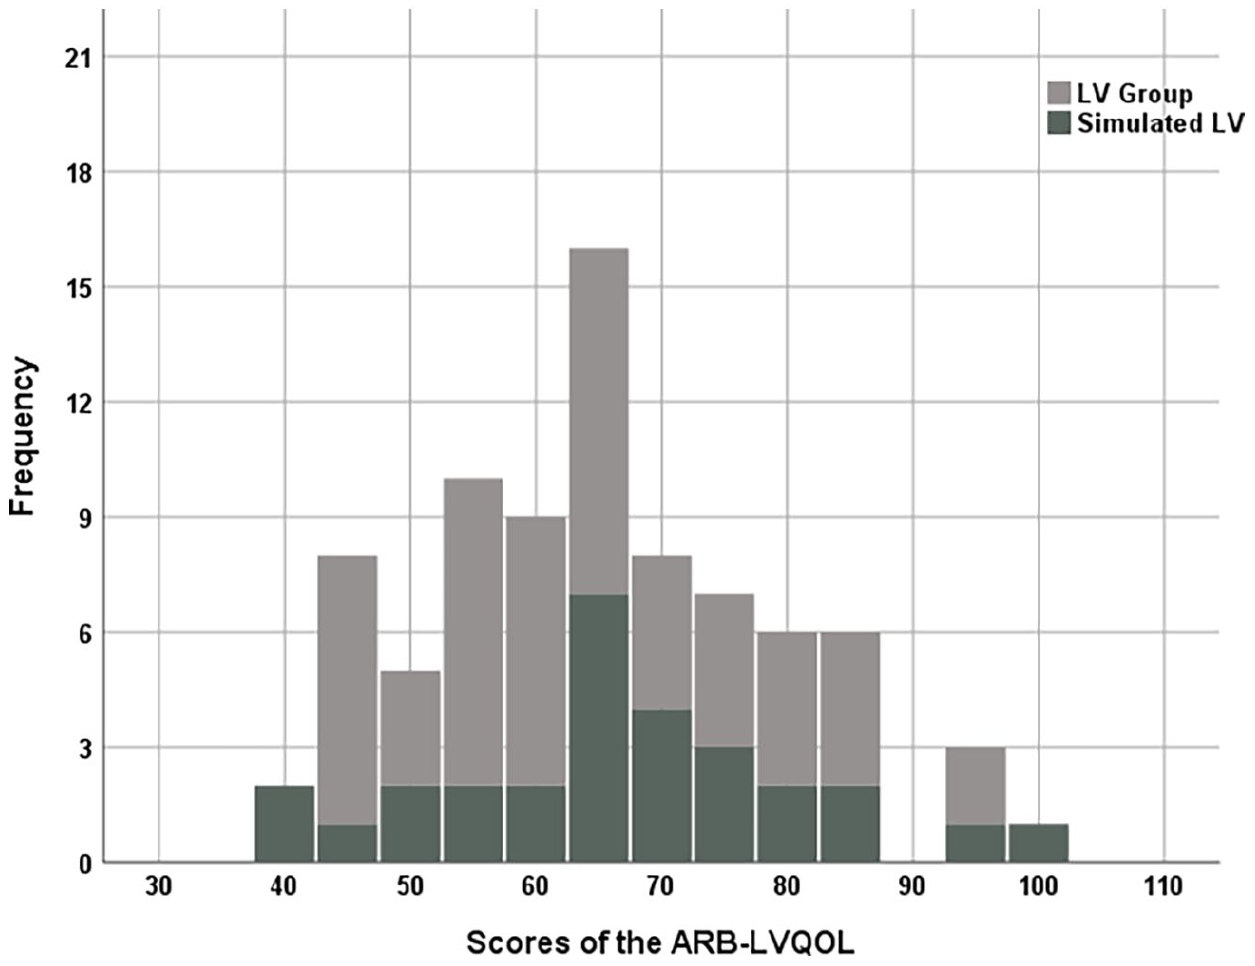
Frequency distribution of the participants’ scores in both the low vision (LV) group and the simulated LV group.
Respondent burden
For the vast majority of participants, the response time of administration was <15 min (>95%), indicating a minimal respondent burden.
Relationship between patients’ characteristics and ARB-LVQOL scores
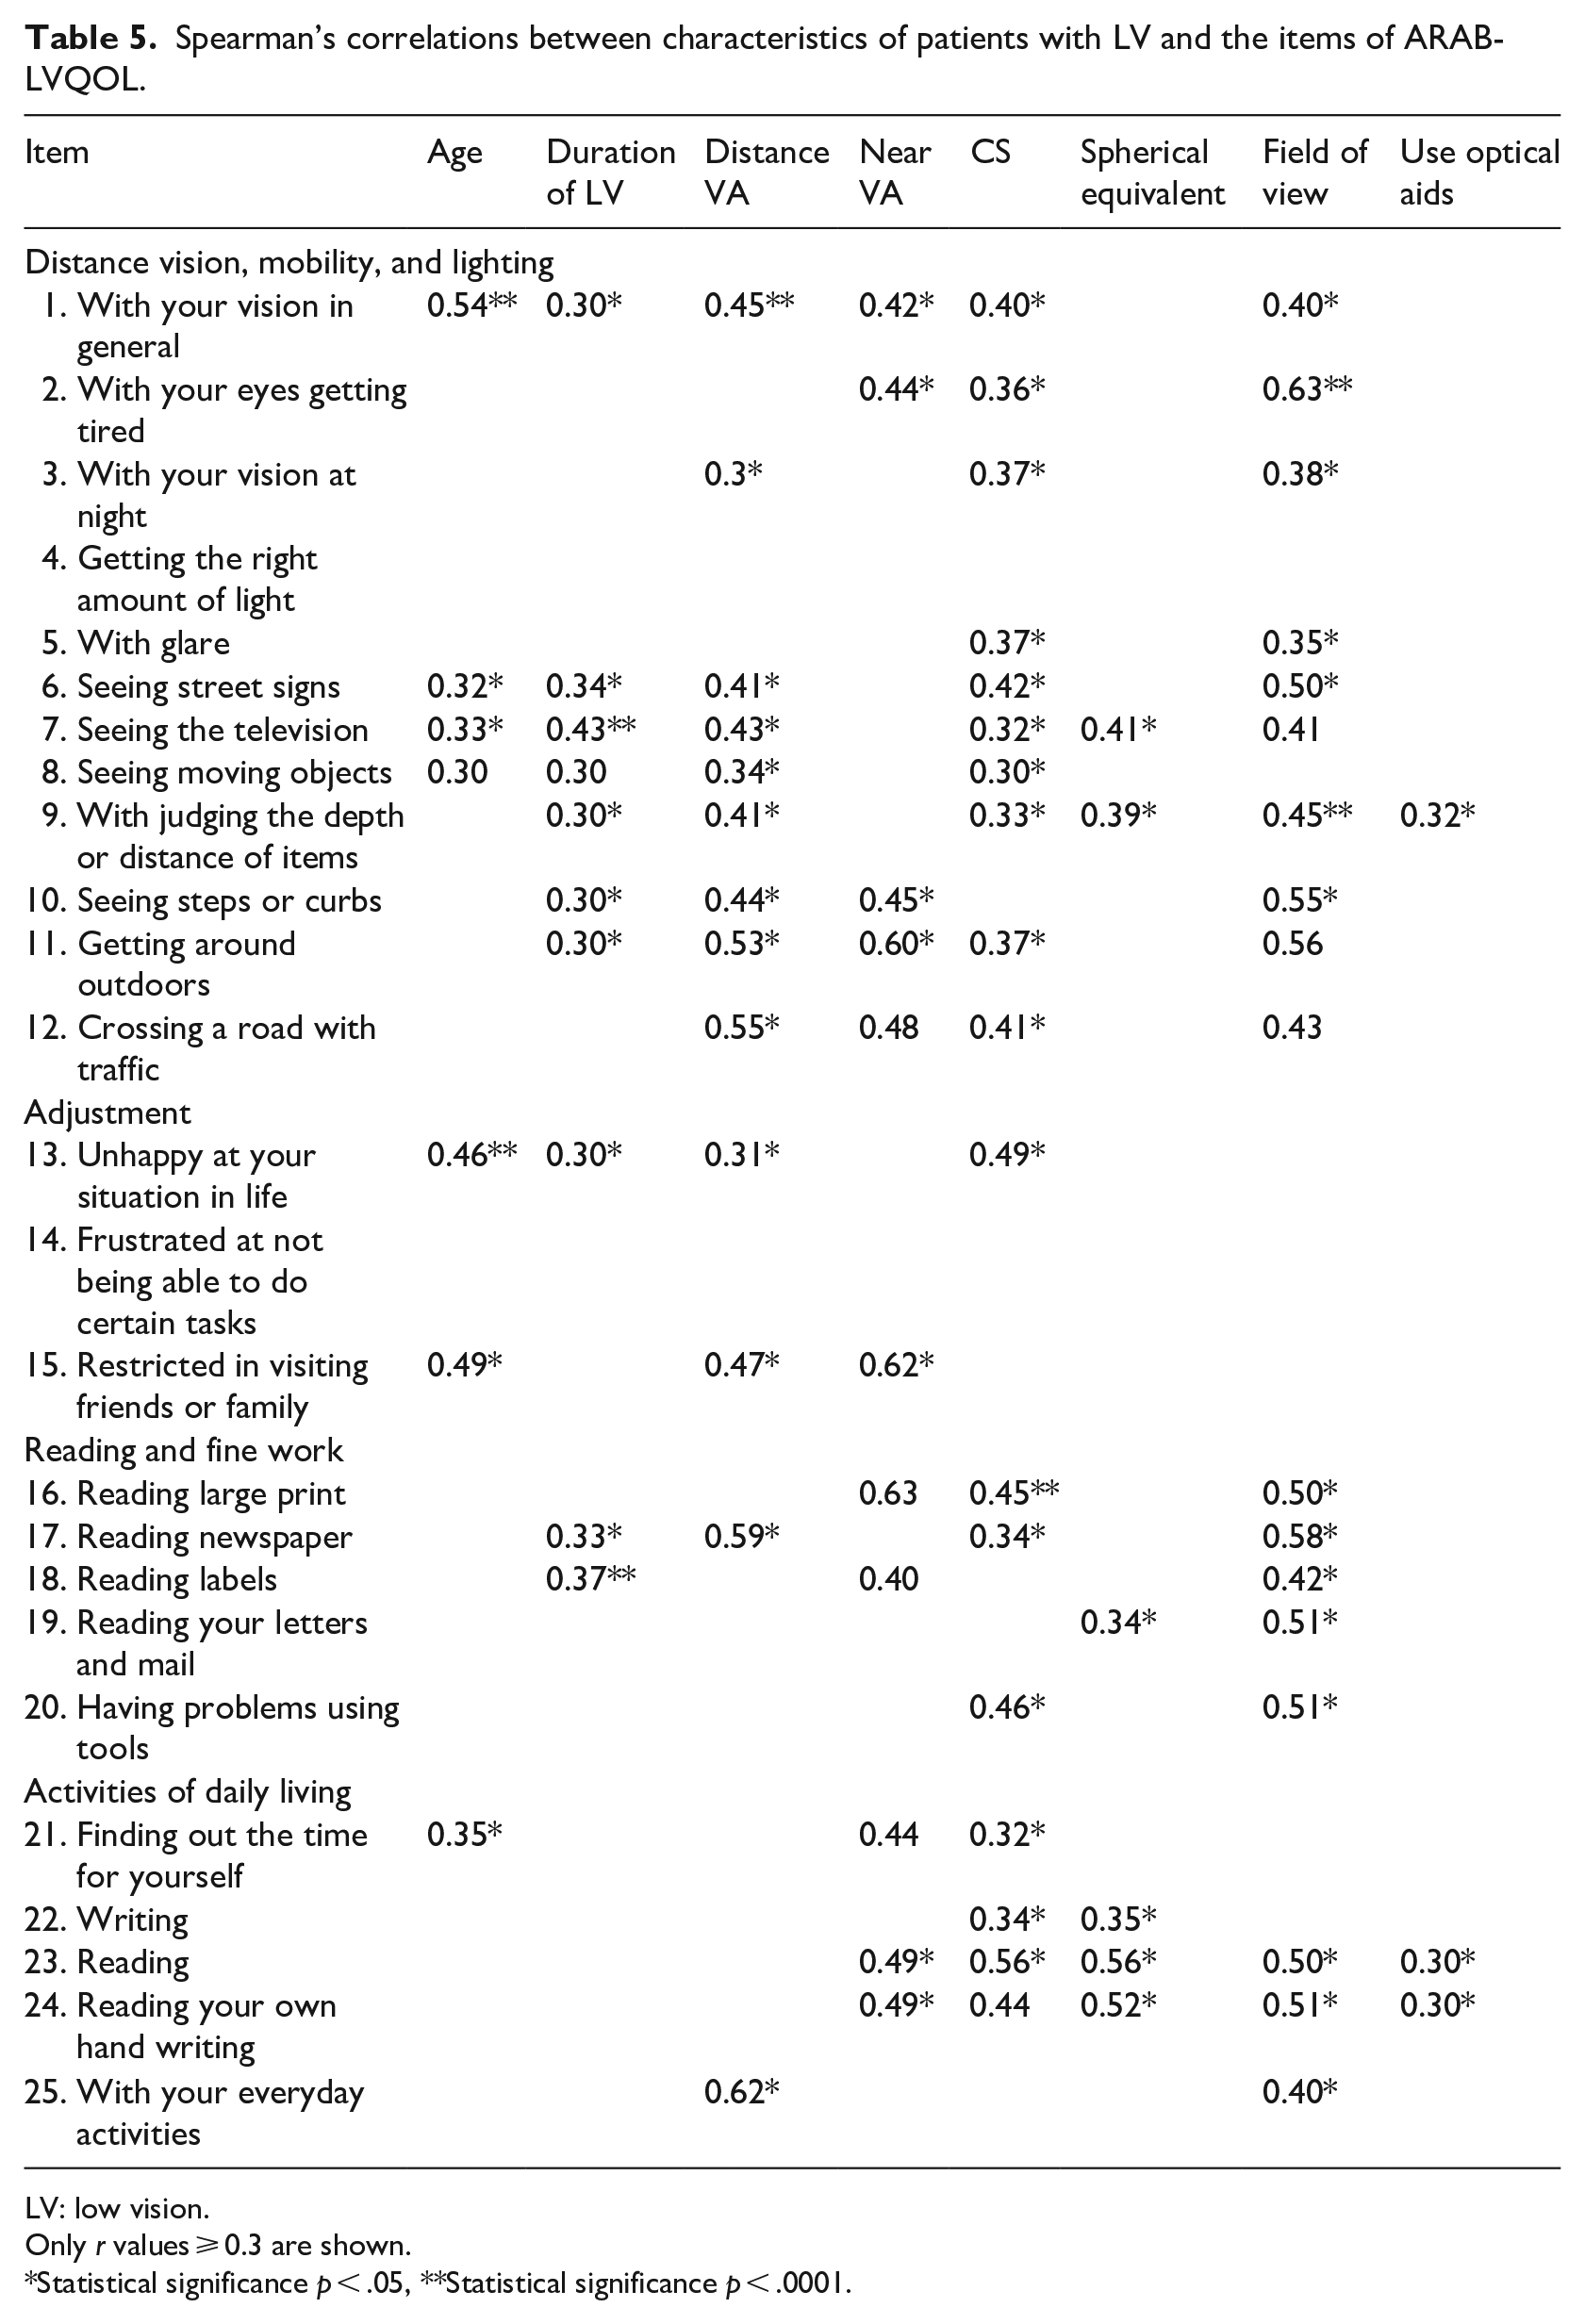
Spearman’s correlations test showed that the visual functions of patients with low vision (visual acuity at distance and near, refractive errors, contrast sensitivity, and visual field) and their backgrounds, excluding the use of optical aids, have a mild to a strong relationship with the items in the ARAB-LVQOL (Table 5), providing further evidence of the ARAB-LVQOL reliability.
Spearman’s correlations between characteristics of patients with LV and the items of ARAB-LVQOL.
LV: low vision.
Only r values ⩾ 0.3 are shown.
Statistical significance p < .05, **Statistical significance p < .0001.
Discussion
The vast majority of LVQOL instruments are written in English. None has been translated into Arabic, and neither has been developed in the Arabic language. This study is an important step in assessing the psychometric properties of the ARAB-LVQOL, to develop a practical instrument that investigates and monitors the rehabilitation needs of adults with low vision.
Cronbach’s α coefficient in ARAB-LVQOL was equal to 0.90. This provided evidence for the questionnaire having adequate reliability for group-level comparisons. In suggesting that the ARAB-LVQOL is homogeneous and tapping different angles of the same attributes, this study also provided evidence of construct validity. That is despite the seven factors extracted from the ARAB-LVQOL are not exactly corresponding to domains in the LVQOL. Every task in ARAB-LVQOL loaded very well under one independent factor and the factors extracted converged into the main four domains of the ARAB-LVQOL. The convergent validity test provided further supportive evidence of the ARAB-LVQOL validity and reliability. The ARAB-LVQOL was found to discriminate between normally sighted and simulated low vision groups. Although it failed to reach a statistical significant level between the groups, with the latter recording a lower score than the former. This may account for the sudden change in normal participants’ visual status, which perhaps generated a sharp decline in their score that, to a certain extent, matched the low vision group. The ARAB-LVQOL was proven to have a good respondent burden, where the questionnaire can be administered within less than 15 min. The relationship observed between the visual characteristics and the ARAB-LVQOL provided an additional source of evidence for the value of this questionnaire. These findings can support the suggestion that ARAB-LVQOL is feasible, reliable, and stable instrument for evaluating the vision-related QOL in population of adults with low vision with an Arabic language background.
Like every other nation, the Arab population holds distinct living habits and cultural context, which might be the reason behind the minor discrepancies between the original LVQOL and current factor structure of the ARAB-LVQOL. This has been also observed in the translated versions of LVQOL into Chinese and Turkish (Idil et al., 2011; Zou et al., 2005). Some items, for example, regarding the glare, were sub-scaled in distance vision, mobility, and lighting domain, despite being more appropriately related to the adjustment domain in Arab populations. Following the factor structure that emerged from this study, especially since it is objective and able to better reflect the Arabic culture, seems to be the superior option, as the ARAB-LVQOL and LVQOL are not culturally equivalent. Therefore, moving item 5 “with glare” and Item 25 “With your everyday activities” to the adjustment domain might better support the ARAB-LVQOL structure than the original Australian LVQOL instrument.
Four previous studies attempted to translate the LVQOL instrument into other languages (Do et al., 2014; Idil et al., 2011; Yingyong, 2007; Zou et al., 2005). The Chinese and Turkish studies translated the LVQOL in a structured method similar to the routine used in the current study. The median low vision scores in the ARAB-LVQOL were similar to those obtained from the Australian low vision population in the original LVQOL (62.50 ± 19 and 60.9 ± 25.1, respectively), but lower than the Chinese, Turkish, and Indian low vision population (84.22 ± 20.53, 75.8 ± 16.7, 79.43 ± 18.37, respectively) (Idil et al., 2011; Wolffsohn & Cochrane, 2000a; Zou et al., 2005). Possible reasons for the discrepancy in results between this study and the aforementioned studies may relate to several factors such as discrepancies in the existing clinical low vision rehabilitation services, cultural differences (some societies are more emotionally conservative than others), self-image, activeness in daily routines (most Saudis live within an extended family that is supporting them in their daily living activity), and, finally, expectation from life and from professionals working with low vision population.
Small sample size is one of the limitation of the current study, mainly due to the response rate we obtained. However, previous recommendations suggested a sample size of at least a ratio of two subjects per item, which has been satisfied in the current study (Hair et al., 1995; Kline, 1979). The variability and heterogeneity of the sample are also two limitations of the current study. To further validate the ARAB-LVQOL a future work will be conducted to use Rasch analysis to score the questionnaire and provides Rasch validation statistics. Rasch analysis is based on a model that align the relative difficulty of items with relative abilities of respondents in a single interval-level scale (Pesudovs et al., 2007). However, the analysis approach used in this study was of great importance to establish the reliability and validity of the translated LVQOL and compare the psychometric properties to those of the English version. Future study can now be conducted using the ARAB-LVQOL to further investigate variables that may impact the patients’ QOL in Arabs population. Factors involving demographic and background information such as income, family structure and siblings, social status, marital status, and work-related information would influence the QOL in patients with low vision.
Conclusion
The original LVQOL was suggested to provide useful clinical information besides visual functions (including visual field, contrast sensitivity and visual acuity) and describe the current visual performance (Wolffsohn & Cochrane, 2000a). In addition, the obtained information can be valuable in evaluating the outcome of low vision rehabilitation and identifying those individuals where training sessions, service planning, or re-evaluation may be needed to improve QOL (Wolffsohn & Cochrane, 2000a). Specifically, ARB-LVQOL reliability was investigated to identify and monitor the QOL of participants with low vision. Following the translation and piloting phase, ARB-LVQOL satisfied most psychometric measures, differentiated people with healthy vision from those with low vision, covered wide-ranging characteristics of measuring the QOL with low vision, and might be central in screening the Arabic local society and implanting it in research or clinical setting. It can be also used in supporting optometrists in advancing (1) the understanding of low vision in local community and (2) the vision service quality. Based on that, the ARB-LVQOL shall apply across the Arabs adult population.
Footnotes
Declaration of conflicting interests
The author(s) declared no potential conflicts of interest with respect to the research, authorship, and/or publication of this article.
Funding
The author(s) disclosed receipt of the following financial support for the research, authorship, and/or publication of this article: The authors extend their appreciation to the College of Applied Medical Sciences Research Center and the Deanship of Scientific Research at King Saud University for funding this research.
