



Abstract
Romantic relationships among emerging adults (individuals aged 18–25 years) are typically homogenously classified both theoretically and empirically as “exploratory” and “unstable.” With a sample of college students (N = 340), we examined within-group variation among romantic relationships in emerging adulthood using latent class analyses. Four predictor variables indicated four types of romantic relationships among emerging adult college students: the committers (38%), the casual daters (23%), the settlers (30%), and the volatile daters (8%). Classes varied according to background variables such as gender and infidelity. Additionally, there was class variation for outcome variables such as breakup status and loneliness. Future research and implications are discussed.
Much attention has been given to romantic relationships during different developmental time periods, including adolescence (e.g., Furman & Shaffer, 2003) and emerging adulthood (e.g., Fincham & Cui, 2011). Romantic relationships among emerging adults (aged 18–25) are typically homogenously classified both theoretically and empirically as “exploratory” or “unstable” (Arnett, 2014; Bogle, 2008; Stanley, Rhoades, & Fincham, 2011). However, few studies have examined within-group differences among emerging adults’ romantic relationships to determine whether these descriptors are universal or whether they characterize only subgroups of couples (for an exception, see Amato, 2011). Guided by theory on emerging adulthood (Arnett, 2000, 2001), the purpose of the present study is to develop a typology for romantic relationships during this developmental period. Specifically, we explored the extent to which previously articulated characteristics of emerging adult romantic relationships (Arnett, 2014; Bogle, 2007; Stanley et al., 2011) vary within this population. Further, because relationship typologies provide greater rigor when predicting relationship outcomes (Fowers, 1990; Fowers & Olson, 1986; Heaton & Albrecht, 1991; Johnson, White, Edwards, & Booth, 1986; Larsen & Olson, 1989; Markman & Hahlweg, 1993), we also examined how emerging adult relationship typologies vary on measures of well-being associated with emerging adulthood (e.g., depression, college adjustment), background variables (e.g., gender, infidelity), and relationship outcomes (e.g., relationship dissolution, loneliness) using latent profile analysis (LPA), χ2 analyses, and analyses of variance (ANOVAs).
Emerging adulthood
Emerging adulthood (Arnett, 2000) is a developmental period between adolescence and adulthood associated with industrialized societies. Similar to adolescence, emerging adulthood is proposed to be culturally constructed and is not considered a universal stage. This time period is portrayed as one of self-exploration, contemplation about future opportunities, and continued identity development in the domains of love, work, and worldviews (Arnett, 2000). Emerging adults’ paths to long-term committed romantic relationships are not as clear or structured compared to those in previous decades (Stanley et al., 2011). Individuals often oscillate between choices in love and work, thereby prolonging the onset of more traditional markers of adulthood (i.e., marriage, parenthood), which often leads emerging adults to feel “in between” the stages of adolescence and adulthood (Arnett, 2000).
Romantic experiences
One of the defining features of emerging adulthood is identity exploration, which involves exploring a variety of relationship contexts, both committed and casual (Arnett, 2014; Shulman & Connolly, 2013). Some scholars conclude that emerging adults form romantic relationships based on both physical and sexual attraction to potential romantic partners (Arnett, 2014; MacCallum, Roznowski, Mar, & Reith, 1994). Fincham (2012) commented that emerging adults use sexual intercourse as an initiator of romantic relationships rather than an indication of solidified commitment. However, engaging in sexually intimate behaviors is common for emerging adults in committed relationships, and these behaviors are based on perceptions of mutual love within the relationship (Kaestle & Halpern, 2007).
Emerging adults have limited experience both in the formation and maintenance of committed relationships (Maner & Miller, 2011). Such lack of experience may be one reason that emerging adult romantic relationships lack stability (Arnett, 2014; see also Shulman & Connolly, 2013). The short duration of emerging adult relationships in conjunction with exploring the relational aspect of one’s identity leads to what Regnerus and Uecker (2011) refer to as serial monogamy. Although much attention is devoted to college students’ casual sex relationships, serial monogamy is the most common sexual script among emerging adults, wherein romantic relationships form and include sexual intimacy but end thereafter, in which case the cycle repeats itself. In addition to serial monogamy, a number of emerging adults experience repeated breakups and reconciliations with the same romantic partner (i.e., cyclical relationships; Vennum & Fincham, 2011). Moreover, 65–75% of college students report experiencing infidelity in their romantic relationships commonly experience infidelity in their romantic relationships (Muthén & Muthén, 2000; Nylund, Asparouhov, & Muthén, 2007), which is also a commonly cited reason for relationship dissolution among young adults (Crockett & Randall, 2006).
In summary, these findings suggest that emerging adult relationships are highly sexual and marked with ambiguity and instability. Importantly, however, some scholars have refuted this assertion by arguing that emerging adults may be better at relationships than they are given credit. For example, although many believe that emerging adults tend to “slide” into cohabitation without considering the consequences (Stanley, Rhoades, & Markman, 2006), some research suggest otherwise. Specifically, emerging adults who were in committed relationships but also had doubts about the long-term future of those relationships spent the night with their partners on a regular basis, but chose not to cohabit. Moreover, the majority stated that they would only cohabit if they were fairly certain they would also marry their cohabiting partner (Jamison, Ganong, & Proulx, 2013). Additionally, in contrast to the assertion that emerging adults are primarily motivated by sex as they pursue casual sexual experiences (Claxton & van Dulmen, 2013; Garcia, Reiber, Massey, & Merriwether, 2012) and friends with benefits relationships (Bisson & Levine, 2009; Furman & Shaffer, 2010; Owen & Fincham, 2011), Jamison, Ganong, and Proulx (2013) found that many emerging adults are motivated to spend the night with their partners to spend quality time with them. These findings suggest that emerging adults may also value the importance of building quality romantic relationships more than scholars and the media give them credit.
Relationship typology
Rather than looking at emerging adult relationships in the aggregate, it is important to examine within-group variation to establish a more comprehensive understanding of romantic relationships during this developmental stage. One way to examine the within-group differences involves examining typologies of these romantic relationships. Several typologies have been developed for both marital and premarital (i.e., engaged couples) relationships that differentiate romantic relationships within these categories. For example, premarital taxonomies include four premarital types: (a) vitalized, (b) harmonious, (c) traditional, and (d) conflicted (Olson & Fowers, 1993). Vitalized couples reported high satisfaction with different aspects of their relationship, high belief in their ability to discuss feelings and resolve problems, high agreement on financial and future parenting matters, importance of religion, and a preference for egalitarian role patterns. Harmonious couples reported moderate satisfaction with all aspect of their relationship but were unrealistic about their view of marriage, did not agree about parenting matters, and indicated that religion was not important in their relationship. Traditional couples reported moderate dissatisfaction with partner’s behaviors and interactions in the relationship, had problems discussing feelings and resolving problems, and were least likely to cohabit. Finally, conflicted couples were most distressed on all scales including dissatisfaction with partner’s habits and personality, difficulty discussing feelings and solving problems, and difficulties with one another’s family and friends (Olson & Fowers, 1993). Furthermore, these relationship typologies were each found to predict later relationship quality (Fowers, Montel, & Olson, 1996): Conflicted couples reported the highest rates of separation/divorce and canceled marriage; traditional couples reported highest on marital dissatisfaction; and vitalized couples were highest on marital satisfaction. Interestingly, the Harmonious couples were rated moderately on all four follow-up measures. These findings suggest that romantic relationships are multidimensional and should be treated as such. Moving forward, we discuss why romantic relationships in emerging adulthood should also be viewed as multidimensional.
Conceptualizing an emerging adult relationship typology
When conceptualizing relationship typologies among emerging adult relationships, not all variables used in the premarital and marital typology studies are relevant (e.g., finances, child rearing). However, important variables are gleaned from previous typology, as well as both theoretical and empirical literature on emerging adults that may differentiate emerging adult relationships. Thus, we draw on both empirical findings from relationship research as well as theory on emerging adult experiences and romantic relationships (Arnett, 2014) to determine variables that might contribute to an emerging adult relationship typology.
First, based on previous relationship research, relationship variables such as interpersonal patterns and relationship satisfaction appear to be important when determining couple differences (Fowers & Olson, 1992; Lavee & Olson, 1993; Synder & Smith, 1986), such as conflict management and relationship satisfaction. Second, beliefs and attitudes about relationships and marriage appear to differentiate relationship types (Fowers & Olson, 1992; Lavee & Olson, 1993; Synder & Smith, 1986), such as relationship sanctity. Third, social influences outside of the relationship seem to differ among couple types (Fowers & Olson, 1992; Lavee & Olson, 1993; Synder & Smith, 1986). Because alcohol use is prevalent and problematic on college campuses (Hingson, Zha, & Weitzman, 2009; Wechsler et al., 2002) and can negatively affect romantic relationship interaction among college students (Claxton & van Dulmen, 2013; Hingson et al., 2009; Shorey, Stuart, & Cornelius, 2011), we consider alcohol use as an important contextual factor when studying college students. We also consider variables theoretically connected to emerging adult romantic relationships (Arnett, 2000). According to conceptual and empirical work on emerging adults, romantic relationships in this group are thought to suffer from ambiguity and volatility (i.e., frequent breakup). Therefore, we include specific variables to capture differences in this aspect of emerging adults’ romantic relationships: ambiguity and relationship future.
Current study
Much of the developmental literature has examined the ways romantic relationships in emerging adulthood differ from those in other developmental stages. However, little attention has been given to within-group variation among emerging adults in romantic relationships. In an effort to begin to fill this gap, we use LPA to assess different types of emerging adult relationships. We use six variables to assess the number of classes, and their choice was informed by theory on emerging adulthood (Arnett, 2000) and the relationship typology literature (e.g., Fowers & Olson, 1992; Lavee & Olson, 1993; Synder & Smith, 1986). Given that research has yet to investigate relationship typologies among romantic relationships that occur in the unique developmental stage of emerging adulthood, our analyses were primarily exploratory and were guided by three research questions:
Method
Participants
Participants were undergraduate students enrolled in a family development course at a large Southeastern university in the U.S. This class meets university liberal studies requirements in the social sciences, so students potentially represent all colleges and majors on campus. Data were collected at three different time points within the semester (T1 = week 1, T2 = week 8, T3 = week 15). We limited our sample to emerging adults (aged 18–25) who reported being in an opposite-sex dating relationship (nonexclusive and exclusive) at the first wave of the study (N = 653). The present sample included less than 1% of same-sex relationships. As a result, we excluded them from the present study because this portion of the sample would not be large enough to statistically detect differences or indicate similarities between same-sex and opposite-sex relationships. Therefore, rather than making errant conclusions, we chose to remove this group from our analyses.
To ensure sample power for study analyses (LPA), we increased our sample size using data collected during two different semesters: Fall 2010 (n = 374) and Spring 2010 (n = 279). Because the sample consisted of a disproportionate percentage of men (19.4%), we conducted random purposive sampling so that the proportion of men and women in our sample reflected their proportion in the college population (Borzelleca, 2012). The final sample (N = 341) consisted of 43% men (n = 147) and 57% women (n = 194).
Participants provided demographic information at T1. Participants were on average 19.3 years old (SD = 1.39) and most were 18 (n = 112) or 19 (n = 110) years old. Most participants self-identified as White (72.1%), followed by African American (10.3%), Latino/a (10.3%), Asian American (4.7%), and 4.7% reported as other. In terms of year in school, 37.2% reported being freshmen, followed by sophomores (31.4%), juniors (20.2%), and seniors (10.6%). A majority (83.9%) reported dating exclusively, followed by dating nonexclusively (14.4%) with an average relationship length of 11.4 months (SD = 10.9, range = 1–59 months). We included individuals who reported dating nonexclusively because romantic relationships during emerging adulthood are generally characterized as ambiguous (Arnett, 2014) and the inclusion of both exclusive and nonexclusive romantic relationships might be indicative of such ambiguity.
Procedure
Data for this study are from a larger project on emerging adults and their romantic relationship experiences. The project was approved by the university institutional review board. During the first week of their respective semesters, participants completed informed consent. Those who chose to participate completed a restricted access online survey at three different time points during the semester (T1 = week 1, T2 = week 8, T3 = week 15). The survey was completed in a location and time that was convenient to participants. Those who completed the survey received partial course credit, whereas those who chose to not participate completed an alternative written assignment for the same amount of course credit.
Measures
Measures are from multiple waves of the study. All LPA predictors and background variables are from T1 and the outcome variables are from T3. The means, standard deviations, ranges, and coefficient αs (when applicable) are given in Table 1.
Means (standard deviations), range, number of items, and coefficient αs for measurements.
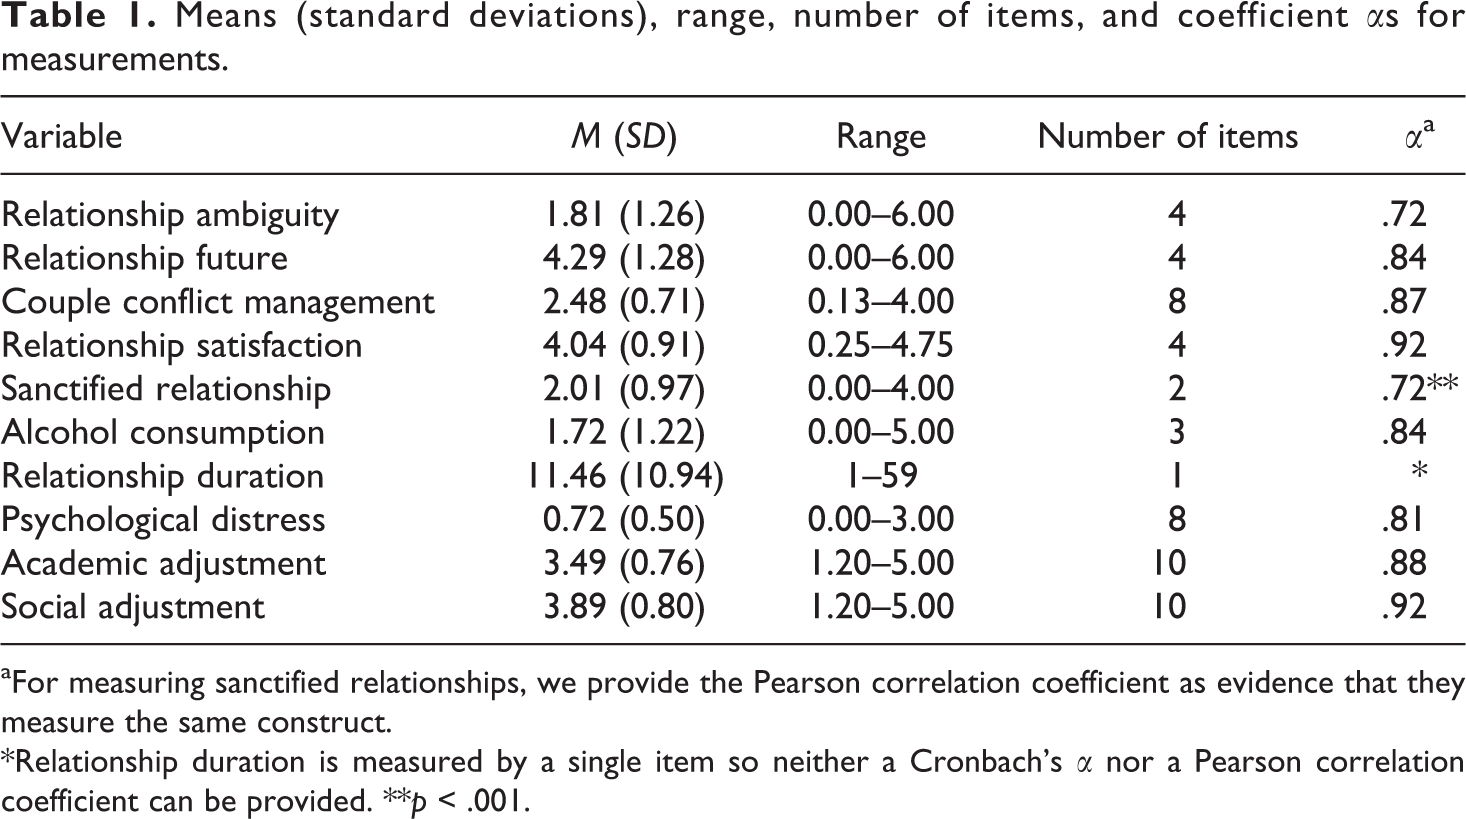
aFor measuring sanctified relationships, we provide the Pearson correlation coefficient as evidence that they measure the same construct.
*Relationship duration is measured by a single item so neither a Cronbach’s α nor a Pearson correlation coefficient can be provided. **p < .001.
Latent class predictors
Relationship ambiguity
A relationship ambiguity scale was developed based on the sliding versus deciding literature (Stanley et al., 2011) to assess participants’ desire for ambiguity in the relationship. The scale consisted of 4 items (e.g., “I prefer not to talk about, and clarify, commitment in a romantic relationship”) and responses ranged from (0) strongly disagree to (6) strongly agree. Items were averaged so that higher scores indicated greater desire for relationship ambiguity.
Relationship future
A relationship future scale was developed based on the sliding versus deciding literature (Stanley et al., 2011) to assess participants’ desire for a clear future for their relationship. The scale consisted of 4 items (e.g., “I try to avoid having ‘the talk’ [DTR, ‘define the relationship’] with my partner”) and responses ranged from (0) strongly disagree to (6) strongly agree. Items were recoded and averaged so that higher scores indicated greater desire for clarifying the relationship future.
Couple conflict management
Conflict management was measured at T1 using a subscale of the Interpersonal Competence Questionnaire (Buhrmester, Furman, Wittenberg, & Reis, 1988). The subscale is comprised of 8 items (e.g., “Being able to admit that you might be wrong when a disagreement with a close companion begins to build into a serious fight”) and responses ranged from (0) I’m poor at this; I’d feel so uncomfortable and unable to handle this situation, I’d avoid it if possible to (4) I’m extremely good at this; I’d feel very comfortable and could handle this situation very well. Items were recoded and averaged so that higher scores indicated more constructive conflict management.
Relationship satisfaction
Relationship satisfaction was measured at T2 using the Couple Satisfaction Index (Funk & Rogge, 2007). The scale consisted of 4 items; 3 of the items (e.g., “I have a warm and wonderful relationship with my partner”) had responses that ranged from (0) not at all to (5) completely and 1 item (please indicate the degree of happiness, all things considered, of your relationship) with responses that ranged from (0) extremely unhappy to (6) perfect; this item was rescaled to range from 0 to 5 to be consistent with the other items in the scale. Items were averaged and higher scores indicated greater relationship satisfaction.
Perception of a sanctified relationship
To assess the perception of a sanctified relationship, we used 2 items recommended by Mahoney (personal communication, October 21, 2005; “My relationship with my partner is holy and sacred,” and “I sense God’s presence in my relationship with my partner”) that were based on a previous study (Mahoney et al., 1999). Responses ranged from (0) strongly agree to (4) strongly disagree. Items were averaged and higher scores indicated higher perceived relationship sanctification.
Alcohol consumption
At T1, participants indicated their alcohol use by responding to 3 items. The first item asked, “Within the past 30 days, on how many days did you have a drink containing alcohol?” Participants responded on a Likert-type scale ranging from (0) never drank to (6) 20–29 days; this item was recoded so that it ranged from 0 to 5. The second item asked, “How many drinks containing alcohol did you have on a typical day when you were drinking?” Responses ranged from (0) never drank to (5) 10 or more. The third item asked, “How often in the last 30 days did you have five or more drinks on one occasion?” Responses ranged from (0) never happened to (8) more than 10 times; this item was recoded so that it ranged from 0 to 5. Items were averaged and higher scores indicated greater alcohol consumption. These items have been used in previous studies on hooking up (Saunders, Aasland, Babor, De La Fuente, & Grant, 1993).
Background variables
Gender
Participants were asked at T1 to report their gender: (0) men and (1) women.
Relationship type
To report the relationship type, at T1, participants responded to a single question (“Which statement best describes your relationship?”). After removing individuals who reported being engaged or married, respondents were coded as (0) dating exclusively and (1) dating nonexclusively.
Infidelity
Participants reported the presence of physical infidelity in their current relationship during the past 2 months by responding to 3 items at T1: (a) “Have you done anything that you consider to be physically unfaithful?” (b) “Have you done anything that your partner would consider to be physically unfaithful?” and (c) “Has your partner done anything that you consider to be physically unfaithful?” Responses were dichotomous (yes and no). All 3 items were recoded into a single dichotomous variable: (0) No, neither myself nor my partner engaged in physical infidelity during the past two months and (1) Yes, either myself or my partner engaged in physical infidelity during the past two months.
Relationship duration
Participants reported their relationship duration at T1 by responding to the question: “How long have you been in this romantic relationship?” Participants responded to a matrix-type question structure where they noted length of their relationship in years and months. Based on their responses, we computed their relationship duration in months.
Religious service attendance
Religious service attendance was measured at T1 by a single item, “How often do you attend religious services?” with possible responses being (1) never, or almost never, (2) occasionally, but less than once per month, (3) one to three times per month, and (4) one or more times per week.
Cohabitation status
To measure cohabitation status, at T1, participants responded to the stem question, “My partner and I are:” responses were (0) living separately and (1) living together.
Family structure
Family structure was measured at T1 by a single categorical variable where participants could respond (0) My parents are married and living together, (1) My parents separated or divorced, (2) One of my parents is deceased, (3) My parents never married, (4) Other. Responses were recoded into a dichotomous variable: (0) My parents are married and living together and (1) All other family structures.
Outcome variables
Relationship breakup
Participants reported their breakup status by responding to a question at T2 (“Have you ended a romantic relationship since you completed the last survey [at the beginning of the semester]?”) and T3 (“Have you ended a romantic relationship since you completed the last survey [at mid semester]?”). The dichotomous responses (yes or no) were recoded into a single dichotomous variable: (0) Did not end a romantic relationship during the semester and (1) Ended a romantic relationship during the semester.
Loneliness
Loneliness was measured at T3 using the 8-item University of California Los Angeles (UCLA) Loneliness Scale (Russell, 1996). Participants reported how often they felt a variety of feelings (e.g., “There is no one I can turn to”). Responses ranged from (0) never to (3) often. Items were coded and averaged so that higher scores indicated greater feelings of loneliness.
Psychological distress
Psychological distress was measured at T3 using the Center for Epidemiological Studies–Depression Scale (CES-D; Radloff, 1977). The CES-D included 10 items that ranged from (0) rarely to (3) most or all of the time. Items were coded and averaged so higher scores indicated greater psychological distress.
College adjustment
Two constructs of college adjustment were measured at T3 using the Student Adaptation to College Questionnaire (Baker & Siryk, 1986): social adjustment and academic adjustment. Social adjustment was measured using 10 items (e.g., “I feel that I have enough social skills to get along well in the college setting”) and academic adjustment was measured using 10 items (e.g., “I am enjoying my academic work in college”). All item responses ranged from (0) Doesn’t apply to me at all to (4) Applies very closely to me. Items were coded and averaged within each construct so that higher scores indicated greater social adjustment and academic adjustment.
Results
Analytic strategy
We first sought to examine how our sample of emerging adults could be categorized into relationship classes. To address this research question, we used LPA in Mplus (Muthen & Muthen, 1998–2011) using maximum likelihood estimation and cross-validation methods (Cudeck & Browne, 1983; MacCallum et al., 1994). First, we randomly split the final sample into two halves. Using the first half, we determined the number of classes through goodness-of-fit measures such as Akaike information criteria (AIC), Bayesian information criteria (BIC), and entropy (Muthén & Muthén, 2000) and the usefulness/interpretability of the classes (Muthén & Muthén, 2000). We also utilized the parametric bootstrapped likelihood ratio test (PB-LRT), a statistical test to determine the number of classes. For this test, a nonsignificant p value (p > .05) indicates that the model with one fewer classes is the preferred model (Muthén & Muthén, 2000; Nylund et al., 2007). Unpublished evidence suggests the PB-LRT is more reliable (Nylund et al., 2007) than other statistical tests (e.g., Vuong-Lo-Mendell-Rubin likelihood ratio test), and we rely on the results of this analysis to determine class number. Using the second half of the data, we constrained the means and variances to ensure that the original class determination fit with the second half of the sample data using likelihood ratio statistics (Cudeck & Brown, 1983; MacCallum et al., 1994).
After the classes were determined using this method, we ran the entire combined sample with the number of classes specified. Then, extracting the class assignment for each individual, we assessed differences among the determined classes in Statistical Package for the Social Sciences (SPSS) using ANOVA and Pearson’s χ2 analyses to answer our remaining research questions. If ANOVA tests indicate differences among the groups, we follow with a multiple comparison Bonferroni post hoc test (in SPSS, the Bonferroni correction adjusts the p value instead of necessitating an adjusted α criterion).
Latent profile analysis
To assess the different classes through LPA, we used six predictor variables: relationship ambiguity, relationship future, couple conflict management, relationship satisfaction, perception of sanctified relationship, and alcohol consumption. First, we examined bivariate associations among the class predictor variables and the continuous demographic and outcome variables (Table 2). Next, the data were randomly divided into two halves, and we assessed the number of classes with the first half of the data using the aforementioned methods. Six variables acted as indicators for the LPA. Results of the goodness-of-fit and statistical indicators (Table 3; Muthén & Muthén, 2000) did not reach a clear consensus. In fact, when examining the AIC, BIC (i.e., which cluster number had the lowest score), and entropy scores (i.e., which cluster number had the highest), three or four clusters were denoted. To determine which number of clusters was a better fit, we examine the statistical significance values and the PB-LRT. Using the PB-LRT as the indicator, we concluded that the four-cluster solution indicated a better fit to the data. Further, when comparing the three and four cluster models, the four-cluster model presented a better distribution of clusters (i.e., a more even distribution of individuals across classes) and clear differences between the classes. Thus, the four-cluster model appeared to be more useful and interpretable compared to the three-class model (Muthén & Muthén, 2000).
Correlations among continuous latent class predictor variables and outcome variables.
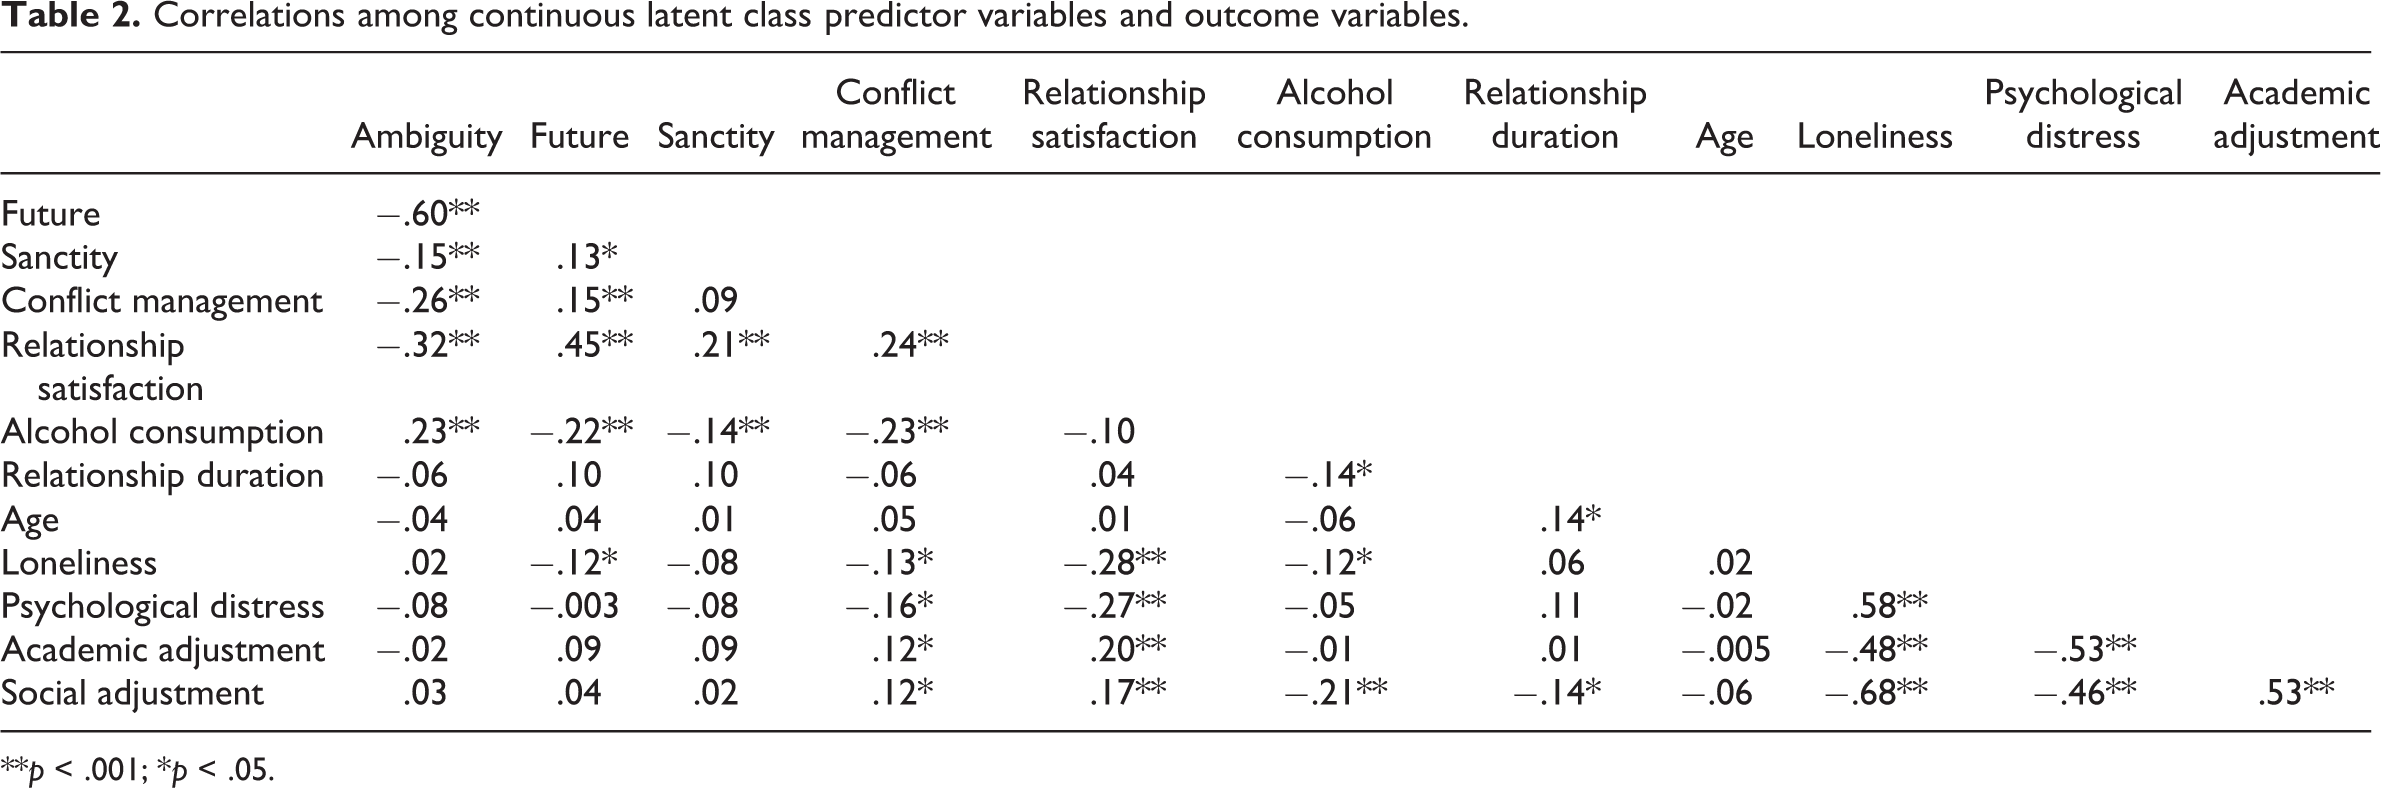
**p < .001; *p < .05.
Goodness-of-fit and statistical class indicators for Classes 1–6 for the first half of the data.
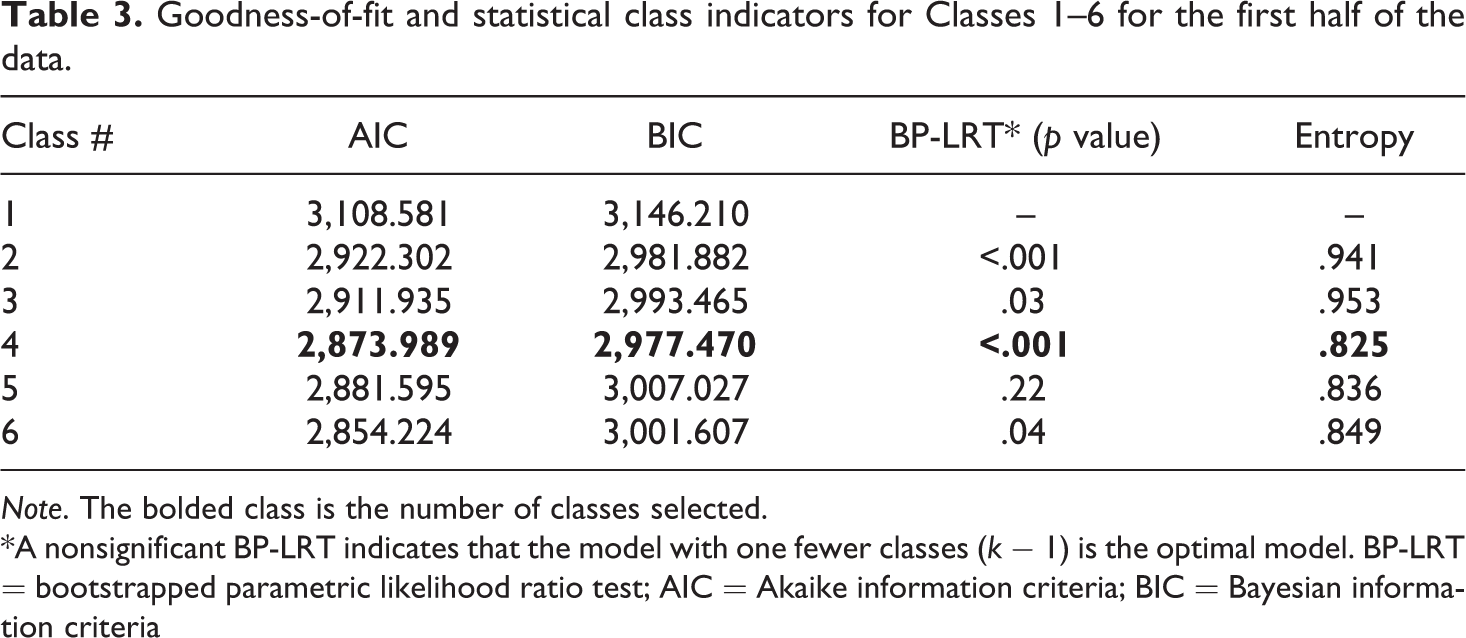
Note. The bolded class is the number of classes selected.
*A nonsignificant BP-LRT indicates that the model with one fewer classes (k − 1) is the optimal model. BP-LRT = bootstrapped parametric likelihood ratio test; AIC = Akaike information criteria; BIC = Bayesian information criteria
To cross-verify these findings (Cudeck & Brown, 1983; MacCallum et al., 1994), we constrained the second half of the data by the means and variances provided from the first half of the data for the four-cluster model. Because we only fixed some of the parameters (e.g., not proportion of individuals in each class), this method is referred to as partial cross-validation and not tight cross-validation (MacCallum et al., 1994). Because of the constraints placed on the replication model, the convergence of the three-class and five-class model could not be replicated; therefore, we examined the entropy score of the four-class model. Entropy of the four-class model (.788) indicated adequate model fit.
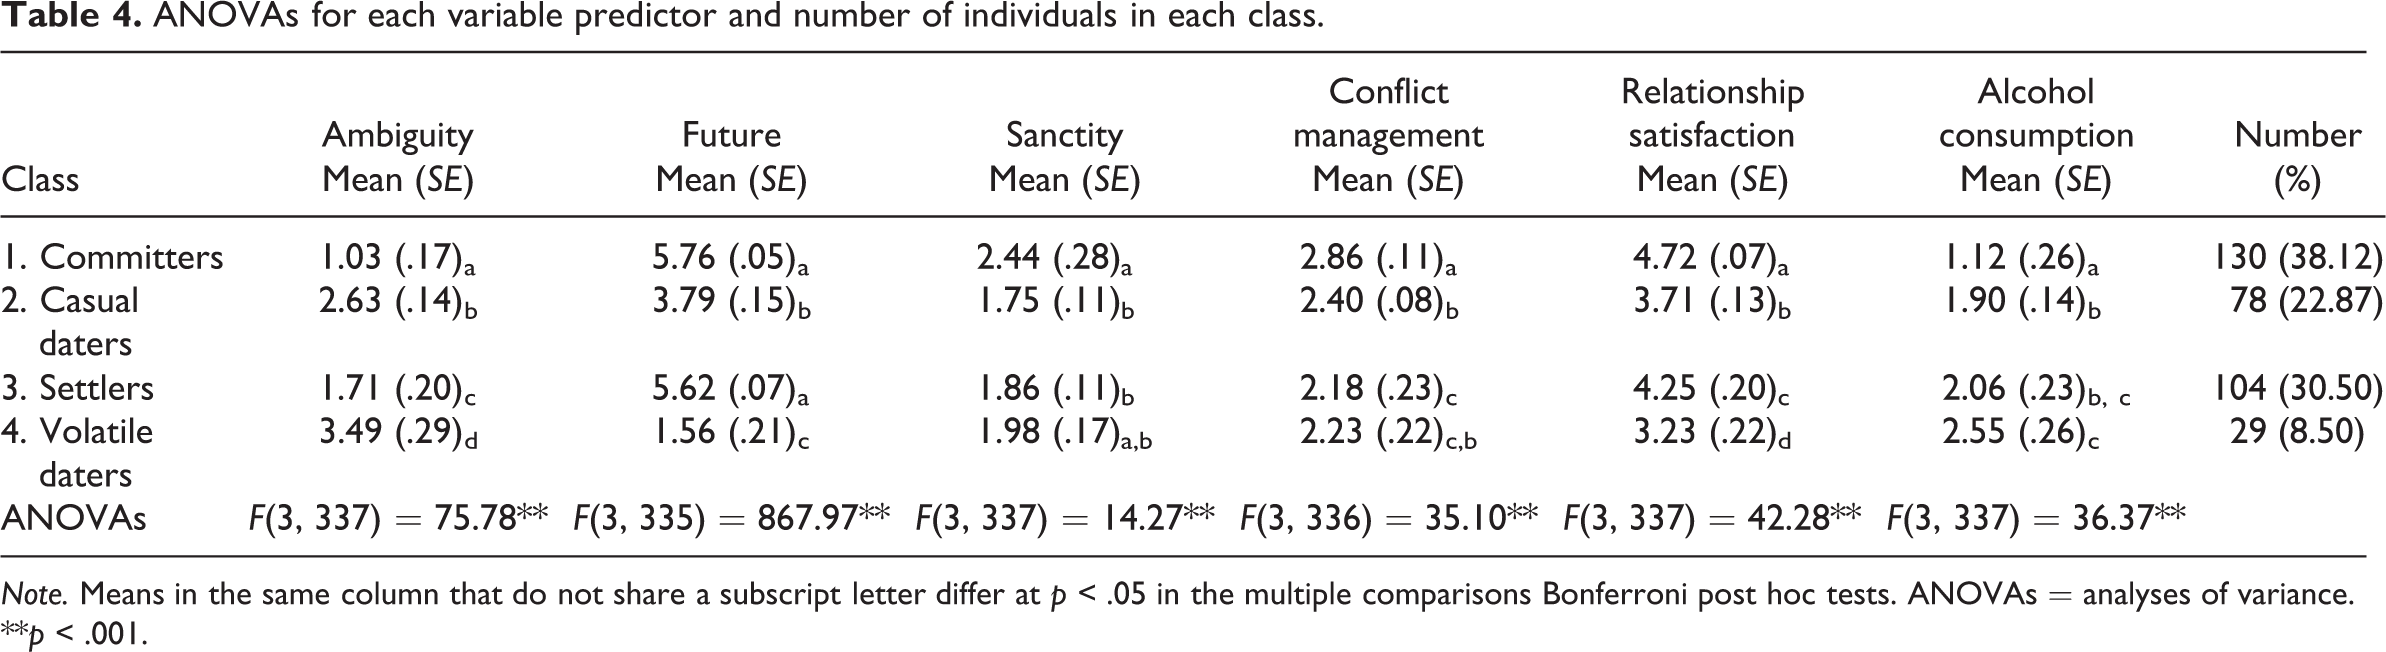
After concluding that the four-class model represented the data best given the six indicator variables, we ran a four-class model with the entire sample to determine means of each indicator variable across groups. Figure 1 shows each group’s mean differences on the six indicator variables. Table 4 shows the means, standard errors, number of individuals categorized in the class, and statistical mean differences across groups for each of the six indicator variables.
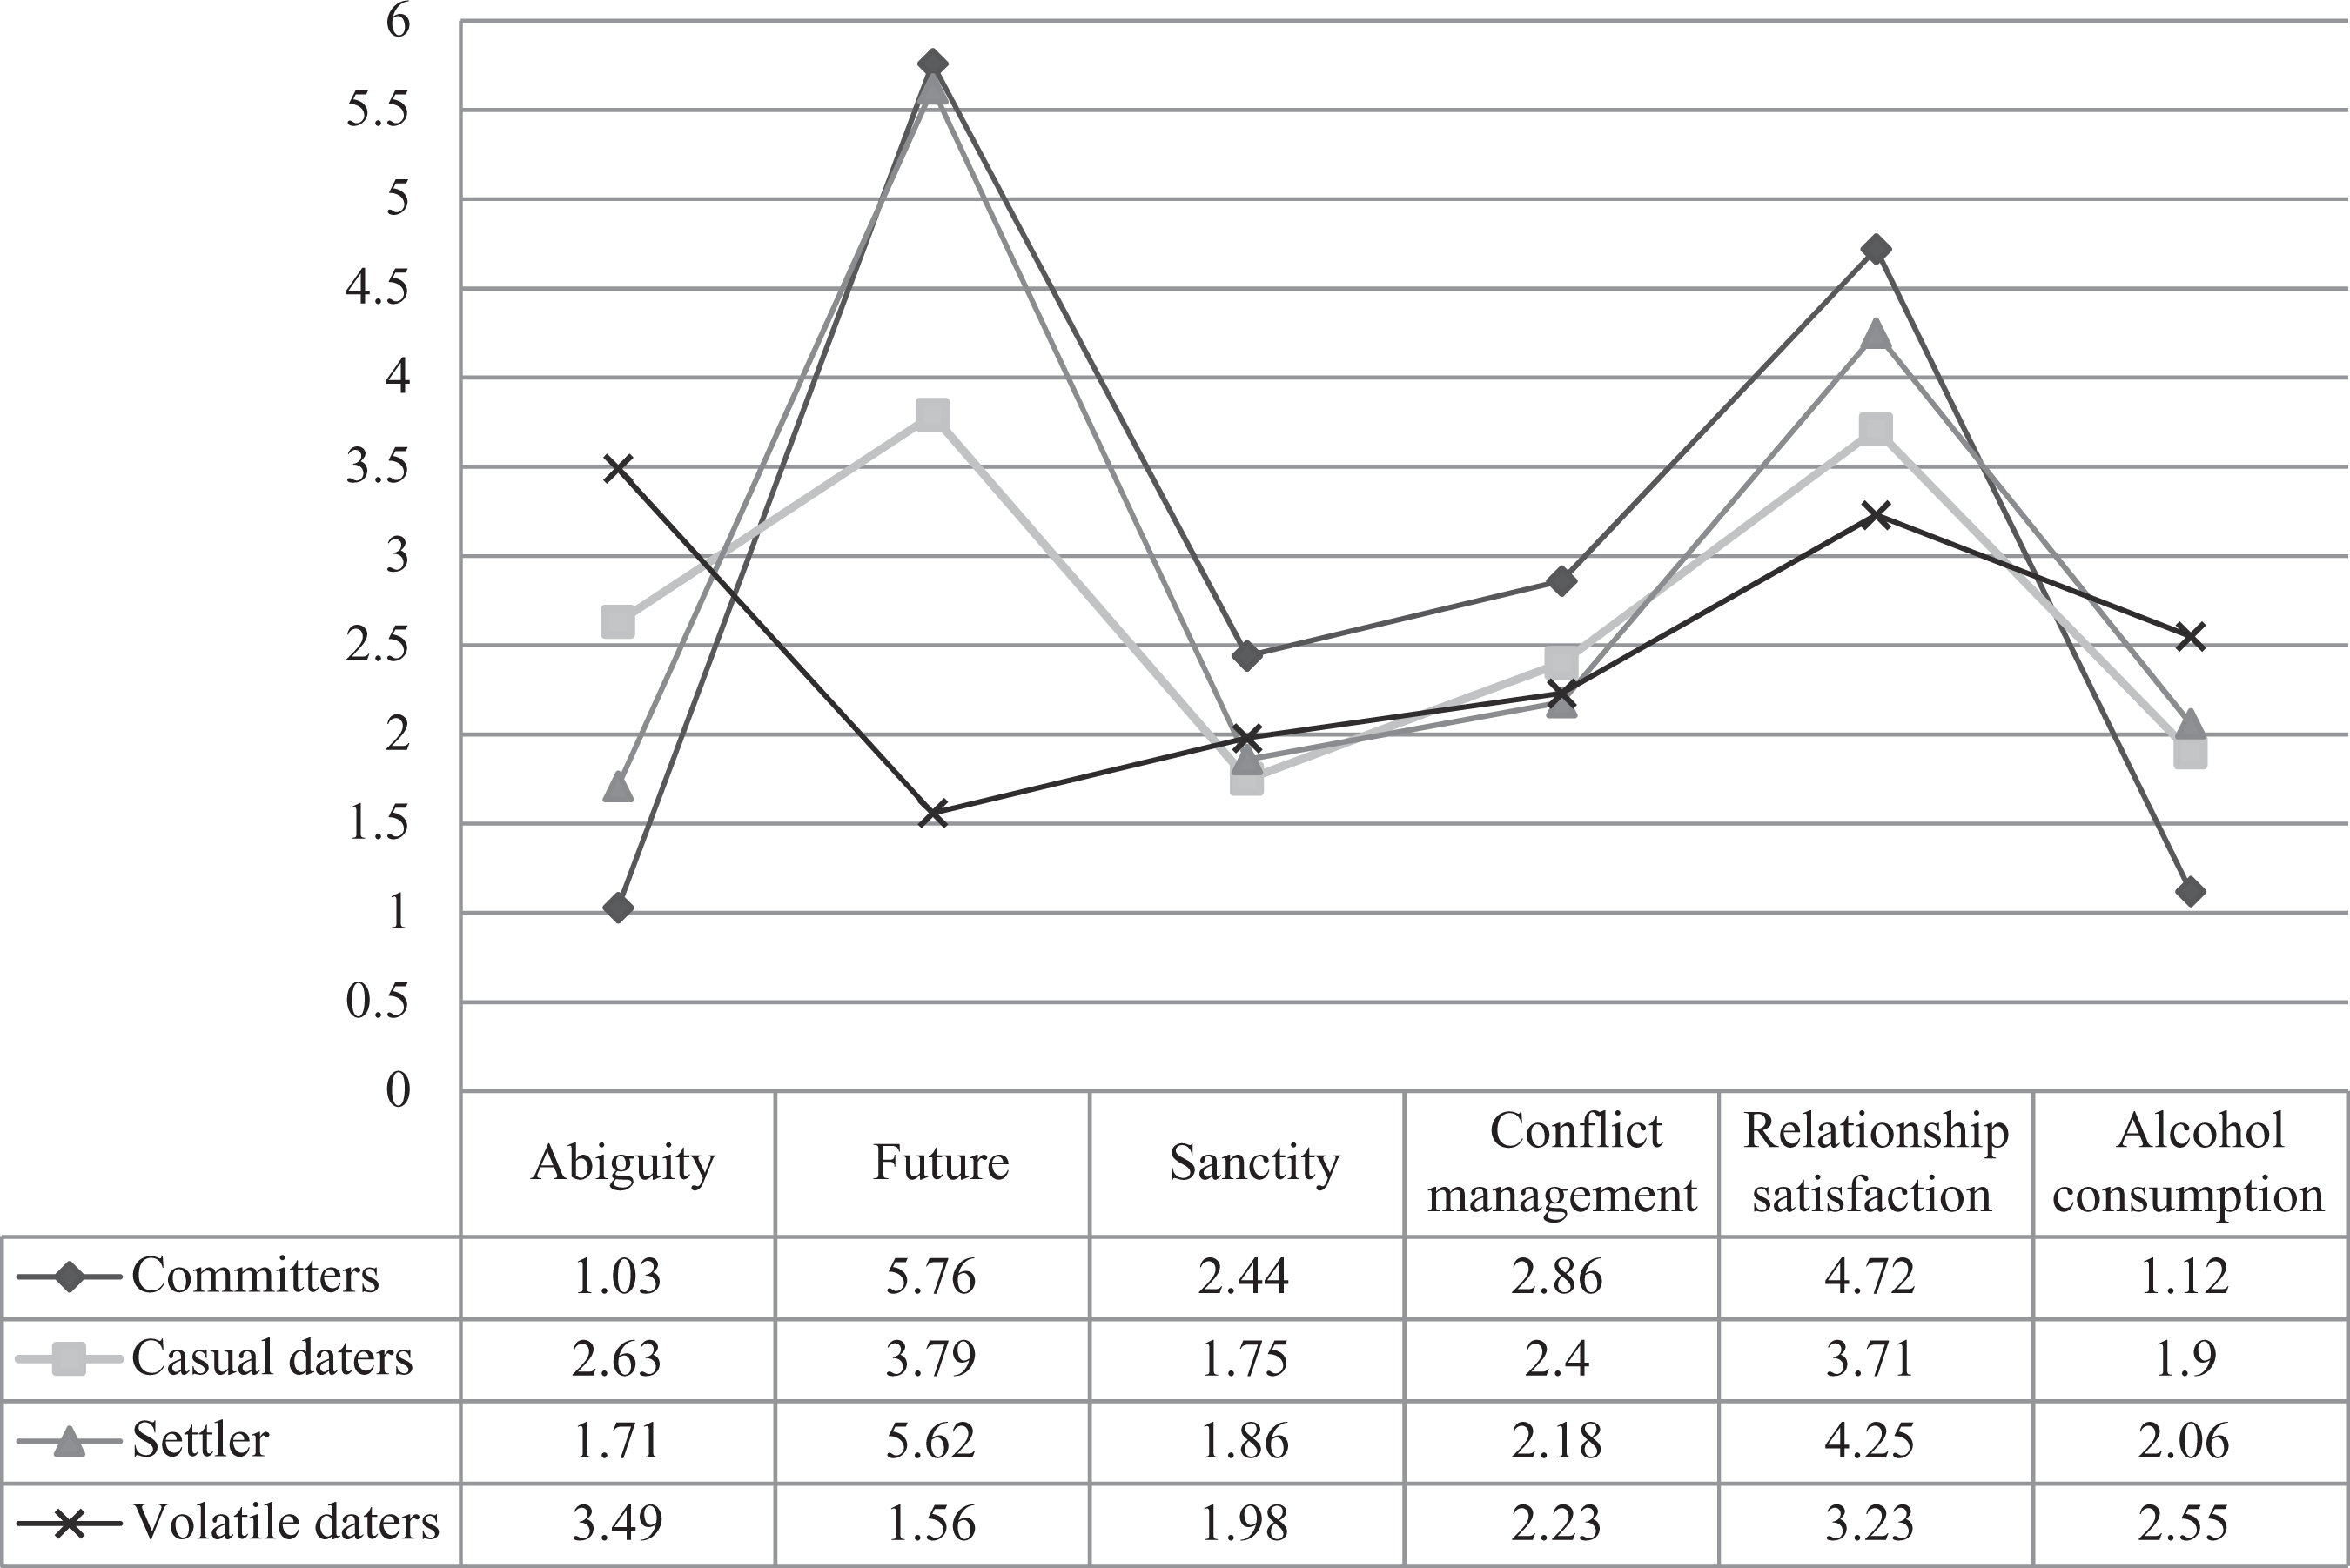
Visual representation of the means on the four latent classes given the six variable predictors.
ANOVAs for each variable predictor and number of individuals in each class.
Note. Means in the same column that do not share a subscript letter differ at p < .05 in the multiple comparisons Bonferroni post hoc tests. ANOVAs = analyses of variance.
**p < .001.
To determine class names, three of the authors separately developed names based on the visual representation (Figure 1), the means (Table 3), and relative means. “Relative mean” includes the classification of each class’ mean score on a variable compared to the other groups (e.g., high ambiguity, poor conflict management). Then, the first author developed names informed by the three sets of typology names and sought validation from other authors. The following description of the classes is based on that process. Class 1 was labeled the committers (38%) because they were perceived as having relatively low ambiguity, relatively high relationship future, relatively high sanctity, relatively positive conflict management, relatively high relationship satisfaction, and relatively low alcohol consumption compared to those in other classes. Class 2 was labeled the casual daters (23%) because they were perceived to have relatively high ambiguity, relatively moderate relationship future, relatively low sanctity, relatively moderate conflict management, relatively moderate relationship satisfaction, and relatively moderate alcohol consumption compared to those in other classes. Class 3 was labeled the settlers (30%) because they were perceived to have relatively low ambiguity, relatively high relationship future, relatively low sanctity, relatively poor conflict management, relatively moderate relationship satisfaction, and relatively moderate alcohol consumption compared to those in other classes. Class 4 was labeled the volatile daters (8%) because they were perceived to have relatively high ambiguity, relatively low relationship future, relatively low sanctity, relatively poor conflict management, relatively low relationship satisfaction, and relatively high alcohol consumption compared to those in other classes.
Individual and relationship characteristics
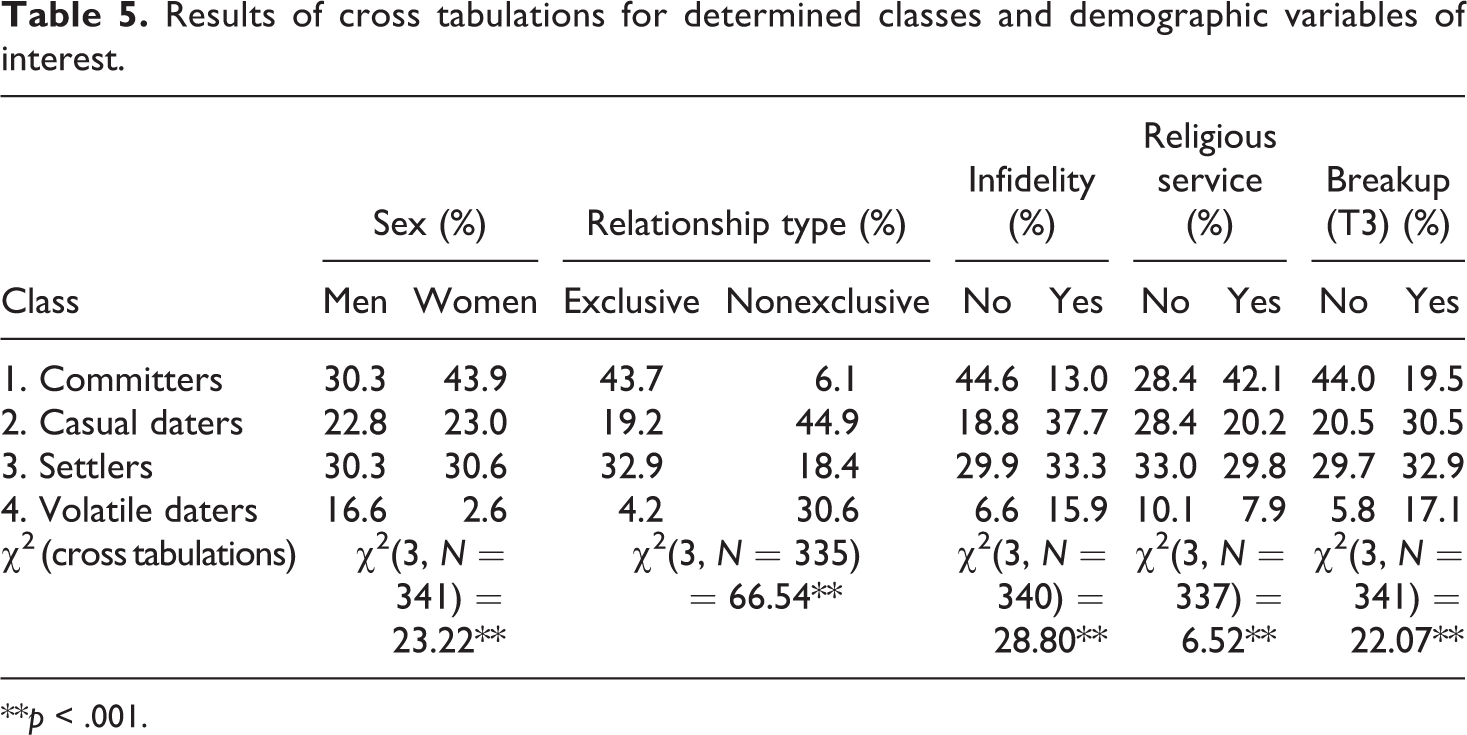
We then ran a series of χ2 analyses and ANOVAs to examine how classes differed on each of the background variables. Sample sizes vary between analyses due to missing values and the use of pairwise deletion for missing data. Percentages for all significant χ2 tests are presented in Table 5. First, the classes varied significantly by sex, χ2(3, N = 341) = 23.22, p ≤ .001, with men and women having similar representation of the settlers class (30.6% vs. 30.3%) and the casual daters class (22.8% vs. 23.0%). However, the committers class had a smaller representation among men than women (30.3% vs. 43.9%), whereas the volatile daters class had a larger portion among men than women (16.6% vs. 2.6%).
Results of cross tabulations for determined classes and demographic variables of interest.
**p < .001.
Next, the classes varied significantly by relationship type, χ2(3, N = 335) = 66.54, p ≤ .001, whereby the committers and the settlers classes represented a larger percentage of those in exclusive romantic relationships than those in nonexclusive relationships (43.7% vs. 6.1% and 32.9% vs. 18.4%, respectively). On the other hand, the casual daters and the volatile daters classes represented a smaller proportion of individuals who were in exclusive romantic relationships compared to those in nonexclusive relationships (19.2% vs. 44.9% and 4.2% vs. 30.6%, respectively).
The classes also varied significantly by reports of infidelity in the past 2 months, χ2(3, N = 340) = 28.80, p ≤ .001. The casual daters and the volatile daters classes represented a larger portion among those who experienced infidelity in their relationships compared to those who did not experience infidelity (37.7% vs. 18.8% and 15.9% vs. 6.6%, respectively). However, the settlers class was only a slightly higher proportion among those who experienced infidelity compared to those who did not (33.3% vs. 29.9%). Finally, the committers class represented a smaller proportion of individuals who experienced infidelity compared to those who did not (13.0% vs. 44.6%).
Next, using ANOVA, we found that the classes varied significantly by relationship duration, F(3, 297) = 2.59, p ≤ .001. Homogeneity of variance was met based on Levene’s statistic, F(3, 297) = 0.388, p = .761. Results of the multiple comparisons, using the Bonferroni procedure with α = .05, two-tailed, indicated that only the committers class (M = 13.22, SD = 10.52) had a longer average relationship duration than the volatile daters class (M = 7.04, SD = 10.72), whereas neither the settlers class (M = 11.08, SD = 10.42) nor the casual daters class (M = 10.84, SD = 11.92) was different from all other typologies.
The classes also varied significantly by reports of religious service attendance, χ2(3, N = 337) = 6.52, p ≤ .001). The committers class represented a larger proportion of individuals who attended religious services compared to those who never attended (42.1% vs. 28.4%). Furthermore, the casual daters class represented a larger proportion of individuals who never attended religious services compared to those who attended services (28.4% vs. 20.2%). However, the settlers and the volatile daters classes represented a similar proportion of those who never attended religious services and those who attended services (33.0% vs. 29.8% and 10.1% vs. 7.9%, respectively).
Classes did not differ by cohabitation status, χ2(3, N = 341) = 2.29, p =.52, or by family structure, χ2(3, N = 341) = 2.06, p = .56. Classes also did not vary according to mean age, F(3, 337) = 0.30, p = .83.
Individual and relationship outcomes
For research question 3, we examined how each of the classes differed by relationship stability and key intrapersonal outcomes measured at T3. We conducted a series of χ2 analyses and ANOVAs to address this question. First, classes significantly differed on relationship breakup during the semester, χ2(3, N = 341) = 22.07, p ≤ .001 (see Table 5); reports of breakup compared to no breakup were higher for the casual daters and the volatile daters classes, representing a larger promotion of those who reported breaking up during the semester compared to those who did not report a breakup (30.5% vs. 20.5 and 17.1% vs. 5.8%, respectively). However, the proportion of the settlers class was marginally different among those who broke up and those who did not (32.9% vs. 29.7%). Reports of no breakup compared to breakup were higher among the committers class, representing a higher proportion among those who did not breakup compared to those who did breakup (44.0% vs. 19.5%).
Next, using ANOVA, the classes varied significantly by reports of loneliness, F(3, 333) = 2.04, p ≤ .001. Results of the multiple comparisons, using the Bonferroni procedure with α = .05, two-tailed, indicated that the casual daters class (M = 1.02, SD = 0.59) reported significantly higher levels of loneliness compared to the settlers class (M = .69, SD = 0.57) and the committers class (M = .71, SD = 0.60). Also, the committers and the casual daters classes and the settlers and the casual daters classes differed significantly. However, the volatile daters class (M = .86, SD = 0.69) did not significantly differ from the other classes.
Classes did not significantly differ on the intrapersonal adjustment variables of psychological distress, F(3, 336) = 1.98, p = .12; academic adjustment, F(3, 336) = 1.74, p = .16; or social adjustment, F(3, 336) = 2.34, p = .07. Despite group size differences, psychological adjustment, social adjustment, and academic adjustment met the assumption of homogeneity of variance based on Levene’s statistic.
Discussion
The purpose of this study was to (a) identify different typologies of emerging adult romantic relationships using a number of theoretically and empirically informed indicators, (b) examine how these typologies relate to individual and relationship characteristics (e.g., gender, religious service attendance), and (c) examine whether relationship typologies predict later relationship (e.g., relationship satisfaction, breakup) and individual (e.g., loneliness, psychological distress) outcomes. Results suggest that individuals vary substantially in their views and experiences in romantic relationships during this developmental period. Some of the classes that emerged from these data appear to support previously held beliefs about the volatility of emerging adult dating relationships (Stanley et al., 2011), whereas others support those who challenge these perceptions (Arnett, Trzesniewski, & Donnellan, 2013; Jamison et al., 2013).
For those that espouse the current perception of emerging adult daters (the casual and volatile daters), we found that these individuals reported relative ambiguity within their relationships, relatively low future orientation, a lack of conflict management or skills related to relationships success, and relatively low relationship satisfaction compared to those in other groups. However, we also found that there were a number of individuals who defy currently held notions of emerging adult daters. Specifically, our committers and settlers reported a relative absence of ambiguity, having a future orientation in their relationships, better conflict management, and higher relationship satisfaction than their prototypical counterparts. Further, comparisons between these identified typologies on relationship outcomes, not surprisingly, suggested that relationship characteristics also contribute to a number of relationship outcomes. For example, the casual and volatile daters, who display many of the typical characteristics of emerging adult daters, showed higher levels of dating nonexclusivity, dissolution, and infidelity, again contributing to the view of emerging adult relationships as sexually driven and unstable (Stanley et al., 2011). Nonetheless, our between-group comparison also showed that the committers and the settlers eschewed these common characteristics and reported more exclusivity and stability.
In addition to identifying heterogeneity in emerging adult romantic relationships, it is important to note the proportion of individuals within these typologies. That is, although there were some individuals who exemplify the theoretical prototype of emerging adult daters (31% of our sample), the majority of our sample defied these current stereotypes. These results point to the importance of understanding both what is happening within the majority of emerging adult relationships and the minority. Further, as scholars we must not allow the minority of emerging adults’ behaviors to represent the narrative for the majority. Care must be taken to ensure that scholarship focused on the minority of students who might be exhibiting risky behavior is not generalized to the entire population of emerging adult daters.
Implications and future directions
Taken together, these findings suggest that we need to reevaluate the present archetype of emerging adult dating relationships. As Arnett (2000) suggests, emerging adulthood is a time of continuous exploration in the realms of love and work. Although this may be the case for some individuals, others may not be exploring options in love as readily as others. Our findings suggest that developmental researchers should consider the kinds of dating relationships emerging adults participate in, rather than considering their experiences as homogeneous. It is possible that emerging adults across the various relationship typologies have different journeys toward their goal of marriage (Arnett, 2014). Because our findings point to the varying nature of emerging adult romantic relationships, it will be important for future studies to consider these nuances and understand the processes for each typology in their own right. Such studies can continue the examination of relationship typologies and how they may have different or similar relationships with various individual or relationship outcomes.
Professionals who work with emerging adults in applied settings, including researchers, clinicians, and teachers involved in relationship education programs, might also consider these nuances in emerging adult relationships. Rather than viewing these romantic relationships as unstable and temporary, it might be beneficial for these professionals to explore the quality of these relationships and understand that they can be important parts of individuals’ development and mental health. Furthermore, relationship education curricula might begin to include informational about these different relationships and how they are linked to individual and couple outcomes.
Additionally, future research should consider whether these typologies are individual or relationship-specific. For example, does a certain type of person tend to be part of a certain type of relationship consistently across relationships? Or, does the relationship typology change during a relationship or across multiple relationships so that a relationship classification would be a function of the circumstantial characteristics unique to a particular combination of contextual and partner characteristics? Future research should determine stability of relationship typologies in emerging adulthood across multiple time points. Studies should also follow individuals in their transition into and out of college to assess whether their relationship characteristics may shift as they move toward adulthood. Longitudinal analyses such as latent transition analysis and dyadic analysis will be effective in moving these lines of research forward because of the ability to incorporate partners’ perspectives and assess how or whether relationship typologies change.
Limitations
There are a number of limitations to the current study. One limitation is the homogeneity of our sample. Participants were predominantly White and heterosexual. Caution should be taken when generalizing these findings to racial, ethnic, and sexual minorities and emerging adults who do not attend college. Further, this sample was from a large southeastern 4-year university in the U.S. and results are not generalizable to smaller, private, or 2-year institutions outside of the U.S.
The variables we used to classify emerging adult dating relationships may not capture all of the salient aspects of emerging adult romantic relationships. As scholars continue to learn about these relationships, new constructs may need to be incorporated to better capture romantic relationship typologies among emerging adults. Relatedly, regarding the variable ambiguity, it is important to note that although emerging adult romantic relationships are generally characterized by ambiguity (Arnett, 2014), there are individuals who intentionally choose to be in nonmonogamous relationships and as such do not experience ambiguity. Thus, future studies might consider this nuance and measure emerging adults’ intentions in pursuing various romantic relationships and experiences. Furthermore, it is also important to note that emerging adults’ religious participation tends to diminish during college (Stoppa & Lefkowitz, 2010). Thus, the variables that measure religiosity might not be as applicable to those who identify as agnostic or atheist.
Additionally, when assessing cohabitation status, response options did not include whether participants planned to live together or were in the process of moving in together. It is possible that individuals for whom this status is relevant might differ in terms of class categorization. Future studies are encouraged to include this nuance when examining emerging adult dating couples. Relatedly, it will be important for future research to examine the ways other dimensions of gender, such as masculinity and femininity, are related to these relationship typologies.
Many of the premarital and marital typologies discussed relied on dyadic data to determine couple type, but we focused on individual perceptions of romantic relationships in our assessment of relationship types. Therefore, our findings are limited to how emerging adults perceive their romantic relationships because results may have been different had we included both partners in the relationship. Also, our sample only included individuals who classified themselves as being part of a dating relationship (exclusive or nonexclusive). The typology categories do not include individuals who classify themselves as friends with benefits, hookup partners, engaged, and or married, and thus findings should not be generalized to these other relationship statuses.
Finally, this was a short-term longitudinal study whereby the classes were assessed at one time point and the outcome variables were assessed approximately 3 months later. Because the classes were assessed cross sectionally, we do not know whether they are subject to change over a longer period of time. Indeed, scholars (e.g., van Dulmen, Claxton, Collins & Simpson, 2014) suggest that short-term longitudinal studies that last for weeks to months might be more appropriate when examining dynamics in emerging adulthood. However, this typology may reflect possibilities of relationships that can occur during emerging adulthood, which may develop into other typologies in emerging adulthood over time. Additionally, it is possible that these typologies may transition into premarital typologies as couples move from dating to being engaged. Additionally, the outcome variables may not be able to assess stable differences between these classes because they were assessed approximately 3 months later. Therefore, these differences should not be generalized beyond this time period as we were not able to examine whether they are stable beyond 3 months.
It is important for future research to continue to understand relationship exploration through the present emerging adult framework. Our findings show that individuals vary in terms of sex and relationship duration, but do past experiences (i.e., number of previous relationships, timing of romantic relationships), previous relationship dynamics, (i.e., peer, parental, and romantic conflict, closeness), and/or intrapersonal characteristics (e.g., personality, gender, attitudes toward dating/marriage) contribute to different experiences of love and dating in emerging adulthood? Future studies should continue to explore patterns of dating that may support or refute the current theoretical model and factors that may contribute to these experiences.
In conclusion, there appears to be multiple types of romantic relationships among emerging adults. Because these typologies are meaningfully different on key characteristics (e.g., gender) and outcome variables (e.g., relationship breakup), this study emphasizes the importance of examining within-group differences and not simply examining the aggregate across a population. These typologies provide a more comprehensive picture regarding emerging adults’ romantic relationships, and future studies should build on this foundational typology.
Footnotes
Funding
The author(s) disclosed receipt of the following financial support for the research, authorship, and/or publication of this article: This research was support in part by the U.S. Department of Health and Human Services Grant 90FE0022) awarded to Frank D. Fincham.