
Abstract
Social interactions today expand beyond in-person interactions. Therefore, it is important to recognize that social interactions can occur with social network members across multiple communication modes (in-person, phone, and online). The current study explored the role that social support plays in the relationship between mode frequency (in-person, phone, and online), network communication mode diversity (breadth and evenness of communicating with network members via different communication modes), and well-being (positive affect, stress, and loneliness) from the 3-year UCNET (UC Berkley Social Networks Study, N = 1159) dataset. The study contained samples for two age groups (cohorts) – 21–31 year-olds and 50–70 year-olds, which also allowed for an exploration of age differences in these relationships. Longitudinal random-intercept cross-lagged panel models (RI-CLPM) showed a high degree of stability over the 3 years for all variables. Cross-sectional structural equation mediation models showed that social support mediated the relationships of mode frequency (in-person, phone, and online) and network communication mode diversity with well-being (more positive affect and less loneliness and stress). Age differences were found in the relationship between frequency of communication modes and social support, in that the frequency of communication mode was positively related to social support for younger adults, but not for middle-aged/older adults. Current findings provided future research directions geared toward further understanding of the mode frequency and network communication mode diversity constructs and how they relate to various psychosocial outcomes.
Introduction
Social relationships refer to interactions and relationships that make up one’s social life. Social relationships are known to affect one’s health and well-being both positively and negatively (Charles et al., 2021; Siedlecki et al., 2014). Studies have demonstrated that good quality relationships are associated with better health outcomes, whereas negative quality relationships can be detrimental (Cohen et al., 2000). Social relationships are formed and maintained through social interactions. The range of available social technology allows for a wide range of communication modes (e.g., phone calls and online communication), beyond in-person interactions. Therefore, it is important to consider the implications of social interactions with network members that occur across multiple communication modes (in-person, phone, and online).
The current study contributes to the literature by examining communication mode frequency and network communication mode diversity (breadth and evenness of communicating with network members via different modes) in relation to well-being (affect, stress, loneliness) with a 3-year study (2015–2018) for two age groups (cohorts) – 21–31 year-olds and 50–70 year-olds from the UCNET (UC Berkley Social Networks Study) dataset (Fischer, 2018). In addition, the current study examines whether social support (instrumental support, giving and receiving emotional support) mediates the relationship between mode and diversity of interpersonal communication and well-being.
Increase of online communication for middle-aged/older adults
While younger adults have been heavy consumers of social technology use, middle-aged/older adults are an emerging group of social technology consumers (Rasche et al., 2018). As of 2021, 83% of adults aged 50–64 and 61% of adults aged 65 years and older own a smartphone (Pew Research Center, 2021b). This is more than double the number of smartphone ownership compared to that of 2013 (Smith, 2013). Additionally, 96% of adults aged 50–64 and 75% of adults aged 65 years and older use the internet (Pew Research Center, 2021a), and 73% of adults aged 50–64 and 45% of adults aged 65 years and older use at least one social media site (Pew Research Center, 2021c). Social technologies can impact how middle-aged/older adults maintain social connections and overall well-being, which are all important predictors of health and mortality (Perissinotto et al., 2012). As middle-aged/older adults continue to adopt and use new social technology, it is critical to examine its effects on middle-aged/older adults’ social support and well-being.
Diversity of network communication mode
Social interactions can occur with social network members across multiple communication modes (in-person, phone, and online). Individuals may communicate with different network members using a wide range of communication modes interchangeably (e.g., in-person, phone, and online) or communicate with only a few network members using a narrow range of communication modes (e.g., in-person communication only). In other words, one individual may frequently communicate with network members online but infrequently have in-person or phone communication, whereas another individual may interact with all network members frequently or infrequently (evenly) across all communication modes. Such individual differences in the breadth and evenness of communicating with network members via different communication modes (network communication mode diversity) may be associated with well-being.
The current study adapted Shannon’s (1948) entropy to construct network communication mode diversity. Shannon’s entropy is a diversity index that has been widely used to measure stressor diversity (Koffer et al., 2016) and emotion diversity (Lee et al., 2018; Quoidbach et al., 2014; Urban-Wojcik et al., 2021). But it has not been used to measure diversity in the context of one’s social network and communication mode (network communication mode diversity). Network communication mode diversity index can assess the breadth and evenness of one’s interpersonal communication with network members that cannot be assessed by only measuring the frequency of interpersonal communication with network members. Figure 1 depicts two individuals with different network communication mode diversity. The diversity pattern shown on the left depicts an individual who communicated with fewer network members (less breadth and evenness) compared with the diversity pattern shown on the right which illustrates an individual who communicated with all the network members across all communication modes (more breadth and evenness). The example in Figure 1 shows higher network communication mode diversity in the right panel compared to the diversity pattern shown on the left. Examples of low and high network communication mode diversity.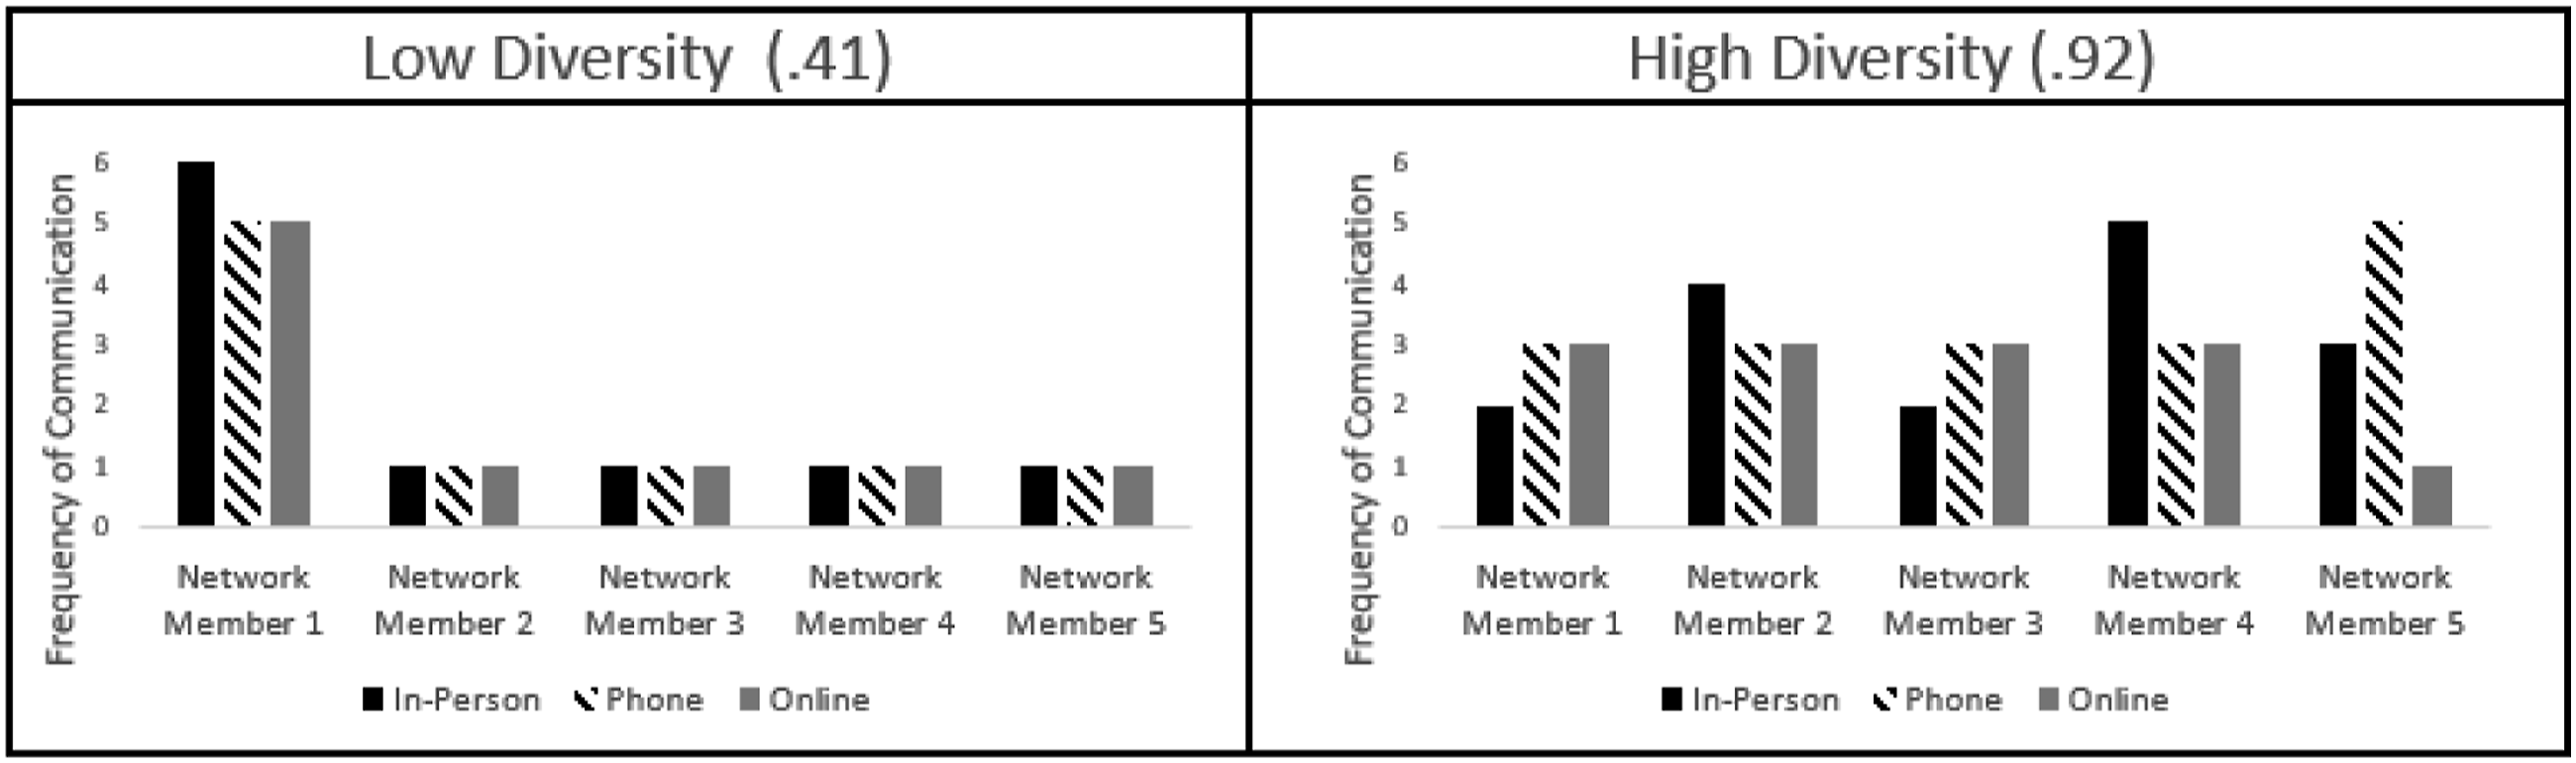
Interpersonal communication and well-being
Social relationships are essential to well-being. High-quality social relationships with strong ties are associated with better well-being (Moore, 2018). Social relationships and interpersonal communication with social network members can serve as a buffer against negative and stressful life events (Ajrouch et al., 2013) and loneliness (Y. Lee & Ko, 2018), and promote overall psychological well-being (Burke & Kraut, 2016). In terms of communication modes, research has shown that more in-person and phone communication with social network members (e.g., strong ties) across both younger and middle-aged/older adults are associated with better well-being (Chan & Li, 2020; Lin & Lachman, 2021). Although studies have found that for younger adults, an increase in online communication in general is negatively associated with their well-being (Berryman et al., 2018; Hunt et al., 2018), online communication with one’s social network members (e.g., strong ties) has consistently been associated with better well-being for both younger and middle-aged/older adults (Burke & Kraut, 2016; Gilmour et al., 2020; Hutto et al., 2015).
The mediating role of social support
Social support (instrumental support, giving and receiving emotional support) comes from social contact with one’s social networks (Hill & Dunbar, 2003). Social technology usage allows people to connect and communicate with those in their social network easily. Social technology can fulfill social needs with strengthened social relationships from enriched social contacts and reassurances for people and their social network members, which in turn can contribute to more social support and positive well-being (Sims et al., 2017; ten Bruggencate et al., 2019). Longitudinal analyses also support that social technology such as internet use for social support from social network members can enhance people’s well-being (Quintana et al., 2018; Szabo et al., 2019).
Social integration theory (Pillemer et al., 2000) suggests that diverse social activities and relationships can promote positive well-being. Social integration implies greater breadth of social relationships and greater evenness (less polarization) among multiple social domains, which corresponds to the concept of network communication mode diversity. The concept of social integration and well-being has been examined in the context of social network diversity, where researchers have consistently found that greater social network diversity was associated with less susceptibility to infectious illnesses like the common cold (Cohen et al., 2000), and better physical and mental health in children (Koyama et al., 2020) and middle-aged/older adults (Talha et al., 2018). However, diversity in past studies has often been measured only by a count of social network members. Given the trend of interpersonal interactions via various communication modes with network members, it is also of interest to examine whether network communication mode diversity (breadth and evenness of interpersonal interactions with network members via different communication modes) is associated with social support and well-being for younger and older adults.
Age differences
Age differences have been found in the frequency of interpersonal communications, network communication mode diversity, social support, and well-being (Courtin & Knapp, 2017; Hyde et al., 2013; Reinecke et al., 2017; Stone et al., 2010; Wrzus et al., 2012). Thus, the relationships among these variables may also vary by age. Based on the socioemotional selectivity theory, as one approaches later life with a more limited time perspective, there is increasing selectivity for emotional investment (Carstensen et al., 1999). Middle-aged/older adults also report better well-being compared to younger adults (Hyde et al., 2013; Stone et al., 2010). A meta-analysis revealed a global increase in social network size through young adulthood followed by a steady decrease throughout later adulthood in both cross-sectional and longitudinal studies (Wrzus et al., 2012). Middle-aged/older adults also report contacting their friends less frequently compared to younger adults who have more frequent contact with friends (Courtin & Knapp, 2017). Younger adults are inclined to emotionally invest in networks of both strong and weak ties, which could lead to more social strain and stress. In contrast, middle-aged/older adults are more likely to have a well-honed social network of strong ties with whom they feel emotionally close, which could enhance their well-being (Carstensen, 2021; Reinecke et al., 2017). Compared to younger adults, middle-aged/older adults can also be more selective in their social support system and they may be more likely to have a specified support network that can be beneficial to their well-being (Hülür & Macdonald, 2020). Given the age differences found in past studies about the relationships between frequency of interpersonal communication with social network members, social support, and well-being, it is of interest to examine age differences in these relationships.
Frequency of communication mode usage also differs by age. Whereas younger adults were raised in the digital age and are familiar with online communication, middle-aged/older adults lived a large part of life mainly interacting with family and friends in person or via phone calls. Middle-aged/older adults have been referred to by researchers as “digital immigrants” in that they have learned the new digital technology as adults (Palfrey & Gasser, 2008). Although technology use has dramatically increased among middle-aged/older adults in recent years (Pew Research Center, 2021a), challenges such as difficulty learning technology, privacy concerns, physical or cognitive disability, and attitudinal and cognitive barriers still persist for older adults (Levine et al., 2016; Wilson et al., 2021). Furthermore, as more middle-aged/older adults continue to rely on technology to compensate for age-related changes (e.g., increased vulnerability and limitations in health) (Gell et al., 2015), it is of increasing interest to examine whether age differences are present in the relationship between frequency of communication mode and social support and well-being.
The current study
Past studies examining both younger and middle-aged/older adults have explored associations of interpersonal interaction via different communication modes, social support, and well-being with relatively small and convenience samples (Grieve et al., 2013; Kafetsios et al., 2017). The current study used data from a larger sample with three occasions, which can increase reliability and can provide a more robust representation of participants’ experiences than a single occasion (Caruana et al., 2015). Past studies have often examined general technological trends, with variables measuring general internet use or social media use without specifying social network members (Chopik, 2016; Hunsaker & Hargittai, 2018; Szabo et al., 2019). In addition, past studies often measured interpersonal communications with just the frequency of communication (Gonzales, 2014; Khoo & Yang, 2020; Lin & Lachman, 2021). The current study adds to the literature by examining both the frequency of communication mode and network communication mode diversity (breadth and evenness of communicating with network members via different communication modes) and their relationships with social support and well-being (positive affect, loneliness, and stress). To our knowledge, the current study is the first to examine network communication mode diversity with social network members (strong ties). Moreover, the current study tested whether social support mediates the relationship between mode and diversity of interpersonal communication and well-being, which could shed light on how the mediation process works. The 3-year study (2015–2018) for two age groups (cohorts) – 21–31 year-olds and 50–70 year-olds from the UCNET (UC Berkley Social Networks Study) dataset (Fischer, 2018) also allowed for an exploration of age differences in these relationships.
Hypotheses
It was predicted that more frequent in-person, phone, and online communication (1a) and network communication mode diversity (breadth and evenness of communicating with network members via different communication modes) (1b) would be related to more social support (more instrumental, receiving and giving support) and better well-being (more positive affect and less loneliness and stress) in both the concurrent and the subsequent waves. It was also expected that social support would mediate the relationship between mode (2a) and diversity (2b) of interpersonal communication and well-being. Finally, it was predicted that age differences would be present, in that higher frequency (3a) and diversity of network communication mode (3b) would predict less social support and worse well-being for younger adults, but more social support and better well-being for older adults.
Methods
Participants
The current study was determined by the University Institutional Review Board to be exempt because it was a secondary data analysis using deidentified data available in the public domain. Participants (N = 1159) for this study were from the three waves of the UC Berkley Social Networks Study (UCNET) (Fischer, 2018) conducted between 2015–2018, which included people in two age groups – the younger cohort (21–31 years old, M = 25.67, SD = 2.72, Median = 26) and the older cohort (50–70 years old, M = 60.92, SD = 5.94, Median = 62). The study sample consisted of 65.9% female and 34.1% male, 68.7% White, 1.4% Hispanic, Latino, or Spanish, 5.4% Black, 0.2% Native American, 15.9% Asian, .2% Hawaiian/Pacific Islander, 5.4% mixed, and 4.2% unknown. For sexual orientation, 84.9% were heterosexual people, 6.8% reported gay, and 8.3% described themselves as something else. The mean education level for the sample was 16 years (SD = 2), equivalent to the completion of bachelor’s degree. In terms of health, 9.1% of the sample reported a disability. Other reported diagnoses included high blood pressure or hypertension (23.3%), diabetes or high blood sugar (10.1%), a heart problem (5.2%), asthma or another breathing issue (15.6%), arthritis or rheumatism (16.8%), and depression or another psychological problem (26.9%). Participants were recruited from households in one of the six San Francisco Bay Area counties (Alameda, Contra Costa, Marin, San Francisco, San Mateo, and Santa Clara) using address-based sampling. The study sample was representative of the San Francisco Bay Area. Participants completed a one-hour survey on each occasion, which was administered either face-to-face or using the web. The survey asked about participants’ social life and health, which included their frequency of communication, social support, and well-being. Participants were compensated with $25 for the first wave survey, $35 for the second wave survey, and $50 for the third wave survey (Fischer, 2018).
Covariates
Covariates include age, sex, education, and health because of their previously recognized relationships with the dependent variables (Anderson et al., 2006; Vera-Villarroel et al., 2012). Age was represented by two age groups: 0 = 21–31 year-olds, and 1 = 50–70 year-olds. Sex was dummy coded with 1 = “male” and 2 = “female”. Education was measured by years of education (6–20). Functional health consisted of Self-Evaluated Physical Health (Single item asking: “would you say your physical health is excellent, very good, good, fair, or poor?” where 1 = “excellent” to 5 = “poor”, which was reverse coded so that higher scores indicated better health.
Measures
Frequency of communication modes
Frequency of communication modes was assessed across three domains: frequency of in-person, phone, and online communication. For each wave, up to five network member names were randomly drawn from a list of people participants named that they give support to, confide in, and seek advice from. For each network selected member, participants responded with how often they communicate with that network member in-person, by phone, and online (3 items), with scores ranging from 1 (at least once a day) to 6 (never) for in-person, phone, and online communication. Scores were reversed so a higher score represented a higher frequency of in-person, phone, or online communication with each network member. The frequency of each communication mode was averaged across all network members participants named to yield three variables, frequency of in-person communication, frequency of phone communication, and frequency of online communication. Because there were no significant mean changes over time for in-person and phone communication (p > .05 for both), and due to the high correlations between each wave for each mode (in-person: wave 1 and wave 2 r = .33, p < .001, wave 2 and wave 3 r = .40, p < .001, wave 1 and wave 3 r = .39, p < .001; phone: wave 1 and wave 2 r = .41, p < .001, wave 2 and wave 3 r = .54, p < .001, wave 1 and wave 3 r = .49, p < .001; online: wave 1 and wave 2 r = .52, p < .001, wave 2 and wave 3 r = .53, p < .001, wave 1 and wave 3 r = .58, p < .001), frequency of each communication mode was collapsed (averaged) across the three occasions (in-person: α = .64; phone: α = .73; online: α = .77).
A latent construct of frequency of communication mode was created with these domains, where higher levels of these variables would indicate more communication via each mode. A measurement model was used to examine the relationship between the latent variable and its measures.
Network communication mode diversity
The frequency of each communication mode for each of the network member names was recoded to a binary variable where 0 = did not communicate with this network member via the specific mode and 1 = did communicate with this network member via the specific mode. Each binary variable was then used to calculate network communication mode diversity for each wave using the Shannon’s entropy (1948) formula:
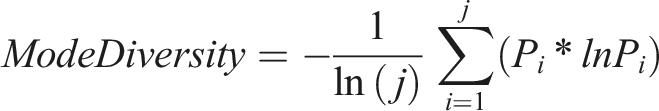
The letter j represents the total number of communication modes possible for all network members (5 network members across 3 communication mode = 15). Pi indicates the proportion of the binary variable over the sum of the total number of modes used to communicate with network members. The equation would yield a score ranging from 0 (least) to 1 (most network communication mode diversity) (Figure 1).
For analysis of network communication mode diversity, the frequency of each communication mode was used as a covariate to ensure that any relationship between network communication mode diversity and the outcome variables was not driven by more overall frequency of communication across the three modes. Additionally, because of the high correlations between each wave (wave 1 and wave 2 r = .33, p < .001, wave 2 and wave 3 r = .39, p < .001, wave 1 and wave 3 r = .33, p < .001), network communication mode diversity was collapsed (averaged) across the three occasions (α = .60).
Social support
Social support was assessed across three domains: giving support, receiving support, and instrumental support. A latent construct of social support was created with these domains, where higher levels of these variables would indicate more social support (α = .82). A measurement model was used to examine the relationship between the latent variable and its measures.
Receiving support
Receiving support referred to receiving emotional support. This was measured by the number of people participants confide in and seek advice from (2 items). Confide in item states “Sometimes personal matters come up that concern people, like issues about relationships, important things in your life, difficult experiences. Who do you confide in about these sorts of things?”. Seek advice item states “When you have to make important decisions – for example, about taking a job, family issues, or health problems – Whose advice do you or would you seek out? They can be family, friends, or professional advisors.” The scores for the two items were averaged, and each item ranged from 0 to 6, with a higher score representing more support received. Because of the high correlations between each wave (wave 1 and wave 2 r = .57, p < .001, wave 2 and wave 3 r = .67, p < .001, wave 1 and wave 3 r = .57, p < .001), receiving support was collapsed (averaged) across the three occasions (α = .82).
Giving Support
Giving support was measured by the number of people participants gave emotional support to (1 item). The score ranged from 0 to 6, with a higher score representing more support given to others. Because of the high correlations between each wave (wave 1 and wave 2 r = .37, p < .001, wave 2 and wave 3 r = .55, p < .001, wave 1 and wave 3 r = .37, p < .001), giving support was collapsed (averaged) across the three occasions (α = .69).
Instrumental Support
Instrumental support referred to practical or physical help and was measured by the number of people who give participants practical help and who would help if participants were sick (2 items). Practical help item states “In the last few months, which friends, relatives, or acquaintances who do not live with you give you any practical help like moving furniture, doing repairs, picking up something at the store, looking after a child, giving you a ride, or things like that?” The other item states “If you were seriously injured or sick and needed some help for a couple of weeks with things such as preparing meals and getting around, who would you ask?”. The scores for the two items were averaged and each item ranged from 0 to 6, with a higher score representing more instrumental support. Because there were no significant mean changes over time for instrumental support (p > .05) and because of the high correlations between each wave (wave 1 and wave 2 r = .46, p < .001, wave 2 and wave 3 r = .55, p < .001, wave 1 and wave 3 r = .45, p < .001), instrumental support was collapsed (averaged) across the three occasions (α = .74).
Well-being
Well-being was assessed across three domains: positive affect, stress, and loneliness. A latent construct of well-being was created with these domains, where higher positive affect, and lower stress and loneliness would indicate better well-being (α = .74). A measurement model was used to examine the relationship between the latent variable and its measures.
Positive affect
Positive affect was measured by how often participants had these feelings during the past 30 days on a 1 (all of the time) to 5 (none of the time) scale: hopeful, enjoyed life, nervous, hopeless, restless or fidgety, irritable, depressed, worthless, effortful, disturbed (10 items). Scores for the items hopeful and enjoyed life were reverse coded so that higher scores represented more positive affect. Because there were no significant mean changes over time (p > .05) and due to the high correlations between each wave (wave 1 and wave 2 r = .72, p < .001, wave 2 and wave 3 r = .77, p < .001, wave 1 and wave 3 r = .67, p < .001), positive affect was collapsed (averaged) across the three occasions (α = .88).
Stress
Stress was only measured at waves 2 and 3. Participants rated their feeling of stress on a 1 (very much) to 5 (not at all) scale (1 item). The score ranged from 1 to 5 with a higher score representing a lower level of stress. Because of the high correlations between waves 2 and 3 (r = .58, p < .001), stress was collapsed (averaged) across the two occasions (α = .73).
Loneliness
Loneliness was measured by the number of days during the past 7 days participants felt lonely and isolated from others (2 items). Scores ranged from 0 to 7 for each item and scores were reverse-coded so that higher scores represented lower levels of loneliness. Because there were no significant mean changes over time (p > .05) and due to the high correlations between each wave (wave 1 and wave 2 r = .53, p < .001, wave 2 and wave 3 r = .59, p < .001, wave 1 and wave 3 r = .46, p < .001), loneliness was collapsed (averaged) across the three occasions (α = .77).
Analyses
The research questions, hypotheses, methods, and analyses of the current study were originally pre-registered prior to conducting the research on Open Science Framework. The original pre-registration aimed to examine the data longitudinally. Longitudinal random-intercept cross-lagged panel models (RI-CLPM) were conducted to present the data at both the between-person (interindividual) and within-person (intraindividual) levels. Descriptive and correlational results showed that each variable of interest across the three waves had a high stability, and many variables had no significant mean change over time. Thus, we averaged the scores across the three occasions to capture more robust results and tested mediation with cross-sectional structural equation models. We also examined network communication mode diversity in addition to frequency of communication modes, which was preregistered.
Pearson Bivariate Correlation Coefficients were examined for all variables of interest and the covariates. The latent variables for frequency of communication modes (3 indicators: frequency of in-person, phone, and online communication), social support (3 indicators: giving support, receiving support, and instrumental support), and well-being were created. Well-being was created with three observed variables of positive affect, stress, and loneliness, where higher positive affect and lower stress and loneliness would indicate better well-being. Model fits for frequency of communication modes, social support, and well-being were first measured with measurement models. A structural equation mediation model was then tested in R with social support as a mediator (Figure 2). Indirect effects were computed by the products of a*b (a = coefficient estimate of the association between frequency of communication modes or network communication mode diversity and social support); b = the coefficient estimate of the relationship between social support and well-being). Age differences were examined by first conducting multiple group analyses without constraints across both groups. Then, all paths were constrained across groups, and model fits were compared using the chi-square difference test to determine whether there are significant age differences. Structural equation mediation model: Frequency of communication modes as a predictor.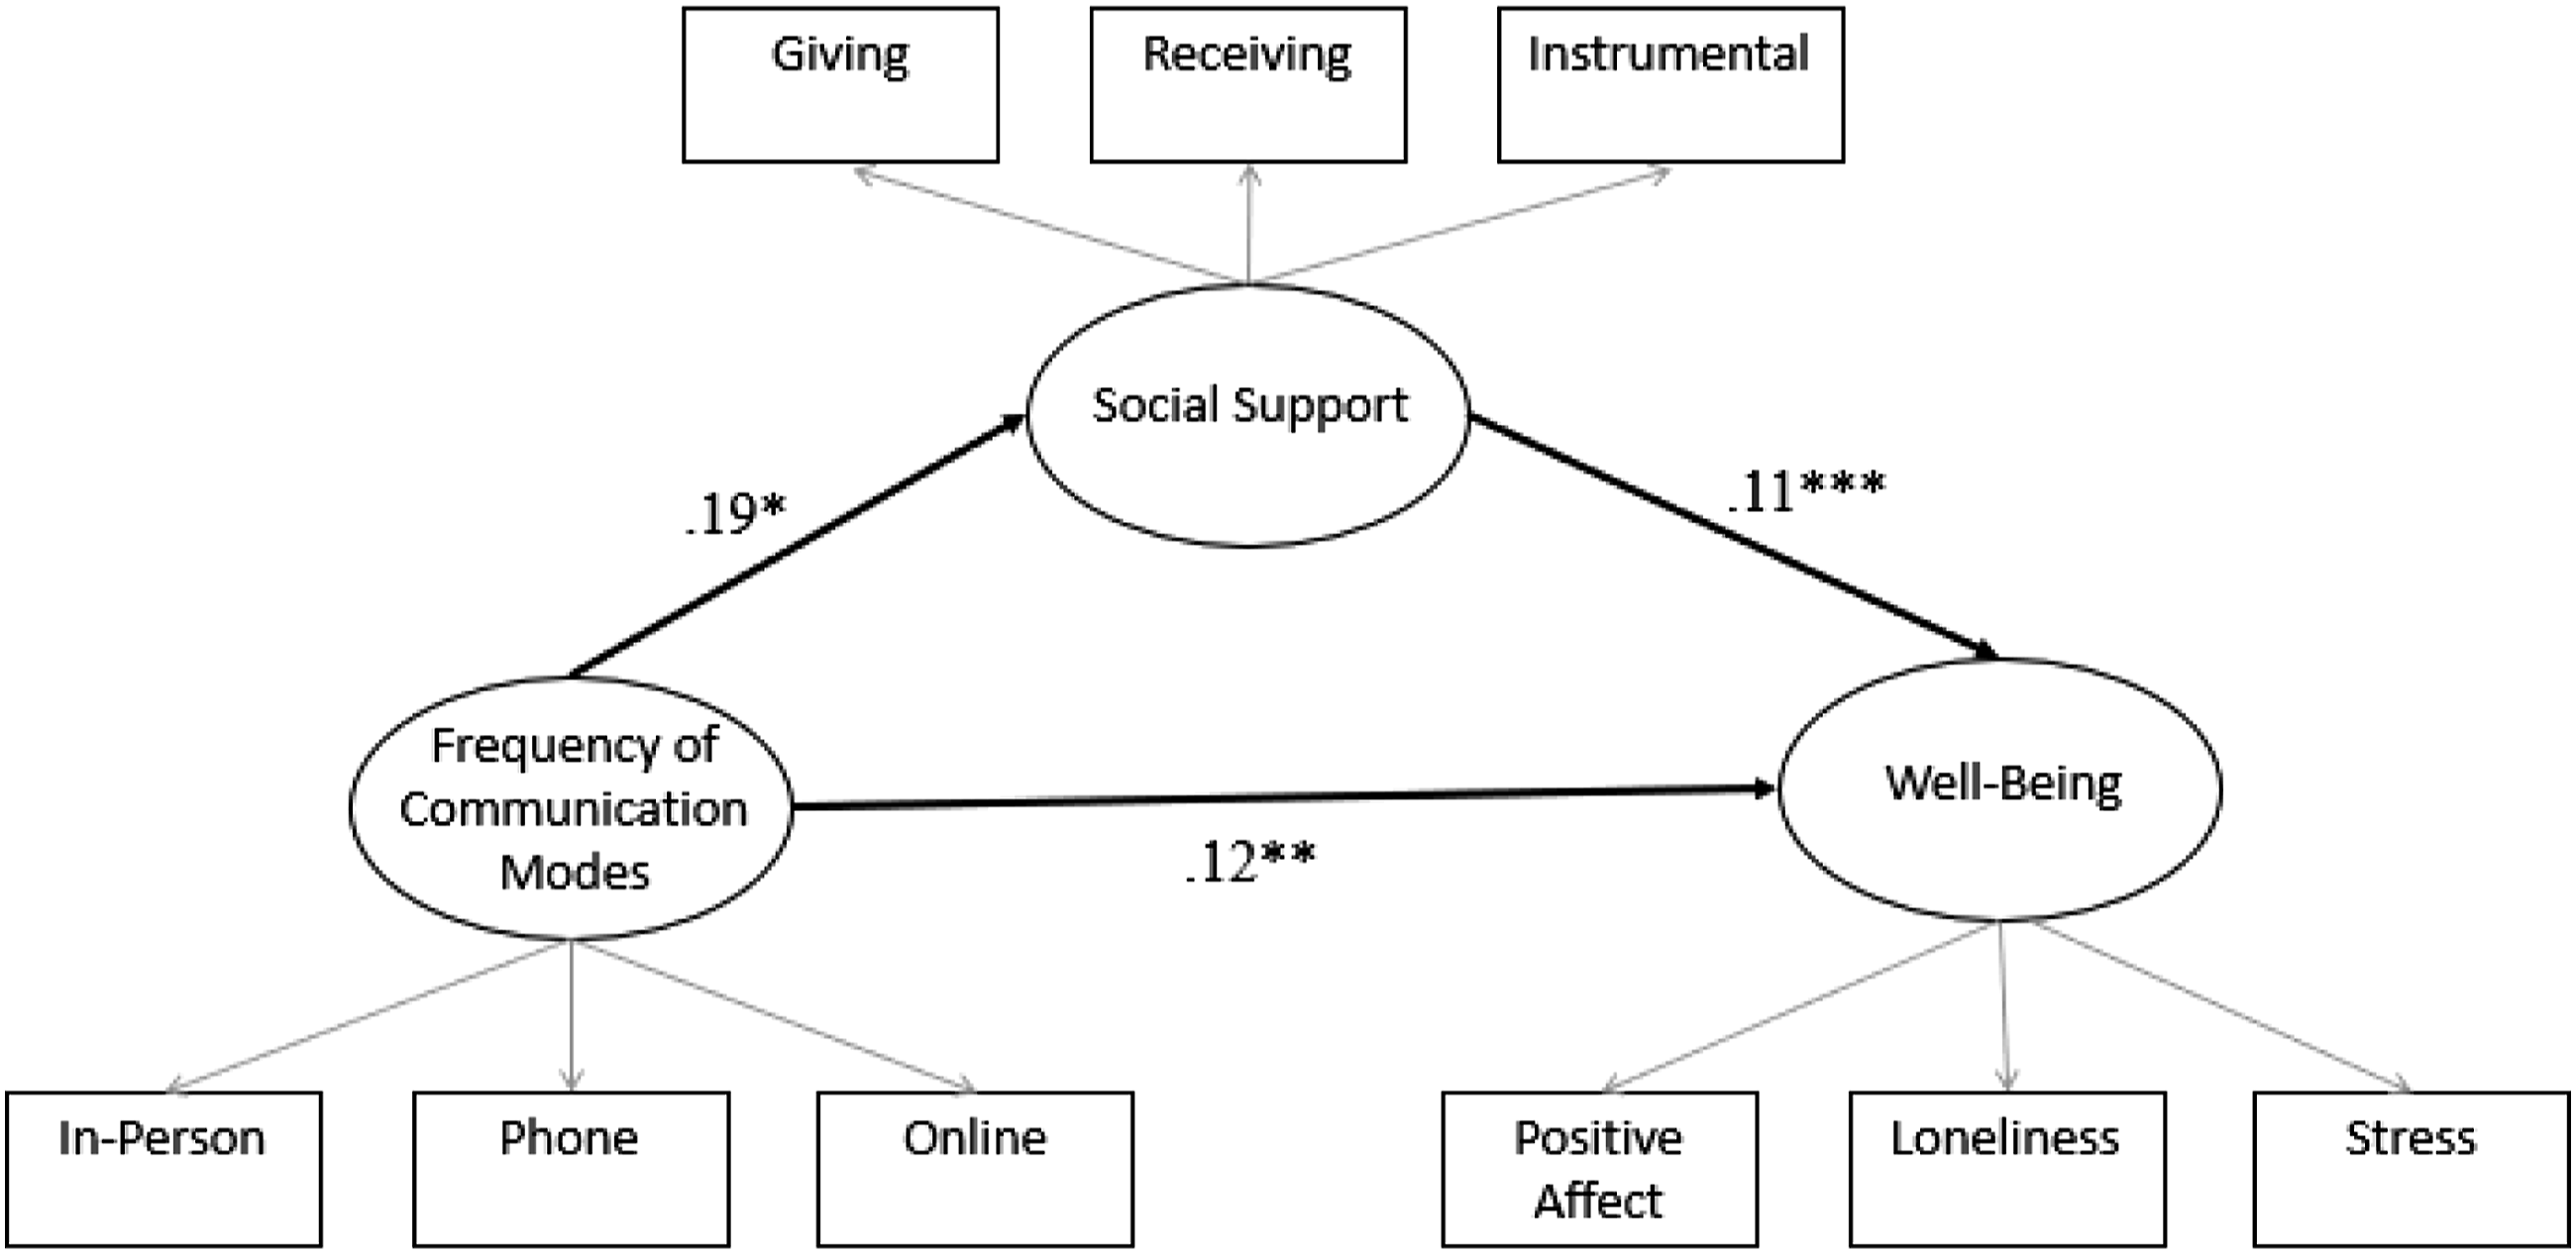
Results
Means, standard deviations, and intercorrelations among variables collapsed (averaged) across all waves.
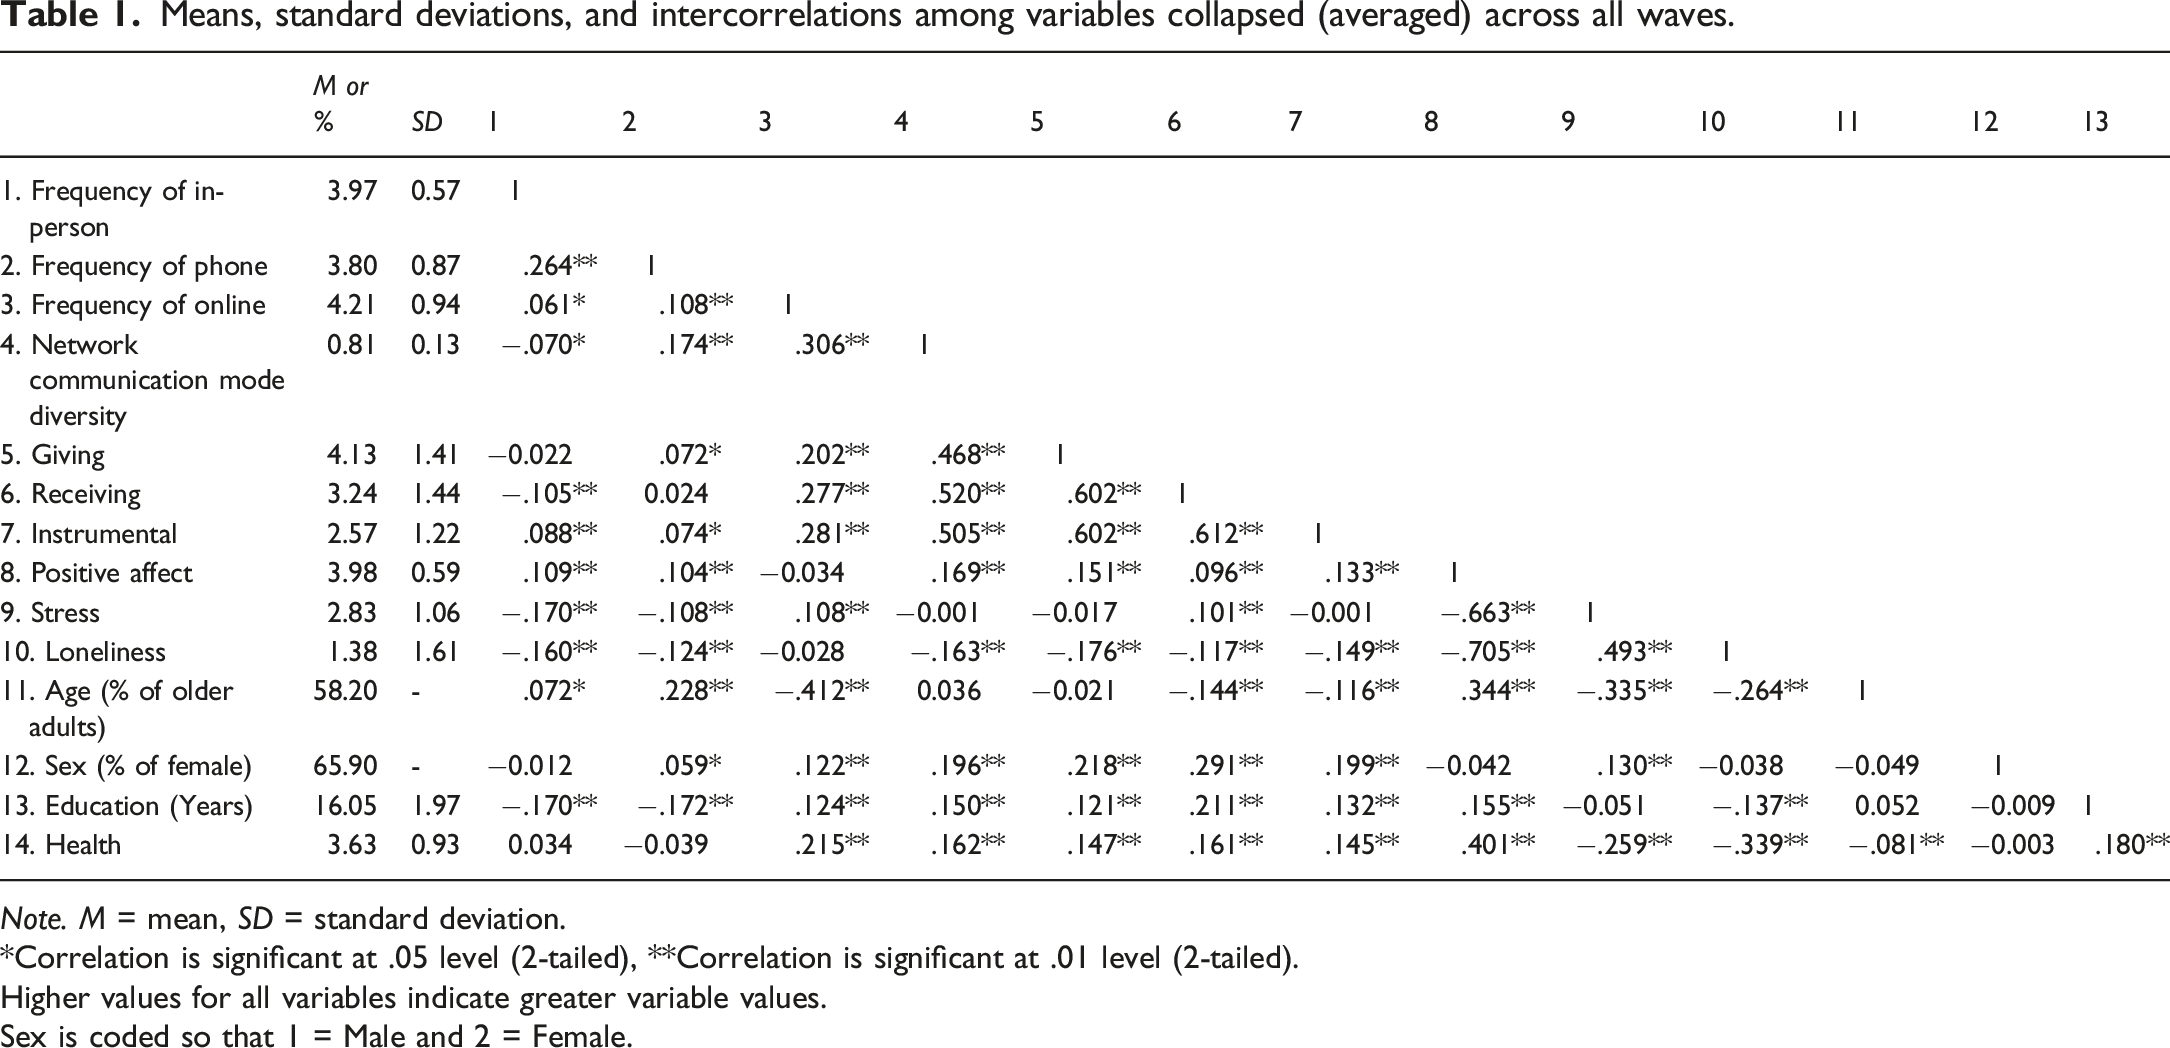
Note. M = mean, SD = standard deviation.
*Correlation is significant at .05 level (2-tailed), **Correlation is significant at .01 level (2-tailed).
Higher values for all variables indicate greater variable values.
Sex is coded so that 1 = Male and 2 = Female.
Longitudinal results
Longitudinal random-intercept cross-lagged panel models (RI-CLPM) were tested to examine the data at both the between-person (interindividual) and within-person (intraindividual) levels. We examined the relationships between frequency of communication modes and network communication mode diversity, social support, and well-being at each time point.
At the between-person level (interindividual), there was evidence for a high degree of stability over time with significant autoregressive effects for all variables (See Supplementary Figures 1 and 2). Between-person (interindividual) cross-lagged correlations showed that frequency of communication modes and network communication mode diversity were positively related to social support, and social support was positively related to well-being (See Supplementary Figures 1 and 2).
At the within-person level (intraindividual), significant autoregressive effects were found for the frequency of communication modes (ICC = 44.16%, β = 4.1, p < .001), social support (ICC = 60.27%, β = 0.70, p < .001), and well-being (ICC = 56.53%, β = 0.89, p < .001) from time 2 to time 3, which indicated high stability across these variables at the within-person level. No other within-person autoregressive effects were found. For within-person cross-lagged effects, well-being at time 2 positively predicted network communication mode diversity at time 3 (ICC = 22.41%, β = 0.13, p = .003), but other within-person cross-lagged effects were not found.
Structural equation model results
Unstandardized coefficients and indirect effects for structural equation mediation model with frequency of communication modes as a predictor.
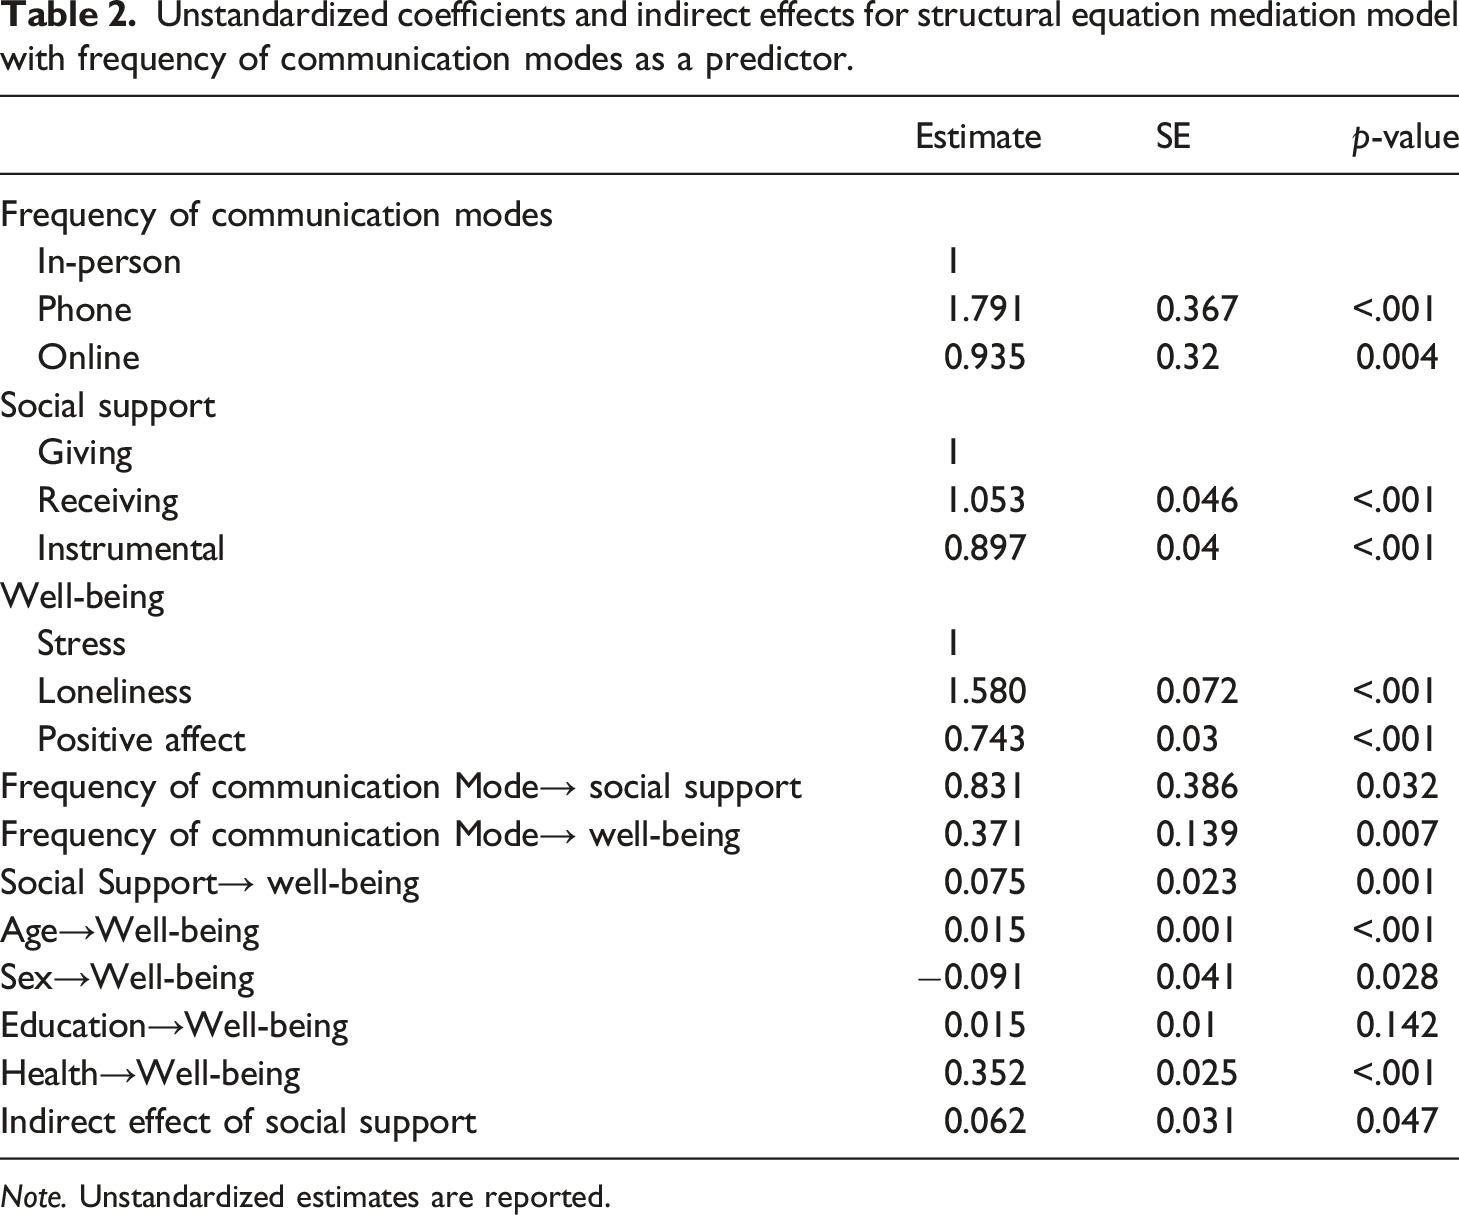
Note. Unstandardized estimates are reported.
Unstandardized coefficients and indirect effects for structural equation mediation model with network communication mode diversity as a predictor.
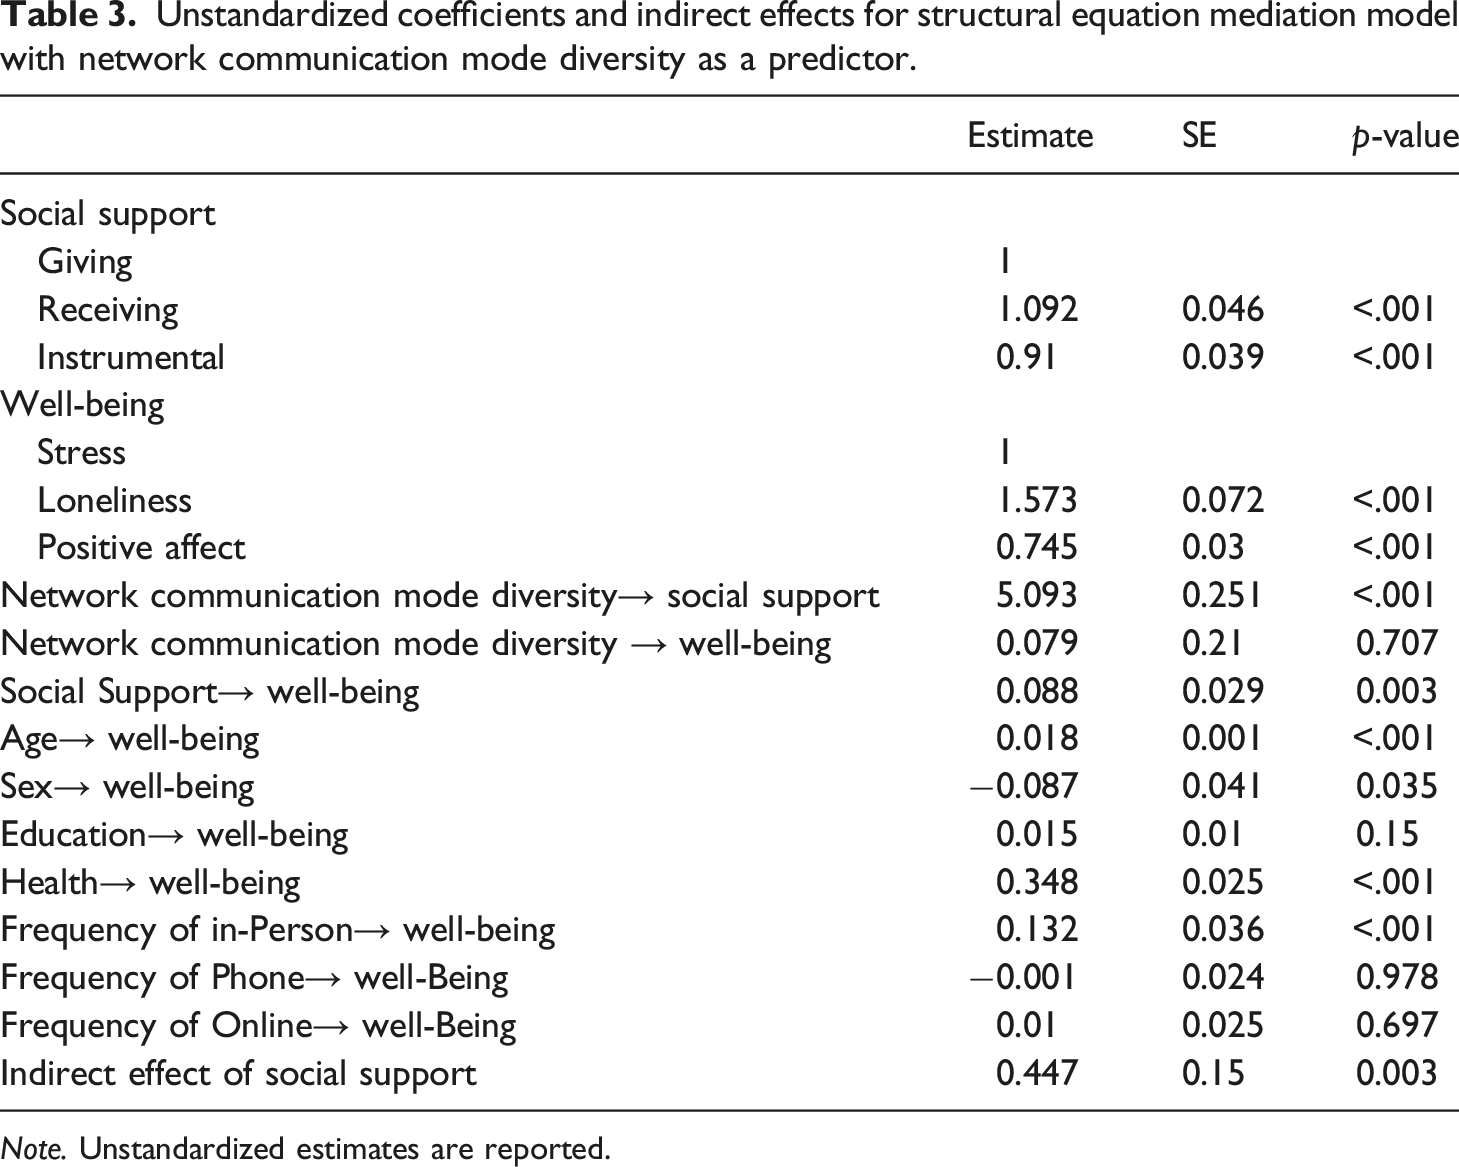
Note. Unstandardized estimates are reported.

Structural equation mediation model: Network communication mode diversity as a predictor.
Frequency of communication modes as a predictor
As predicted, the structural equation mediation model with frequency of communication modes as a predictor (1a) revealed that more frequency of all communication modes (in-person, phone, and online) was related to more social support (β = .19, p = .03) and better well-being (β = .12, p = .007), and more social support was associated with better well-being (β = .11, p = .001). Moreover, there was a significant indirect effect between frequency of communication modes and well-being, mediated by social support (β = .02, p < .05) (Figure 2). In other words, individuals who communicate with more network members using more modes (in-person, phone, online) reported more social support (giving, receiving, and instrument support), which in turn was associated with better well-being (more positive affect and less loneliness and stress).
The multiple group analyses for younger and middle-aged/older adults were conducted by constraining all paths with the frequency of communication modes as a predictor. Results showed a significant model difference (Chi-Square Difference = 36.23 p < .001) (3a). Each path was then constrained to see if any path differed by age. Results showed that the relationship between the frequency of communication modes and social support differed significantly by age (Chi-Square Difference = 25.64, p < .001), in that the frequency of communication mode was positively related to social support for younger adults (β = .16, p = .04), but not middle-aged/older adults (β = .54, p = .07). The paths from social support to well-being (Chi-Square Difference = .79, p = .67) and from the frequency of communication modes to well-being (Chi-Square Difference = .001, p = .98) did not differ by age.
Network communication mode diversity as a predictor
As expected, the structural equation mediation model with network communication mode diversity as a predictor (1b) revealed that more network communication mode diversity was related to more social support (β = .64, p < .001), and more social support was associated with better well-being (β = .12, p = .003). There was no significant direct effect of network communication mode diversity on well-being. However, as predicted, there was a significant indirect effect between network communication mode diversity and well-being, mediated by social support (β = .08, p = .003) (Figure 3). In other words, individuals with higher network communication mode diversity (the breadth and evenness of communicating with network members via different communication modes) reported more social support (giving, receiving, and instrument support), which in turn was associated with better well-being (more positive affect and less loneliness and stress). The multiple group analyses for younger and older adults were conducted by constraining all paths with network communication mode diversity as a predictor, results showed that none of the paths were significantly different for the two age groups (Chi-Square Difference = 16.04, p = .07) (3b).
Additional analyses
Gender differences were explored by conducting a multiple group analysis for both genders by constraining all paths with the frequency of communication modes and network communication mode diversity as predictors. Results showed that none of the paths or models were significantly different for the two gender groups (Chi-Square Difference = 8.1, p = .23 and Chi-Square Difference = 7.71, p = .56, respectively).
Discussion
The goal of the current study was to examine communication mode frequency and diversity (breadth and evenness of communicating with network members via different communication modes) in relation to social support and well-being. Data were from the UCNET (UC Berkley Social Networks Study) dataset, which is a 3-year large dataset that included younger (ages 21–31) and middle-aged/older adults (ages 50–70). Longitudinal results showed a high degree of stability over the 3 years for all variables. Results showed that for the 3-year aggregated variables, greater mode frequency (in-person, phone, and online) and network communication mode diversity were related to better well-being (more positive affect and less loneliness and stress) (1a and 1b), and this relationship was mediated by social support (2a and 2b). Age differences were only found for the relationship between frequency of communication modes and social support, in that the frequency of communication mode was positively related to social support for younger adults, but not for middle-aged/older adults (3a).
The current study adds to the literature in a number of ways. First, past studies used relatively small and convenience samples, while the current study used a 3-year large sample. Second, past studies have often used datasets for general technological trends, with questions limited to general internet use or social media use without specifying the social network members or modes of communication. The current study expands the literature by specifying the communication modes and participants’ social network members. Third, past studies often measured interpersonal communications with just the frequency of communication. To our knowledge, the current study is the first to examine network communication mode diversity with social network members (strong ties) and to test whether social support mediates the relationship between mode frequency and diversity of interpersonal communication and well-being, which could shed light on how the mediation process works. Finally, the two age groups (cohorts) – 21–31 year-olds and 50–70 year-olds from the UCNET dataset also allowed for an exploration of age differences in these relationships.
Mode and diversity of interpersonal communication, social support, and well-being
Consistent with the hypotheses and the literature, a greater frequency of social interaction and the breadth and evenness in communication modes is beneficial to social support and well-being (1a, 1b, 2a, and 2b), which deepens one’s social integration as diverse social activities and relationships can promote positive well-being (Pillemer et al., 2000). Results suggest that beyond the frequency of social interactions via various communication modes with social network members, network communication mode diversity also plays an important role in social support and well-being. This finding could potentially explain the mixed findings in the literature on online communication’s positive and negative relationships with social support and well-being (Ahn & Shin, 2013; Chopik, 2016; Hunt et al., 2018). Studies that found negative relationships between online communication and social support and well-being could be due to the participants using online communication excessively relative to engaging in in-person or phone communication. The lack of network communication mode diversity could be related to less social support and worse well-being. Given the ease of social interactions via multiple communication modes, current study results suggest that utilizing each mode with network members (strong ties) is positively related to social support and well-being. Moreover, the negative relationship between online communication and well-being could also be explained by excess communication with weak ties who could bring more social strain and stress, and the lack of communication with strong ties who could provide better quality of support online. The current study also contributes to a larger discussion about social technology’s role in enhancing the psychosocial needs of younger and middle-aged/older adults, and findings call for future works examining online communication to not only include frequency, but also to incorporate network communication mode diversity as a construct.
Age differences were found in the relationships between frequency of communication modes and social support (3a), but not in the relationships between network communication mode diversity, social support, and well-being (3b). This indicates that compared to middle-aged/older adults, younger adults rely more heavily on the frequency of receiving support and the amount of time they interact with their strong ties. On the other hand, it is not just the frequency of communication modes that is a source of support for middle-aged/older adults; greater diversity of communication modes also benefits their social support and well-being. Interventions aimed at promoting social support and reducing loneliness for middle-aged/older adults can encourage them to utilize various communication modes to contact and maintain their relationships with strong ties, rather than focusing only on one mode (e.g., online-only intervention). Senior centers can also encourage network communication mode diversity among middle-aged/older adults by facilitating multimodal methods for them to connect with each other (e.g., online chat rooms, in-person social events). While the current study addressed mode frequency and diversity for specific social network members that participants are emotionally invested in (strong ties), future work can examine mode frequency and diversity for weaker ties and compare their associations with social support and well-being.
An explanation for the lack of age differences between the frequency of communication mode/diversity in relation to well-being (3b) could be because participants actively engage with their social network members (strong ties) online rather than passively scrolling through online platforms. Past studies have shown that active interactions with others online are related to better well-being, while passively consuming information online is related to worse well-being (Liu et al., 2019; Yoon et al., 2019). It also adds to the mixed literature on the positive and negative relationships between online communication and social support and well-being for younger adults, suggesting that regardless of age, actively engaging online with one’s social network members (strong ties) can have positive implications for one’s social support and well-being. Policymakers and practitioners can also encourage people of all ages to actively use technology in a healthy way to interact with strong ties for more support and better well-being. While there has been a widely held notion that reducing screen time can be beneficial for well-being (Wang et al., 2019), given the importance of network communication mode diversity, it may be beneficial to promote the use of multiple communication modes rather than to exclusively rely on one mode or to eliminate a specific mode (e.g., online communication).
Limitations and future directions
The longitudinal random-intercept cross-lagged panel models (RI-CLPM) showed that a significant longitudinal within-person relationship was only found for well-being at time 2 positively predicting network communication mode diversity at time 3. This result suggests that one’s network diversity can be influenced by one’s psychological well-being and suggests reciprocal relationships should be considered in future work. Given the limited change and high stability of variables over the 3 years, there was little in the way of individual differences in change to explore, and data were averaged across occasions. Given the correlational nature of the data, directionality cannot be confirmed, and longer-term studies will be needed to address reciprocal relationships.
Participants were asked to list their strong ties each year for the current study, which also serves as a limitation as stable relationships are less prone to change in quantity on a yearly basis compared to weaker ties (Cornwell et al., 2015; Wrzus et al., 2012), and thus could potentially explain why no other longitudinal relationships were observed. Moreover, studies have found that it may not just be the quantity, but the quality and satisfaction of social relationships that are tied to well-being over time (Bruine de Bruin et al., 2020; Cornwell et al., 2014). Future studies could incorporate both the quantity and quality of social relationships. As the current generation continues to age and adopt technology to communicate with network members, future research could examine the relationships between mode frequency, network communication mode diversity, social support, and well-being over a longer-term longitudinal level (e.g., over 10 years) to detect change over time.
Another limitation of the current study is that the dataset only allows each participant to report up to five network members, which might obscure variation between participants with a social network of fewer than five persons and those with a larger network of more than five people. Moreover, participants self-reported the frequency of social interaction with social network members over the past year, which is over a long period of time for participants to recall (Scharkow, 2016). Unfortunately, to our knowledge, current tools that exist to measure frequency of communication objectively using a device only provide an aggregated total hours and minutes users spent on each platform, rather than giving specific total time users spent engaging with network members. Moreover, given the ease to communicate with one network member via various modalities, it is difficult to assess the frequency of each mode objectively. The results of the current study call for more studies utilizing research methods that can shorten the time span to reduce errors that may be due to retrospective recall (e.g., experience sampling or ecological momentary assessment) to better assess social interactions via various modes and network communication mode diversity and their relations to social support and well-being.
The findings of the current study also serve as a basis for future studies to examine the roles of mode frequency and network communication mode diversity on social support and well-being for adulthood, particularly because the dataset used for the current study did not include adults ages 31–49. Adulthood is a pivotal period to balance between the positive and the negative aspects of their relationships and roles, and to bridge the younger and older generation (Lachman et al., 2014). They have to balance their own psychological and physical changes and demands while being responsible for the welfare of others (e.g., caring for their children and aging parents). They also play essential roles in their family and work settings. Even though such social relationships can contribute to their positive well-being, these roles can also be a source of strain and stress (Almeida & Horn, 2004). Given the wide range of roles and interactions in various contexts for adults ages 32–49 (Lachman et al., 2014), future work could examine the relationships between mode frequency and diversity of interpersonal communication, social support, and well-being in this age group.
Conclusion
The current study explored whether social support mediates the relationship of mode frequency and diversity with well-being for younger and middle-aged/older adults using a 3-year dataset. The present study contributed to the literature by demonstrating that not only mode frequency of interpersonal communication, but more network communication mode diversity (breadth and evenness of communicating with network members via different communication modes) was also related to more social support and better well-being. Current findings provided future research directions geared toward more understanding of the mode frequency and network communication mode diversity constructs and how they relate to various psychosocial outcomes. The current study also contributes to a larger discussion about social technology’s role in enhancing the psychosocial needs of younger and middle-aged/older adults and their overall quality of life.
Supplemental Material
Supplemental Material - Diversity of network communication mode and interpersonal interactions: Relationship with social support and well-being
Supplemental Material for Diversity of network communication mode and interpersonal interactions: Relationship with social supportand well-being by Xin Yao Lin and Margie E. Lachman in Journal of Social and Personal Relationships
Footnotes
Funding
The author(s) disclosed receipt of the following financial support for the research, authorship, and/or publication of this article: This work was supported by the UC Berkley Social Networks Study, which was funded by the National Institute on Aging, R01 AG041955. The first author also acknowledges support from a National Institute on Aging (NIA)-funded T32 Training Program in Behavioral Geriatrics [NIA T32 AG049666].
Data availability
Open research statement
As part of IARR’s encouragement of open research practices, the authors have provided the following information: This research was pre-registered. The research questions, hypotheses, methods, and analyses of the current study were originally pre-registered prior to conducting the research on Open Science Framework. The data used in the research are publicly posted. Publicly available data from the UC Berkley Social Networks Study were used for this research and can be accessed here: ![]() .
.
Supplemental Material
Supplemental material for this article is available online.
References
Supplementary Material
Please find the following supplemental material available below.
For Open Access articles published under a Creative Commons License, all supplemental material carries the same license as the article it is associated with.
For non-Open Access articles published, all supplemental material carries a non-exclusive license, and permission requests for re-use of supplemental material or any part of supplemental material shall be sent directly to the copyright owner as specified in the copyright notice associated with the article.