



Abstract
Instrument measurement conducted with Rasch analysis is a common process in language assessment research. A recent systematic review of 215 studies involving Rasch analysis in language testing and applied linguistics research reported that 23 different software packages had been utilized. However, none of the analyses were conducted with one of the numerous R-based Rasch analysis software packages, which generally employ one of the three estimation methods: conditional maximum likelihood estimation (CMLE), joint maximum likelihood estimation (JMLE), or marginal maximum likelihood estimation (MMLE). For this study, eRm, a CMLE-based R package, was utilized to conduct a dichotomous Rasch analysis of a Yes/No vocabulary test based on the academic word list. The resulting parameters and diagnostic statistics were compared with the equivalent results from four other R-based Rasch measurement software packages and Winsteps. Finally, all of the packages were utilized in the analysis of 1000 simulated datasets to investigate the extent to which results generated from the contrasting estimation methods converged or diverged. Overall, the differences between the results produced with the three estimation methods were negligible, and the discrepancies observed between datasets were attributable to the software choice as opposed to the estimation method.
Rasch measurement (Rasch, 1960) entails the application of data recorded with a measurement instrument, such as a vocabulary test, to one of the family of Rasch models to determine the extent to which the data meet the probabilistic expectations of the model. To that end, data are fit to a statistical model using a mathematical formula that predicts the probability of success on an item based on the item’s difficulty and the person’s ability. The item difficulty and person ability estimates are log-transformed and reported as log odds units, or logits. In an unachievably perfect model of a vocabulary test, every participant is expected to respond correctly to every item judged as being below their ability, and incorrectly to every item deemed beyond their capability. The results of Rasch analysis provide evidence regarding the construct validity of an instrument, indicating the extent to which it meets the model’s expectations and can claim to be an invariant measure of the unidimensional construct that it pertains to. If the results recorded with the instrument are judged to meet the expectations, the analysis also enables the conversion of raw test and questionnaire scores into an interval-scale measure of the latent unidimensional construct, in which the distance between the units on the scale remains equal along the measure. The original Rasch model was created for the analysis of dichotomous data. Over time, more complex models capable of handling polytomous data with multiple responses were developed, such as the rating scale model (RSM; Andrich, 1978), for ordinal data scored in three or more categories.
When conducting Rasch analysis, researchers can choose from a range of software. In a comprehensive review of Rasch measurement in language assessment, Aryadoust et al. (2021) synthesized information from 215 studies involving Rasch analysis published in 21 Scopus-listed applied linguistics and language assessment journals before December 2019. They reported that 23 different software packages were utilized, with the most frequent being Facets (Linacre, 2020), followed by Winsteps (Linacre, 2021c). Of the remaining 21 software packages that were reported in the sample, none were packages associated with R, an open-source computer language for statistical analyses (R Core Team, 2021).
R has been promoted as an important tool for language researchers (e.g., Mizumoto & Plonsky, 2016), offering several key advantages in comparison with other software packages, including the facilitation of replication, the creation of publication quality graphics, and access to over 17,000 R packages. These packages are extensions for R developed by third parties and cover the simplest to the most complex of analyses. According to a survey by Govindasamy et al. (2020), 16 packages have been designed for Rasch analysis with R, including the Extended Rasch Modeling (eRm; Mair & Hatzinger, 2007a), mixRasch (Willse, 2011), Polytomous and Continuous IRT (pcIRT; Hohensinn, 2018), Test Analysis Modules (TAM; Robitzsch et al., 2020), and Latent Trait Models under IRT (ltm; Rizopoulos, 2006) packages. Considering that no language testing studies have conducted an R-based Rasch analysis, in this study, we report on Rasch analysis of a Yes/No vocabulary test conducted with the eRm package and compare the resulting statistics with their equivalents from Winsteps and four other R-based Rasch analysis packages. In addition, we assess the effect that three different Rasch estimation methods utilized by these five packages have on the resulting statistics.
Rasch measurement estimation methods
During Rasch analysis, the item difficulty and person ability parameters are calculated through a statistical process called estimation. Although there are numerous types of estimation, most modern Rasch analysis software involves a form of maximum likelihood estimation (MLE; Fisher, 1925). MLE involves a set of equations formulated to provide item and person parameters that maximize the likelihood of acquiring a set of observed data with the statistical model that was utilized (Engelhard, 2013). These equations are iterative, whereby they require multiple steps that are repeated, or iterated, until the difference between the parameter values being estimated with each iteration is negligible. Once the difference between the iterations is less than a pre-stated criterion, such as 0.001 (Engelhard, 2013), the value displaying the greatest likelihood of producing the observed data is identified (see De & Ayala, 2009, for a detailed step-by-step description of the MLE process and equations). According to De Ayala (2019), the three most commonly utilized estimation methods comprise conditional maximum likelihood estimation (CMLE), joint maximum likelihood estimation (JMLE), and marginal maximum likelihood estimation (MMLE), which are now considered in turn.
The first of the Rasch estimation measures investigated in this study is CMLE (Rasch, 1960), which is employed by the eRm and pcIRT packages to estimate item difficulty. The “conditional” term in the CMLE acronym relates to person-free assessment, indicating that person parameter estimations are “conditioned out” of the item parameter equations. Person estimations are removed because they lack consistency and thus display bias (i.e., do not conform to the expectations of the model). Their lack of precision in comparison with item estimates is a product of instruments typically comprising a smaller number of items than test takers (Engelhard, 2013); thus, more information is available for item estimates. To that end, person estimates constitute a “nuisance parameter” (Andersen, 1973, p. 124), and the participants’ raw scores are assumed sufficient for item parameter estimation (Mair & Hatzinger, 2007b). Despite this, person parameter estimates are provided by CMLE, but are not calculated until the item difficulties are settled upon, thus the outcomes should be interpreted with caution if person ability is a variable of interest. Alternatively, person parameters can be estimated by transposing the data so that the items are conditioned out instead of the persons (e.g., Linacre, in press). CMLE also lacks the flexibility with missing data of other estimation methods, especially with the large datasets that are common in modern research (Linacre, in press), and is computationally inefficient compared to other estimation methods (Engelhard, 2013). Counter to these flaws, CMLE produces statistically consistent item estimates (Linacre, 2021a), which indicates that the procedure is applicable to datasets of all sizes. CMLE also produces more precise residuals and fit statistics than other methods because they are estimated without person bias (Müller, 2020). It is also the only estimation method satisfying the specification for specific objectivity (Rasch, 1977, cited in Mair & Hatzinger, 2007b), which requires that item estimates not be sample reliant.
The second Rasch estimation method compared in this study is JMLE (Wright & Panchapakesan, 1969), which is utilized by Winsteps, mixRasch, and TAM. Unlike CMLE, the JMLE equations take person parameters values into consideration, resulting in simultaneous item and person parameter estimation, hence the term “joint.” Along with the inclusion of simultaneously estimated person parameters, JMLE estimation is computationally efficient in comparison with CMLE (Willse, 2011), robust against missing data, and capable of handling instruments and samples of any length and size (Linacre, 2021a). Although JMLE simultaneously calculates person and item estimates, which is ideal for researchers interested in participant ability, it is a double-edged sword in the sense that person parameters are nuisance parameters that are susceptible to bias with short instruments (Linacre, 1999b), for instance those comprising less than 25 items (De Ayala, 2019). However, this bias is accounted for in software, such as Winsteps, through the incorporation of Wright and Douglas’ (1977) JMLE correction and can also be countered with larger samples, which entail more information for precise item estimation. Furthermore, in a simulation study, Robitzsch (2021) found that the bias “vanished” (p. 4) once the instrument length was increased to 30 items.
The final Rasch estimation method for comparison is MMLE (Bock & Aiken, 1981), which can be calculated with the TAM and ltm packages. In contrast to CMLE and JMLE, MMLE assumes that the person parameters conform to a specified distribution. The assumed person parameter distribution is then utilized in the item estimation as opposed to person parameters, which allows the person parameters to be integrated out, or “marginalized” from the likelihood resulting in a “so-called marginal likelihood” (Glas, 2016, p. 198). Typically, a normal, Gaussian distribution is assumed, although multivariate and empirical Bayesian distributions are also acceptable (Linacre, 1999b). In cases when an incorrect distribution is specified, the estimates become biased. When the correct distribution is specified, however, MMLE parameters become asymptotically equivalent to CMLE (Pfanzagl, 1994; cited in Mair & Hatzinger, 2007a), implying that the results are essentially the same. Beyond the distribution assumption, MMLE has been described as more feasible in terms of computational efficiency than other methods of estimating items independently of persons (Baker & Kim, 2004), extremely flexible with missing data, and similar to CMLE in providing exact fit statistics along with statistically consistent item estimates (Linacre, 2021a). These qualities are attributable to the removal of person parameters from the item estimation equations.
The three MLE methods outlined above and summarized in Table 1 have contrasting benefits and drawbacks, which can have consequences for language testing researchers conducting Rasch analysis with R. For instance, a researcher interested in the person parameters obtained from an instrument would be advised to select a package that utilizes JMLE, whereas a researcher investigating a relatively short instrument should choose a package that utilizes either CMLE or MMLE. Alternatively, a researcher who is aware that their participants’ test scores are negatively skewed should avoid MMLE because it assumes a Gaussian distribution (unless they are familiar enough with their chosen package to program the estimation of an alternative distribution, which is beyond the scope of this study). Language testing researchers should be aware of the effects these choices might have on their results, which is an aim of this study.
Summary of estimation methods.
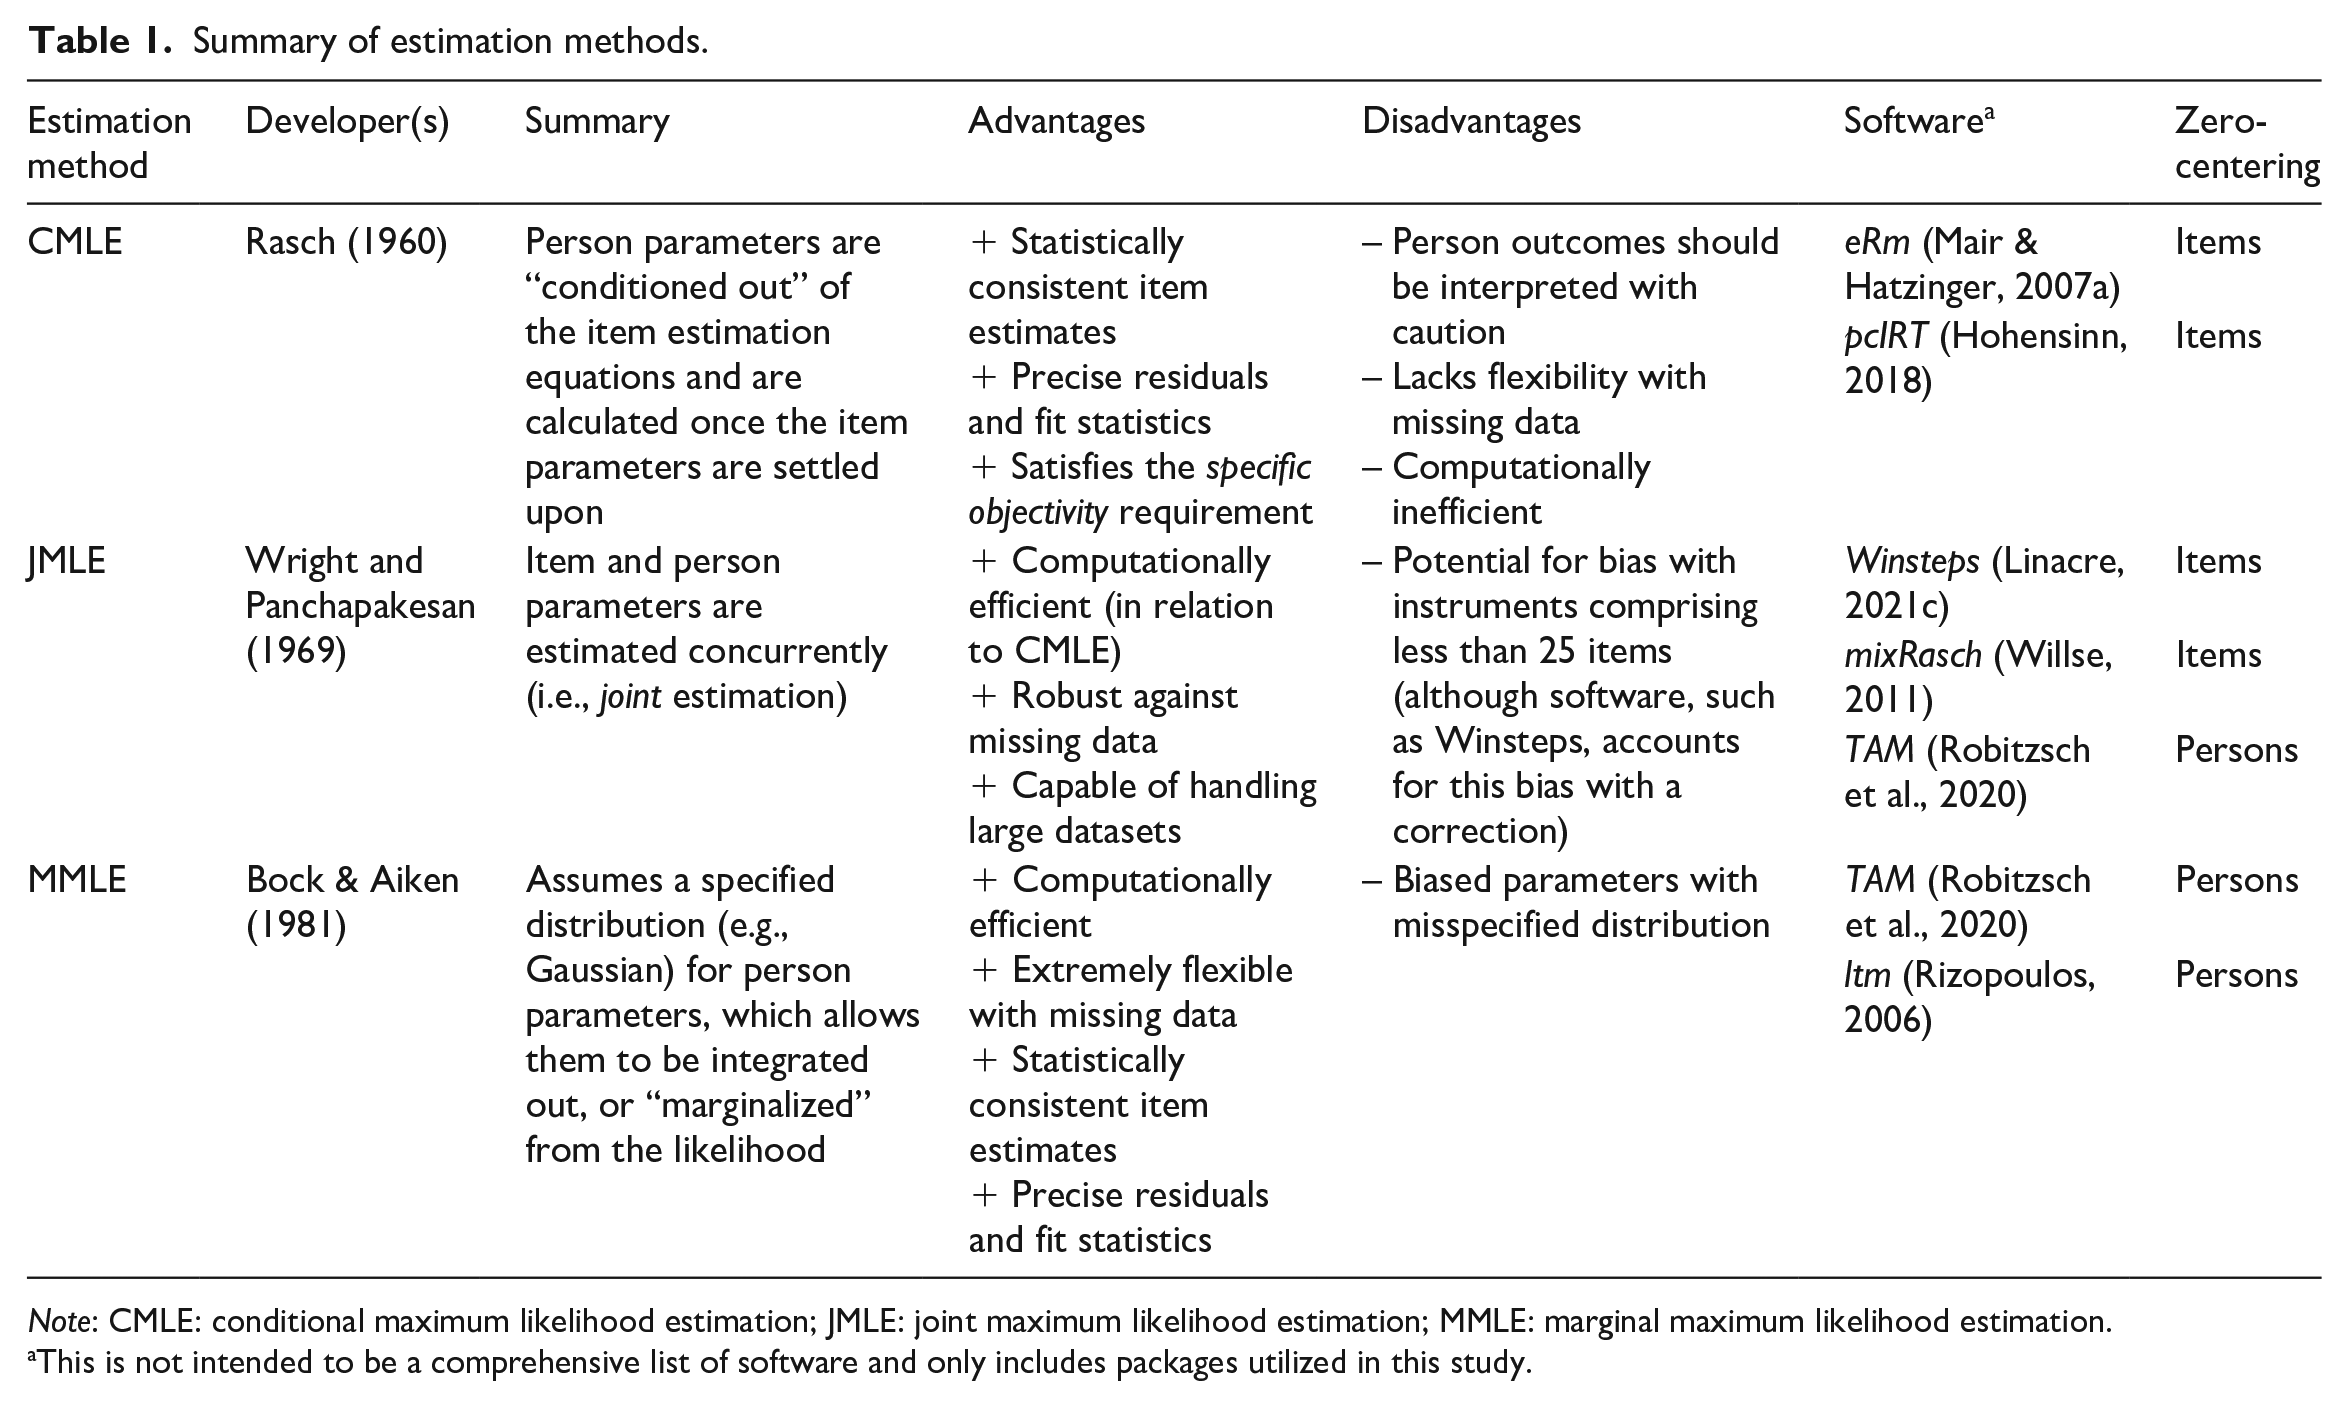
Note: CMLE: conditional maximum likelihood estimation; JMLE: joint maximum likelihood estimation; MMLE: marginal maximum likelihood estimation.
This is not intended to be a comprehensive list of software and only includes packages utilized in this study.
It is also important that researchers know about the R packages that they are using. For example, in Rasch analysis, the mean of the items is conventionally anchored at zero (Engelhard, 2013), which is the case with packages such as eRm and Winsteps. This allows an intuitive interpretation of the logits because items with a value of 0.00 are equally as probable to be responded to with a “0” or “1,” while the difficulty of an item can be inferred by its distance from zero. However, packages that are not only dedicated to Rasch analyses, such as ltm and TAM, might set the person’s mean at zero instead (although TAM provides individual item logits for both zero-centered persons and items). Language testing researchers should be aware of this before choosing a package to avoid misinterpreting their results. We must emphasize that each estimation method and R package has benefits depending on the sample, instrument, and researcher’s goals, and we are not attempting to frame one method as “better” than any of the others.
The present study
In this study, Rasch analyses utilizing these three estimation methods are conducted on data collected with a Yes/No vocabulary test created with words from the Academic Word List (AWL; Coxhead, 2000). The AWL comprises 570 word families that were extracted from a 3.51 million word corpus of academic texts and that lay outside of the 2000 most frequent English words according to West’s (1953) General Service List. The AWL-based Yes/No vocabulary test was specifically developed for a conceptual replication of Hashimoto and Egbert (2019). Conceptual replications involve attempting to repeat a study’s findings with theoretically grounded methodological alternations (e.g., Hiver & Al-Hoorie, 2020). The authors of the original study investigated the lexical sophistication variables that predict word difficulty and concluded that word difficulty is determined by “more than frequency.” The rationale for the replication study was to determine whether Hashimoto and Egbert’s conclusion was applicable when the sample and target items are specific to a functional area of the target language, which in the case of the replication was English for academic purposes (EAP) programs in Japan and Saudi Arabia. In a Yes/No test, participants are presented single words and are instructed to indicate whether or not they “know” the word by answering yes or no. Thus, the construct of interest for this test is form recognition of common academic vocabulary items. To deliberate the extent to which participants overestimate their vocabulary knowledge, a number of the words are pseudowords, for example, bastionate, which are created to resemble plausible words in the target language both orthographically and phonologically. They are utilized in Yes/No tests to ensure test takers are answering carefully (Pellicer-Sánchez & Schmitt, 2012). The fact that the instructions for Yes/No tests are cognitively undemanding and a large number of items can be administered in one sitting constitute advantages for this type of vocabulary test over other formats (Hashimoto, 2021).
For the AWL-based Yes/No test results to be considered appropriate for use in the conceptual replication, evidence was collected to determine the extent to which the test adhered to the following criteria: (a) an appropriate difficulty level for the intended participants, (b) items that are targeted to the construct of interest, which in this test was form recognition of common academic vocabulary items, (c) evidence of reliability as an interval-level measurement instrument, and (d) evidence of invariance across measurement contexts. To assess whether the AWL-based Yes/No test satisfied these criteria, dichotomous Rasch analysis was conducted with the eRm package on test results from students at three universities in two countries. The eRm package is versatile and can perform numerous Rasch analyses, such as the dichotomous model and the RSM. The package was deemed suitable for this study because the CMLE method that it utilizes places emphasis on accurate item parameters, which reflected the focus of the study that the AWL-based Yes/No test was designed for (Vitta et al., under review).
Following the eRm analysis, the resulting parameters were compared with the Winsteps parameters estimated for the same dataset, and also with the parameters estimated with four more Rasch analysis packages, comprising ltm, mixRasch, pcIRT, and TAM, to assess the extent to which the results converged or diverged. The packages were selected following Linacre’s (2021b) recommendation to ensure that item parameters estimated with R packages are obtained from at least two packages. The estimations from the selected packages provide two or more sets of item estimations for each of three types of estimation method; CMLE, JMLE, and MMLE (see Table 1 for a summary of each estimation method and associated packages). The item parameters estimated with eRm were also utilized in the construction of 1000 simulated datasets, which were created with the pcIRT package. The datasets were submitted to Rasch analysis with five R packages and Winsteps to compare the resulting item parameters and diagnostic statistics. We should restate that our aim is not to champion one software package as “better” than the others; each package holds advantages and disadvantages depending on the data collected. The aim is purely to compare the results produced by the packages when presented with identical data.
This study is not the first to compare Rasch estimation packages. In a technical study, Robitzsch (2021) simulated 5000 datasets, with item number varying between 10 and 30, and sample sizes varying between 100 and 1000, and compared estimation methods, including CMLE, JMLE, and MMLE. He found that the biased parameters produced by JMLE with a 10-item test disappeared once the length was increased to 30. Robitzsch’s simulation also suggested that there was no significant difference in the results whether 100 or 1000 people were simulated, and that only modest differences existed between the estimation methods. However, none of the Rasch analysis packages involved in this study were utilized. In contrast, eRm, ltm, and TAM were compared in a medical study conducted by Robinson et al. (2019) with a dataset comprising responses to a wrist-joint pain questionnaire, revealing both consistencies and inconsistencies between the packages when conducting RSM Rasch analysis. The inconsistencies were traceable to the varying threshold calculations employed by the programs. Finally, Linacre (in press) compared Rasch estimation methods with data from a phobia intensity questionnaire. The results suggested that CMLE, JMLE, and MMLE results calculated with Winsteps, eRm, ltm, and TAM were comparable, although Linacre’s study involved a relatively short, 15-item instrument and RSM analysis. In conclusion, although similar undertakings have been published in other fields, as far as we are aware this is the first comparison of Rasch estimation methods between traditional and R-based software packages in language testing research and the first to utilize simulated data for such a comparison.
Research questions
To what extent do the CMLE derived item/person parameters and diagnostics estimated with eRm converge/diverge with the equivalent results derived from JMLE and MMLE?
To what extent do the item/person parameters and diagnostics estimated with CMLE, JMLE, and MMLE converge/diverge across 1000 simulated datasets?
Methodology
Participants
The Yes/No test data were collected from students in advanced English classes at three universities spread across two countries; two in Japan and one in Saudi Arabia. In total, 238 freshman students comprising five intact classes from the three universities were asked to complete the test. Of the 238, three participants declined consent and 10 were removed for completing the test outside of class hours, leaving a sample of 225 participants, with 132 from Japanese universities and 93 from a university in Saudi Arabia. Two of the participants at the Japanese universities were Chinese and two were Korean. All participants were enrolled in advanced academic English classes with a prerequisite of demonstrating target language (English) proficiency of B1 or above according to the Common European Framework of Reference for Languages (CEFR; Council of Europe, 2001). This was deemed a necessary inclusion criteria because the target vocabulary items were extracted from the AWL and were thus academic in nature. Following recent recommendations (e.g., Vitta et al., 2021), a multi-site sample was also considered important for generalizability.
The AWL-based yes/no test
The AWL-based Yes/No test utilized in this study was specifically designed for a conceptual replication of Hashimoto and Egbert (2019) investigating the effect of a set of empirically determined lexical sophistication variables on academic word knowledge (Vitta et al., under review). In total, the instrument comprised 108 randomly selected words from sublists 5 through 10 of the AWL, with 16 words from each of sublists 5 through 9, and 18 words from set 10. Words with more than one word class, for example, panel (v) and panel (n), were excluded from the selection process. In addition, 72 pseudowords from Hashimoto and Egbert (2019) were incorporated into the instrument to assess evidence of guessing. Hashimoto’s pseudowords were derived from the 2000 to 4000 frequency bands according to the Corpus of Contemporary American English (COCA; Davies, 2008). All 180 words, plus eight practice items, were administered to the participants in a randomized order through a Google Form, which included a consent form and instructions written in Japanese or Arabic depending on the test site location. Each word constituted an item, and participants were instructed to click a radio button representing yes or no depending on whether or not they “knew” the word. All responses were automatically saved to a spreadsheet for analysis.
Analysis
The initial Rasch analysis of the AWL words comprising the Yes/No test was conducted with the CMLE method through the eRm package. Analysis with eRm was deemed appropriate due to its emphasis on the item parameter estimates, which was analogous to rationale for the test’s construction (Vitta et al., under review). This analysis was required to obtain a dataset comprising items and persons that met the expectations of the Rasch model. The resulting dataset was then analyzed with the other packages to compare the results. Before the initial analysis was conducted, a 10% false alarm cutoff was administered (e.g., Schmitt et al., 2011), whereby participants who responded affirmatively to more than seven pseudowords were removed. The cutoff enabled the removal of participants who had overestimated their knowledge or were not concentrating on the task (Zhang et al., 2020). Following the removal, the data for 165 participants were carried forward for the initial eRm Rasch analysis.
The eRm Rasch analysis was an iterative process aimed at enhancing the accuracy of the instrument through the elimination of items that aroused unwanted, idiosyncratic behavior in test takers, such as guessing answers to challenging items, which hinder the construction of reliable measurement (Linacre, 1999a). To ascertain the test items’ and participants’ adherence to the Rasch model’s expectations, mean square (MNSQ) fit statistics were reported and analyzed. MNSQ fit statistics are calculated from the residuals, which represent the distance between an observed data point and the model’s expectation, and are squared to provide positive values. Rasch programs report two MNSQ fit statistics; outfit and infit. Outfit MNSQ statistics are unweighted and are thus more influenced by unexpected responses (i.e., outliers). Infit MNSQ statistics are weighted to account for this, but the weighting procedure renders them more influenced by responses that fit the model too well (i.e., “too good to be true,” Bond et al., 2020, p. 36). A MNSQ value of 1.00 constitutes ideal fit, while a value of 1.60 signals 60% more variance than expected (Bond et al., 2020). In this study, Wright and Linacre’s (1994) liberal MNSQ thresholds for productive measurement of between 0.50 and 1.50 were adopted to provide a consistent criterion across the 1000 simulated datasets. However, thresholds can be derived from the observed data using formulae (e.g., Smith et al., 1998) or bootstrapped confidence intervals (Wolfe, 2013). The main concern was underfitting items (i.e., >1.50), which are detrimental to measurement. Small infit (i.e., <0.50) was considered acceptable because it represents an item overfitting the model (i.e., too well) and a small number of such items are unlikely to have practical implications in human sciences (Bond et al., 2020).
The responses for all items and persons with outfit MNSQ greater than 1.50 were individually examined to determine why they were misfitting, and a decision to eliminate or retain for proceeding iterations was made. The aim of the analysis was item retention, thus misfitting items were only considered for removal if (a) their inclusion resulted in misfit for two or more persons, (b) they displayed erratic answer patterns, or (c) they were answered correctly by every test taker. The items that were eliminated were not bad items per se; they generally misfit due to careless errors by high ability participants or lucky guesses by low ability participants. Nicklin (2021) contains the R script detailing the items and persons that were removed at each iteration and is hosted on the Open Science Framework (OSF).
Following the final iteration, evidence was collected pertaining to the AWL-based Yes/No test’s (a) appropriateness for the sample, (b) capacity to measure the construct of interest, and (c) alignment with the Rasch model’s expectations. These attributes were assessed with recourse to item and person parameters, Wright maps, descriptive statistics, and fit statistics. In addition, the test’s invariance across samples was assessed with Andersen’s (1973) likelihood ratio (LR) test, which is a goodness of fit test that compares two sets of item difficulties acquired from two different groups. The LR test is a CMLE-driven method (Alexandrowicz & Draxler, 2016) and involves ordering the participants by logit-based ability on a spreadsheet and separating them into two groups; odd rows and even rows. The results of the two groups are assessed with the LR test to determine whether the item difficulties remain stable.
To address the first research question (RQ1), the item and person data comprising the final eRm model were subjected to analysis with alternative Rasch measurement software packages. Eight additional sets of item parameters were estimated with the pcIRT, Winsteps, mixRasch, TAM, and ltm packages. CMLE-based item parameters were obtained with the pcIRT package, which resulted in two sets of CMLE-based parameters including the eRm parameters from the initial analysis. JMLE-based item parameters were calculated with mixRasch, TAM, and Winsteps. The default setting for mixRasch limits the item difficulty logits to −4 and 4 to improve the fit of extreme scores. Thus, an additional set of mixRasch item results was calculated with the limit increased to −6 and 6 for comparison, which was achieved by adding maxrange = c(−6,6) to the mixRasch() R function. MMLE-based parameters were calculated with TAM and ltm, with histograms plotted to ensure that the person parameters fulfilled the MMLE Gaussian distribution assumption. With both item and person ltm Rasch analyses, an additional analysis was conducted with a constraint imposed for each dataset, df, using the following script: rasch(df, constraint = cbind(length(df) +1, 1)). This was considered necessary because typical Rasch analysis assumes equal discrimination between the items with a discrimination parameter set to 1. Without imposing this constraint, ltm estimates this discrimination parameter and applies it to model, which arguably results in a non-Rasch model.
Nine sets of person parameters were also estimated from the packages investigated in this study. Two sets of CMLE-based person parameters were calculated with eRm. The first set of person parameters was estimated once the item parameters were finalized (i.e., the persons were conditioned out of the process). The second set of person parameters was estimated by transposing the data frame containing the AWL-based Yes/No responses and performing an analysis that conditioned out the items instead of the persons (e.g., Linacre, in press). The same procedure was utilized to estimate person parameters with pcIRT. It should be noted that unlike JMLE, CMLE is an asymmetric analysis in the sense that conditioning the items out of the equation results in different item estimates compared with item estimates produced when the persons are conditioned out.
The JMLE-based person parameters were obtained from mixRasch, TAM, and Winsteps, while the MMLE-based person parameters were calculated with TAM and ltm. As with the pcIRT person estimates, the MMLE person parameters estimated with TAM were obtained by conditioning out the items with a transposed dataset. Histograms were plotted to ensure that the item parameters fulfilled the Gaussian distribution assumption. It should be noted that with TAM, the MMLE person parameters are calculated with weighted likelihood estimation (WLE; Warm, 1989), which employs the mean likelihood values instead of the maximum to correct for potential skewness that can bias estimations (Linacre, 2021a). Furthermore, the tam.fit() function for estimating fit statistics resulted in infinite values with the JMLE-based TAM analyses. To counter this, the JMLE fit statistics were calculated with the tam.jml.fit() function for items and the tam.personfit() function for persons (see Robitzsch et al., 2020 for details of the functions).
Finally, to answer the second research question (RQ2), 1000 simulated datasets were created with the simDRM() function from pcIRT package and then subjected to Rasch analysis. The simDRM() function takes a set of item logits and simulates dichotomous Rasch model data for a specified number of participants with a Gaussian distribution. In this study, 1000 datasets were simulated according to the specifications of the original dataset by utilizing the logits produced by the initial eRm analysis. Following the simulation of each dataset, Rasch analysis was conducted with Winsteps and five R packages. CMLE-based analysis was conducted with eRm and pcIRT, JMLE-based analysis was conducted with Winsteps, TAM, and mixRasch, and MMLE-analysis was conducted with TAM and ltm. Anderson’s (2015) r2Winsteps package was utilized to conduct Rasch analysis with Winsteps in R.
For all of the analyses pertaining to RQ1 and RQ2, the parameters of interest comprised logits, SEs, infit MNSQs, and outfit MNSQs, and for each of these statistics means, SDs, maximum values, minimum values, and range of values were recorded. Due to space restrictions, only one set of misfit statistics was examined, thus MNSQ square fit statistics were preferred to t-scores. According to Bond et al. (2020), t-scores concern the likelihood of the data being observed given a perfect model while MNSQs relate to the impact of the misfit, which was of greater interest for this study. MNSQ fit statistics were not provided by the pcIRT and ltm packages and were thus omitted from analyses. Once all of the relevant items and person parameters were calculated, the results from the different estimation methods and packages were compared through descriptive statistics and boxplots.
Results
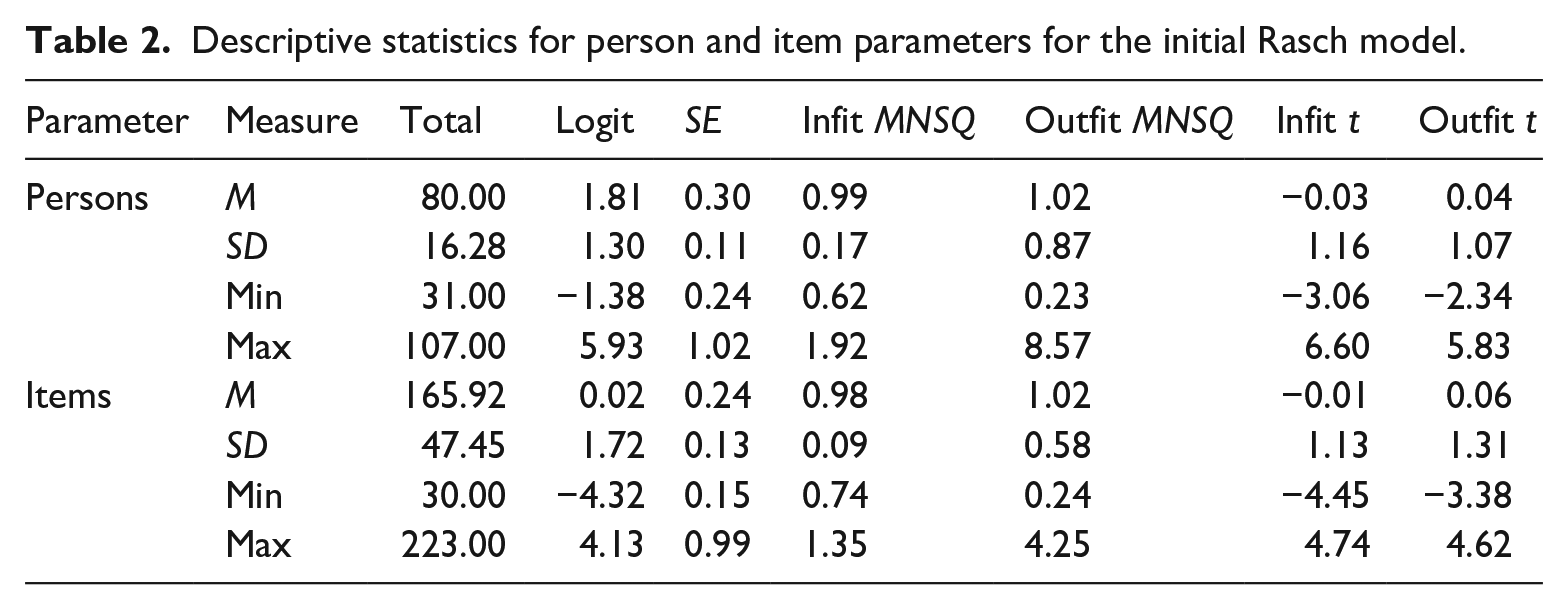
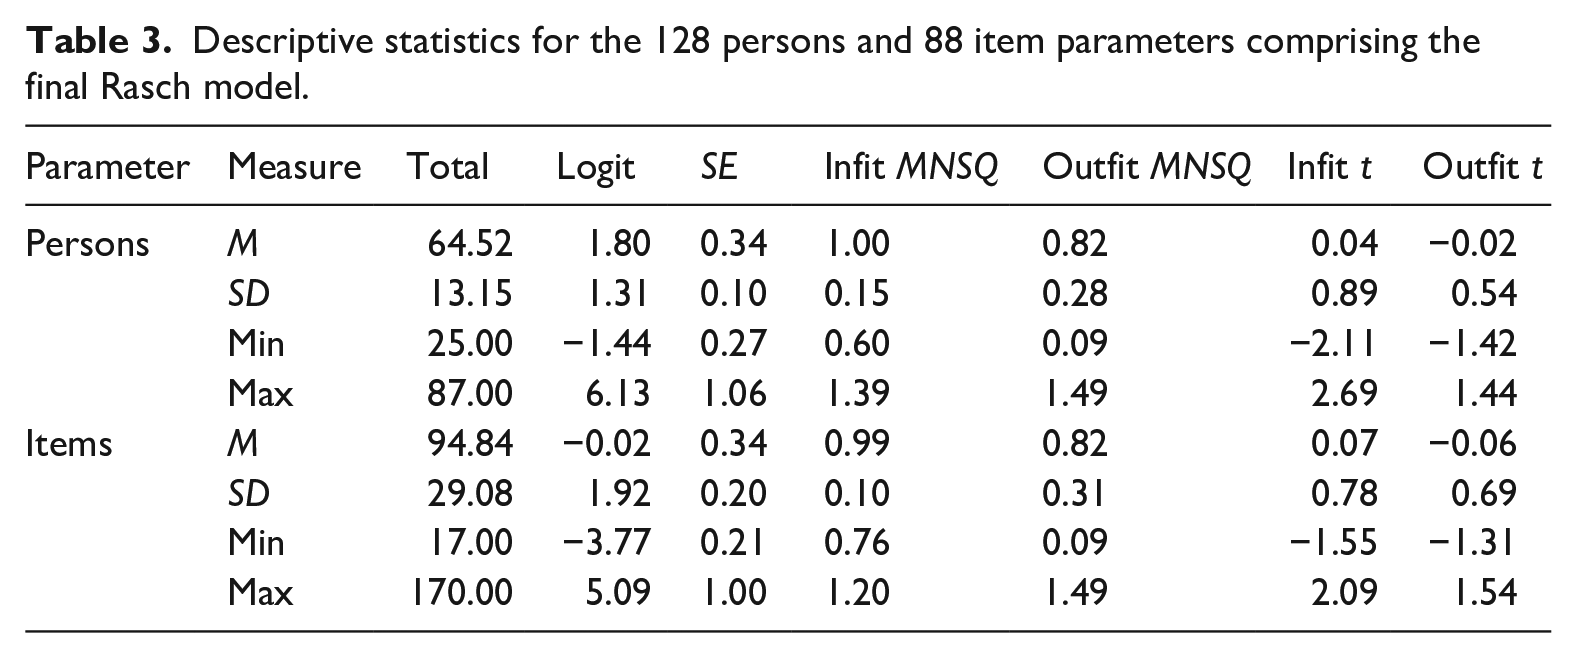
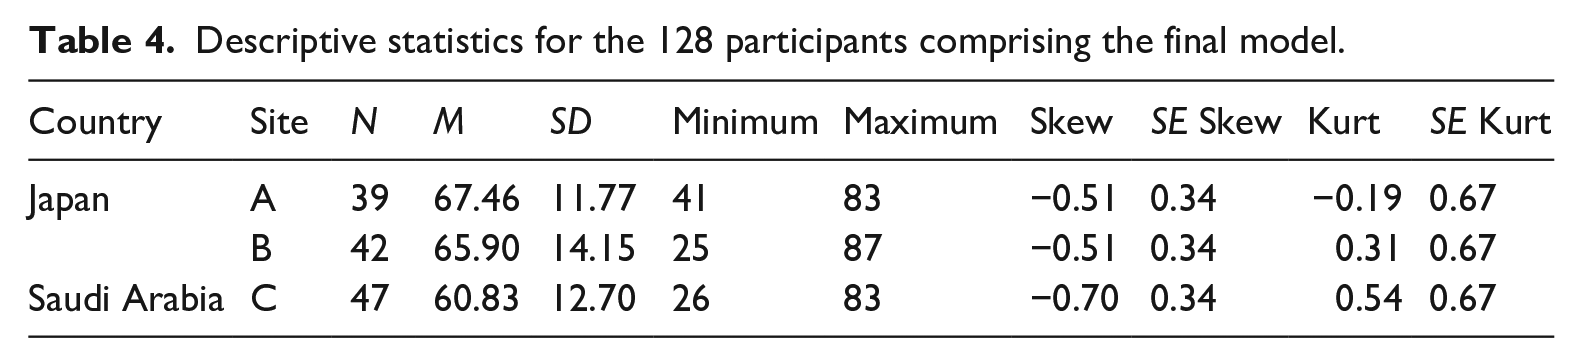
The initial Rasch analysis was conducted utilizing the eRm package with CMLE on the results of the 165 test takers’ responses to the 108 AWL words. Following the first iteration of the analysis, both the items and persons included misfitting data outside of the 0.50–1.50 threshold for infit and outfit MNSQ, and the −2.00 to 2.00 threshold for t-scores (see Table 2). A more satisfactory final model was achieved following 10 iterations, comprising the results of 128 test takers and 88 items (see Table 3). The descriptive statistics reported in Table 4 show that the mean scores by test site ranged from 60.83 to 67.46 out of 88. The boxplot overlap in Figure 1 indicates that the differences between the test sites were not significant (Streiner, 2018).
Descriptive statistics for person and item parameters for the initial Rasch model.
Descriptive statistics for the 128 persons and 88 item parameters comprising the final Rasch model.
Descriptive statistics for the 128 participants comprising the final model.

Raw AWL scores for the 128 participants comprising the final model by (a) Country and (b) Site.
The initial Rasch analysis
The results of the initial eRm Rasch analysis were investigated to assess the AWL-based Yes/No test’s (a) appropriateness for the sample, (b) capacity to measure the construct of interest, (c) alignment with the Rasch model’s expectations, and (d) invariance across samples. Regarding the test’s appropriateness for the sample, the histogram illustrating the person parameter distribution on the Wright map presented in Figure 2 showed that the majority of the test takers scored above 0.00 logits, implying that the test was not challenging for this sample. This claim is supported by the fact that the mean logit score for the sample, 1.80 (1.31), was larger than that of the items, −0.02 (1.92), by more than 1 SD. However, it cannot be considered too easy because only one test taker was removed for achieving a perfect score.
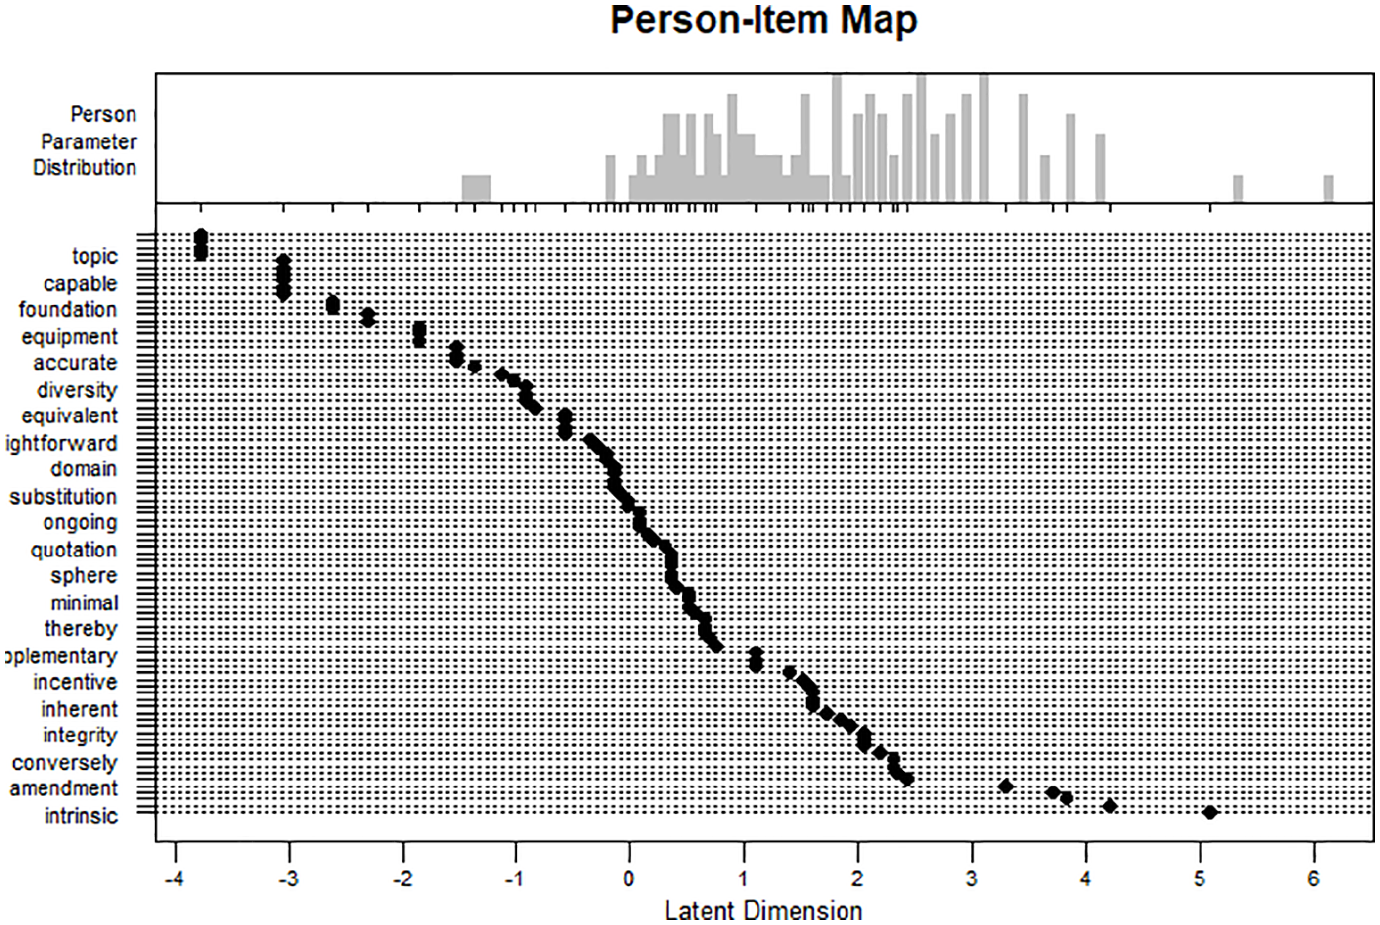
Wright map for the final model.
Regarding the extent to which the AWL-based Yes/No test questions targeted the construct being measured, the mean SEs reported in Table 3, 0.34 (0.20), suggested that the items were generally well targeted to the construct being measured, but the maximum value, SE = 1.00, caused concern. Analysis of the item logits and SEs revealed that the 10 least-challenging items for this group of test takers were responsible for the largest SEs (>0.70; see Supplementary Materials A). This observation indicated that there were not enough test takers of sufficiently low ability to match the easiness of these items, thus there was comparatively scant information for precise measurement (Bond et al., 2020).
Regarding the extent to which the AWL-based Yes/No test scores conformed to the Rasch model’s expectations, the minimum and maximum item infit MNSQ statistics, 0.76 and 1.20, respectively (see Table 3), were within Wright and Linacre’s (1994) 0.50–1.50 acceptable range of values. Although the maximum item outfit MNSQ statistics of 1.49 conformed to this threshold, analysis of each item’s statistics revealed that 11 (9.68%) of the items’ outfit MNSQ statistics were less than 0.50 (see Supplementary Materials A). As previously stated, however, items with small infit seldom incur practical costs in human science research. Table 3 also illustrates maximum item infit t-scores beyond the 2.00 threshold. Further item analysis revealed infit t-scores for one item (welfare; t = 2.09) was the source of the misfit. Because the misfitting item constituted under 5% of the items, no substantial effect on estimates was induced (Beglar, 2010).
Finally, regarding the extent to which the AWL-based Yes/No test items could be considered invariant across subsamples, Andersen’s LR test was conducted. Here, 6 out of the 10 easiest items (enable, nuclear, topic, depression, edition, and unique) were omitted from the analysis by eRm due to inappropriate response patterns. The nonsignificant test result, LR(81) = 73.47, p = .71, suggested that the two subsamples were responding to the test items in a similar manner.
RQ1: Comparing estimation methods with a single dataset
The first research question concerned the comparison of item and person parameter estimates produced with three estimation methods across six Rasch analysis software packages. The histograms in Figure 3 show that the MMLE-based person parameters calculated with the TAM and ltm packages met the assumption that the distributions conform to a specified distribution, which in this case was Gaussian.
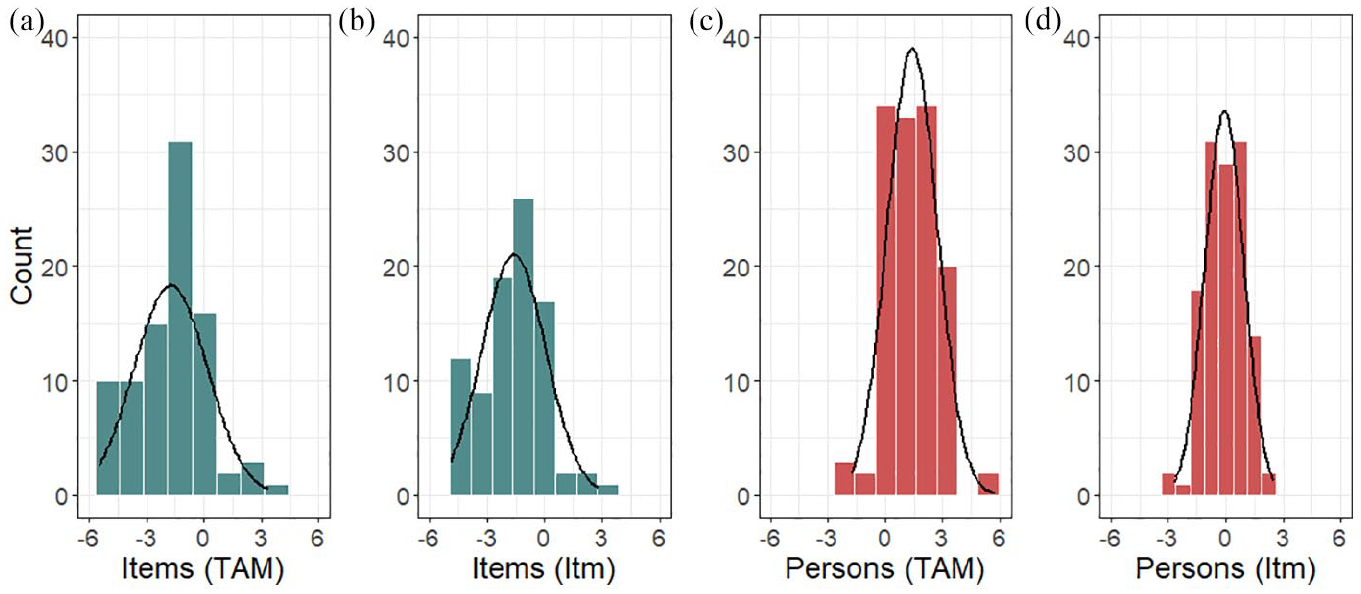
Distribution of MMLE parameters: (a) TAM item, (b) ltm item, (c) TAM person, and (d) ltm person.
Item parameters for the single dataset
Table 5 presents the descriptive statistics for the item parameters produced by the estimation methods and software packages. The mean logit values ranged from −1.61 to 0.00, reflecting which set of responses was centered at zero by the respective packages. The difference, however, is inconsequential because the SDs and accompanying ranges reported in Table 5 show that regardless of whether the item logits were centered at zero, the distribution of the logits was comparable for all of the packages. Furthermore, correlations between the data were practically perfect (see Supplementary Materials B). The MMLE-based results calculated with ltm displayed a marginally smaller distribution, a pattern that also held true for the SEs, which were almost identical for all three estimation methods but were slightly smaller in size and range for ltm. However, when a constraint was imposed to set the item discrimination parameter to 1 (ltmC), the ltm results became comparable to the MMLE-derived results from the TAM package. The infit MNSQ fit statistics also displayed consistency across the three estimation methods and the four software packages that enabled their calculation, with all of the values lying within the 0.50 to 1.50 threshold. However, the maximum outfit MNSQ statistics calculated with mixRasch limited to −6 and 6 (mixRasch6; 1.53) and Winsteps (1.54) were slightly above the threshold. Overall, Table 5 shows that the infit statistics produced with the contrasting estimation methods were almost identical, the single exception being the slightly lower minimum infit MNSQ value calculated by mixRasch. The unweighted outfit MNSQ values displayed no discrepancies of substance between the estimation methods, nor the packages, except for the largest value produced by TAM (1.36) being slightly lower than the other packages (1.47 to 1.54).
Descriptive statistics comparing the Rasch analysis item statistics.
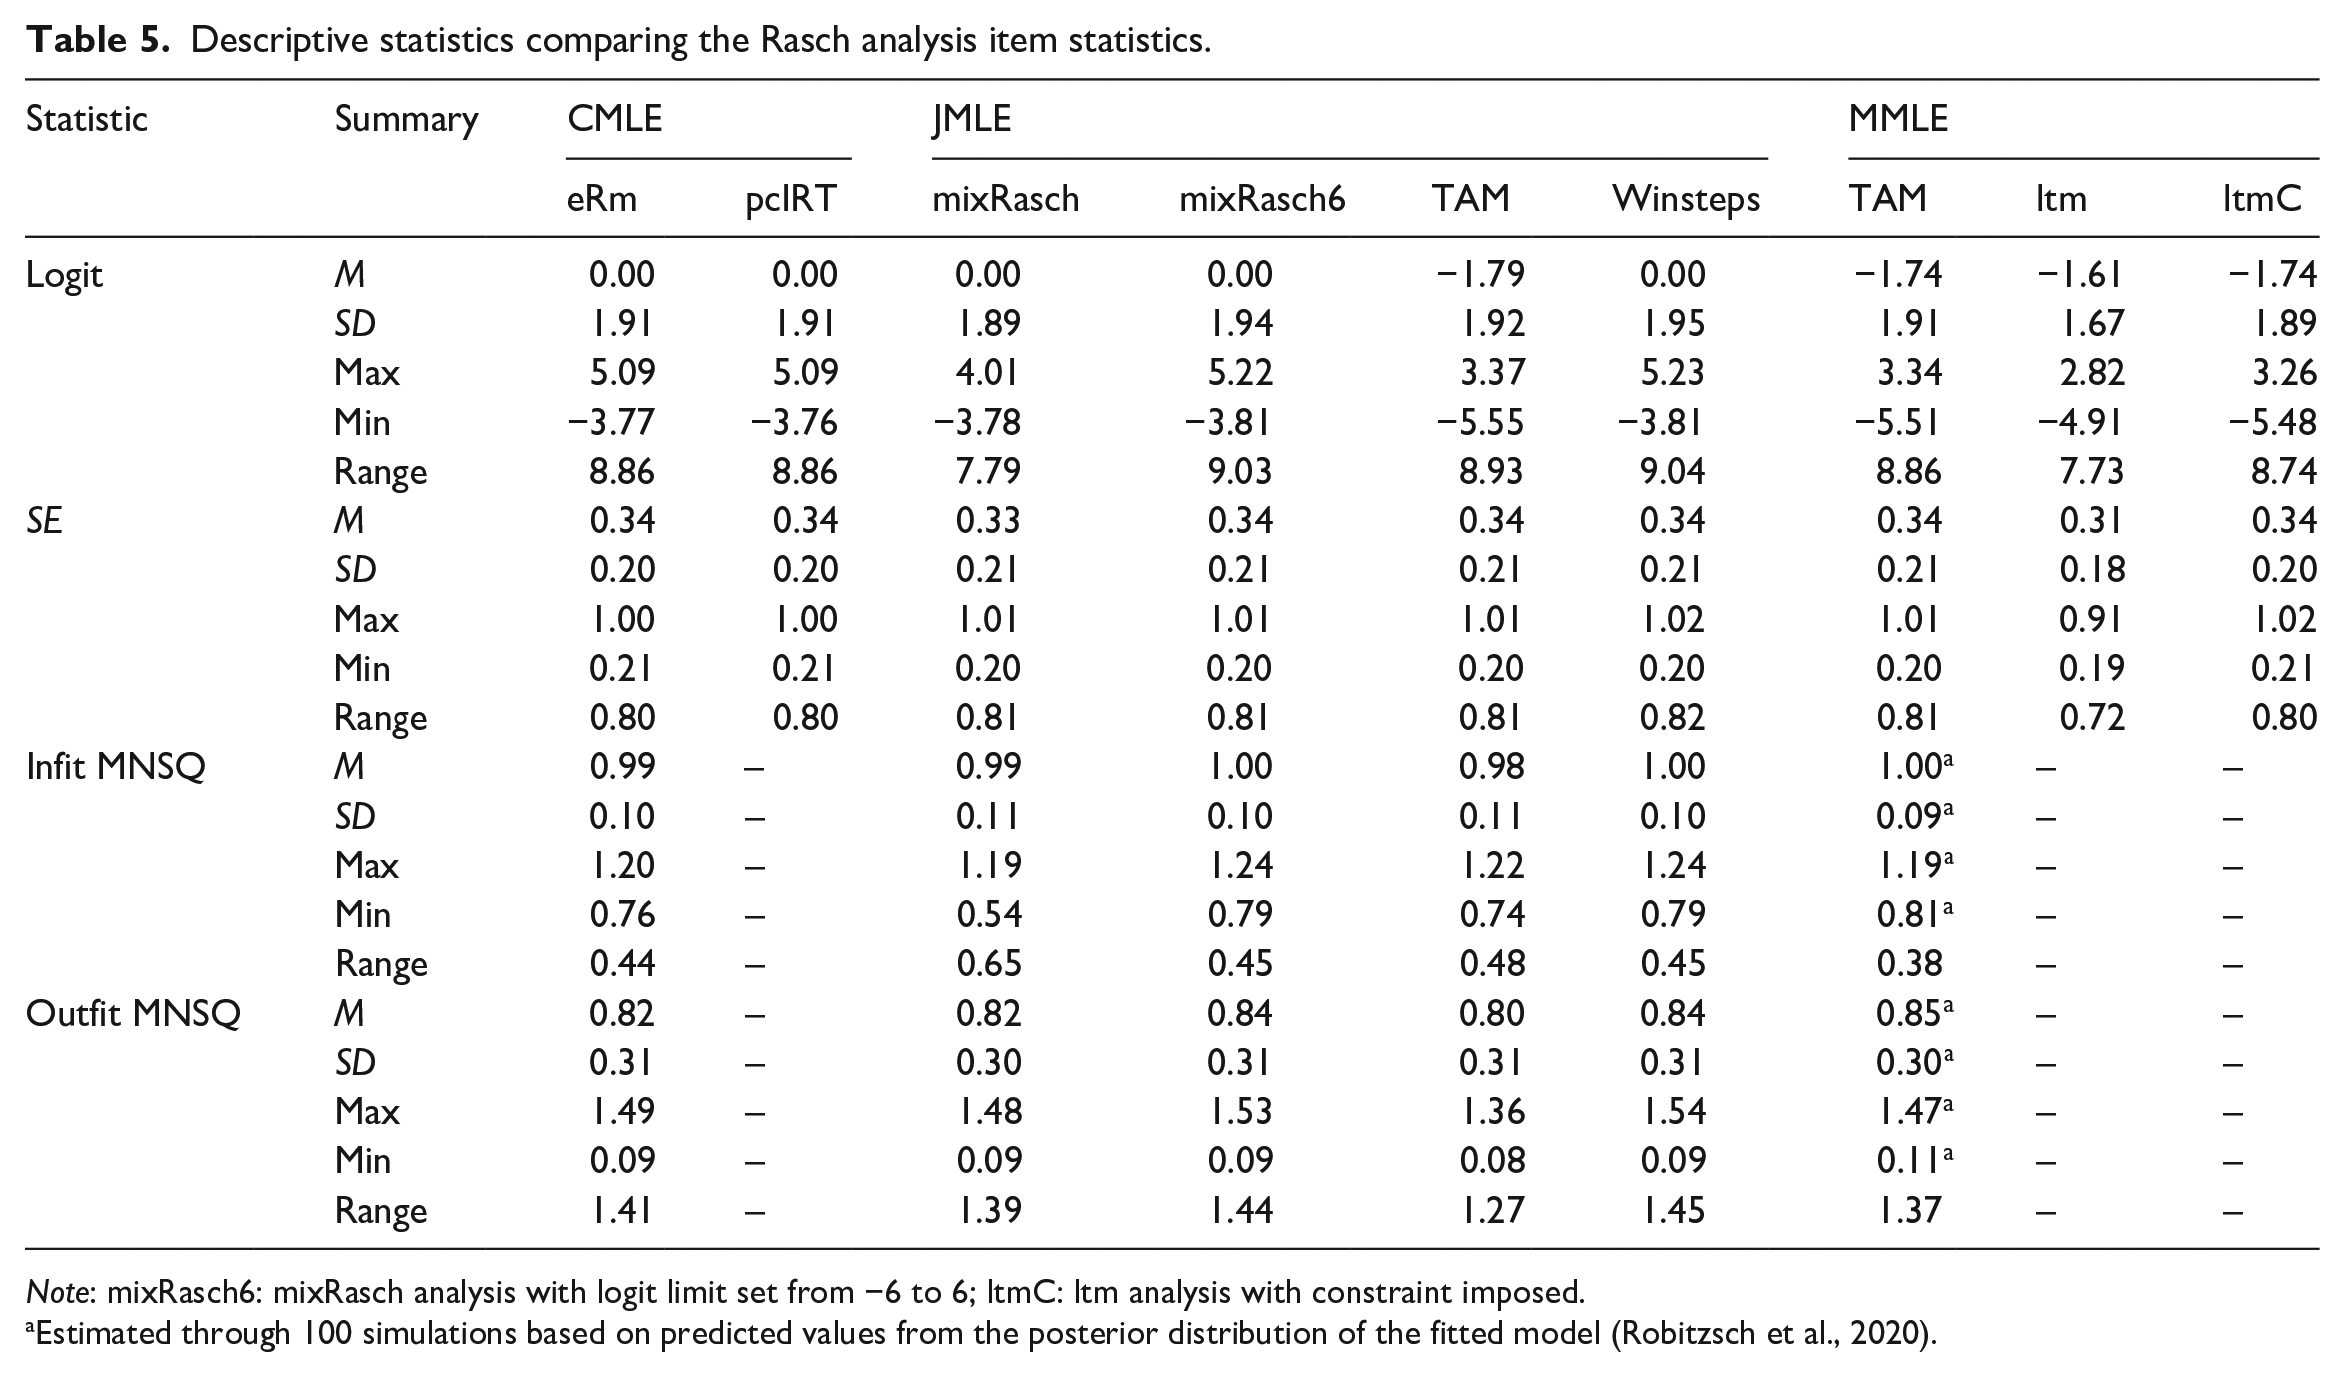
Note: mixRasch6: mixRasch analysis with logit limit set from −6 to 6; ltmC: ltm analysis with constraint imposed.
Estimated through 100 simulations based on predicted values from the posterior distribution of the fitted model (Robitzsch et al., 2020).
Person parameters for the single dataset
Table 6 presents the descriptive statistics for the person parameters produced by the three estimation methods. Although the mean of the logits produced by the different packages displayed variation depending on whether the items or persons were zero-centered, once again the range of the logit values and accompanying standard errors were similar. Comparison of the eRm data produced when the persons were conditioned out of the equation with data produced when the items were conditioned out through the use of transposed data, eRm(T), revealed almost identical results. The only values that did not conform to the general pattern were once again produced with ltm, whereby the logit scores displayed tighter dispersion and the SEs were smaller. Whereas the logit score ranges estimated with the majority of packages were between 7.28 and 7.67 and the mean SEs were all either 0.33 or 0.34, the logit range calculated with ltm was 5.21 and the mean SE was 0.27. The range of the SEs estimated with ltm, 0.26, was also noticeably lower than the other packages, which were between 0.66 and 0.80. Unlike with the items, imposing a constraint (ltmC) did not bring the ltm results in line with the other packages. Most noticeably, the mean SE, 0.31, lay between the ltm SE, M = 0.27, and the other packages, M = 0.33 or 0.34, and the maximum SE was 0.51, which was closer to the maximum ltm SE, 0.49, than the other packages, which ranged from 0.92 to 1.07. Table 6 also reveals that MNSQ fit statistics estimated with eRm, Winsteps, mixRasch, and TAM were comparable and lay within the 0.50–1.50 threshold. However, only the CMLE-derived eRm and JMLE-derived TAM outfit MNSQs were all below the 1.50 threshold, with the remaining packages producing at least one marginally larger value.
Descriptive statistics comparing the Rasch analysis person statistics.
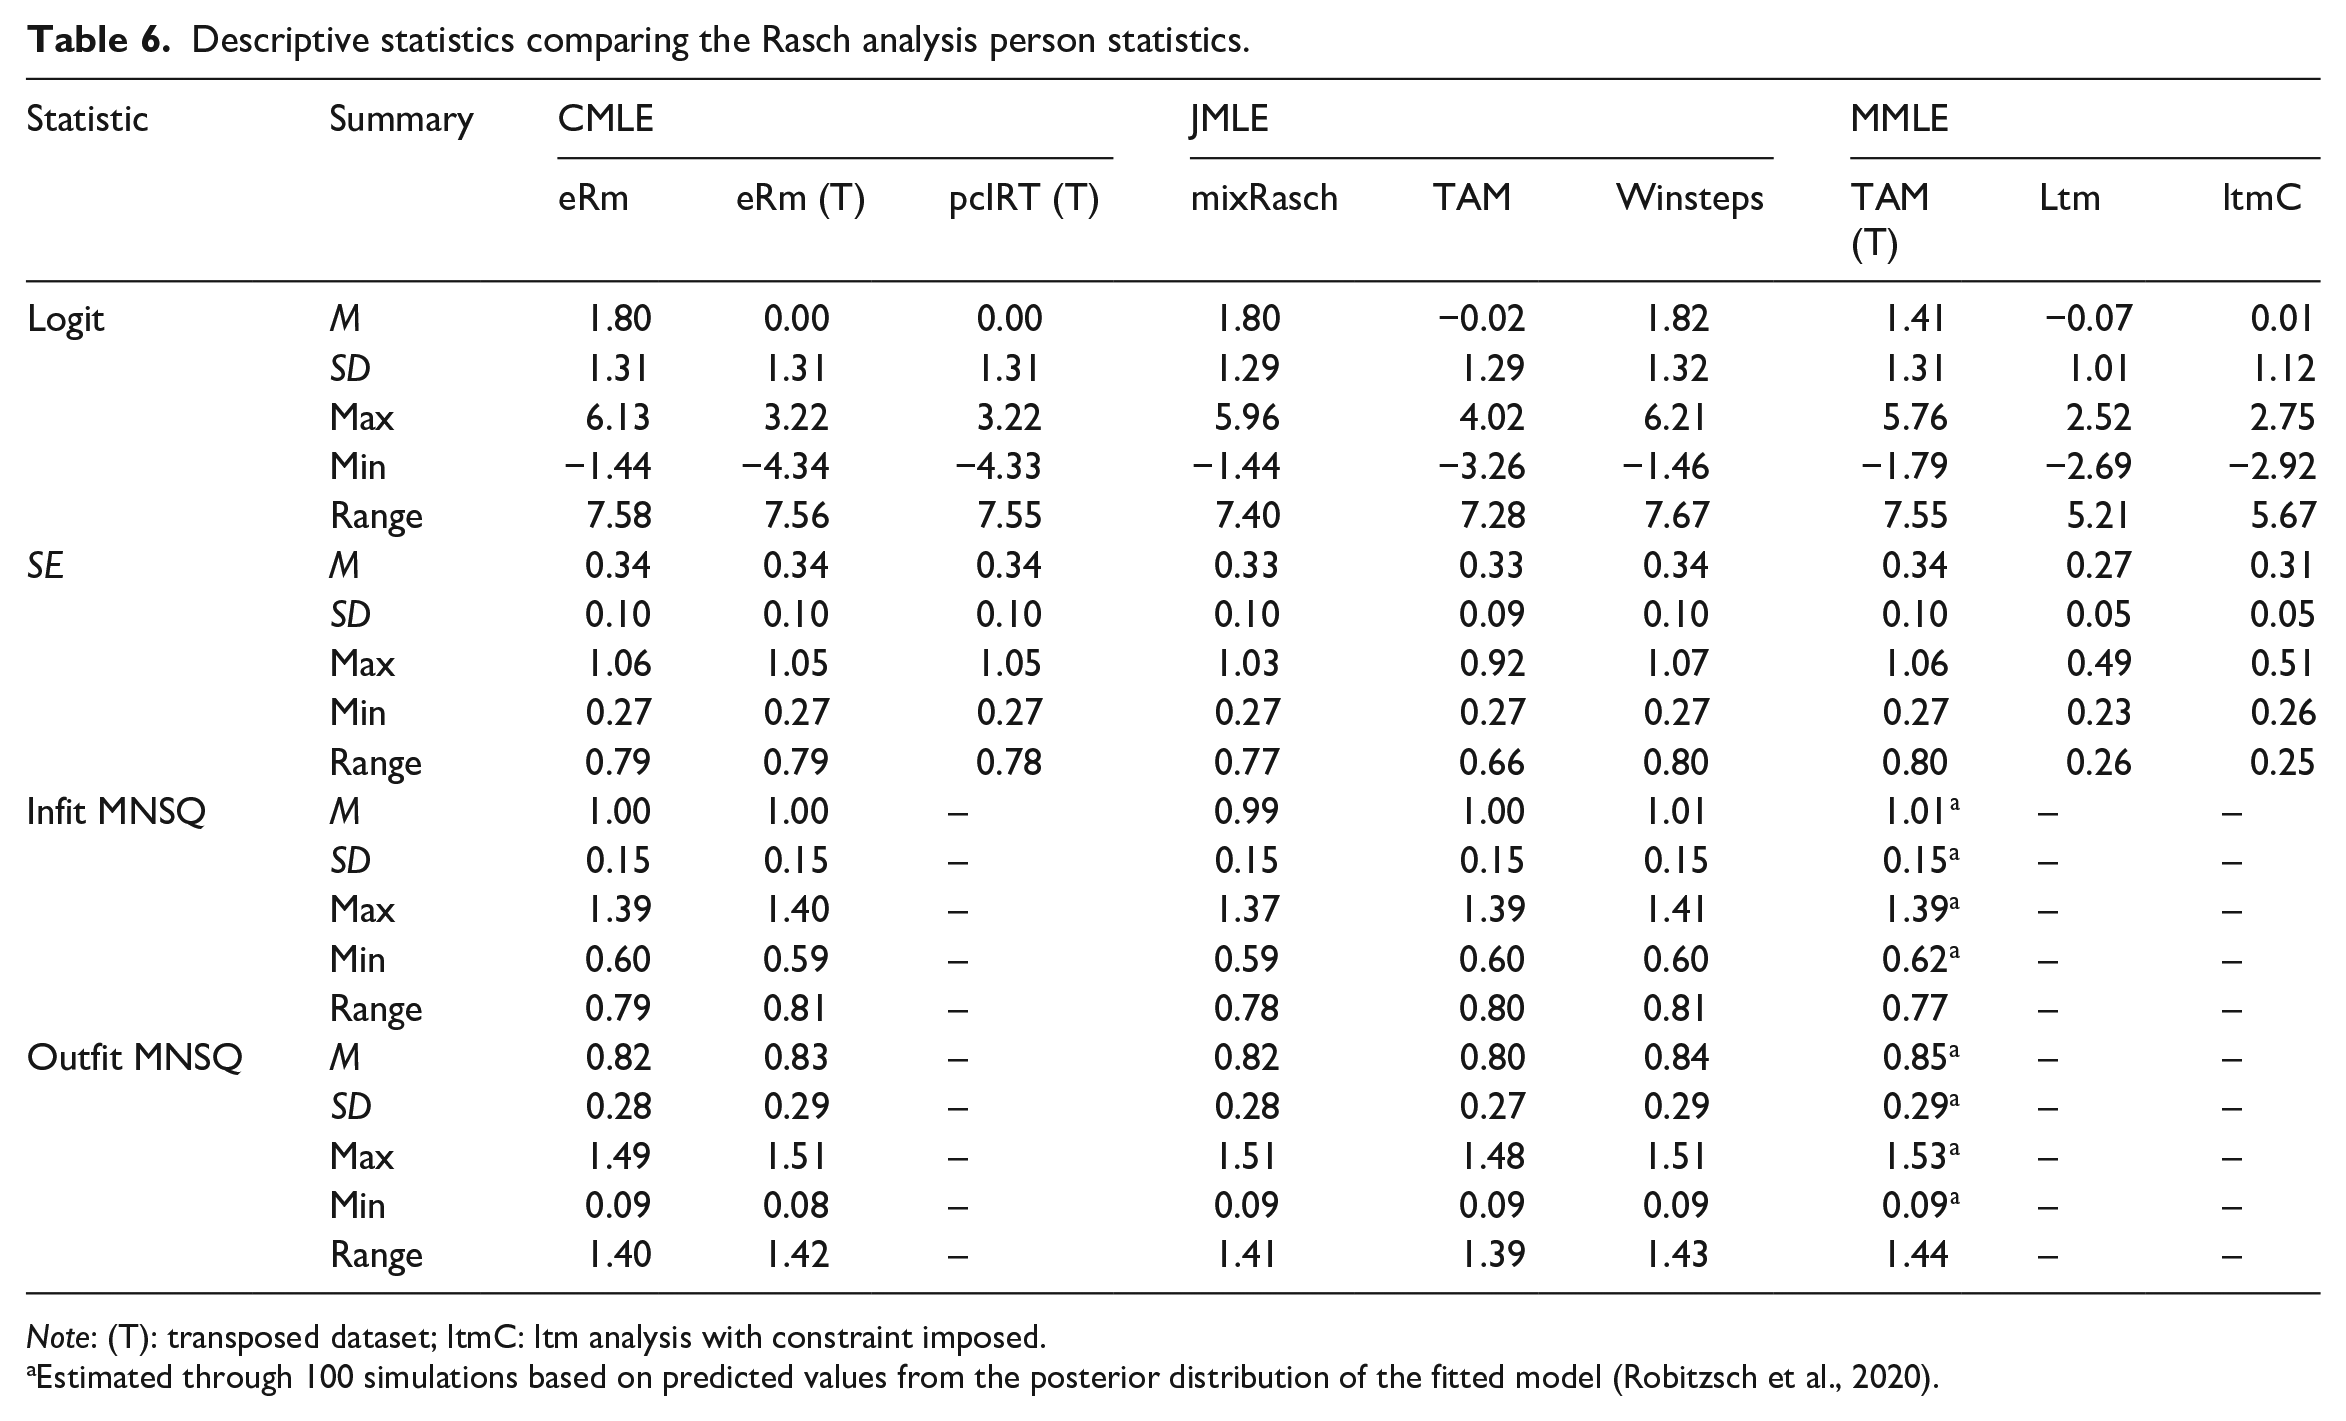
Note: (T): transposed dataset; ltmC: ltm analysis with constraint imposed.
Estimated through 100 simulations based on predicted values from the posterior distribution of the fitted model (Robitzsch et al., 2020).
RQ2: Comparing estimation methods with 1000 simulated datasets
Whereas RQ1 concerned the Rasch analysis results from a single dataset containing observed responses from a multi-site sample of test takers, RQ2 was posed to analyze the results from 1000 simulated datasets to determine whether the consistency displayed across the estimation methods in RQ1 was generalizable to other data. Each statistic reported in Tables 7 and 8 is a mean value, with accompanying SD, summarizing 1000 results. Each point on the boxplots in Figures 4 and 5 represents the mean score from one of 1000 datasets, while the median bar in the boxplot represents the median of the mean scores.
Descriptive statistics comparing the mean (SD) Rasch analysis item statistics produced from 1000 simulations.
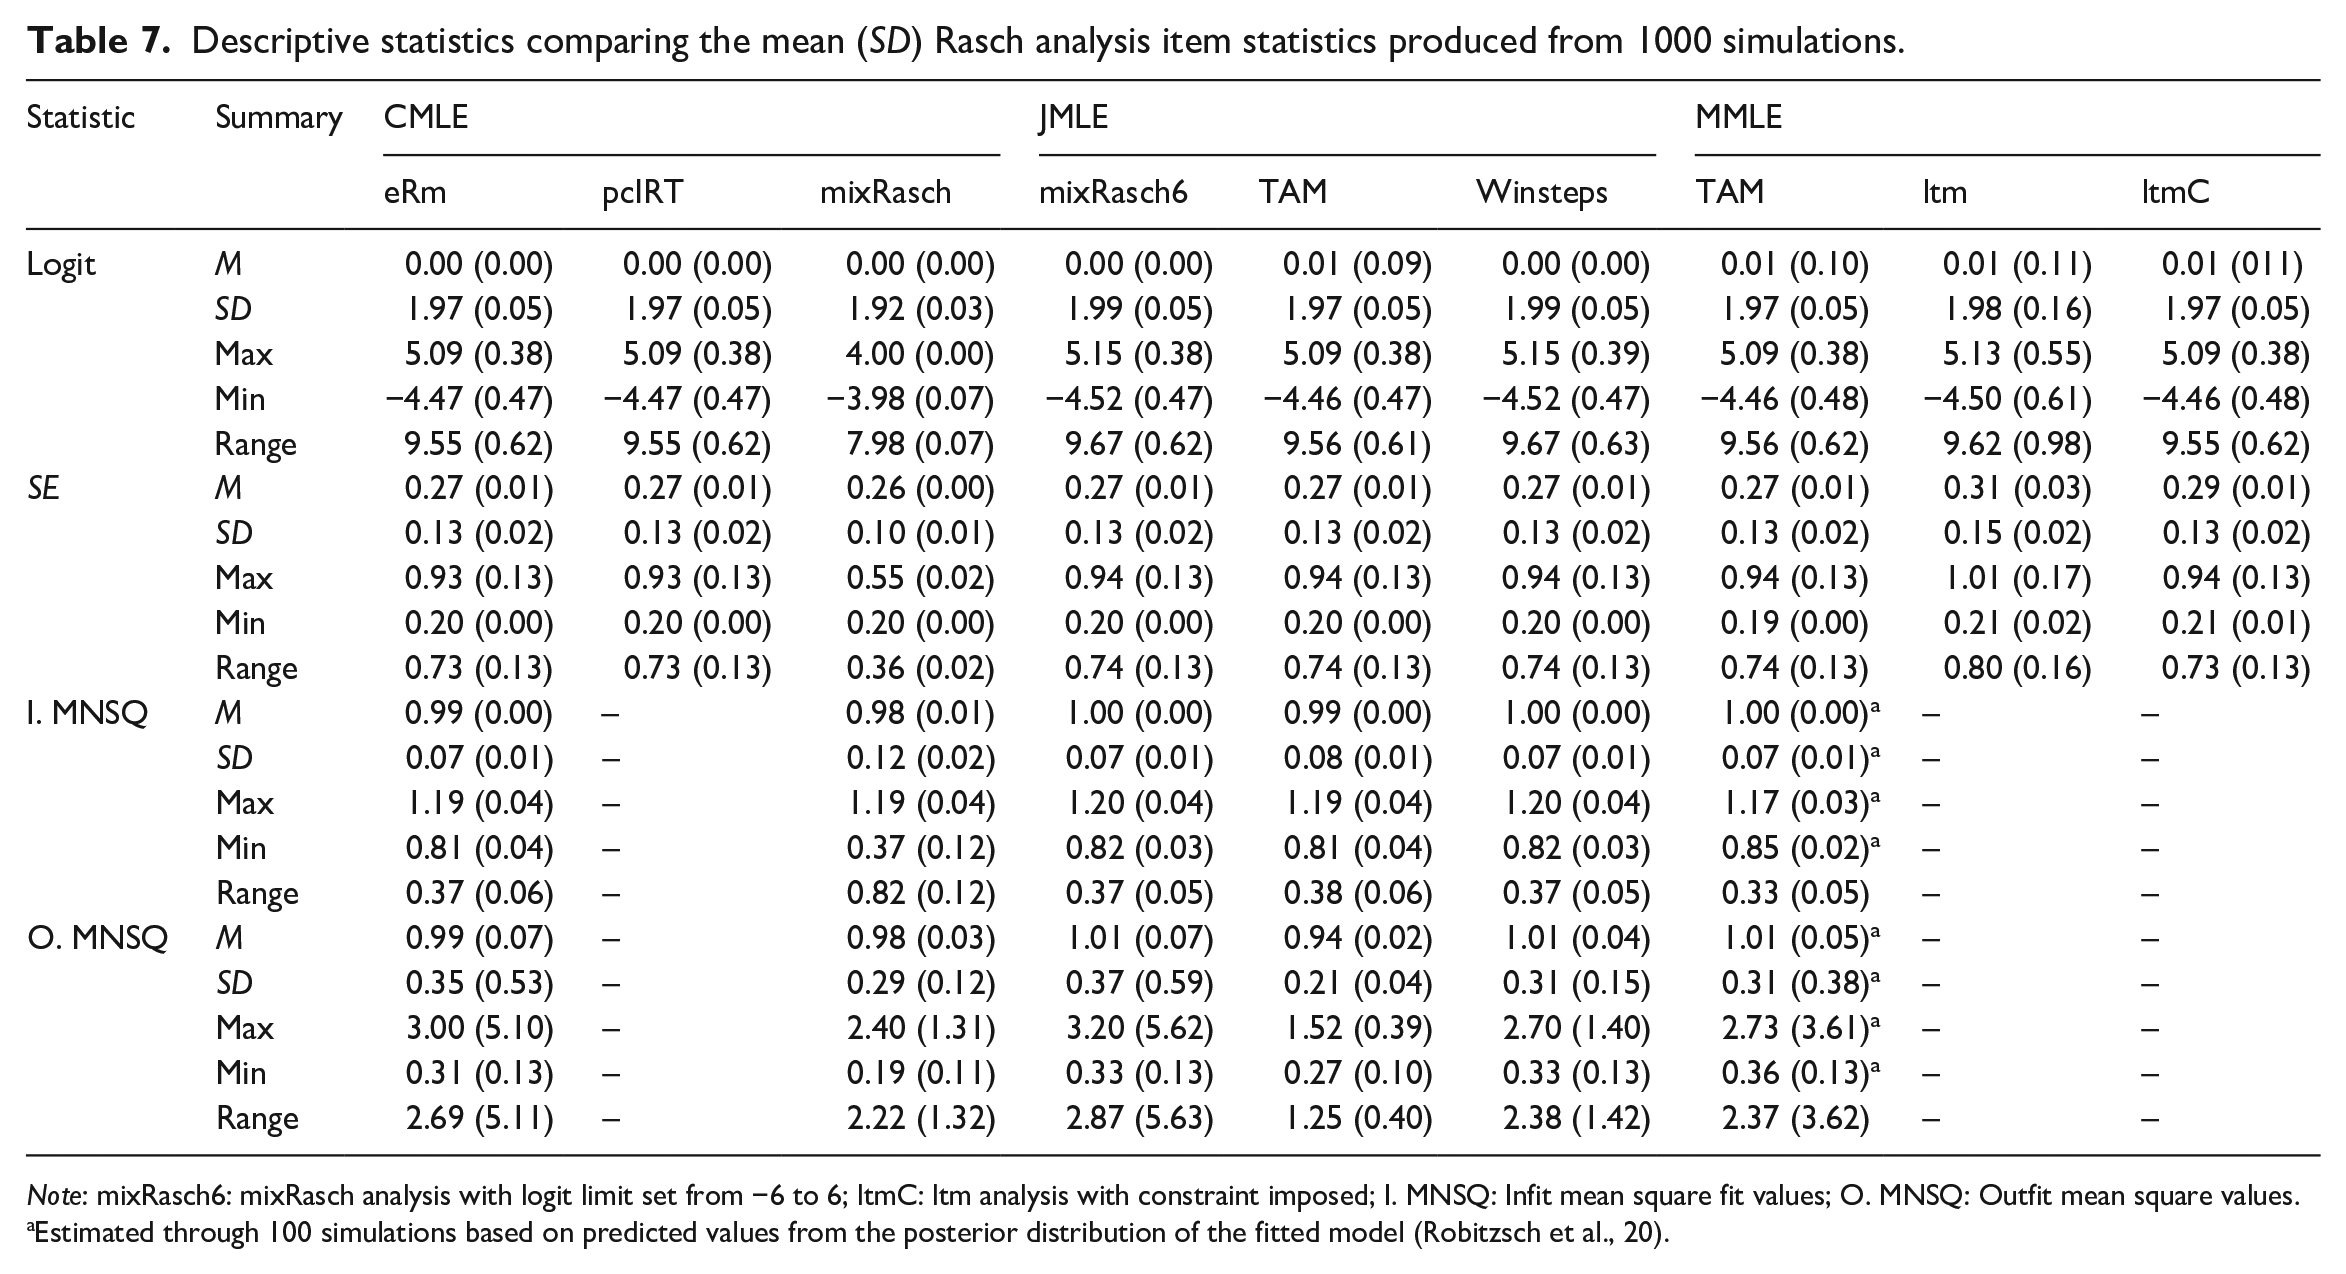
Note: mixRasch6: mixRasch analysis with logit limit set from −6 to 6; ltmC: ltm analysis with constraint imposed; I. MNSQ: Infit mean square fit values; O. MNSQ: Outfit mean square values.
Estimated through 100 simulations based on predicted values from the posterior distribution of the fitted model (Robitzsch et al., 20).
Descriptive statistics comparing the mean (SD) Rasch analysis person statistics produced from 1000.
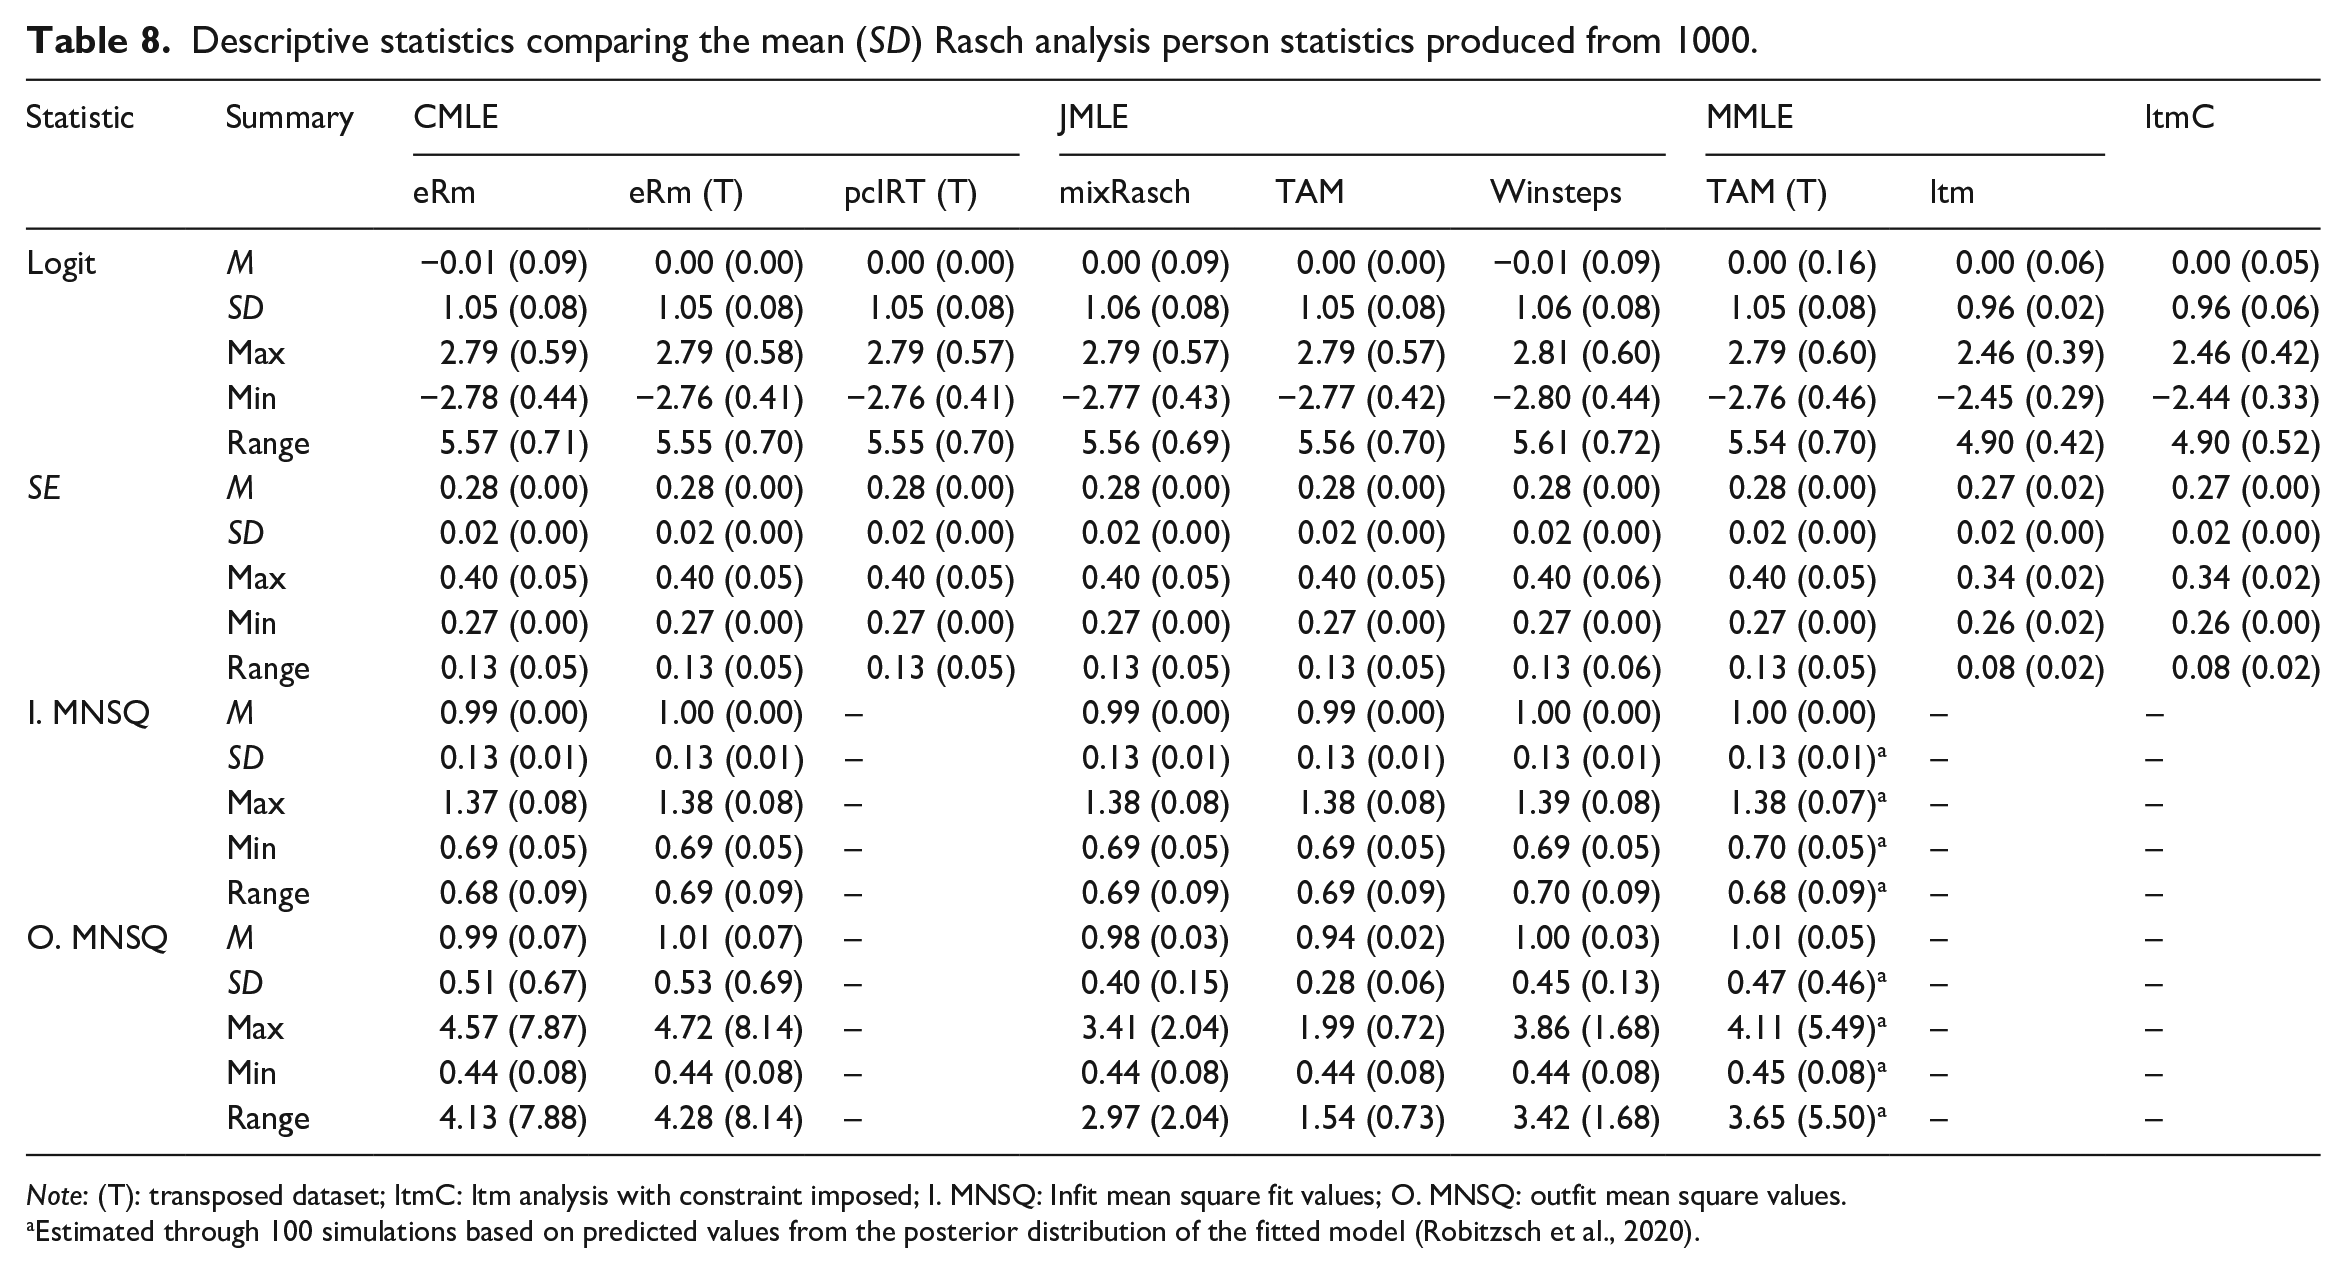
Note: (T): transposed dataset; ltmC: ltm analysis with constraint imposed; I. MNSQ: Infit mean square fit values; O. MNSQ: outfit mean square values.
Estimated through 100 simulations based on predicted values from the posterior distribution of the fitted model (Robitzsch et al., 2020).

Mean item values produced from 1000 simulations: (a) Standard errors, (b) Minimum infit MNSQ values, (c) Maximum infit MNSQ values, (d) Minimum outfit MNSQ values, and (e) Maximum outfit MNSQ.

Mean person produced from 1000 simulations: (a) Standard errors, (b) Minimum infit MNSQ values, (c) Maximum infit MNSQ values, (d) Minimum outfit MNSQ values, and (e) Maximum outfit MNSQ values.
Item parameters for the simulated data
The item parameter results from the simulated data indicated that divergences occurred at the software level as opposed to the estimation method level. In Table 7, the mean SE across the 1000 simulated datasets was approximately 0.27 for all of the software packages except ltm, which was 0.31 and displayed a greater spread (see Figure 4(a)). Even when a constraint was imposed (ltmC), the ltm-derived SEs were significantly larger than the other packages, as attested to by the lack of overlap between the boxplots (Streiner, 2018). However, the difference in SE of 0.01 is negligible in practical terms. This difference was not attributable to the estimation method because the MMLE-derived values produced by TAM followed the pattern of the CMLE- and JMLE-based results. Similarly, of the packages that provided MNSQ fit statistics, the JMLE-based minimum item values estimated with mixRasch were significantly lower and also more widely distributed (see Figure 4(b)). This resulted in approximately 75% of the mean minimum infit values falling outside the 0.50 threshold, while all of the values produced with the other packages were within. This discrepancy could also not be attributed to JMLE because the mean minimum infit MNSQ values calculated with Winsteps and TAM followed a similar pattern to the CMLE and MMLE patterns. Finally, the JMLE-based mean maximum outfit MNSQ values produced with TAM were smaller and displayed less variance than the other packages, which again could not be attributed to the estimation method because the other packages in Figure 4(e) followed comparable patterns.
Person parameters for the simulated data
The person parameter results presented in Table 8 were analogous to the item parameters in that the results across the estimation methods and software packages converged for the majority of statistics considered, while the differences that existed were attributable to the software packages as opposed to the estimation methods. Figure 5(a) shows that the mean SEs estimated with ltm once more diverged from the other packages. Figure 5 also shows that the mean minimum and maximum fit statistics calculated with the packages were almost identical. However, as with the item parameters, mean maximum JMLE-based values calculated with TAM were significantly smaller and less dispersed. Interestingly, both Figures 4(e) and 5(e) suggest that unlike other packages, TAM limits the maximum outfit MNSQ to 10.00.
Discussion
In this study, the results from an AWL-based Yes/No vocabulary test were subjected to Rasch analysis with the R-based eRm package. The resulting dataset was then subjected to analysis with six Rasch analysis software packages to determine the influence of three common estimation methods on the resulting statistics. Finally, 1000 datasets were simulated and analyzed to assess whether the observed patterns obtained with the human data were generalizable. When compared, the differences in results produced by the estimation methods were negligible, and all observed divergences were attributable to the software packages as opposed to the estimation methods. However, researchers attempting R-based Rasch analyses should be aware of what potential discrepancies in results are produced by certain packages, why these discrepancies occur, and how they can be attended to.
The results of the initial CMLE-based eRm Rasch analysis indicated that the bulk of the test items were relatively undemanding for this sample of test takers, and that the model would benefit from the inclusion of more low ability test takers to allow for greater precision when measuring the less challenging items. Following the removal of problematic items and test takers during an iterative dichotomous Rasch analysis, the SEs revealed that the test items were well targeted to the construct under investigation, the fit statistics indicated that the final set of items met the expectations of the model, and Anderson’s LR test results suggested that the instrument displayed invariance across two subsamples. Overall, the Rasch analysis results provided initial support for the AWL-based Yes/No test as being a suitable instrument for measuring test takers’ ability to recognize English words that are common in academic discourse. However, the test suffers from the same limitations of all Yes/No tests, whereby word knowledge is easily overestimated because test takers can claim knowledge of words that they do not know by merely ticking a box (McLean et al., 2020).
In response to RQ1, the logits, SEs, and MNSQ fit values reported from the CMLE-based eRm analysis were compared to equivalent statistics estimated with alternative Rasch packages to determine the extent to which the results converged or diverged. For the items, the other CMLE-based results that were produced with the pcIRT package converged with the eRm results in the sense that they were practically identical (see Table 5). For the person estimates, the transposed eRm and pcIRT results also converged (see Table 6). Besides the mean logits being centered at zero by some software packages but not others (see Table 1), the MMLE-based results calculated with TAM were almost identical to the eRm results. The largest divergences from the overall pattern of results were the spread of the logits and SEs produced by MMLE-based ltm analysis for both items and person, which were moderately smaller, and the minimum item infit MNSQ values estimated by JMLE-based mixRasch analysis, which were slightly lower than those estimated by the other packages (see Figure 4). Interestingly, the eRm results produced with the persons conditioned out were comparable to JMLE-based Winsteps results in terms of both item and person parameters. This result is important because it implies that despite the differing estimation method, the estimation of logit scores eRm is a viable, cost-free alternative to Winsteps, which is the second most frequently utilized Rasch analysis package in applied linguistics and language testing research (Aryadoust et al., 2021). In conclusion, the results produced by the estimation methods generally converged, with discrepancies being attributable to software packages as opposed to estimation method.
In response to RQ2, the results produced by the R packages from Rasch analysis of 1000 simulated datasets were compared. It is noteworthy that the patterns produced by items and persons in the simulated datasets were merely generated by the logits produced by the initial eRm analysis. However, these results display the extent to which the R-based software packages cope with noisy, unconventional data. As with RQ1, the results suggested that choice of package was more important than choice of estimation method in terms of affecting the Rasch analysis results, and three discrepancies relating to SE, infit MNSQ, and outfit MNSQ estimation by three different packages across the 1000 simulations are now considered in turn.
Regarding SEs, the values produced with the ltm package consistently differed from the other packages. Although Engelhard (2013) stated that estimation method can significantly affect SEs, the observed differences in this study are not attributable to the MMLE utilized by ltm because the other set of SEs estimated with MMLE (TAM) adhered to the patterns produced with CMLE and JMLE, as illustrated in Figures 4(a) and 5(b). Without the constraint (ltm), the item SEs were significantly larger and the person SEs were significantly smaller. The addition of the constraint reduced the spread of the values across 1000 simulations and brought the median values closer to the other packages for the items, but the significant difference was still present as attested to by the lack of boxplot overlap. The ltm-estimated SE’s divergence from the other packages is most likely a result of the calculation method. The ltm package can fit numerous item response theory (IRT) models beyond Rasch and is the only package in this study that employs the delta method for SE calculations (Rizopoulos, 2018). The delta method is a multivariate method of estimating SEs utilized when discrimination parameters have been transformed, which is the case with certain IRT models (Cai, 2018).
With respect to infit MNSQ values, Figure 4(b) illustrated that the mean of the minimum item values produced with the mixRasch package from 1000 simulated datasets was significantly lower than those produced by the other packages. However, Figure 5(b) showed that the equivalent values estimated for the persons were practically the same. Furthermore, the low minimum infit MNSQ values for items visible in Figure 4(b) were somewhat problematic because over 75% fell outside of the 0.50 threshold, while almost none of the other values did. This result was attributable to the −4 to 4 limit that mixRasch imposes on item difficulty logits as default to improve the fit of extreme scores. Tables 5 and 7 show that the logits in the initial mixRasch analysis and the simulations met this limit, while the other packages went beyond, which in turn affected the infit MNSQ values. Once the limit was increased from −6 to 6 (i.e., mixRasch6 results in Tables 5 and 7) the item difficulty logits and infit MNSQ became almost identical to Winsteps and the other R-based packages. The person estimates were not affected because the default limit is only applicable to the items, as illustrated by the maximum person logit value (5.96) calculated by mixRasch in Table 6. Thus, as with eRm, mixRasch provided a viable, cost-free alternative to Winsteps, producing almost identical results to the frequently utilized package. However, researchers should be aware that large item logits potentially affect the infit MNSQ statistics unless the item difficulty limit is increased.
Finally, regarding outfit MNSQ values, the mean maximum JMLE-based values calculated with TAM were distinctly smaller than the other estimation methods and packages (see Figures 4(e) and 5(e)). This discrepancy resulted from the choice of R function utilized for the fit statistic calculations. The MMLE-based fit statistics converged with the results calculated for the other packages and were calculated with the tam.fit() function, which produces results through 100 simulations based on predicted values from the posterior distribution of the fitted model (Robitzsch et al., 2020). However, this process resulted in infinite values with the JMLE-based model, thus fit statistics were calculated with tam.jml.fit() and tam.personfit() functions instead. These alternative functions resulted in values that were smaller than those produced with tam.fit() and also the values calculated with the other packages. Therefore, if fit statistics are computed as part of a JMLE-based TAM analysis, the relatively conservative nature of the upper outfit MNSQ should be considered.
Conclusion
In conclusion, the data produced with the Rasch analyses conducted in this study generally converged across the estimation methods under investigation. This finding is in line with Robitzsch (2021), who also found that the choice of estimation method had a negligible effect on Rasch analysis results calculated from simulated datasets with varying numbers of items and test takers. The discrepancies observed in SE and fit statistic estimations in this study were all traceable to the software choice. However, researchers utilizing R-based Rasch analysis can avoid these discrepancies by following the advice provided above. Regardless of the reason, these minor discrepancies reinforce Linacre’s (2021b) recommendation to estimate values with at least two packages when conducting R-based Rasch analysis to obtain confirmation.
The conclusions presented above are, however, constrained by two notable limitations. Firstly, despite the negligible effect of estimation methods being synchronous with similar studies, the results of this study are extrapolated from a single dataset. Although 1000 datasets were generated and analyzed, as acknowledged above such datasets are not “real” and thus further research is warranted with data collected from test takers. Secondly, only the dichotomous Rasch model was considered in this study. Further research is required to determine whether estimation method effects are also negligible with other Rasch models. For researchers interested in reproducing the simulation utilized in this study with alternative Rasch models and datasets, Nicklin (2021) contains the relevant R scripts and data and can be downloaded from the OSF website.
Supplemental Material
sj-docx-1-ltj-10.1177_02655322211066822 – Supplemental material for Assessing Rasch measurement estimation methods across R packages with yes/no vocabulary test data
Supplemental material, sj-docx-1-ltj-10.1177_02655322211066822 for Assessing Rasch measurement estimation methods across R packages with yes/no vocabulary test data by Christopher Nicklin and Joseph P. Vitta in Language Testing
Footnotes
Acknowledgements
The authors thank Mike Linacre, Daniel Anderson, John Willse, Simon Albright, Garrett DeOrio, Paul Duffill, and Jeff Stewart for their help, assistance, and advice. They also thank the three anonymous reviewers for their invaluable feedback and suggestions.
Declaration of conflicting interests
The authors declared no potential conflicts of interest with respect to the research, authorship, and/or publication of this article.
Funding
The authors received no financial support for the research, authorship, and/or publication of this article.

Data accessibility statement
Supplemental material
Supplemental material for this article is available online.
References
Supplementary Material
Please find the following supplemental material available below.
For Open Access articles published under a Creative Commons License, all supplemental material carries the same license as the article it is associated with.
For non-Open Access articles published, all supplemental material carries a non-exclusive license, and permission requests for re-use of supplemental material or any part of supplemental material shall be sent directly to the copyright owner as specified in the copyright notice associated with the article.
