
Abstract
Various new performance evaluation indices for impact have been proposed and studied in various contexts. This study carried out a quantitative evaluation of the case of Malaysian engineering researchers at the micro level using a scientometric approach. In order to understand the behavior of new developments, a comparative performance evaluation is carried out of h-index, a set of h-type indices along with publication and citation metrics. Findings are compared with earlier major studies. We looked for institutional h-index and researchers’ h-index scores and did not find any relationship. Exploratory Factor Analysis is employed to examine the valid categorization and to study the underlying dimensions of the studied metrics and indices. The inter-correlation among h-index, its variants, and traditional metrics is probed in detail. The h, q and g-indices along with publication and citation hold the position on ‘quantity of the productive core’, while the R index showed equal loading on both cores. For the case of Malaysian engineering researchers, two conspicuous findings are observed about the total citation and g-index. These have association with the first component named as ‘quantity of the productive core.’ Our findings strengthen the point that citation count has a strong association with the ‘quantity of the productive core’ and cannot be used as sole impact evaluation measure.
Keywords
Introduction
Research output dimensions such as the ‘quantity of the productive core’ and the ‘impact of the productive core’ are being explored at various aggregate levels in developed nations, or the ‘core countries’. The purpose is to get a better understanding of the usefulness of new indices for a fairer research performance decision-making process (Bornmann and Daniel 2005; Moed 2005; Cronin and Meho 2006; Saad 2006; Oppenheim 2007; Imperial and Rodriguez-Navarro 2007, Bouabid and Martin 2009, Norris and Oppenheim 2010a). An interesting research move in this area was to conduct case studies for the comparison of the h-index with other h-type indices. Costas and Bordons (2007) analysed the relationship of the h-index with activity and impact indicators at the micro level for natural resource scientists of the Spanish National Research Council (CSIC) in order to identify some of its advantages and limitations. Since the h-index is size-dependent (Van Raan 2006), they assumed that the total papers and citations had a profound effect on h-index. This is because of its failure to categorize authors who prefer to publish in noteworthy journals in their niche areas, putting them at a disadvantage when compared with those of intermediate level productivity but with high impact. They tested the hypothesis that the achievement of highly visible but intermediate-productive authors might be underestimated when compared with other scientists by means of the h-index. Using a class diagram to four groups, Costas and Bordons (2007) found that undervalued scientists (those with lower positions by h-index than by impact) presented higher numbers of citations per paper (CPP) and highly cited papers than overvalued scientists (those with higher positions by h-index than by impact). In addition, the former had fewer publications with zero citations as compared to the latter and a neutrally-valued group. The best association was found between the h-index and numbers of papers and citations. Similar to Van Raan (2006), they viewed h-index as size-dependent and pointed out that such indicators might lead the trend towards more productivity and lower quality publications. This reservation was also raised by Butler (2003) and Weingart (2005) for other bibliometric indicators. This contradicts the real strength of h-index; publishing and getting citations are both crucial to improving the h-index of a scientist. They also emphasized its use with other indicators as a complementary tool. They argued that “if the h-index were widely adopted as the only measure of scientific performance, these selective scientists could be unfairly treated” (p.202).
It is a fact that h-index generally plays in favor of more senior researchers – it indicates lifetime achievement instead of current or most recent performance. Fiala (2013), who asserted the need for an “age normalization” factor to be able to fairly compare researchers of different ages, introduced the Current Index which is an h-index based on a 3-year publication/citation window combined with a citation count for that time period. The Current Index is able to change over time (increase as well as decrease) even if the scientist under study is not active, because the new indicator considers a 3-year time window for both publications and citations, and therefore reflects current performance rather than lifetime achievement. Using publication and citation data of 20 winners of the ACM SIGMOD Edgar F. Codd Innovations Award2 from Scopus, Fiala (2013) demonstrated that if the rating is updated regularly (possibly on a yearly basis), it may present a dynamic rating framework in which researchers’ ratings (and ranks) can grow as well as decline in time according to their most recent performance.
In order to compare the ability of ‘h’ and another notable evaluative measure, ‘g’-index, Costas and Bordons (2008) applied the Cole and Cole (1973) criteria to the natural resource scientists at CSIC based on data from the Web of Science from 1994 to 2004. These two indices loaded on the same factor during factor analysis, along with Publication (P) and Citations (C), and could distinguish the extreme cases (top and low producers). However, these indices failed to discriminate the middle order groups (big and selective producers). These findings strengthened Jin et al.’s (2007) point of view that this index is only useful for comparing the better scientists in the field, and does not discriminate among average scientists. These findings were in line with the conclusions made by Costas and Bordons (2007) in their first study. A strong positive relationship was observed between these indices, where the ‘g-index’ showed a better relation with Citations Per Publication (CPP) and Highly Cited Publications (HCP).
In another study, Bornmann et al. (2008) studied the relationship between h-index and several of its variants, i.e., m quotient, g index, h2 index, the A- index, R- index, AR -index, and hw- index, using data from biomedicine research. These variants were uploaded on two components during Exploratory Factor Analysis (EFA) with h, m quotient, h2 and g on the same factor while others were uploaded on the second factor. They assumed that there were two types of indices that stood for different quantity and impact dimensions and complemented each other. In a subsequent study, they included the Standard Bibliometrics Measures (SBMs) with these nine variants (Bornmann et al. 2009a) using molecular life sciences data. They hypothesized whether these new developments made any incremental contributions. Based on both studies they concluded that one type of index describes the most productive core of the output of a scientist and shows the number of papers in the core, while the second depicts the impact of the papers in the core (2009b). The first factor was named ‘Quantity of the productive core’ and second was named ‘Impact of the productive core’. They found high inter-correlation among one set of indices and argued that these made hardly any incremental contribution. They proposed to use either one of the pairs of indicators. One pair is associated with the total research articles in the researcher’s productive core, and the second is related to the impact of the said documents.
A series of case studies was conducted by Schreiber during 2007 to 2013 based on 26 non-prominent physicists’ data from WoS. Based on this dataset, he studied g, h, A and R indices (Schreiber 2008). Egghe (2006a) proposed that the g-index is successful in dealing with citations having a highly skewed frequency distribution. Based on the different ranking of data by these indices, Schreiber (2008) observed a large Pearson correlation coefficient between g and R and argued that the g-index discriminates better between different citation patterns.
In an extension of his study, Schreiber (2010a) differed from the conclusion by Bornmann et al. (2009b) on the use of two separate indices, h and A, to gauge the quantitative and impact dimensions. In his two papers, Schreiber (2010a; 2010b) argued that g and R indices were similar (based on a significant correlation), and both comprise the A-index qualities;, whereas g-index is elegant and comprises information from the productive and impact core. Therefore, he voted for it and proposed to study its application in further studies. In another extension of his study, Schreiber et al. (2011) found the nearly equal loading of the factor for g in the Exploratory Factor Analysis (EFA), which verified his previous assumption. Schreiber (2013) argued in favour of g-index (n = 26); however, De Visscher (2011) claimed, based on a small data set (n = 8), that it was nearly equal to the square root of the total number of citations.
Besides the advantages and disadvantages of the h-index and h-type indices, its application for research performance in many cases is found meaningful. Variants of the h-index are correlated more strongly with peer judgment than the original h-index (Li et al. 2010). Comparison of different indices indicates that the studied indicators are loaded on two different dimensions of the research components (Bornmann et al. 2008; 2009a; Schreiber 2008; 2010a; 2010b; Schreiber et al. 2011). Several studies found that h-type indices fall clearly on one dimension. Derrick et al. (2011) evaluated the relationship of four citation-based metrics, h-index, m-index, m-quotient and q2-index, with peer judgment for six fields. They emphasized the need to explore field data to find out the appropriate metric. These studies reveal that among the most noted h-type indices are g-index, followed by several other indices such as A, R, AR, q2, m-indices, m quotient, etc.
Based on various disciplines’ data, Van Leeuwen (2008) reported that both productivity and h-index scores of these disciplines had a noticeable difference. Another noteworthy finding was that age that did not seem to be correlated with h-index scores. Tyson (2009) studied the effect of gender, country of residence, institutional affiliation, and scientific age on 35 library and information science (LIS) researchers’ h-index of New Zealand and Australia. Only a positive relationship was found between scientific age and h-index scores.
In this paper, the relationship of h-index and institutional affiliation is explored, to position the traditional metrics and newly developed research performance indices for research performance evaluation (RPE) in higher education. To do so, an experimental work of researchers’ publication data at the micro level is scientometrically designed, and quantitative evaluation is carried out to get an answer about the feasibility of the h-index and h-Type Indices (h-TI) for research evaluation.
Objectives and method
The main objective of this study is to compare the performance, underlying dimensions and positioning of traditional metrics and newly developed research evaluation indices to evaluate university research performance. The EFA is applied to explore the underlying dimensions of h-TI indices for RPE. Malaysian engineering research is our unit of analysis for the reason that engineering is a multidisciplinary and interdisciplinary applied field and has broader applications. A scientometric analysis is carried out with the application of a set of three indicators at the micro level (a) Activity Indictor (AI); (b) Observed Impact Indicator (OII), and (c) h-index; with a set of the most studied h-Type Indices (h-TI) consisting of Publication (P), Citation (C) and Citations Per Publication (CPP), and g, A, R, m, q2,
The case of the first 100 most productive Malaysian engineering researchers from WoS over a 10-year period (2001-2010) is analyzed. Appendix 1 presents the detailed results for the top 10 researchers; details of the results for all 100 researchers may be obtained from the corresponding author. The results of the analysis reported below apply to the full sample of 100 researchers.
The research output is refined in terms of time span, document type, engineering research categories and selection of database. The search term used was ‘Malaysia’ and it was limited to only the 9 engineering categories from WoS that have the word ‘engineering’ in common: engineering – electrical and electronic engineering – manufacturing engineering – biomedical engineering – industrial engineering – civil engineering – chemical engineering – mechanical engineering – environmental engineering – multidisciplinary.
The term ‘Malaysian engineering researchers’ is used for researchers who are affiliated with 11 Malaysian universities under nine WoS engineering categories. As a rule, these universities have published >50 publications for two document types: articles and reviews. They are: Universiti Sains Malaysia (USM) Universiti Putra Malaysia (UPM) University of Malaya (UM) Universiti Teknologi Malaysia (UTM) Universiti Kebangsaan Malaysia (UKM) Universiti Teknologi Mara (UiTM) International Islamic Universiti Malaysia (IIUM) University of Multimedia (MMU) University of Nottingham Malaysia Campus (UNMC) Universiti Teknologi PETRONAS (UTP) Monash University Sunway Campus (MONASH).
The metrics and indices used at micro level in the study are defined as follows: 1. Activity Indicator (AI) 2. Observed Impact Indicator (OII) 3. h and h-Type Indices
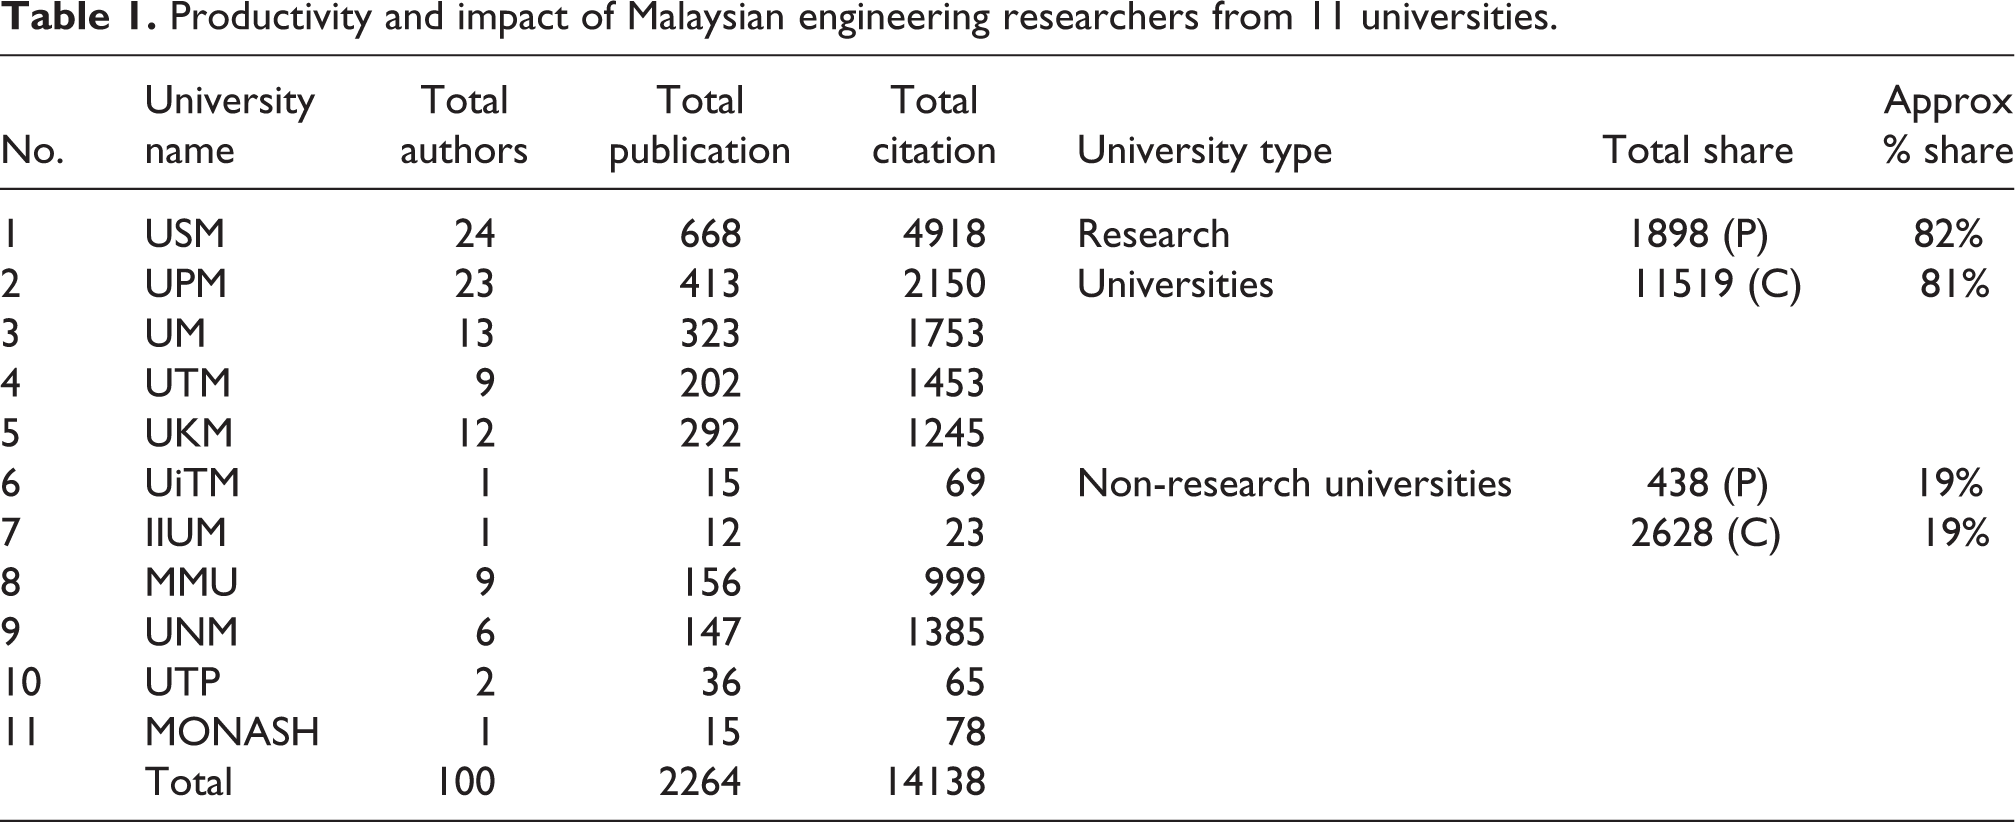
The top 100 prolific authors belonged to 11 universities. These researchers contributed a significant share of total research output and visibility of their institutions over the entire period of study. Table 1 presents the universities’ total share of publication and citation percentage. The five research universities have a total of 80 authors who share more than 80% in terms of productivity and impact, while six other non-research universities share about 20% of the sample data.
Productivity and impact of Malaysian engineering researchers from 11 universities.
The values of different indicators for the top 10 researchers in the sample are computed and presented in Appendix 1. Based on the data, we checked the ranking, descriptive evaluation and performance of these indices. There is a significant fluctuation in ranking order of these researchers with respect to the application of all indicators.
Results
Descriptive information of a set of indicators for the performance evaluation purpose is presented in Table 2. The h-TI set consists of six h index variants (g, A, R, m, q2 and
Descriptive statistics of researchers’ indices data.
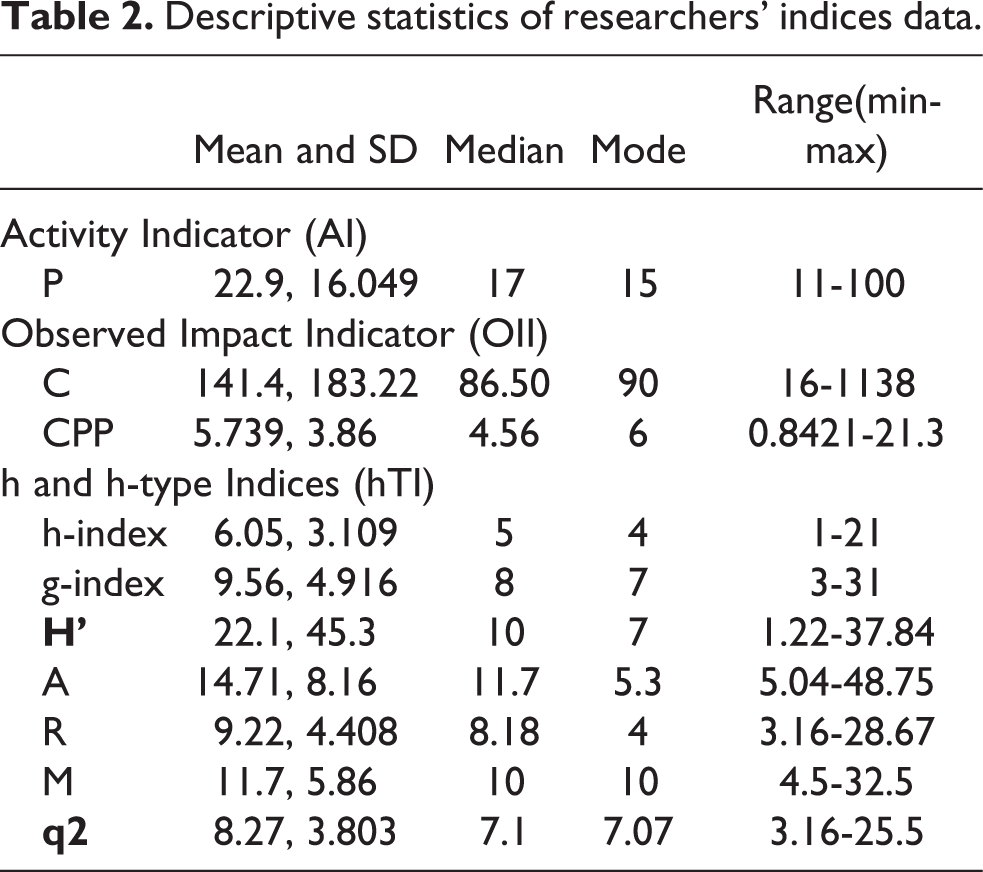
The h-index is sensitive to disciplinary perspective (Iglesias and Pecharroman 2006; Van Leeuwen 2008). An overview of h-index of various disciplines based on different strength of data, number of researchers and regional perspective, stated that the average h-index for information sciences was 11 in the case of scholars from the USA and ranges from 20-5 (Cronin and Meho 2006); in the case of British LIS scholars, the average h-index was 7 and in the range of 31-5 (Oppenheim 2007). Saad (2006) found the h-index of consumer researchers was between 17-3, whereas computer scientists had the h-index in the range of 24 to 14 (Sidiropoulos et al. 2007). An important aspect is that the above mentioned findings are considerably lower than world prolific authors in physics and the life sciences, that range between 110-62 and 191-120 respectively (Hirsch 2005). In our case, the average h-index of engineers in our dataset is 6 and in the range of 21-1.
Box Plots illustration
The box plots of AI, OII and h and h-TI as seen in Figure 1(a-i) indicate the comparative performance of these indicators. This log-transformed data helps to understand the degree of dispersion, outliers and skewness of the data. These plots tell us the median, the upper and lower quartiles of central tendency, and the highest and lowest values of the data set. C and CPP illustrate a better median and extreme positions among AI and OII case; whereas, among h and h-type indices, h-index and R-index exhibit better position for lower and upper levels.
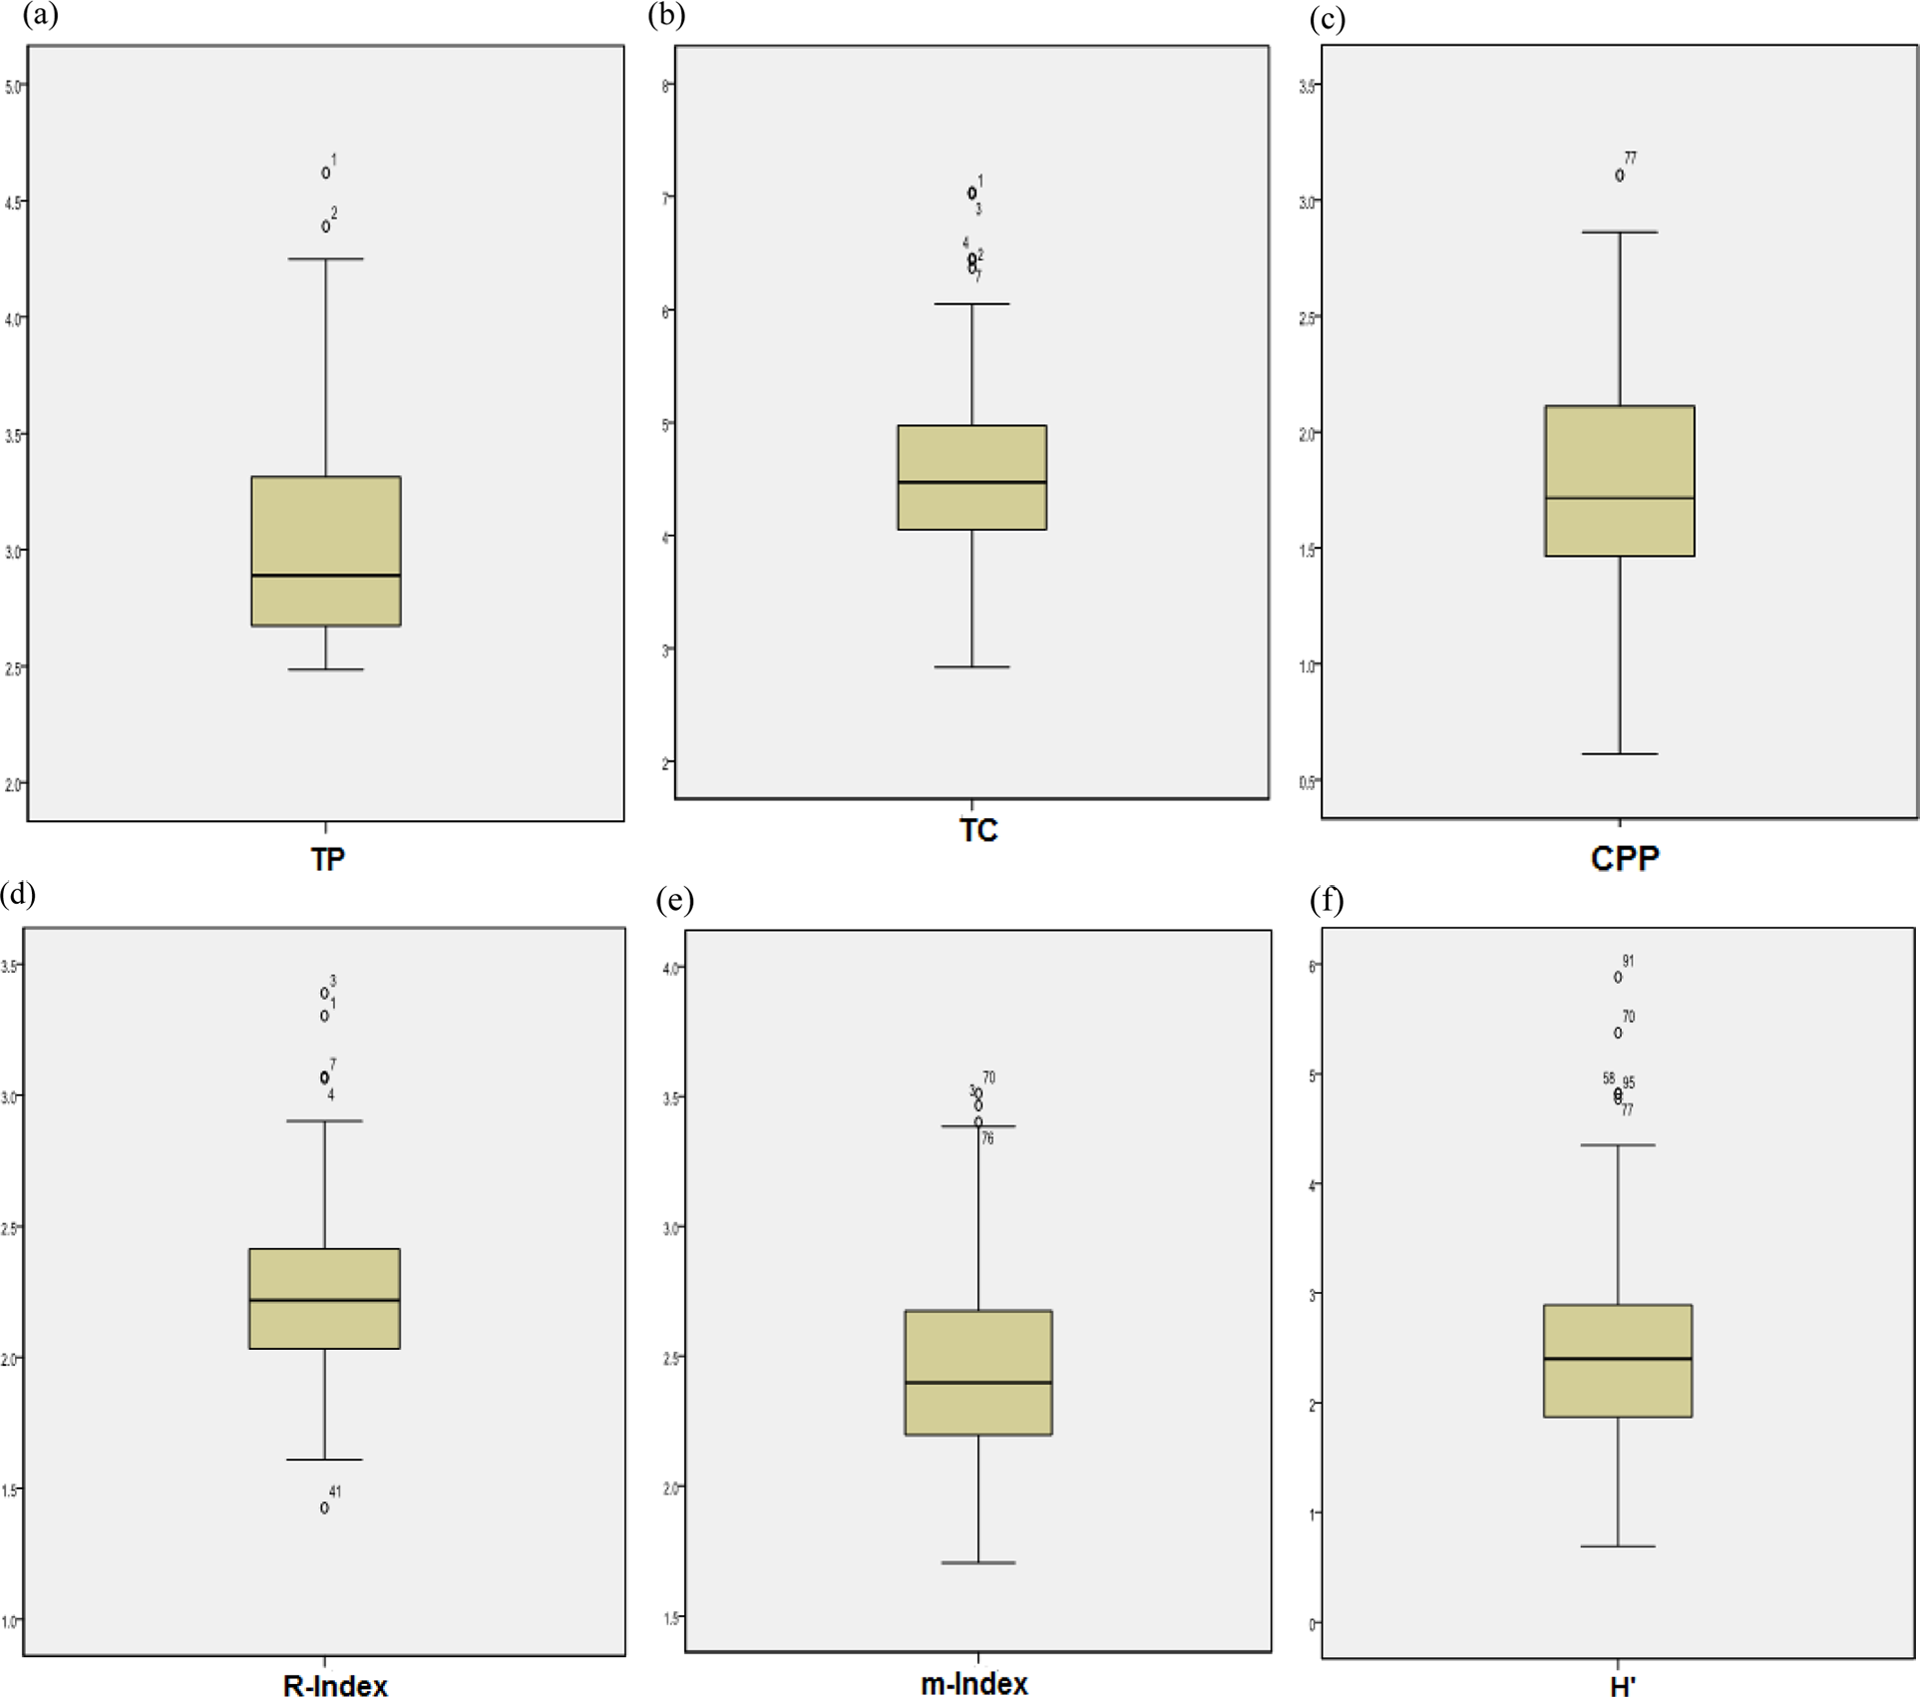
Box plots illustrations of AI and OII and h-index and h-TI.
Institutional affiliation and researcher’s h-index score
We employed Kruskal-Wallis, a popular non-parametric test for comparing K-independent samples inference (Siegel and Castellan 1988). We applied this test to examine the influence of institutional affiliation on a Malaysian researcher’s h-index scores (Table 3). The result indicates that there is no significant relationship (asymptotic. Sig. >.05) between the institutional affiliation and researcher’s h-index score. Therefore, our hypothesis that there is a relationship between institutional affiliation and researcher’s h-index score is rejected.
Kruskal-Wallis test for institutional affiliation and researcher’s h-index score.

aSignificant at .05 level.
bgrouping variable: affiliation.
Typically, researchers belonging to prestigious institutions have an influence on the productivity and quality of research produced (Meaddows 1998; Allison and Long 1990). Table 1 reveals a significant difference in contributions from researchers of research and non-research university status. Notwithstanding, we have also observed that the highest h-index score is concentrated in a few universities. This endorses the results of a study by Oppenheim (2007). Kelly and Jennions (2006) for the first time raised the issue that there might be some relation between institutional affiliation and researcher’s h-index score. However, empirically this is found false. Tyson (2009) also made such an observation for 35 LIS academics of Australian and New Zealand universities.
Functional relationship and predictive values
We conducted a statistical analysis under the prescribed research objectives. The objective was to examine the functional relationship, predictive values and to explore the underlying dimensions of this relationship and a potential set of these indices for an objective solution.
A linear regression model fit was employed to observe the association of h-index with activity and impact metrics. Figure 2a shows a strong functional relationship with citation (R2 = 0.86). This relation is found to be weaker (Figure 2b) for publications (R2 = 0.635), while CPP (Figure 2c) displays a weak positive (R2 = 0.369) relation with h-index. The regression power trends (Figures 2 a-c) illustrate that all traditional metrics exhibit a predictive value, which is nearly equal to the square of the multiple of h = 0.934p0.594; 0.562C0.499 and 2.398CPP0.521. At the author level, the total citation is found to be the best predictor of h-index for the given dataset followed by P and CPP.

Functional relationship among h-index and C, P and CPP.
To “explore the factors of research performance dimension and to answer which index is feasible” is a crucial issue raised by Burell (2007 p.168). To further examine the relationship between different indices, Exploratory Factor Analysis (EFA) was applied. Factor analysis was used to study the structure of inter-correlation of the indices that purported to measure something similar (Harnad 2007). Factor analysis is a statistical method “to reduce the dimensionality of the data space to discover, visualize and interpret dependencies among sets of variables” (Timm 2002: 445). EFA is employed to examine the valid categorization and study the underlying properties by probing the inter-correlation among the h-index, its variants, AI and OII at the researchers’ level.
Exploratory Factor Analysis (EFA)
The descriptive analysis of the dataset indicates that few indices exhibit a significant variation between mean and median with a large standard deviation (Table 2). Scientometric data are usually not symmetrically distributed and are skewed (Egghe 2006; Bornmann et al. 2008; Moed, 2005). We therefore applied Egghe’s assumption (2005; 2006) that the relationship between any two indices is nonlinear and can be described as a power function. To get a more likely approximation for a normal distribution, we applied square root and logarithmic transformation to the raw dataset. For the case, we found that the logarithmic transformation was best. Table 4 shows the descriptive statistics with skewness and kurtosis results of transformed data. The values of skewness and kurtosis in between ±2 are acceptable (George and Mallery 2003). The log-transformed data result indicates that the data is now adequately normal for Exploratory Factor Analysis (EFA).
Descriptive statistics, skewness and kurtosis results of all indicators.
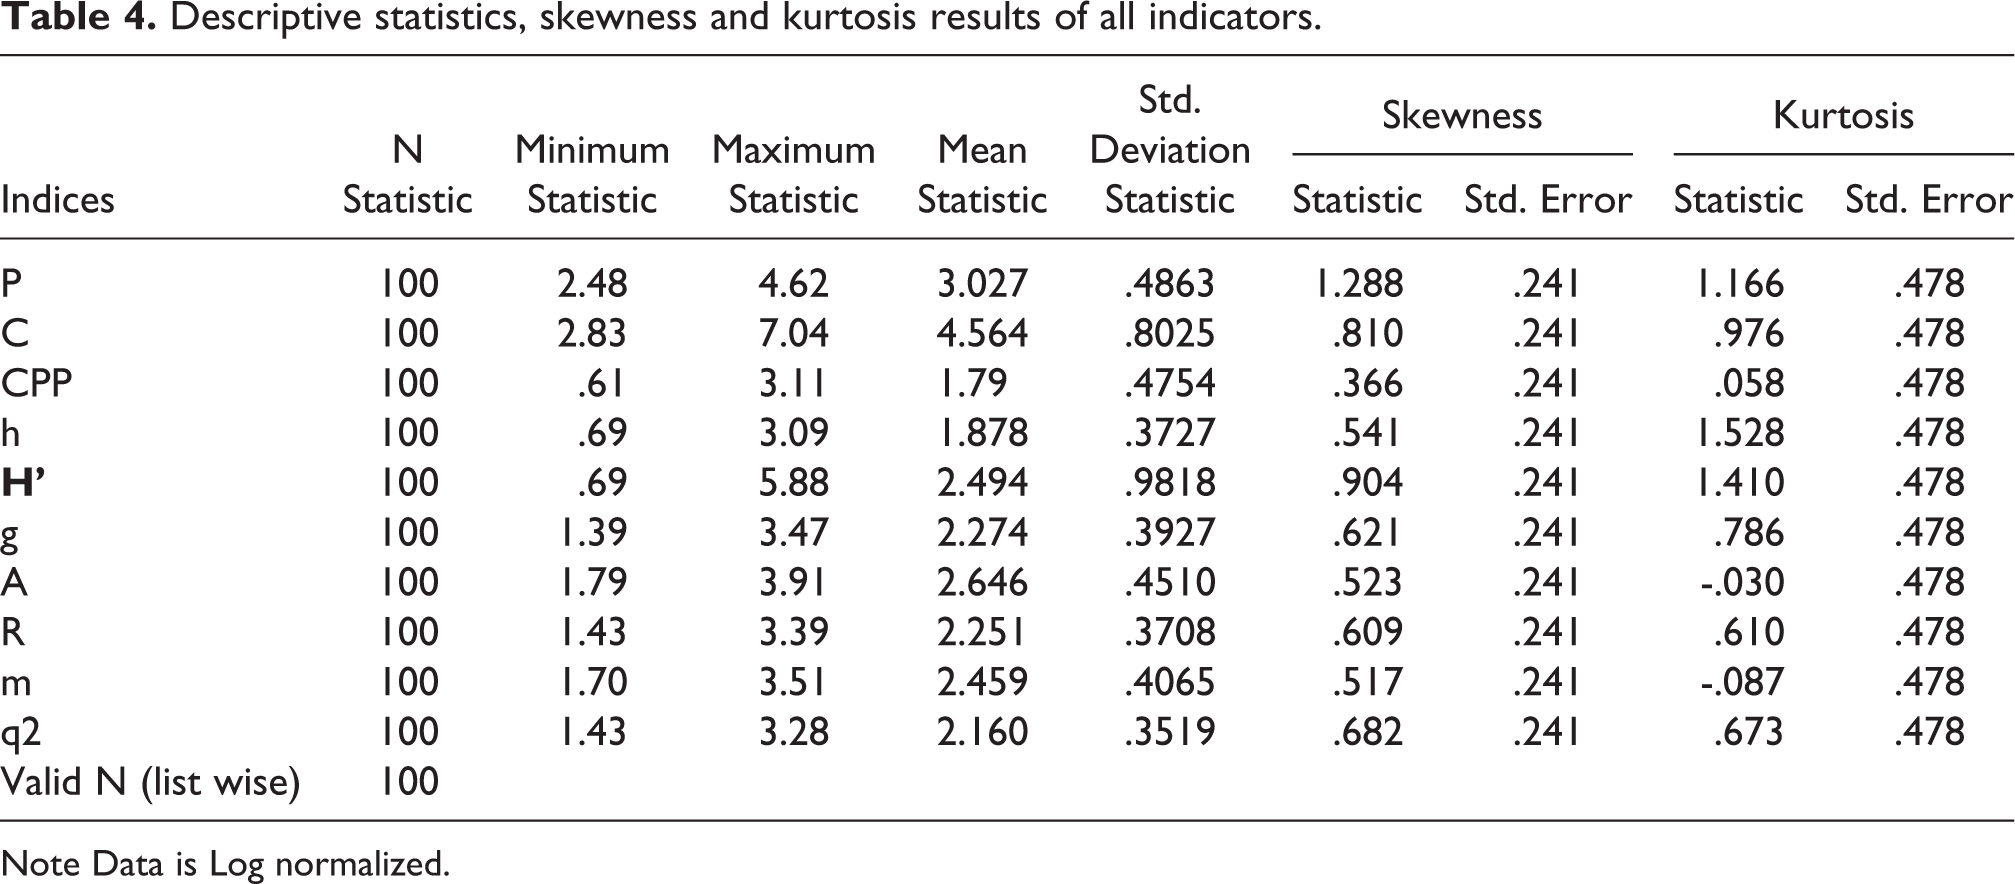
Note Data is Log normalized.
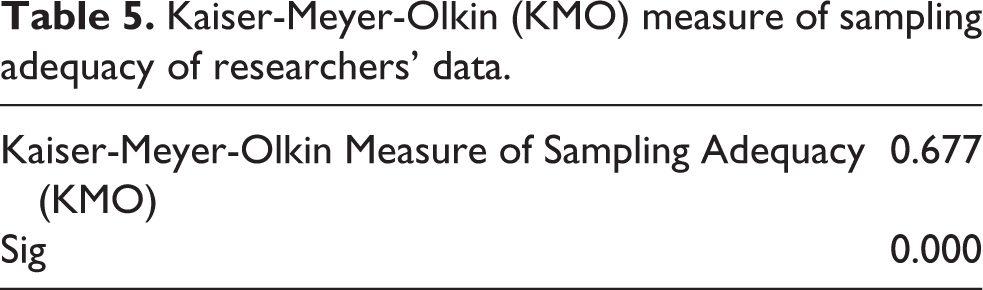
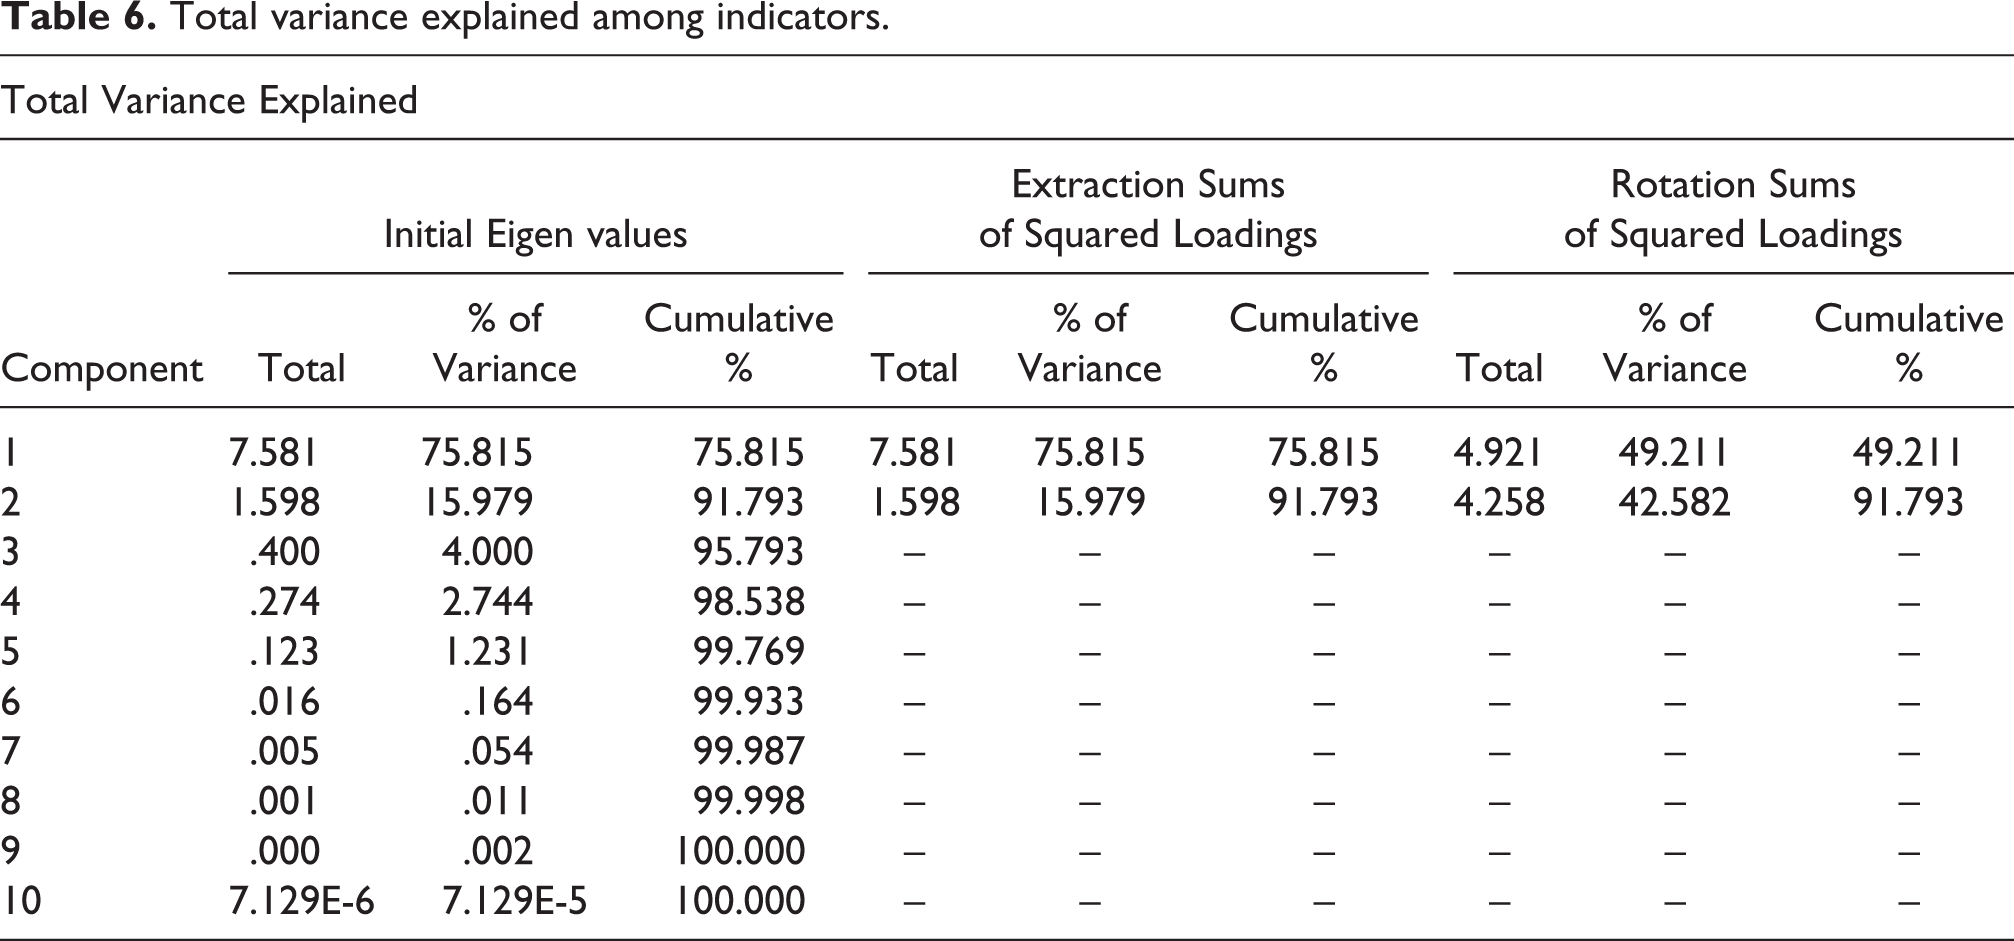
We applied EFA to our transformed dataset. The Kaiser-Meyer-Olkin (KMO) measure of sampling adequacy of researchers’ data should be greater than 0.5 to decide to apply EFA. In our case the KMO value is adequate (.>65) to apply EFA (Table 5) with high commonalities (>.85) except for m-index (>0.75). The scree plot at Figure 3 also shows a clear bend for two components. The percentages of total variance accounted for by each factor (P and C) are 76% and 16% respectively, and these two indices together accounted for 92% of the total variance (Table 6).
Kaiser-Meyer-Olkin (KMO) measure of sampling adequacy of researchers’ data.
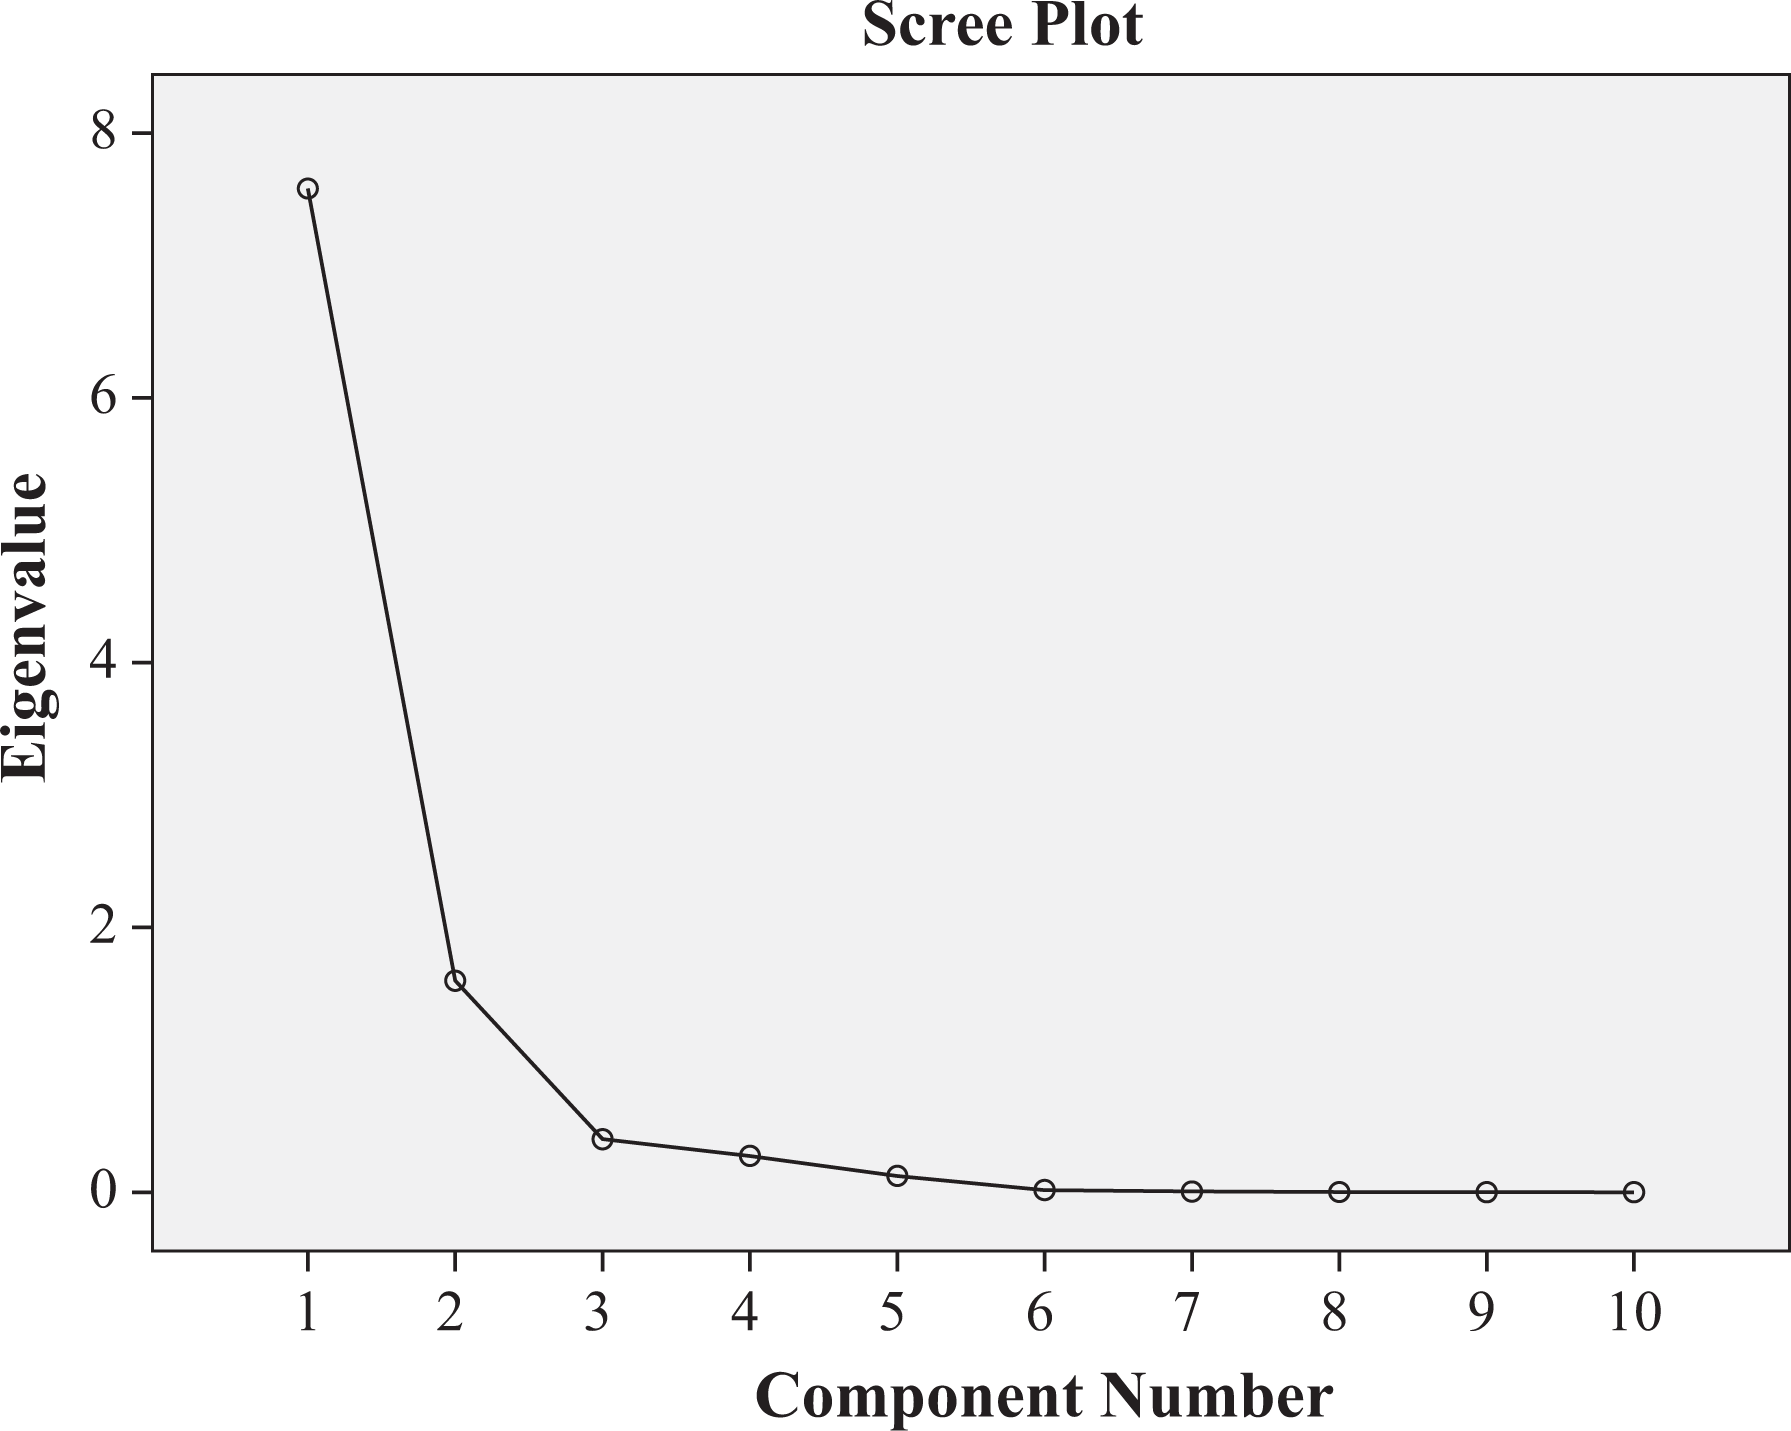
Scree plot for all components.
Total variance explained among indicators.
Component matrix executes the results for a two-factor solution (Table 7). Bornmann et al. (2008) used a greater than 0.6 cut-off threshold for categorization of the indices between the factors. For this case, we have also used >0.6 cut-off thresholds to make clear categorization. Rotated component matrix (Table 7) is loaded h-index along with P, C, q2 and g on the first component, while CPP,
Rotated component matrix for all indicators.

Extraction Method: Principal Component Analysis.
Rotation Method: Varimax with Kaiser Normalization
Values >.6 are in boldface
Costas and Bordons (2007), in a study of natural resources researchers at CSIC using WoS data (1994-2004) reported the same tendencies for h, P and C as we observed in this study. In a second study (Costas and Bordons 2008), they also included g-index, that holds a position on the first factor. Notably, other indices in their set are related to the relative impact and IF median, and they extracted four components. The same result for g-index was reported by Bornmann et al. (2008; 2009a) for postdoctoral researchers in biomedicine. However, two noticeable findings are about the citation metric (Bornmann et al., 2008) and g-index (Schreiber et al., 2012). They reported their position on the second component with R-index, while we differ for C and g position (Table 7) as observed by aforesaid studies. Except for these conspicuous findings, the current study is mostly in agreement with Costas and Bordons (2007) as well as Bornmann et al. (2008; 2009a).
Discussion and conclusions
To observe a general ranking behavior, we analyzed the scientific research productivity and citation input of the first 100 most productive Malaysian engineering researchers. Eighty percent of the most productive authors have an affiliation with five research universities. USM and UPM have almost equal numbers of prolific authors. Other prominent universities are UM, UKM, UTM, and MMU respectively. We applied four set of indicators (AI, OII, h, and h-TI), which demonstrate discriminating power for the ranking purpose. Application of indices shows a large variation in the positioning order of researchers. This is more evident in the case of m, R and
About half (47) of the authors in our dataset belong to two universities (USM and UPM). Despite this fact, no influential relation of Malaysian institutional affiliation and researcher’s h-index scores was found. Nevertheless, these indices play a key monitoring role in decision making for the recruitment process and may be a valid supporting tool for the peer review process in higher education institutions. In addition, h-index has gained popularity and immediately become part of global citation databases. It has been considered for evaluation purposes at the individual level. It seems that to link prolific researchers’-h-index with their respective institutional affiliation is still not mature for incentive or selection purposes. Nonetheless, we have observed the place of this index and its discriminatory power in the present and certain past studies. One of the strong reasons for such a finding might be the time frame of the study. Another strong reason is the disciplinary perspective (Iglesias and Pecharroman 2006). Furthermore, the culture of research, the policies of the Ministry of Education and uneven international visibility can be influential factors.
To examine the appropriateness of this index for the researchers, we have explored power regression trends, which illustrate that total citation is the best predictor and has strong model fit with h-index at this level. Predictive power is a square of the multiple of traditional metrics P, C, and CPP. To find the best index in the RPE process, EFA was applied. A two-factor solution was extracted, named ‘quantity of the productive core’ and ‘impact of the productive core.’ Our findings strengthen the point that citation count has a strong association with the ‘quantity of the productive core’ and cannot be used as sole impact evaluation measure (Garfield, 1983; Coastas and Bordons, 2008; Leydesdorff, 2009; Schreiber et al., 2011). Therefore, more indices are required to address the impact core. Interestingly, h-index also shows its place on the quantity of the productive core in the present and various other past studies. The potential impact indices at the micro level for the present case are CPP,
Our findings for the studied indices at this level are in general agreement with the previous studies. To examine the feasibility of the h-index for the researcher, we have explored regression power trends, which illustrate that total citation is the best predictor and has strong model fit at this level. Predictive power is the square of the multiple of traditional metrics P, C, and CPP. The high correlation, predictive value and loading of h-index on the same component (in EFA), depicts that this index has the potential to work as traditional P and C metrics for broader impact performance evaluation purposes.
Footnotes
Appendix 1. Application of AI,OBI h and H-type Indices to most Prolific Malaysian Engineers
The results of the analysis reported in the text apply to the full sample of 100 researchers.
Acknowledgement
The work of Muzammil Tahira and A. Abrizah was supported by the Ministry of Higher Education Malaysia (HIR-MOHE) UM.C/HIR/MOHE/FCSIT/11.