



Abstract
Background
During catheter-directed thrombolysis (CDT), D-dimer (D-D) are generated in large quantities and fibrinogen (FIB) is continuously consumed. Reduction of FIB increases the risk of bleeding. However, there are currently few studies on the relationship between D-D and FIB concentrations during CDT.
Objectives
To evaluate the relationship of D-D and FIB concentrations during CDT with urokinase for deep venous thrombosis (DVT).
Method
17 patients with lower limb DVT were enrolled and treated with CDT. The concentrations of plasma D-D and FIB were measured every 8 h during thrombolysis. The degree of thrombolysis was evaluated, the change rules of D-D and FIB concentrations were analyzed, and the change curve graphs were drawn. The “thrombus volume,” “thrombolysis time,” “thrombolysis ratio,” “D-D peak,” “D-D rising speed,” “FIB falling speed,” and “duration of D-D elevation” were calculated in each patient. The mixed model was used to simulate the time change trend of the plasma D-D and FIB concentrations. Pearson method and linear regression were used to analyze the correlation and linear relationship, respectively.
Results
The D-D concentration first increased rapidly and then decreased gradually, and the FIB concentration continued to decrease during thrombolysis. The rate of the decline of FIB varies with the urokinase dose. The thrombus volume is positively correlated with D-D rising speed, duration of D-D elevation, D-D peak, and FIB falling speed; the D-D rising speed is positively correlated with the D-D peak and FIB falling speed; and the D-D peak is positively correlated with the FIB falling speed. The correlation coefficients were all statistically significant (p < 0.05). Efficacy reached level I–II in 76.5% patients. No major bleeding occurred in any of the patients.
Conclusion
During CDT with urokinase for DVT, the concentrations of D-D and FIB show specific changes, and there are some specific relationships between each other. Understanding these changes and relationships may be helpful to adjust the thrombolysis time and urokinase dose more rationally.
Introduction
Urokinase, one of the most commonly used thrombolytic agents, is often used in the treatment of deep venous thrombosis (DVT).1,2 In clinical practice, changes in D-dimer (D-D) and fibrinogen (FIB) concentrations can frequently be observed during catheter-directed thrombolysis (CDT) with urokinase administered for treating DVT.
D-D is one of the several fragments that are produced when plasmin, an enzyme activated through the fibrinolytic pathway, cleaves fibrin to break down clots. 3 Because of its specificity, the presence of D-D is evidence for coagulation and fibrinolytic system activation. 4 Thus, D-D testing has become one of the commonly requested coagulation tests, especially for ruling out venous thromboembolism (VTE). 5 During thrombolysis, D-D is produced in large quantities as a result of the dissolution of thrombus.
FIB, a plasma glycoprotein that is synthesized in the liver, is essential for blood coagulation. 6 It is an essential protein for hemostasis and circulates at the highest concentration among all the coagulation proteins. 7 During thrombolytic therapy, FIB is constantly consumed. The reason for this is that urokinase can catalyze plasminogen to plasmin at the time of thrombolysis, and the latter can degrade FIB and non-crosslinked fibrin.5,8,9 Moreover, FIB can also be directly degraded by urokinase. 10 The loss of FIB can lead to coagulation disorders, which in turn lead to bleeding. Therefore, in recent years, FIB has gradually attracted the attention of clinicians.
However, the current understanding of the change rules of D-D and FIB concentrations and the relationships between them during CDT with urokinase is not clear enough. Therefore, to address these gaps, we aimed to retrospectively analyze relevant data that were collected from lower limb DVT patients who were being treated with CDT at our hospital.
Material and methods
This study included 17 patients with lower limb DVT who were treated with CDT between January 2017 and January 2018.
Patient selection
We selected patients who satisfied the following criteria: (a) lower limb DVT having occurred within the past 14 days, (b) no history of DVT, (c) unilateral lower limb thrombosis, and (d) no contraindications to thrombolytic and anticoagulant drugs: acute intracranial hemorrhage, visceral hemorrhage, old cerebral infarction, intracranial or spinal surgery within the past 2 months, intracranial tumor, arteriovenous malformation or aneurysm, hemorrhagic constitution, severe and refractory hypertension, surgery or tissue puncture within 3 weeks, pregnancy or 10 days after delivery, active gastrointestinal ulcer, allergy to heparin and low molecular weight heparin, severe coagulation disorders, history of low molecular weight heparin or heparin-induced thrombocytopenia, severe renal insufficiency.
Catheter-directed thrombolysis
Before CDT, inferior vena cava filters (IVCFs) were placed. All the patients provided informed consent prior to CDT. CDT was performed under local anesthesia. The popliteal vein or posterior tibial vein on the affected side, femoral vein on the healthy side, and right jugular vein are usually chosen as venipuncture sites, and then the 5F catheter sheath was inserted after successful puncture. Venography was performed first to assess the extent of the thrombus. Then a 5F Uni*Fuse Infusion Catheter (Angio Dynamics, Latham, NY, USA) was inserted into the thrombus through the catheter sheath under the guidance of DSA. After the catheter was placed in a predetermined position, a micro syringe pump was connected to the end of the catheter. Half a million units of urokinase were mixed with 50 mL of normal saline, and was infused continuously at a dose of 4 mL/h using a micro syringe pump.
D-D and FIB testing
Plasma D-D and FIB concentrations were tested every 8 h during thrombolysis. The plasma D-D concentration was determined by an immunoturbidimetric assay, and Nanopia D-dimer Kit (Sekisui, Tokyo, Japan) was used. The plasma FIB concentration was determined by the coagulation method, and Dade Thrombin Reagent (Siemens, Erlangen, Germany) was used. Both of the tests were performed using a Sysmex CA7000 automatic coagulation analyzer (Sysmex, Kobe, Japan). Approximately 1.8 mL of venous blood was extracted from each patient at the bedside and was stored in vacuum vessels containing 0.2 mL of 109 mmol/L sodium citrate, which were then centrifuged for 10 min at 3000 r/min. After centrifugation, the plasma was transferred to the Sysmex CA7000 automatic coagulation analyzer for testing immediately.
Dose adjustment and withdrawal time
If 1.0 g/L < FIB <1.5 g/L, the dose of urokinase was reduced to 2 mL/h. If FIB <1.0 g/L and the concentration of D-D was still high, thrombolysis was suspended but the catheter was kept in place and performed saline infusion. After FIB increased to >1.5 g/L, thrombolysis was restarted. If FIB <1.0 g/L and the concentration of D-D was close to or lower than the prethrombolysis level, thrombolysis was discontinued. If the FIB concentration was consistently above 1.5 g/L, urokinase was continued at a dose of 4 mL/h, and thrombolysis was stopped under one of the following conditions: 1. D-D decreased to the prethrombolysis level, 2. bleeding complications occurred during the treatment. Venography was performed after thrombolysis was stopped, rather than during thrombolysis.
Adjunctive treatments
After CDT, patients were reviewed for venography again. If iliac vein stenosis was found, balloon dilatation and stenting were performed. The vena cava filter was removed on final venography if there was no longer any thrombosis involving the inferior vena cava (IVC). All patients underwent anticoagulant therapy with subcutaneous low molecular weight heparin (LMWH) during CDT.
Efficacy evaluation
The efficacy of CDT was classified into four levels based on the results of a physical examination and angiography by three senior interventional radiologists.
11
Level I: tension and mobility of the lower limbs were normal; circumference difference between the two sides was <1.0 cm; venography showed that the blood flow was completely recovered; no stasis of contrast medium, no collateral vessels, and the vessel wall was smooth. Level II: tension and mobility close to normal; circumference difference between the two sides was 1.0–1.5 cm; venography showed that the blood flow was substantially recovered; no stasis of contrast medium, a few collateral vessels, and the vessel wall was smooth. Level III: tension and mobility partially improved; circumference difference between the two sides was 1.5–2 cm; venography showed that the blood flow was partially recovered, mild stasis of the contrast medium, many collateral vessels, and the vessel wall was less smooth. Level IV: no improvement in tension and mobility; circumference difference between the two sides was >2.0 cm; venography showed that the blood flow was not restored and the contrast medium was markedly stasis, a large number of collateral vessels, and the vessel wall was not smooth.
Thrombus measurement
The thrombolysis ratio was calculated according to venography before and after CDT. A modified version of the quantitative method that was proposed by Mewissen was used.
12
The thrombus score was calculated for seven venous segments: the inferior vena cava (IVC), common iliac vein, external iliac vein, common femoral vein, proximal portion of the superficial femoral vein, distal portion of the superficial femoral vein, and popliteal vein. The thrombus scores were as follows: 0, patent vein completely free of thrombi; 1, partial occlusion with a stenosis rata of <50%; 2, partial occlusion with a stenosis rate of >50%; and 3, complete occlusion. The total thrombus score was calculated by adding the scores of the seven venous segments, and this score was used to represent the “thrombus volume.” Then, the thrombolysis ratio was calculated using the following formula

The thrombus scores were determined by three senior interventional radiologists after a joint review of the venography images.
Definition of major bleeding
Subcommittee on Control of Anticoagulation of the Scientific and Standardization Committee of the International Society on Thrombosis and Haemostasis recommends the following criteria for major bleeding in non-surgical patients
13
: 1. Fatal bleeding, and/or 2. Symptomatic bleeding in a critical area or organ, such as intracranial, intraspinal, intraocular, retroperitoneal, intraarticular or pericardial, or intramuscular with compartment syndrome, and/or 3. Bleeding causing a fall in hemoglobin level of 20 g/L (1.24 mmol/L) or more, or leading to transfusion of two or more units of whole blood or red cells.
Ethical considerations
All enrolled patients provided informed consent. This study was approved by the Medical Ethics Committee of Shanghai Jiaotong University Affiliated Sixth People’s Hospital South Campus.
Data processing
The D-D and FIB values of all patients were recorded at different timepoints. The “D-D peak,” “D-D rising speed,” “FIB falling speed,” and “duration of D-D elevation” were calculated based on the overall change rule of the plasma D-D and FIB concentrations in each patient. 1 The D-D peak represents the maximum concentration of D-D in the plasma during thrombolysis. 2 The D-D rising speed is the rising speed of the D-D concentration in the plasma during thrombolysis and was calculated using the following formula 3 The FIB falling speed refers to the drop speed of the FIB concentration in the plasma during thrombolysis and was calculated using the following formula 4 The duration of D-D elevation represents the duration of increased D-D concentration in the plasma during thrombolysis and was defined as the time from the beginning of thrombolysis until the timepoint at which the D-D value was first observed to be equal to or lower than the D-D value before thrombolysis.


Statistical analysis
The SAS 9.4 (SAS Institute, Cary, NC, USA) software was used to simulate the time change trend of the plasma D-D and FIB concentrations using a mixed model and to draw the plot. The other calculations, plotting, and statistical analyses were performed using the R 3.3.4 (R Core Team, R Foundation for Statistical Computing, Vienna, Austria) software. First, the Pearson method was used for a correlation analysis among variables. Subsequently, the Corrplot package in R 3.4.4 was used to draw the correlation coefficient thermal diagram. Linear regression was used to analyze the linear relationship between the variables with statistically significant correlation coefficients. The plot function in R 3.4.4 was used to draw the scatter diagram. All the tests were two-tailed, and p < 0.05 was considered statistically significant.
Results
Characteristics of 17 patients undergoing thrombolysis.

Abbreviations: SD, standard deviation; IVC, inferior vena cava; IV, iliac vein; FV, femoral vein; PV, popliteal vein.
Therapeutic effect
The average thrombolysis time was 68.5 h. Efficacy reached level I–II in thirteen (76.5%) patients, and level III in remainders. Hematuria occurred in one patient during thrombolysis, and hemorrhaging occurred at the puncture site in two patients. No major bleeding complications occurred in any of the patients.
Changes in D-D and FIB concentrations
The time-varying trends of the plasma D-D and FIB concentrations are shown in Figure 1 and Figure 2. The trend test results revealed that the time-varying trends of D-D and FIB concentrations were significant (FD-D Concentration = 8.79, p < 0.01; FFIB Concentration = 16.89, p < 0.01). Variation trend of D-D concentration. Abbreviations: D-D, D-dimer. Variation trend of FIB concentration. Abbreviations: FIB, fibrinogen.

Correlation analysis
Linear regression analysis among variables.
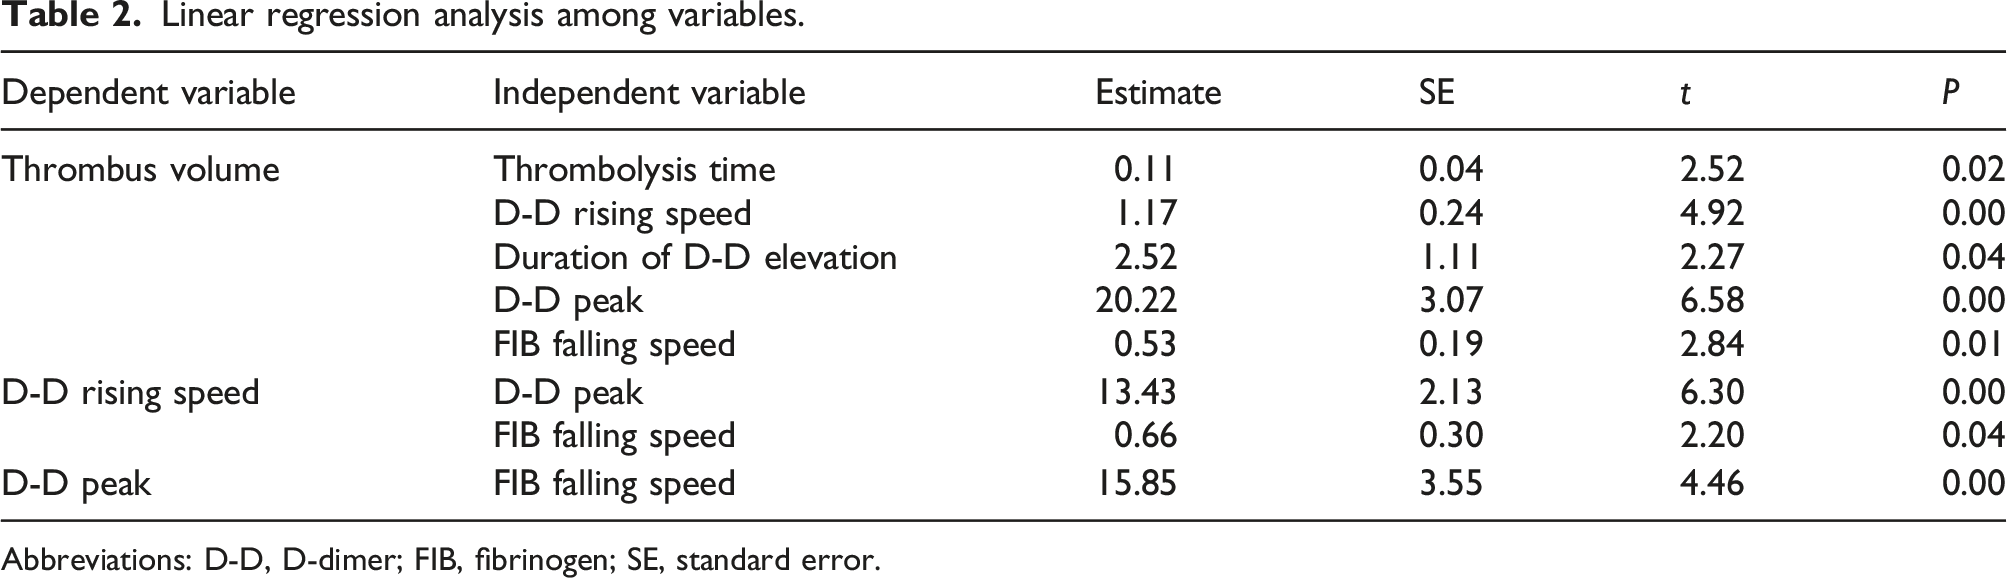
Abbreviations: D-D, D-dimer; FIB, fibrinogen; SE, standard error.

Correlation coefficient thermal diagram of each variable. Abbreviations: D-D, D-dimer; FIB, fibrinogen.
Regression analysis
A regression analysis was performed for variables with statistically significant correlation coefficients. As shown in Table 2 and Figure 4, the regression coefficients of all the variables were statistically significant (p < 0.05). Scatter plots between variables.
Discussion
Urokinase is a commonly used drug in thrombolytic therapy.1,14–17 It can catalyze plasminogen into plasmin, and plasmin can cleave fibrin (the major structure in the thrombus) to D-D. D-D is the final product of the plasmin-mediated degradation of crosslinked fibrin. 5 The concentration of D-D in plasma increases in patients with acute VTE. 18 Because of its high negative predictive value, D-D assays are commonly used to exclude a diagnosis of VTE.6,19,20 Therefore, D-D testing has long been one of the standard initial steps of the VTE diagnostic work-up in clinical practice.21,22 Recently, the rapid increase in D-D concentration during thrombolytic therapy has attracted increasing attention.23,24 As a result, D-D is regarded as an indicator for evaluating the effectiveness of thrombolytic therapy. 2 Engelberger et al. tried to use D-D to reflect the efficacy of thrombolysis and found that the more D-D increased the efficiency of thrombolysis was higher. 25 Dong et al. measured D-D before, during (the 24th hour) and after CDT, and showed a significant increase in D-D in patients with effective thrombolysis. 26 However, the intervals between D-D testing in these studies were too long to respond well to the change rules in D-D.
In this study, the plasma D-D concentration was measured every 8 h during this experiment. We found that the variation rule of the D-D concentration involved an initial rapid increase followed by a decrease (Figure 1). The reason for the rapid increase in D-D is easy to understand because urokinase can rapidly degrade a thrombus and produce D-D. For the subsequent decrease in D-D concentration, we speculate that there are two reasons. First, owing to the dissolution of the thrombus, the venous blood flow partially recovers, and the pumped urokinase is quickly carried away by the blood flow, resulting in a decrease in the urokinase concentration around the thrombus; therefore, D-D production is reduced. Second, D-D is constantly consumed by metabolism. If the consumption is greater than the production, the concentration would gradually decrease. With the gradual dissolution of the thrombus, the production of D-D gradually decreases, and the D-D concentration gradually approaches pre-thrombolytic levels and can even revert to normal levels. In view of this, if the plasma D-D concentration drops to pre-thrombolytic or normal levels during thrombolytic therapy, the thrombus is thought to be largely dissolved. At this point, in order to avoid ineffective urokinase use and to reduce the risk of bleeding, thrombolysis can be stopped.
Moreover, the statistical analysis revealed that the D-D rising speed, D-D peak, duration of D-D elevation were positively correlated with the thrombus volume (Figure 4). We speculate that the reason for this is as follows: if the number of thrombi in the acute phase is higher, the surface area of the contact between urokinase and the thrombi would be larger, and the dissolution efficiency would be greater with a simultaneous increase in the D-D production; therefore, the D-D rising speed would be faster, and the D-D peak would be higher. Further, the larger the number of clots, the longer the thrombolysis time required, resulting in a longer duration of D-D elevation. These findings help in predicting the effectiveness and duration of thrombolysis.
FIB plays a critical role in achieving and maintaining hemostasis and is fundamental to effective clot formation. After hemostatic activation, thrombin cleaves FIB and catalyzes fibrin polymerization to form a structural network that is critical for effective clot formation. 27 However, during thrombolytic therapy with urokinase, FIB is degraded by plasmin and urokinase.9,10 This results in a decrease in plasma FIB concentrations and an increased risk of bleeding. Therefore, the FIB concentration is the preferred monitoring index for thrombolytic therapy and the prevention of bleeding. However, in the current literature, there is no consensus on the appropriate level of FIB that should be maintained during thrombolysis to prevent bleeding. On reviewing the latest clinical guidelines for the prevention of massive hemorrhaging from several countries, we found that in some countries, the recommended FIB concentration threshold is 1.0 g/L while in others, the recommend concentration is 1.5 g/L.28-33 In the Practice Guidelines for Perioperative Blood Management proposed by the American Society of Anesthesiologists (ASA), it is recommended that the transfusion of cryoprecipitate is indicated when the FIB concentration is less than 0.8–1.0 g/L in the presence of excessive bleeding, but if the FIB concentration is greater than 1.5 g/L in nonpregnant patients, cryoprecipitate is rarely indicated. 34 According to the guidelines for diagnosis and treatment of DVT recommended by the Vascular Surgery Group of Surgery Society of Chinese Medical Association, the thrombolytic drug dose should be reduced when the plasma FIB content is lower than 1.5 g/L, and thrombolytic therapy should be stopped when plasma FIB content is lower than 1.0 g/L. 35 Moreover, there is still no consensus on the reduction of thrombolytic drug doses. In this study, we observed a continuous decline in the FIB concentration (Figure 2), and an FIB concentration of <1.5 g/L was observed in 12 patients during thrombolysis. In these 12 patients, we chose to administer half the dose of urokinase. Follow-up monitoring revealed that the FIB concentration gradually increased in 10 patients and continued to decrease in two patients. Based on the guidelines, in order to avoid bleeding complications, we chose to suspend thrombolysis when the FIB concentration was <1.0 g/L. At this point, if the D-D concentration drops to the prethrombolysis level, thrombolytic therapy should be terminated. If the D-D content is still at a high level, thrombolysis can be resumed once the FIB concentration rises back to >1.5 g/L.
In addition, the results of this study reveal that the FIB falling speed is positively correlated with the thrombus volume, D-D rising speed, and D-D peak (Figure 4), suggesting that in patients with more severe thrombosis or in those with rapidly rising D-D concentrations or high peak D-D concentrations during thrombolysis, it is necessary to pay close attention to the concentration of FIB, such as through regular testing. In these patients, FIB concentrations may drop rapidly and therefore the risk of bleeding may increase. We believe that it may be caused by the following reasons: the faster the D-D rise and the higher the peak value illustrate the faster the thrombus is dissolved, at which point if the dose of urokinase is unchanged, more urokinase that is not being consumed directly enters the circulation, causing the FIB in the blood to be rapidly degraded, leading to a rapid decrease in its concentration. Therefore, in such cases, we should adjust the drug dose in a timely manner with reference to the change of FIB concentration and terminate thrombolysis if necessary. As to why FIB falling speed was also positively correlated with thrombus volume, we speculated that it might be related to more opening of collateral circulation in patients with large thrombus volume, but the specific reasons need to be further studied and justified.
Conclusion
During CDT with urokinase for DVT, the concentrations of D-D and FIB show specific changes, and there are some specific relationships between each other. Understanding these changes and relationships may be helpful to adjust the thrombolysis time and urokinase dose more rationally.
Footnotes
Acknowledgments
We would like to thank Hu Xiao for her assistance and guidance in this research.
Declaration of Conflicting Interests
The author(s) declared no potential conflicts of interest with respect to the research, authorship, and/or publication of this article.
Funding
The author(s) received no financial support for the research, authorship, and/or publication of this article.
Ethical approval
This retrospective study involving human participants was in accordance with the ethical standards of the institutional and national research committee and with the 1964 Helsinki Declaration and its later amendments or comparable ethical standards.
Guarantor
Yan Sha.
Contributorship
YW and QL researched literature and conceived the study. QL collected the data and wrote the first draft of the manuscript. ZW, LC, and ZZ were involved in protocol development, gaining ethical approval. QL, YP, CW, and SY were involved in data analysis. All authors reviewed and edited the manuscript and approved the final version of the manuscript.
