
Abstract
Studies have demonstrated that hate crime victimisation has harmful effects for individuals. Victims of hate crime report anger, nervousness, feeling unsafe, poor concentration and loss of self-confidence. While victims of non-hate crimes report similar feelings, harm is intensified for hate crime victims due to the targeted nature of the incident. While there is some evidence that experiencing or even witnessing hate crime may have a detrimental effect on residents’ community life, the effects of being victim of a hate crime inside one’s own neighbourhood remain unstudied. Using census data combined with survey data from 4396 residents living across 148 neighbourhoods in Brisbane, Australia, this study examines whether residents who report hate crime within their own neighbourhood differ in their participation in community life when compared to victims of non-hate crime or those who have not been victimised. This is the first study to focus on victims’ views on: how welcoming their neighbourhood is to ethnic diversity; their attachment to their neighbourhood; their frequency of social interactions with neighbours; their number of friends and acquaintances in the neighbourhood; and their fear of crime. Results from propensity score matching (PSM) indicate that there are important differences in patterns of neighbourhood participation across these three groups.
Introduction
Scholarship demonstrates that victims of crime face physical, financial and emotional consequences (Beaton et al., 2000; Langton and Truman, 2014; Macmillan, 2001; Maguire, 1980). Extensive research on the effects of victimisation from a hate crime suggests that perceiving prejudice or hatred as a motivating factor for the incident heightens the effect of these victimisation consequences. These consequences often lead victims to withdraw from society yet, to date, we do not understand the lived neighbourhood experience of hate crime victims when they have been victimised within this space.
Hate crime refers to unlawful, violent, destructive or threatening behaviour in which the perpetrator is motivated in whole or in part by prejudice towards the victim’s perceived race, ethnicity, religion, sexual orientation, gender identity, age, impairment or homelessness (Federal Bureau of Investigation, 2013; Green et al., 2001; Victorian Equal Opportunity and Human Rights Commission, 2010). Thus, crimes motivated by hate or prejudice are distinguished from non-hate crimes by the underlying bigoted motivation of the act (Green et al., 2001) and involve words or actions intended to harm or intimidate individuals because of their perceived membership of or association with another group (Craig and Waldo, 1996). Although hate crime covers a broad range of categories, this study focuses on hate crime motivated by a bias against a victim’s race, ethnicity, religion or national origin.
Previous studies suggest that a number of racially motivated incidents take place in or around the victims’ homes (Bowling, 1993; Brimicombe et al., 2001; Strom, 2001). Thus, the neighbourhood plays an important role in the occurrence of hate crime. The percentage of hate crimes occurring near the home ranges between 70–90% of offences in the US and the UK (Harlow, 2005; Mason, 2005; Roberts et al., 2013;). Indeed, McDevitt et al. (2001) note that hate crimes are more likely to occur in the immediate vicinity of one’s house than non-hate offences. Although this is an emerging area of research attention, neighbourhood processes such as social trust, social cohesion, community ties and participation in neighbourhood associations appear to be eroded in areas that report higher levels of hate crime activity (Markowitz et al., 2001; Perkins and Taylor, 1996; Roberts and Indermaur, 2012). Despite the frequency with which hate crime victimisation occurs in the victim’s own neighbourhood, the literature to date has not considered the individual impact of hate victimisation that occurs within in this space; but rather considers victimisation in general with no limitations on the location of such events. However, the neighbourhood in which individuals live constitutes a space that they should perceive to be a safe area, and this neighbourhood may form part of their identity within the broader population of the place where they live. Given that evidence shows that community social processes are important in preventing hate crime in a neighbourhood (Benier et al., 2015; Lyons, 2007), it is prudent to determine how an individual victim of hate crime participates in, interacts with and perceives his/her community post-victimisation.
The literature on the effects of victimisation posits that victims of hate crime may move, alter their daily routine and avoid symbolic dress as a result of their victimisation experience(s) (Barnes and Ephross, 1994; Dreher, 2006; Poynting, 2002; Poynting and Noble, 2004). Perhaps most significantly, victims are likely to avoid certain areas in the community by restricting their movements to their immediate neighbourhood for fear of further harassment or victimisation. This paper evaluates the neighbouring behaviours of respondents who have been victimised in their own neighbourhood, compared to non-hate crime victims and respondents reporting no victimisation. This is the first research to consider the harm of crime that occurs within the victim’s own neighbourhood. Thus, it addresses a substantial gap in the research to date, given that evidence shows that the majority of hate crime incidents do occur within the victim’s own neighbourhood (Harlow, 2005; Roberts et al., 2013), meaning that the victim’s immediate space has been threatened. In this research, it is argued that the location of a crime does have important consequences for the individual’s reaction, with victimisation in the victim’s own neighbourhood being detrimental for their neighbourhood engagement. However, due to the targeted nature of hate crime, it is hypothesised that these effects will be more significant for hate crime victims than for victims of non-hate offences.
This study considers the effect of criminal victimisation on social cohesion. Jenson (1998) and Bernard (1999) argue that social cohesion has six constituent dimensions: belonging, inclusion, participation, recognition, legitimacy and equality. These dimensions are employed to evaluate the individual sense of social cohesion of victims of hate crime and non-hate crime. In this sense, social cohesion refers to ‘values, beliefs, sense of belonging, attachment and inclusion’ (Markus and Kirpitchenko, 2007: 28). This research uses self-report victimisation survey data from 4396 residents living across 148 suburbs in Brisbane, Australia. It applies propensity score matching (PSM), new to the area of hate crime research, to examine the effect of victimisation on six outcome variables driven by the social cohesion literature: perceived attitudes towards diversity, frequency of neighbouring, number of friends, number of acquaintances, place attachment and feelings of safety.
The impact of hate crime
There is a general agreement in the literature that the effects of criminal victimisation are heightened when bias motivation is involved. McDevitt et al. (2001) propose two reasons for this difference. First, hate crimes are widely understood as message crimes – symbolic criminal actions intended to harm or intimidate people because of their perceived race, ethnicity, sexual orientation, religion or other ‘inferior’ minority group status (Iganski, 2001). Thus, victims are targeted because of a central element of their individual identity which cannot be changed (Lawrence, 1999; Levin, 1993; Noelle, 2003; White and Perrone, 2001). Perry (2001) also highlights the idea of victim interchangeability – it could have been any member of the minority group who was targeted, but the message sent to those in the group remains the same. The second reason that hate crime victimisation is particularly devastating for victims relates to the ‘in terrorem effect’ of hate crime (Weinstein, 1992: 10), or ‘vicarious victimisation’ (Perry and Alvi, 2012: 58); that is, the intimidation of the entire group through the victimisation of some of its members. Not only does this intimidate group members, such exclusionary offences have the potential to aggravate long-standing tensions between groups and to encourage retaliatory aggression within some communities (Craig, 1999; Lyons and Roberts, 2014). Martin (1995) argues that by increasing fear and hostility within a neighbourhood, a relatively minor hate crime incident may have disproportionate consequences on neighbourhood interactions. McDevitt et al. (2001: 698) argue that hate crimes are ‘more harmful to the social fabric of society than comparable crimes without a bias motive’ as a result of the deleterious effect on community cohesion and social order.
While there is debate on whether the physical trauma of hate crime is more significant than its parallel counterparts (see, for example, Barnes and Ephross, 1994; Levin, 1993; Levin and McDevitt, 1993; McDevitt et al., 2001; Weisburd and Levin, 1993), there is a clear consensus on the psychological and emotional effects of hate crimes. Much of the existing research evaluates the harms of hate crime based on gender identity, sexual orientation and race, with studies consistently concluding that there is heightened psychological trauma when a bias motivation is present in an offence (see, for example, Burks et al., 2015; Ehrlich et al., 2003; Herek et al., 1999; Iganski and Lagou, 2015; Lawrence, 1999; Leets, 2002; Levin, 1999). In these studies, a range of reactions are reported, including: mental impairments (such as depression, low self-esteem, profound sadness, suicidal feelings); emotional reactions (such as nervousness, feeling unsafe, alienation from the local environment, anger, loss of self-confidence, poor concentration, despair); physical symptoms (such as difficulties in sleeping, headaches, physical weakness, increased use of alcohol and drugs); interpersonal difficulties, such as lack of trust in others; and an increased fear of crime, for both the person involved and their family.
Most importantly for neighbourhood research, victimisation is associated with individual reactions such as social withdrawal and isolation due to a lack of trust in others in the local community (Perry, 2015). Williams and Tregidga (2014) suggest that victims may no longer wish to associate with their minority group as they may be trying to distance themselves from it in order to break their label and avoid further victimisation. Hate crime victimisation may also lead to ‘voluntary segregation’ (Wachtel, 1999: 221), where victims actively decide to remain either in certain spaces of their community which they deem safe, or even simply in their own home as a method of protection (Perry, 2015). Victims who retreat to a small area of their neighbourhood or indeed who confine their movements entirely to their own home cut off valuable emotional support systems in the form of family, friends and acquaintances who may assist in their recovery from victimisation. This isolation may intensify the emotional responses to the incident if victims are not able to seek the help they need to recover. Victims who attempt to disassociate themselves from their ethnic group for fear of further victimisation may also face further psychological problems associated with their emotional detachment.
Such responses hinder participation in public, social, economic and political life by limiting the use of public space for fear of personal safety, which undermines belonging, freedom and citizenship (Dreher, 2006; Dunn, 2003; Humphrey, 2003; Poynting and Noble, 2004). The individual restriction of movements is associated with fractured social ties and poor neighbourhood attachment should a number of other residents within the neighbourhood engage in similar behaviour. This means that the fears and anxieties associated with victimisation in a hate crime offence are strongly related to the breakdown of order within a community (Weisburd and Levin, 1993). Social cohesion is important for a functioning neighbourhood as it strengthens attachment, belonging and the ability of a neighbourhood to share common goals and values.
The present research
While Durkheim (1964) believed that modern society is held together by diversity rather than homogeneity, the reality is that intergroup tensions between groups in Australia are problematic. In many cases, perpetrators of hate crime are seeking to eliminate difference in the neighbourhood. Thus, there are some neighbourhoods where residents feel that they are not welcome as a result of the message that a hate crime has conveyed to them and to others in their minority group. This victimisation undermines social cohesion and harmony by eroding a sense of belonging, inclusion and attachment to the neighbourhood. There are clear benefits that stem from living in a cohesive neighbourhood, such as a stronger ability to deal with social problems (Forrest and Kearns, 2001).
Previous work in this area has not investigated how hate crime victims perceive their neighbourhood when the offence occurs within this space. Moreover, no study has examined if hate crime victims who have experienced this victimisation in their community have qualitatively different interactions with neighbours compared to similar non-hate crime victims. To date, there has not been any published research into how connected hate crime victims feel to their neighbourhood, how many relationships and ties they have with nearby residents, or how inclusive they perceive their neighbourhood to be. This research addresses this gap by using PSM to create a sample of hate crime victims, non-hate crime victims and non-victims. It offers a new contribution to the literature on the consequences of hate crime victimisation because it evaluates the effects of a hate-motivated offence on victims’ relationships with their neighbourhood, after controlling for individual differences. In doing so, it extends the existing research in three key ways.
The first difference in this study is the focus on the neighbourhood as a location for hate-motivated crime. While empirical research has evaluated the impact of hate and non-hate victimisation in general, previous studies into the effect of hate crime victimisation do not consider the location of the incident. Scholarship highlights the fact that victims may often retreat into their neighbourhood and avoid contact with the general population, yet it is unclear what happens when this incident occurs within the victim’s own residential space. This research seeks to examine what happens when victimisation occurs within the realms of personal space by specifically focusing on victimisation that happens in the neighbourhood in which victims actually live.
Second, despite studies finding that the effects of hate crime victimisation are significant, not all studies use a control group of non-hate crime victims. This means that there is no way to assess whether the significant impact is a result of victimisation occurring in general, or whether there is an additive effect of a hate motivation beyond the baseline effect of any kind of victimisation. This study uses PSM to compare three groups: hate crime victims, non-hate crime victims and non-victims. Breaking down the victims into these three categories addresses the effects of victimisation in more detail, and determines the additional harm created by the perception of a hate or prejudice motivation behind an offence. PSM has not previously been used to create these groups. The implementation of PSM controls for individual differences by matching similar individuals in similar neighbourhoods. This adds a methodological sophistication and rigour beyond that of previous studies in a similar area.
Third, prior research has focused on the emotional impact of hate crime victimisation. While this is essential work, it means that the victims’ perceptions of social cohesion in their neighbourhood remain unstudied. The study focuses on their views on: how welcoming their neighbourhood is to ethnic diversity; their attachment to their neighbourhood; their frequency of social interactions with neighbours; the number of friends and acquaintances they report within the neighbourhood; and their fear of crime. This is an unexplored area of hate crime research. It is hypothesised that victims of hate crime within the neighbourhood will feel isolated from their community, that they are not welcome, and that they may not have much contact with their fellow residents. Further, it is proposed that these consequences will be amplified beyond those reported by non-hate crime victims.
A literature review identified that there are a number of attitudes, actions and perceptions that may be affected by hate crime victimisation, including feelings of safety, perceptions of tolerance to diversity, social ties and neighbouring, and place attachment. The first of these is a feeling of safety. An increased fear of repeat victimisation is a natural response to a victimisation experience and is an outcome noted in many hate crime studies (Botcherby et al., 2011; McDevitt et al., 2001; Smith et al., 2012). While a certain level of fear of crime is beneficial to safety – encouraging awareness and concern about crime – extreme feelings of unsafety can be detrimental to the functioning of both the individual and the neighbourhood in which they live. Fear of crime has become a social problem on its own, distinct from the ‘real’ crime upon which is based (Farrall et al., 2007). A high fear of crime can be severely debilitating, resulting in insecurities that restrict personal freedom and erode psychological and physiological wellbeing, contributing to dissatisfaction with the neighbourhood, community and overall life (Farrall et al., 2007; Ferraro, 1995; Jackson, 2004; McCrea et al., 2005).
The second outcome of interest to this study is the victim’s perception of tolerance of ethnic diversity within the neighbourhood. While there is much research that evaluates the neighbourhood conditions that make people less accepting of diversity (see, for example, Forrest and Dunn, 2011; Markus, 2011), this study examined the victim’s perception of tolerance which has not been considered in previous research. It was hypothesised that an individual’s perception of tolerance will be based on his/her personal experiences of racism. Thus, the people who ‘see’ racism in the neighbourhood are most likely to be the people who have been subjected to racism. These attitudes have important consequences for hate crime victims, as victims who perceive that their neighbourhood is less accepting of ethnic diversity are likely to feel isolated and unwelcome. This may lead them to withdraw from their community, fracturing social ties.
Third, urban sociologists have long highlighted the benefits of social ties and participation in neighbouring activities. Scholars have noted the effects of social ties on an individual’s positive affective state, mental health and psychological wellbeing, with social inclusion decreasing the effects of stress, anxiety and depressive symptoms (Cohen and Wills, 1985; Kawachi and Berkman, 2000, 2001). Within a neighbourhood, evidence suggests that strong social ties lead to increased social capital, including high levels of interpersonal trust, norms of reciprocity and mutual aid (Adler and Kwon, 2002; Kasarda and Janowitz, 1974; Kawachi and Berkman, 2000; Stolle et al., 2008). This social capital facilitates collective action, leading to social cohesion and informal social control, which in turn leads to safer, more organised communities (Gibson et al., 2002; Sampson et al., 1997, 2002; Warner and Clubb, 2013). For the individual hate crime victim, it was hypothesised that withdrawal from neighbourhood life would lead to a decreased frequency of neighbouring, and a lower number of friends and acquaintances in the neighbourhood. Thus, victims of hate crime would have less interaction with a smaller number of people within the community as they may be attempting to distance themselves from other residents.
The final outcome of interest in this study is place attachment. Place attachment is a multi-dimensional construct that details an individual’s social bonding, identity, affect and dependence on a location (Ramkissoon et al., 2012). Emerging from the psychological attachment literature, the concept of place attachment incorporates the affect, emotions, beliefs and behaviour that an individual associates with a place (Chow and Healey, 2008; Low and Altman, 1992; Ramkissoon et al., 2012). With regard to this study, this place is the neighbourhood in which the participant lives. Given that hate crime victims are believed to withdraw from their neighbourhood and have fewer contacts within their local area, it was hypothesised that victims of hate crime would report a lower attachment to their neighbourhood.
Methods
The Australian Community Capacity Study (ACCS) is a longitudinal panel study of urban communities in Australia (Mazerolle et al., 2007, 2012; Wickes et al., 2011). The overarching goal of the ACCS is a longitudinal examination of the key social processes associated with the spatial variation of crime across communities. The research employs data collected in 2010 representing the third wave of the ACCS in the Brisbane Statistical Division (BSD), located in Queensland. The Brisbane ACCS sample comprises 148 randomly drawn neighbourhoods 1 with a residential population ranging from 245 to 20,999. 2 This study also draws on 2006 Australian Bureau of Statistics (ABS) census data to control for several neighbourhood socio-structural characteristics.
In Wave 3 of the ACCS, the Brisbane sample included 3,954 participants randomly sampled from the 148 randomly sampled neighbourhoods. Additionally, there was an ethnic community booster sample, where face-to-face interviews were conducted with an additional sample of residents from three cultural minority groups – Vietnamese, Indian and Arabic speaking. These additional 237 participants were selected based on their suburb of residence falling within the ACCS suburbs. This top-up sample included 87 Arabic-speaking, 72 Indian and 78 Vietnamese participants (Murphy et al., 2012). 3 The total number of participants in the study was 4396.
The ACCS survey was conducted from August to December 2011 by the Institute for Social Science Research at the University of Queensland. Trained interviewers used computer-assisted telephone interviewing to administer the survey which lasted approximately 25 minutes. The in-scope survey population comprised all people aged 18 years or over who were usually resident in private dwellings with landline telephones in the selected neighbourhoods. The response and cooperation rates for the Brisbane ACCS Wave 3 were 41.81% and 59.67% respectively 4 (for further information, see Mazerolle et al., 2012).
Independent variable: Victimisation type
Victimisation was measured by the following item: ‘While you have lived in this community, has anyone ever used violence such as in a mugging, fight or sexual assault against you or any member of your household anywhere in the community?’ If the participant responded with ‘yes’ to this question, they were then asked if they felt the incident occurred because of the victim’s skin colour, ethnicity, race or religion. These questions were then repeated for a break and enter into their residence, and for property damage to their residence, including damage to a vehicle parked in the street, to the outside of the home or to other personal property. A respondent was counted as having experienced a hate crime towards a member of their household if they answered ‘yes’ to the question of whether the incident occurred because of skin colour, ethnicity, race or religion. Overall, 82 people reported hate victimisation. In total, 1.87% of the sample reported hate crime victimisation within their household.
Participants who reported either violent or property offences when answering the victimisation question in the ACCS as outlined above, but did not believe the incident to be motivated by skin colour, ethnicity, race or religion, were identified as non-hate crime victims. Of the 4,396 respondents, 1,422 reported non-hate crime victimisation. In some circumstances, victims reported one offence type as a hate crime, and a different type of crime without this motivation. These respondents were categorised as hate crime victims due to the structure of the data collection process. Victimisation was recorded as a binary variable, with 1 indicating non-hate crime victimisation and 0 indicating no victimisation.
Dependent variables
In this study, the outcomes of interest were the respondent’s place attachment, perceived attitudes to diversity, frequency of neighbouring and feelings of safety in the neighbourhood. However, empirical evidence also suggested that these outcome variables will be influenced by other variables beyond the respondent’s victim status group. For this reason, participants were matched on a number of demographic variables that previous literature has demonstrated as being associated with victimisation. The construction of these outcome measures is outlined below.
Place attachment
The place attachment response scale was comprised of participants’ responses to three items in the survey (α = 0.79). The questions that comprised the scale were:
I feel that I belong to this local community. I would like to be living in this local community in three years’ time. I am proud to live in this local community.
Each of these items was measured on a 5-point Likert scale from strongly disagree to strongly agree. These three items were averaged to obtain an overall score. The scale values ranged from 1 to 5, with a mean of 3.990 (SD = 0.745) suggesting a positive response to community attachment, participation and belonging.
Frequency of neighbouring
The frequency of neighbouring scale consists of questions aimed at measuring levels of interaction with neighbours (α = 0.75). These three items were:
How often do you and people in your community:
Do favours for each other? Visit in each other’s homes or on the street? Ask each other advice about personal things such as child rearing or job openings?
Items were measured on a 4-point Likert scale, with the ratings of ‘never’ (1), ‘rarely’ (2), ‘sometimes’ (3) or ‘often’ (4). Respondents’ ratings were averaged across the questions to obtain a rating out of 4, with a higher rating indicating more frequent interactions with their neighbours. Overall, the variable had a mean of 2.820 (SD = 0.804).
Number of friends
The number of friends that respondents had in the suburb was elicited through the question: ‘Apart from the people that you live with, how many relatives and friends live in your community?’ Responses to this item were categorical, starting from none (1), one or two (2), three or four (3), five or six (4), seven or eight (5), nine or ten (6), or more than 10 (7). Overall, the variable had a mean of 4.216 (SD = 2.425), suggesting that, on average, respondents were friends with approximately five to six people in their neighbourhood.
Number of acquaintances
Respondents in the ACCS were asked how many acquaintances they had in their neighbourhood. Specifically, the question read: ‘Would you say that you know: how many acquaintances?’ Participants were asked if they knew: none of the people in their community (coded as 1), a few of them (2), many of them (3) or most of the people in the community (4). This variable had a mean of 2.446 (SD = 0.736), suggesting that, on average, respondents knew some of the people in their neighbourhood.
Attitudes to diversity
To consider how respondents perceived their community’s attitudes to diversity, a scale of several questions measured on a Likert scale from 1 (strongly disagree) to 5 (strongly agree) was used. Ratings were averaged out across the measures with a higher score suggesting a more accepting neighbourhood. The three items used were:
People in this community would prefer it if residents in this area were mostly Anglo-Saxon. (Reverse coded) People in this community do not like having members of other ethnic groups as next door neighbours. (Reverse coded) People in this community are comfortable with the current levels of ethnic diversity here.
Overall, the mean rating on the scale was 3.580 (SD = 0.634), which suggested that, in general, people perceived their community to be accepting or tolerant of diversity.
Fear of crime
The respondents’ fear of crime was measured using a single item in the ACCS survey. This question asked how safe the respondent felt walking in their neighbourhood after dark. Overall, the mean rating of the item was 3.739 (SD = 1.102), which means that, in general, respondents reported a moderately strong perception of safety within their neighbourhood.
Analytic strategy
This study investigated the effect of victimisation on an individual’s relationship to their neighbourhood, including their social interactions and their perceptions about the community. To do this, PSM techniques were used to reduce the data to a comparable set of hate crime victims, non-hate crime victims and non-victims. Using matching techniques allows for a direct comparison of the outcome variables of respondents with similar demographic characteristics living in similar neighbourhoods who differ only on their victimisation status. The use of matching strategies allows for a more nuanced understanding of the harms of hate crime by controlling for many individual differences in the respondents.
PSM analysis forms groups based on the estimated propensity score, or the estimated probability of an individual being in the treatment group based on a set of observed covariates such as age and gender (Zanutto, 2006). Collapsing the vectors to a scalar propensity score acts as a balancing score that allows for an estimation of the treatment effects by controlling for covariates. The formula for this covariate vector is e(x) = p(Z − 1|X) where Z = 1 represents the subject being in the treatment group and X is the vector representing the set of covariates for a subject (Rosenbaum and Rubin, 1983). This score is then applied using nearest neighbour matching to find the most similar score in the other group (Austin, 2009; King et al., 2011; Stuart, 2010). Once this propensity score has been obtained, tests are conducted on the difference in means to calculate the average treatment effect on the treated (Ho et al., 2007). 5
A review of the literature suggested that victimisation in both hate and non-hate offences was predicted by age, gender, time at address, renting, speaking a language other than English at home (LOTE) and being born overseas (Brown et al., 2003; Rountree and Land, 1996; Sampson et al., 1997; Velez, 2001). These variables were obtained from the ACCS survey. Neighbourhood characteristics were also matched to ensure that participants were located in similar communities. Therefore, neighbourhood LOTE (as the percentage of residents who spoke a language other than English at home), mobility (as the percentage of residents who lived at a different address five years ago) and income (average weekly household income before tax) were also matched, in line with social disorganisation theory (Sampson et al., 1997; Velez, 2001). Table 1 presents the mean and standard deviation of these measures before matching. The data were obtained from the 2006 census. Matching on the disorganisation of the neighbourhood in which a victim lives allows for a strong comparison of the outcome variables by removing much of the variability at the neighbourhood level.
Mean (standard deviation) of covariates by victimisation status before matching (n=4396).
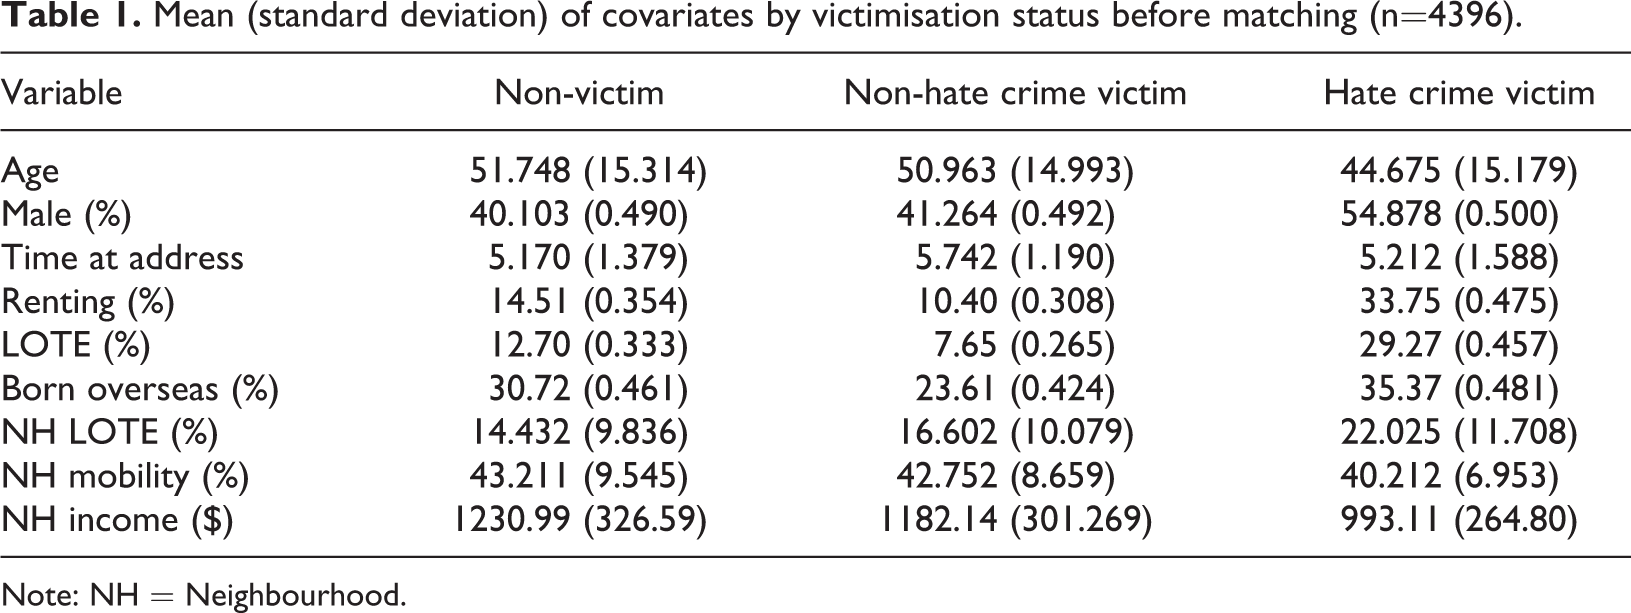
Note: NH = Neighbourhood.
PSM was engaged to create two matched samples. The first of these involved matching 1,749 non-hate crime victims to 991 non-victims. The second match included 78 hate crime victims to 137 non-hate crime victims. In these matches, multiple matches were allowed to be made where there was more than one identical p score in the control group. 6 Where multiple scores were included, the outcome variable was averaged across these matches (Imbens, 2004; Steiner and Cook, 2010).
Results
Non-victims and non-hate crime victims
In the first set of matches, non-victims were matched to victims of a non-hate incident. Preliminary analyses first demonstrated that victims of non-hate crime were significantly younger than non-victims (z = −8.15, p < 0.001). Second, victims were more likely to have lived at their current address for a longer period of time (z = 13.56, p < 0.001), which may be the result of having more opportunities to be victimised within that neighbourhood than someone who has recently moved into the area. Non-hate crime victims were also less likely to speak a foreign language at home (z = −4.14, p < 0.001) than non-victims. This is likely to be because the non-victim group includes anyone who has not been victimised and, therefore, has a similar proportion of people speaking a LOTE compared to the general population. However, victims who speak a LOTE at home are likely to attribute a hate motivation, meaning that they will appear in in the hate crime victim group instead of this non-hate crime group. Victims also tended to live in suburbs which had significantly higher LOTE and lower income (zlote = 7.62, p < 0.001; zincome = −4.62, p < 0.001), indicating support for social disorganisation theory.
The mean propensity score of the non-hate crime victimisation group was 0.467 (SD = 0.137), with a range from 0.061 to 0.875. In comparison, the non-victim mean propensity score was 0.382 (SD = 0.128), with a range from 0.049 to 0.832. These ranges illustrate that there is a strong overlap between the distributions of propensity scores, thus allowing matches to be made with individuals with a similar propensity score within the two groups.
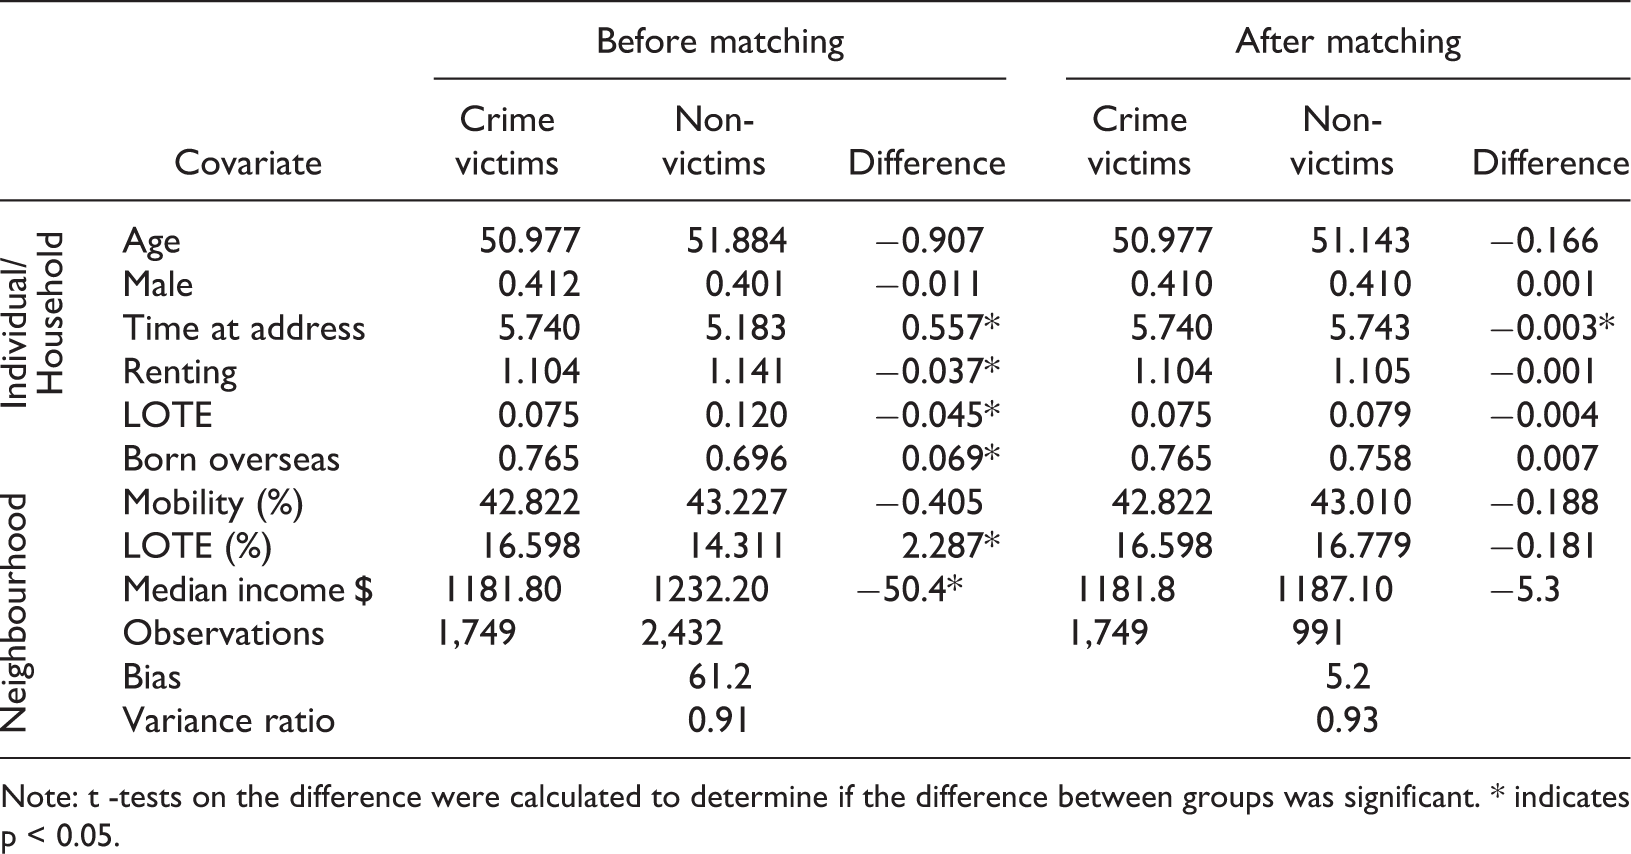
Checks of the balancing of the covariates demonstrated no significant difference in the means of the two victimisation groups after the matching had occurred, and that the difference in the means of the covariates had been reduced after matching had been implemented (see Appendix 1). The covariates were well matched with each of the covariates below the acceptable threshold of less than 5% bias for both of the groups (Grilli and Rampichini, 2011; Rosenbaum and Rubin, 1985).
Hate crime victims and non-hate crime victims
The second matching sample that was created was households with a victim of crime, with and without a hate motivation. Participants reporting hate crime victimisation within their household were significantly more likely to be renting their current residence (z = 2.92, p < 0.01), and to speak a LOTE at home (z = 3.15, p < 0.01). Hate crime victims are more likely to live in neighbourhoods with a low mobility rate (z = −2.74, p < 0.01) and lower income (z = −3.29, p < 0.01) than victims who had experienced crimes without this motivation.
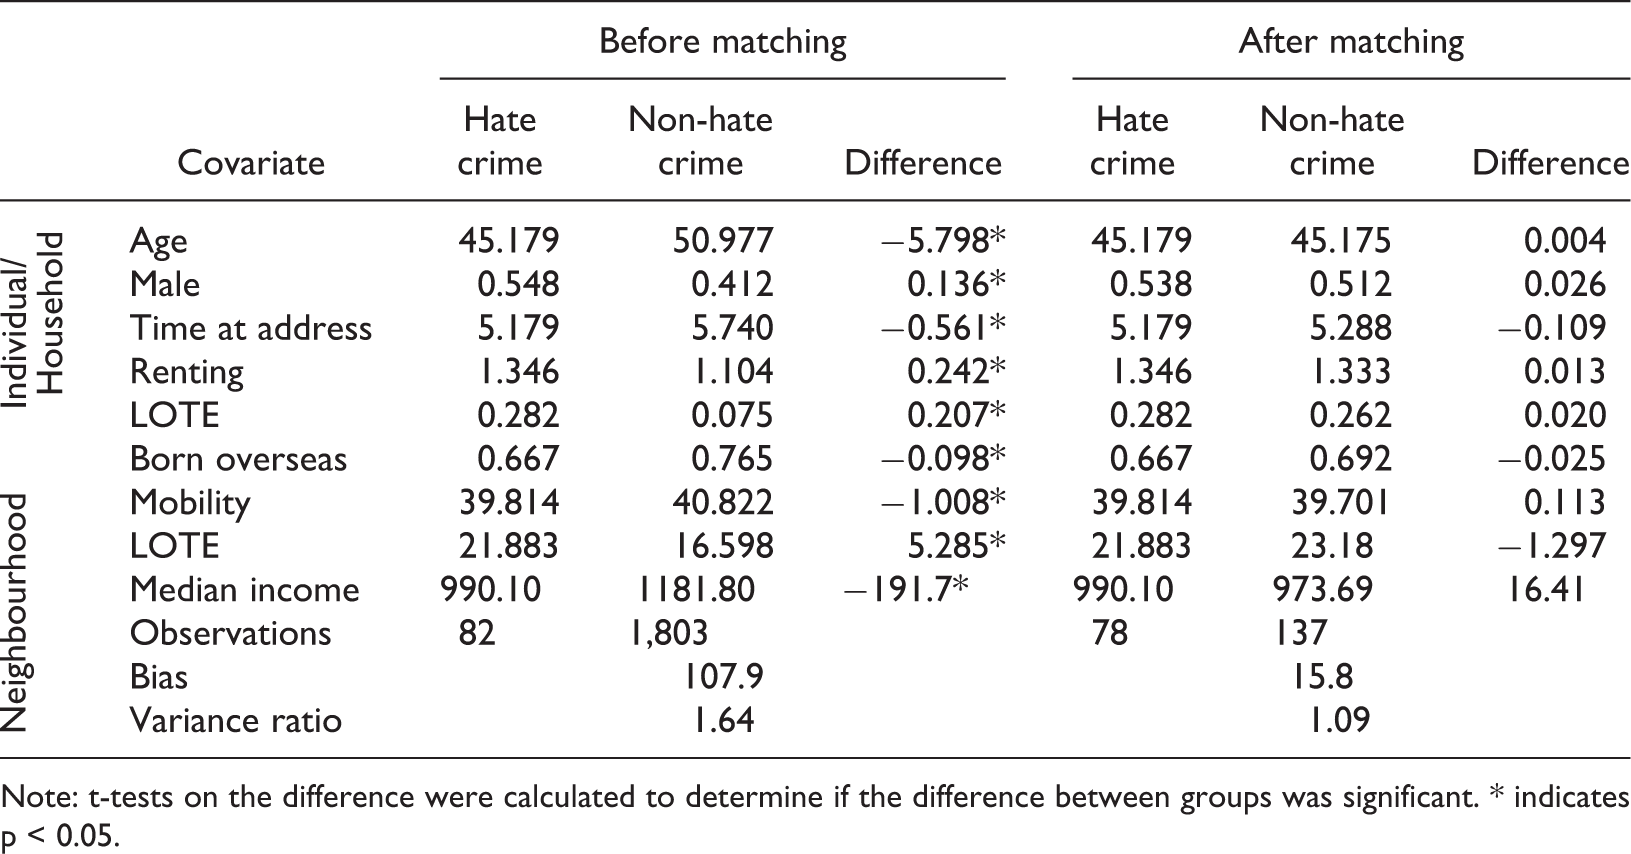
Due to the small sample size of hate crime victims, there were less available matchings in this model. The mean propensity score of the non-hate crime victims was 0.039 (SD = 0.049, range 0.001–0.675), compared to a mean of 0.116 (SD = 0.132, range 0.013–0.662) for the hate crime group. In the first match created, there were problems with the levels of bias in some of the individual covariates. Five covariates had too much bias due to the small sample size: although 78 of the hate crime victims were matched with non-hate counterparts, the matches were not as close as recommended.
To counteract this bias, the matching was rerun using the two nearest matches in the non-hate crime victim group. Each of these matches was given a weighting of 0.5, meaning that the outcome variable would be averaged between the two cases and this average compared to the hate crime victim’s response. Using matching with two neighbours, the bias of the variables was reduced further. Here, there was less bias in most of the variables. Time at address (−7.7%) and neighbourhood LOTE (11.7%) now had above the acceptable limit of 5% bias. While the bias value for these two variables is slightly higher than in the previous match, the overall bias and the bias of a number of the variables individually shows a stronger match (see Appendix 2). Overall, analysis of the imbalance does show that in every variable, the bias was substantially reduced after the matching compared to before matching.
In the models that follow, hate crime and non-hate crime victims, and non-hate crime victims and non-victims were matched across six outcome variables. To be able to validate this process empirically as a comparison between groups, it was necessary to compare the non-hate crime respondents who had been matched in the first model to those included in the second model to ensure that there was no difference in the selection of the participants during the PSM. Across all six outcome variables, t-tests revealed that there were no significant differences in the outcome variables’ ratings for these two sub-samples.
Feelings of safety
The most significant impact on a victim is, arguably, an increased fear of crime. Extreme feelings of unsafety and psychological anxiety can be detrimental to the functioning of both the individual and the neighbourhood in which they live. In the first model, non-victims were matched to victims of a non-hate incident. In the matched sample, the mean rating of feelings of safety was 3.807 (SD = 1.063) for non-victims, and 3.619 (SD = 1.145) for the non-hate crime victims (see Table 2). The model of the average treatment effect on the treated (ATET) identified that non-hate crime victims have significantly lower feelings of safety (z = −3.44, p < 0.001) than non-victims. The model showed that not being a victim of crime was associated with a 0.2 increase on the 5-point Likert scale of feelings of safety, an increase of one-fifth of the standard deviation. This means that being a victim of crime was associated with a reduction in lower perceptions of safety or, in turn, a higher fear of crime.
Mean and standard deviation for victims and non-victims of (hate) crime on a 5-point fear of crime scale.

In the second feelings of safety model, hate and non-hate victims of crime were matched. After matching with the reduced sample, an analysis of the average treatment effect on the treated demonstrated that victims of a crime not motivated by hate reported a significantly lower score on the feelings of safety item than those who perceived a hate motivation behind their victimisation (z = −2.34, p < 0.05). Specifically, the perception of a hate crime was associated with a reduction of 0.431 in ratings on the feelings of safety scale, or one-quarter of the standard deviation. This reduction of feelings of safety was much stronger than for the comparison of non-hate crime and non-victims.
Perceived attitudes to diversity
Although this subject has not been studied empirically with respect to hate crime victimisation, it was hypothesised that victims of hate crime will identify that their neighbourhood is less welcoming with regard to ethnic diversity, and will, therefore, have a lower score on the attitudes to diversity scale. This would show that victims feel that people from a non-mainstream identity are not wanted within the neighbourhood.
The first comparison of groups with regard to looking at attitudes to diversity was between non-victims and non-hate crime victims. Table 3 presents the means of the groups used within the matching. After matching had occurred, the difference in attitudes between groups was not significant, as the average treatment effect model showed a non-significant difference between the groups (z = −1.90, p = 0.58). Thus, being a victim of non-hate crime was not associated with a reduction in attitudes to diversity score. This means that there was no difference in the perceived acceptance of minority groups within the neighbourhood between those who have not been victimised, and those who have been victimised but do not attribute this to a hate motivation.
Mean and standard deviation for victims and non-victims of (hate) crime on a 5-point attitudes to diversity scale.

In the second matched sample, the difference in the attitudes score of victims of crime with and without a perceived hate motivation was significant, with victims of hate crime having lower perceptions of tolerance to diversity in their community (z = 3.59, p < 0.01). This effect was such that adding the perception of a prejudice motivation decreased the value of the attitudes scale by 0.350, or approximately one-half of the standard deviation of the measure. This means that hate crime victims are more inclined to believe that their neighbourhood is less tolerant of diversity than non-hate crime victims.
Neighbouring interactions
Empirical evidence shows that strong social ties are associated with increased social capital such as interpersonal trust, norms of reciprocity and mutual aid (Adler and Kwon, 2002; Kasarda and Janowitz, 1974; Kawachi and Berkman, 2000; Putnam, 2007; Stolle et al., 2008). However, it was proposed that victims of hate crime that occurs within their community will withdraw from their neighbourhood, interrupting ties with other residents. It is therefore contended that hate crime victimisation will be associated with less contact with neighbours, and a smaller number of friends and acquaintances reported in the neighbourhood.
Frequency of neighbouring
The frequency of neighbouring items in the ACCS measured interaction with neighbours. The first match included the non-victims and the non-hate crime victims. Table 4 presents the means of the matched groups. After the sample was matched, the difference in the frequency of neighbouring was non-significant, with victims of non-hate crime reporting a similar frequency of interactions with their neighbours to non-victims (z = −1.78, p = 0.075).
Mean and standard deviation for victims and non-victims of (hate) crime on a 4-point frequency of neighbouring scale.
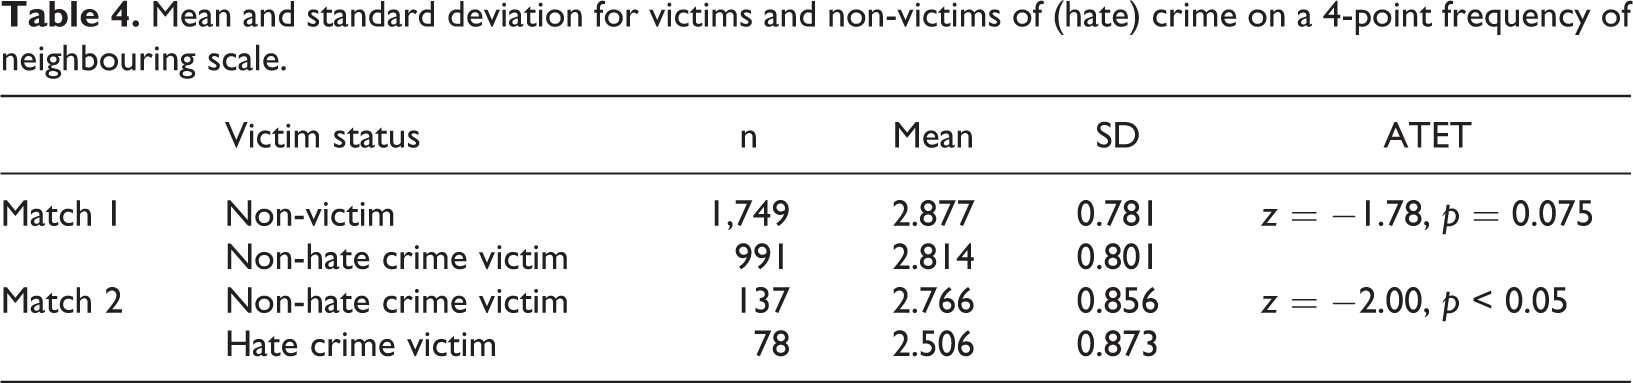
The model including non-hate crime and hate crime victims after matching showed a significant difference in the frequency of neighbouring reported by hate crime and non-hate crime victims, with hate crime victims having fewer interactions with their fellow residents (z = −2.00, p < 0.05). This effect was such that adding the perception of a prejudice motivation decreased the value of the attitudes scale by 0.2, or approximately one-quarter of the standard deviation of the measure. This means that, on average, participants report rare contact with their neighbours.
Number of friends
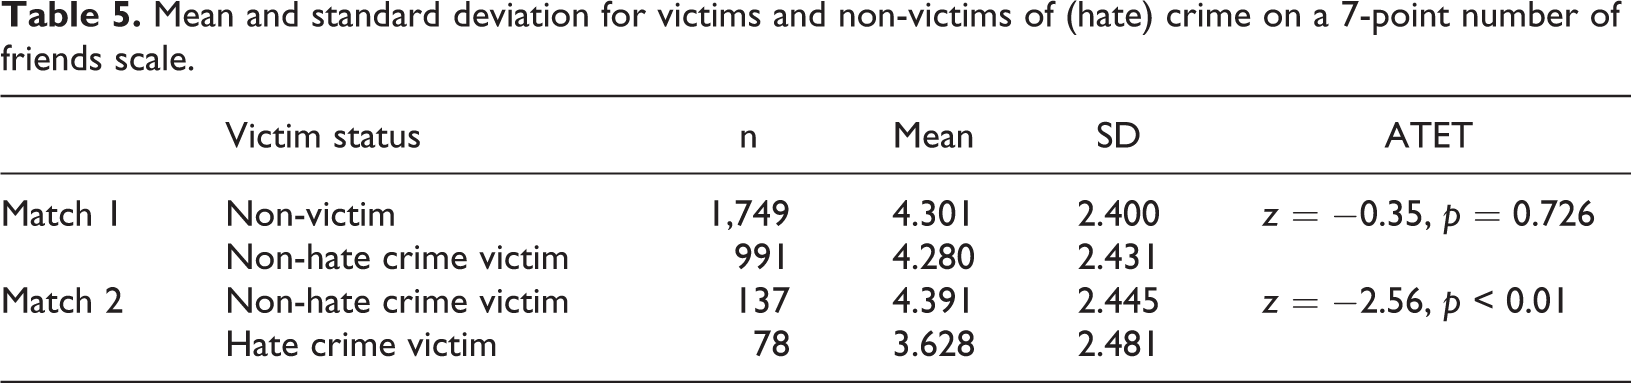
The ACCS asked respondents how many relatives and friends lived in their community, without including the people that the respondent lived with. The means of the variables for the matched sample are presented in Table 5. The initial match of non-hate crime victims and non-victims demonstrated no significant difference in the number of acquaintances reported by the two groups (z = −0.35, p = 0.726). However, the model including non-hate crime and hate crime victims showed a significant difference in the number of friends reported by hate crime and non-hate crime victims, with victims of hate crime reporting significantly fewer friends in the neighbourhood (z = −2.56, p < 0.01). This effect was such that adding the perception of a prejudice motivation decreased the scale rating of the number of friends by 0.8, or approximately one-third of the standard deviation of the measure. This means that, on average, participants who had been victimised through a hate crime reported three or four friends in the neighbourhood, while non-hate victims reported five or six.
Mean and standard deviation for victims and non-victims of (hate) crime on a 7-point number of friends scale.
Number of acquaintances
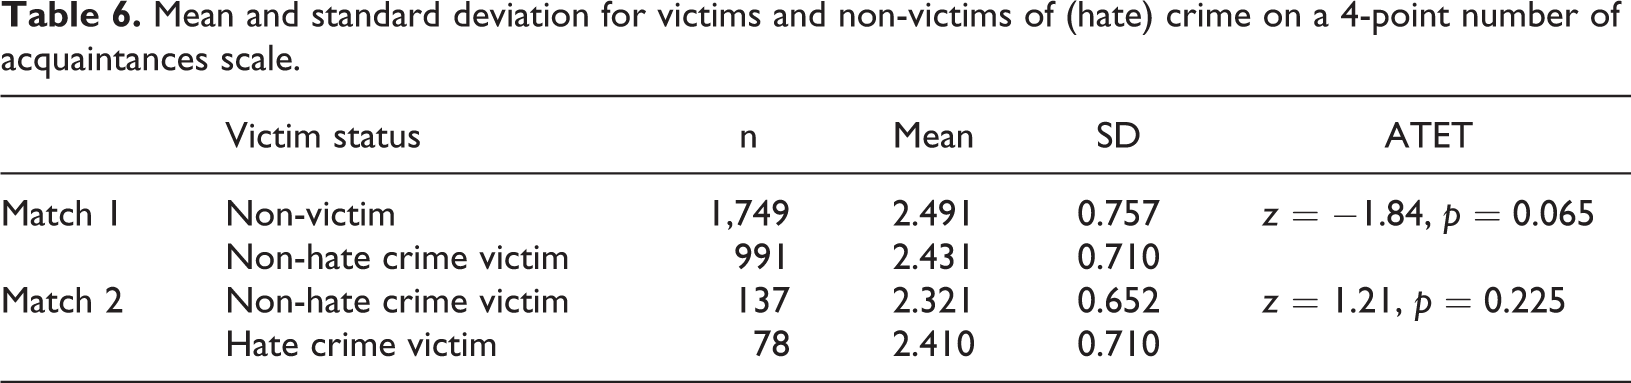
In the survey, respondents were asked how many acquaintances they have in their neighbourhood. Table 6 displays the descriptive statistics of the variables after matching. The initial match of non-hate crime victims and non-victims demonstrated no significant difference in the number of acquaintances reported by the two groups (z = −1.84, p = 0.065). The model including non-hate crime and hate crime victims, after matching, also showed no significant difference in the number of acquaintances reported by victims of crime with and without a hate motivation (z = 1.21, p = 0.225). None of the models used to predict the number of acquaintances reported by respondents in each group showed a significant relationship. Therefore, criminal victimisation with or without a motive of prejudice did not impact the number of acquaintances reported by respondents.
Mean and standard deviation for victims and non-victims of (hate) crime on a 4-point number of acquaintances scale.
Place attachment
In the first model, the post-matching difference in means of place attachment values between groups was significant (see Table 7), with a treatment effect model showing that victims of non-hate crime, in comparison to non-victims, had a significantly reduced place attachment rating (z = −4.580, p < 0.001). Being the victim of a crime with a non-hate motivation was associated with a 0.13 reduction on the 5-point place attachment scale, meaning that victims felt a lower attachment to the community in which they lived when they had been victimised within that neighbourhood.
Mean and standard deviation for victims and non-victims of (hate) crime on a 5-point place attachment scale.
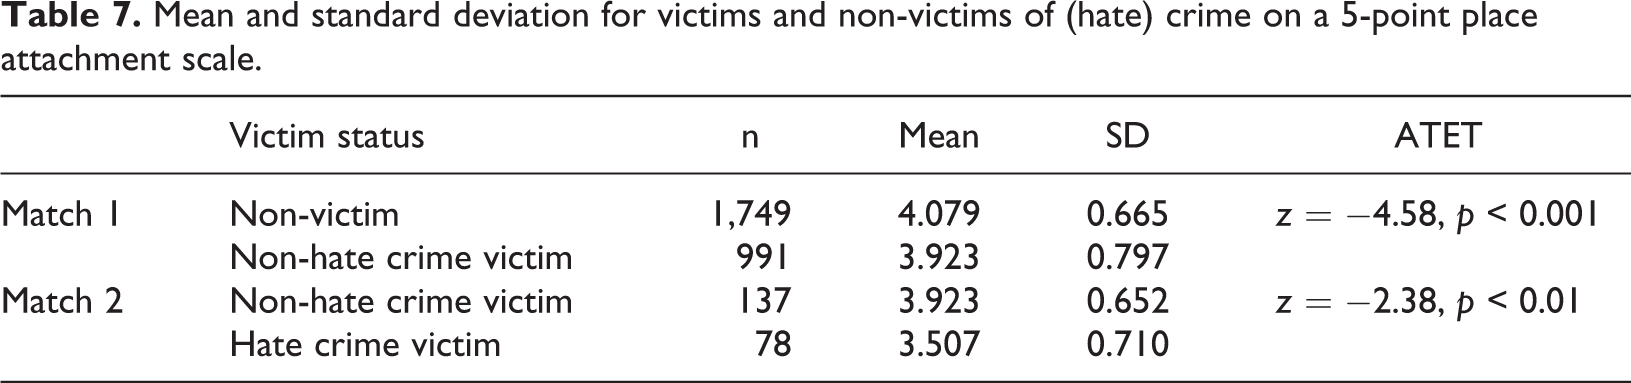
In the second place attachment model, hate and non-hate victims of crime were matched. After matching, an analysis of the average treatment effect on the treated demonstrated that victims of a crime that was not motivated by prejudice reported a significantly higher score on the place attachment scale than those who perceived a hate motivation behind their victimisation (z = −2.38, p < 0.01). Specifically, perception of a hate crime was associated with a 0.339 reduction on the 5-point place attachment scale. This means that hate crime victims felt significantly less attached to the neighbourhood in which they live, as they do not feel that they belong, do not wish to live in the neighbourhood long term, and do not feel proud to be associated with this neighbourhood.
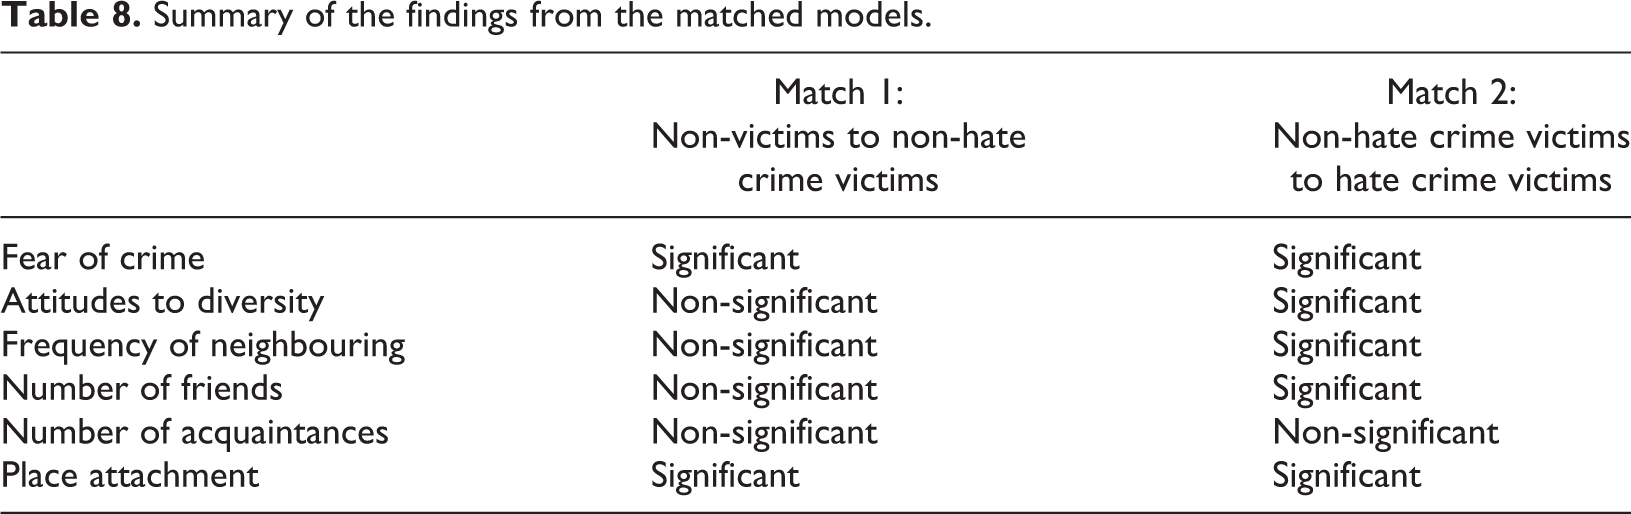
Table 8 provides a summary of the findings for the six outcome variables. This shows that while non-hate crime victims have a significantly higher fear of crime and lower place attachment than residents in households that have not reported any victimisation, the effect of a hate motivation in a criminal victimisation has a significant effect on a resident’s contact with and ties to their neighbourhood.
Summary of the findings from the matched models.
Discussion
In the previous hate crime literature, discussion of the effects of victimisation were primarily focused on the psychological harms experienced by the individual victim. These studies do not focus on the location of the incident, so broadly consider the individual effects in general. They do show that victims of hate crime often withdraw to their neighbourhood. In this study, the location in which the incident took place is restricted to examine the effects of victimisation that occurred within the respondent’s neighbourhood. This is the first study to do so, and it allows for an examination of the harms of having a hate crime occur close to the resident’s home and how this might affect residents’ neighbourhood attachment, perceptions and social ties.
This study explored the harms of hate crime on an individual’s neighbouring interactions and behaviour. Social cohesion is an important neighbourhood process (Jenson, 1998), but the evidence suggests that victims of hate crime restrict their movements within the neighbourhood. This has consequences for the development and maintenance of neighbourhood social control and social capital, as well as economic consequences within the neighbourhood (Jenson, 1998). The purpose of this study was to consider how victimisation within a neighbourhood affects social cohesion by analysing belonging, inclusion, participation and equality as experienced by individual residents. Through the use of PSM techniques, similar individuals in similar neighbourhoods were matched to minimise individual differences in the effects of victimisation. This is a new technique in studies of this nature, and employs additional methodological rigour by controlling for individual demographic differences.
Overall, the findings demonstrate that a hate-motivated victimisation does have a significant association (beyond that of parallel offences without this motivation) with feelings of safety, attitudes to diversity, frequency of neighbouring, number of friends and place attachment. Feelings of safety for victims of crime were significantly lower than for non-victims, and for hate crime victims significantly lower again. People who report hate crime within their suburb also believe their neighbourhood to be less tolerant or accepting of diversity within their local area. Given that the survey specifically asked about crimes motivated by a prejudice against the victim’s race, religion, skin colour or ethnicity, it is not surprising that victims of a hate crime felt that they were unwelcome in a neighbourhood and that their fellow residents would prefer their area to be a white, English-speaking neighbourhood without ethnic diversity. Such perspectives are also likely to be linked to social isolation and to contribute to a reluctance of victims to participate in neighbourhood interactions.
The proposed relationship between victimisation and social isolation and withdrawal is evidenced in this study, with hate crime victims reporting significantly fewer interactions with their neighbours than non-hate crime victims. Hate crime victims also report having significantly fewer friends in their neighbourhood, although the models show that there is no significant difference in the number of acquaintances reported by hate crime victims. Thus, it appears that despite having a similar number of acquaintances within the neighbourhood, hate crime victims interact with their neighbours less frequently and identify a smaller number of friends within the community than victims of non-hate crimes.
Finally, place attachment is significantly hindered by criminal victimisation without a hate motive. This is in line with Brown et al. (2003), who argue that place attachment to a neighbourhood will be higher for individuals who have less fear of crime, and who have a greater sense of neighbourhood cohesion and control. While significantly lower for victims of non-hate crimes, place attachment is further diminished for hate crime victims. This indicates that hate crime victims report a reduced sense of belonging and pride in their community, which may also result in less engagement with other residents in the neighbourhood in which they live.
The findings of this research show that crime that occurs within an individual’s own neighbourhood does have serious consequences for the lived experience of the victim. Furthermore, the targeted nature of a hate crime incident does heighten the effects of these harms, with hate crime victims reporting fewer interactions with their neighbours, and feeling less safe in and less attached to their neighbourhood. They also perceive that there is less acceptance of diversity in their neighbourhood.
One caveat of these results is that it is unknown if the person completing the survey was indeed the person who was directly victimised, given that the survey asks if they or anyone else in their household has been affected by crime. Despite this, the results in this study do show significant differences in the behaviours and interactions reported by respondents. Thus, it may be said that if the respondent was not the victim, the effect of the victimisation could have been shared by others in the household. These results are also from cross-sectional data, meaning that while a strong association was noted between hate crimes and non-hate crimes with regard to neighbourhood engagement, the responses to the items before the victimisation were not able to be used as a control, meaning that temporal patterns of these behaviours cannot be considered.
A second limitation of this study is in regard to the proportion of violence and property crimes between the motivation types. In this sample, there are different ratios of the amount of violent crime to property crime. In hate crime offences, 52% were property offences and 48% violent offences. In non-hate offences, 88% were property offences, and 12% violent offences. Given that previous research suggests that the effects of victimisation are similar across violent and property offences but that they vary in terms of the severity of reactions, it is possible that combining the offence types means that some of the nuance of the effects is lost. The study is also unable to consider other types of hate crime, such as hate speech or anti-social behaviour, that may also have consequences for the victim.
The recognition of difference and diversity is essential for a functioning neighbourhood. When hate crime victims feel that they are not welcome, as is the very nature of the message of hate crime, there are significant consequences for the way in which the victim, their household and other members of their minority group participate in their neighbourhood, with regard to their views on acceptance of diversity, and as far as their feelings of belonging and inclusion are concerned. Face-to-face contact is important for a feeling of belonging. If victims, and indeed others in the community, isolate themselves from other residents, restrict their movements and avoid the participation that enables this contact, a sense of belonging and feelings of trust will be diminished.
Conclusion
This study is the first quantitative analysis of this nature. Similar to previous studies on the effect of victimisation (for example, Iganski and Lagou, 2015), this study showed that compared to non-hate crime victims, victims of hate crime reported significantly lower feelings of safety in the community, which corresponds to a higher fear of crime. Furthermore, results demonstrated that victims of hate crime, compared to non-hate crime counterparts, had a significantly lower frequency of neighbouring activities, fewer friends reported within the neighbourhood, and considerably less place attachment to the neighbourhood. They also perceived the neighbourhood to have less favourable attitudes towards diversity. Although this study is about an association rather than a causation, the findings suggest that people with a hate crime victim in their household appear to withdraw from their neighbourhood and have fewer interactions with other residents.
Previous research on hate crime in Brisbane highlights the importance of place attachment, as a social process, for decreasing hate crime in the neighbourhood (Benier et al., 2015). This shows that neighbourhood processes are important not only for social cohesion and togetherness, as highlighted by a number of empirical studies, but also to protect individuals within the neighbourhood from hate crime victimisation. However, if victims withdraw from their neighbourhood and isolate themselves, impeding the same neighbourhood processes that are critical for preventing hate crime within the community, hate crime within the community will increase. The problem will continue to escalate as an increasing number of victims withdraw from the community, fracturing social ties and neighbourhood processes that were acting as a protective factor.
Footnotes
Acknowledgements
This work was supported by the Australian Research Council (RO700002, DP1093960 and DP1094589). The author would like to thank the editors and the reviewers for their considered comments and suggestions, and Dr Rebecca Wickes for her comments on an earlier manuscript draft. The author would also like to thank the Australian Research Council Centre of Excellence in Policing and Security for its support in the collection of these data.
Notes
Appendix 1. Comparison of covariate balance before matching and after PSM: Non-victims to non-hate crime victims
| Covariate | Before matching | After matching | |||||
|---|---|---|---|---|---|---|---|
| Crime victims | Non- victims | Difference | Crime victims | Non- victims | Difference | ||
| Individual/Household | Age | 50.977 | 51.884 | −0.907 | 50.977 | 51.143 | −0.166 |
| Male | 0.412 | 0.401 | −0.011 | 0.410 | 0.410 | 0.001 | |
| Time at address | 5.740 | 5.183 | 0.557* | 5.740 | 5.743 | −0.003* | |
| Renting | 1.104 | 1.141 | −0.037* | 1.104 | 1.105 | −0.001 | |
| LOTE | 0.075 | 0.120 | −0.045* | 0.075 | 0.079 | −0.004 | |
| Born overseas | 0.765 | 0.696 | 0.069* | 0.765 | 0.758 | 0.007 | |
| Neighbourhood | Mobility (%) | 42.822 | 43.227 | −0.405 | 42.822 | 43.010 | −0.188 |
| LOTE (%) | 16.598 | 14.311 | 2.287* | 16.598 | 16.779 | −0.181 | |
| Median income $ | 1181.80 | 1232.20 | −50.4* | 1181.8 | 1187.10 | −5.3 | |
| Observations | 1,749 | 2,432 | 1,749 | 991 | |||
| Bias | 61.2 | 5.2 | |||||
| Variance ratio | 0.91 | 0.93 | |||||
Note: t -tests on the difference were calculated to determine if the difference between groups was significant. * indicates p < 0.05.
Appendix 2. Comparison of covariate balance before matching and after PSM: Non-hate crime to hate crime victims
| Covariate | Before matching | After matching | |||||
|---|---|---|---|---|---|---|---|
| Hate crime | Non-hate crime | Difference | Hate crime | Non-hate crime | Difference | ||
| Individual/Household | Age | 45.179 | 50.977 | −5.798* | 45.179 | 45.175 | 0.004 |
| Male | 0.548 | 0.412 | 0.136* | 0.538 | 0.512 | 0.026 | |
| Time at address | 5.179 | 5.740 | −0.561* | 5.179 | 5.288 | −0.109 | |
| Renting | 1.346 | 1.104 | 0.242* | 1.346 | 1.333 | 0.013 | |
| LOTE | 0.282 | 0.075 | 0.207* | 0.282 | 0.262 | 0.020 | |
| Born overseas | 0.667 | 0.765 | −0.098* | 0.667 | 0.692 | −0.025 | |
| Neighbourhood | Mobility | 39.814 | 40.822 | −1.008* | 39.814 | 39.701 | 0.113 |
| LOTE | 21.883 | 16.598 | 5.285* | 21.883 | 23.18 | −1.297 | |
| Median income | 990.10 | 1181.80 | −191.7* | 990.10 | 973.69 | 16.41 | |
| Observations | 82 | 1,803 | 78 | 137 | |||
| Bias | 107.9 | 15.8 | |||||
| Variance ratio | 1.64 | 1.09 | |||||
Note: t-tests on the difference were calculated to determine if the difference between groups was significant. * indicates p < 0.05.