
Abstract
The underreporting of hate crime is recognised as problematic for jurisdictions across Europe and beyond. Within the UK, the landmark inquiry report into the murder of Stephen Lawrence 25 years ago has seen governments faithfully adhering to a policy of promoting the increased reporting of hate crime. An enduring legacy of the inquiry, third-party reporting centres (TPRCs) have been equally faithfully promoted as the primary vehicle for achieving such increases. While the nations of the United Kingdom have pioneered the development of TPRCs, their function and form have been adopted in other jurisdictions, including Victoria, Australia. Nevertheless, despite their reliance on TPRCs, policymakers have given limited attention to their efficacy. The evidence from a plethora of small scale studies has consistently found that TPRCs have been limited by public awareness, capability, capacity and poor oversight difficulties. Responding to these long-standing problems, the authors have developed the first ‘TPRC assessment tool’ which offers a diagnostic facility to improve effectiveness. This paper describes the development and piloting of this tool and highlights its potential to inform policy and practice both in the UK and internationally, providing an original contribution to the limited evidence base around third-party reporting.
Background
Why third party reporting?
The underreporting of hate crime is a problem across the member states of the European Union, as indicated by the establishment of the hate crime reporting sub-group of the European Union Agency for Fundamental Human Rights (FRA, 2016) and the group’s Compendium of Practices (FRA, 2017a). It has also been recognised in other jurisdictions beyond Europe, such as Australia (Mason et al., 2017) and the USA (Massuci and Langton, 2017). In the UK, it is 25 years since the racist murder of Stephen Lawrence in a south-east London borough and almost 20 years since the public inquiry into Stephen’s death and the bungled investigation by the Metropolitan Police (MacPherson, 1999). One of the many notable recommendations from the inquiry report recognised the need to provide an alternative to the police reporting mechanism for victims of racial hate crime in the UK (MacPherson, 1999). Intended to circumvent mistrust driven by poor police/community relations, third party reporting centres (TPRCs) have since flourished in a patchwork of provision across the UK, extending their function across five monitored victim strands recognised by the government. 1 Citizens Advice Bureaus, community and faith groups, student unions, public libraries, housing authority neighbourhood offices and day care centres can all be TPRCs. Impetus for their further growth has come from refreshed action plans on hate crime which explicitly endorse third party reporting (Home Office, 2016; Welsh Government, 2014).
The ambition with TPRCs, then as now, is to increase the reporting of hate crime. By doing so the authorities can generate a fuller, more accurate picture of the size, patterning and gravity of hate crime victimisation, allowing key statutory agencies, the police and local authorities to devise and deploy more effective solutions (Green et al., 2001; McDevitt et al., 2002). Despite these longstanding efforts there is considerable evidence to confirm that hate crime is underreported in the UK, from the Crime Survey England and Wales (CSEW) (Corcoran et al., 2015) to smaller scale studies (Chakraborti et al., 2014; Stonewall, 2013; Wong et al., 2013). Similar evidence exists internationally, for example, in the USA (Massuci and Langton, 2017) and in Victoria, Australia (Mason et al., 2017; Victorian Equal Opportunity and Human Rights Commission, 2010, 2013).
The impetus for establishing TPRCs, notably, victim dissatisfaction with the police response to hate crime, remains. In England and Wales, this is confirmed by Corcoran et al. (2015) and by earlier studies (Chakraborti et al., 2014; Home Office, Office for National Statistics and Ministry of Justice 2013; Jarman and Tennant, 2003; Paterson et al., 2008; Quarmby, 2008; Stonewall, 2013; Victim Support, 2005), and in Victoria, Australia is highlighted by Mason et al. (2017) and Moran and Sharpe (2002).
Given the centrality of TPRCs to strategies to address hate crime, it seems to be a major government oversight that to date, in the UK or anywhere else, there has been no consistent way to assess whether or not hate crime reporting centres are fulfilling their primary aim, that of increasing hate crime reporting. In the absence of government sponsored remedies, this article presents analysis of empirical data collected via a tool designed by the authors to address this gap and assess the efficacy of TPRCs. The implication of the findings is situated within the context of current policy, practice and evidence of third party reporting in England, Wales and Scotland. Given that the underreporting of hate crime is a problem in other jurisdictions (FRA, 2016, 2017b; Mason et al., 2017; Masucci and Langton, 2017; Schweppe et al., 2018), the findings have wider international applicability, providing an original contribution to the limited evidence base around third party reporting.
A brief history of third-party reporting
Third party reporting can take a number of forms: a person can be a ‘third party reporter’ (for instance, a social worker seconded to a day care centre for people with disabilities), as well as reporters being public and voluntary and community agencies physically located in neighbourhoods and communities. For the purposes of this TPRC tool (discussed further below) we differentiate between third party reporting services (for instance Stop Hate UK 2 and TellMAMA 3 ) which provide reporting and support services nationally or near nationally, and TPRCs which have a specific geographical location and through this provide reporting and sometimes other aligned services. The TPRC tool has been designed to assess the latter, which comprise the vast majority of third party reporting facilities.
Third party reporting services generally perform well, providing publicly available statistical reports of incidents as an index of performance, accountability and transparency. 4 However, the wider picture amongst the very many more TPRCs is more difficult to gauge. There is a surprising lack of data on hate crimes reported to local reporting centres (Monchuk and Santana-Acosta 2006, cited in Wong and Christmann, 2016; Wong and Christmann, 2008; Wong et al., 2013) and hence the performance of the centres. For instance, in one of these studies (Wong et al., 2013) to minimise the administrative burden on them the TPRCs (mainly small voluntary and community sector (VCS) agencies), were not even required to collect data on hate crime reporting. 5 The admittedly limited research base paints a worrying picture about how well TPRCs are operating in fulfilling this basic remit.
The most extensive review to date of TPRCs in England and Wales undertaken by the National Policing Hate Crime Group was damning. ‘Many’ of the schemes examined had failed to increase hate crime reporting and they were found not to be delivering ‘any tangible results’ (College of Policing, National Policing Hate Crime Group, 2014: 48–49). 6 They recommended that the performance of centres be monitored and any identified shortfalls be addressed. In Scotland, difficulties in the consistency of provision by TPRCs, as well as limited numbers of case workers and concerns over the quality of their training have been raised by Scotland’s Independent Advisory Group (One Scotland, 2016, 2017). Not all listed centres were operational, some staff were unclear about how to deal with hate crime victims, there were low levels of reporting, and concerns were expressed about the general level of awareness amongst the wider populations as to the existence of TPRCs (One Scotland, 2016, 2017). These disappointing findings chime with the conclusions of earlier small scale studies which have examined TPRC effectiveness across areas of England (Chakraborti and Hardy, 2015; JUST West Yorkshire, 2012; Roulstone and Thomas, 2009; Swift Research, 2005; Wong and Christmann, 2008). Further, it has been posited that successive governments’ uncritical acceptance of TPRCs may be acting as an inhibitor to improving their efficacy (Wong and Christmann, 2016). An inspection into the handling of hate crime was at the time of writing being conducted by Her Majesty’s Inspectorate of Constabulary and Fire and Rescue Services and the results are awaited with interest (Her Majesty’s Inspectorate of Constabulary and Fire and Rescue Services, 2017).
While criticism of the efficacy of hate crime reporting centres may be justified, it should be tempered by acknowledging the often limited and variable resources invested in such provision. In the North East of England, Clayton et al. (2016: 72–73) attributed ‘extremely low’ recording rates to budgetary pressures undermining staff capacity. Difficulties with building knowledge and professional capacity have been exacerbated by insecure funding which has been more acute in dispersed rural areas (Garland and Chakraborti, 2007). There are indications that resourcing and capacity are being further stretched by the dispersal of hate crime victimisation from inner-city urban areas to smaller towns and villages, reflecting changing neighbourhood demographic characteristics and the breaking down of cultural homogeneity in England and Wales (Burnett, 2012a, 2012b, 2012c; Garland and Charaborti, 2007; Wong et al., 2013), with similar results in parts of the USA (Grattet, 2009; Green et al., 1998; Lyons, 2008). This underscores the need for provision in areas which had been previously thought of as a lower priority when tackling hate crime, drawing attention to the distribution of TPRC capacity and how current and planned provision will meet this changing ecology. The uneven distribution of TPRC capacity across the country was recently identified by victims in Scotland (One Scotland, 2016). In the South-West of England, a predominantly rural area, a ‘post-code lottery’ in third-party reporting provision prevailed (James and Simmonds, 2013: 254).
Rationale for the TPRC assessment tool
Not all TPRCs are failing. The authors’ contact with relevant stakeholders: Police and Crime Commissioners (PCCs) (who fund policing services), police, TPRCs, local authorities and victim services suggests, anecdotally at least, that there are examples of active and successful centres. However, adopting TPRCs as an orthodoxy to improving hate crime reporting and recording is at best unproven, and on the current (limited) evidence, seriously in doubt. There is a chronic lack of useable data to assess TPRC performance (Sin et al., 2009: vii). Even attempting to discover the number and distribution of TPRCs throughout England and Wales draws a blank, 7 in contrast to Scotland, where Police Scotland have compiled a list of TPRCs across 15 geographical areas (totalling 383 TPRCs throughout Scotland). 8
The most recent government action plan for England and Wales (Home Office, 2016) included a commitment to improve the reporting of hate crime, involving funding three new ‘community demonstration projects’ to explore innovative ways that communities can respond to hate crime and thereafter distil lessons learnt. This is welcome, but it should not come at the expense of utilising the existing reporting infrastructure, whose capabilities and capacities remain largely unknown. The assessment tool developed by the authors is intended to assess TPRC efficacy at the level of an individual centre, as well as at an administrative area such as police force, PCC and/or local authority.
Method: developing and testing the tool
Drawing on studies which assessed the effectiveness of TPRCs in England and Wales (Chakraborti and Hardy, 2015; Chakraborti et al., 2014; Christmann and Wong, 2010; Clayton et al., 2016; James and Simmonds, 2013; Monchuk and Santana-Acosta, 2006; Wong and Christmann, 2008; Wong et al., 2013) allowed the research team to identify six dimensions pertinent to the efficacy of TPRCs, listed in Table 1.
Dimensions of efficacy and their toolkit indicators. 11

Our intention was to develop a tool that assessed TPRCs against each of these dimensions and which produced an overall measure of efficacy. Table 1 provides examples of the toolkit items used to assess each dimension. As Table 1 shows, we devised two (rather than one) overall measures of efficacy: (a) based on dimensions 1 to 5, being the capacity and capability of the organisation to provide a third party reporting service; and (b) based on dimension 6, an activity measure, taking hate crime reports and passing these onto other agencies, such as the police, local authorities and other support services (further details are provided in the Findings section).
It is important to note that at this stage of the tool’s development, the validity of the six individual dimensions and the internal consistency of the two overall measures of efficacy have not been tested statistically. This testing is planned at a later stage, when a larger sample size will be available. However the face validity of the tool has been assessed by key informants, representing relevant stakeholders: (a) the director of a charity providing hate crime services across England; (b) a government policymaker responsible for hate crime policy and practice across England and Wales; (c) a local authority officer responsible for hate crime provision in their area; and (d) a voluntary sector co-ordinator of TPRCs in a county of England with additional responsibility for hate crime policy and practice with a national charity. The assessment of each dimension was based on a series of questions. Was the dimension a credible factor contributing to increased efficacy? Did the questions in the tool accurately measure the dimensions? Did the questions in the tool comprehensively measure all relevant aspects of each dimension? Did the weighting applied to each answer in the tool reflect that item’s contribution to efficacy?
These themes were considered by the informants and the questions associated with the dimensions were revised, added to or removed in accordance with informant feedback.
A first iteration of the tool was provided as an online survey and tested by 21 (of 44) TPRCs in a local authority area in the north of England (R1) in 2016. The tool was amended based on data analysis and feedback. A second iteration of the tool was tested with 14 (of 19) TPRCs in a county in England (R2) in 2017. These TPRCs completed the survey using an online or hard copy version. A focus group was held with representatives from the second group to assess: face validity – clarity for the respondent as to the inclusion of the survey question; clear definitions – clear and unambiguous questions to ensure consistency in the understanding of questions by respondents; clear and comprehensive response options – to facilitate ease of response by users; and usability within limited time constraints – balancing the requirement to collect a sufficient level of data (to enable a meaningful assessment to be made) against the adjudged time that a respondent is likely to invest in completing the tool.
Both sets of data collected by the tool were analysed in two stages using Microsoft Excel. First, the production of descriptive statistics provides a summary of the nature of provision across the TPRCs. The second stage involved the calculation of efficacy scores (further details are presented in the Findings section). The resultant TPRC scores were qualitatively checked for congruency with three of the key informants against their knowledge about the TPRCs. Their feedback informed further revisions to the tool and scoring system.
The process of designing the tool, collecting data and reflecting on the efficacy sources has provided multiple benefits including providing summary data on the activities of TPRCs, highlighting ways in which the tool could be improved and raising broader questions about the functions of TPRCs. It is important to state that there are limitations to the data collected thus far to test the tool. They are based on small samples and therefore the generalisability of their responses may be limited. However, we have attempted to mitigate this by aiming for representativeness. The key informants whom we consulted on the validity of the dimensions, and the broad measures and scoring have depth and breadth of experience of third party hate crime reporting provision. The TPRCs which completed the first iteration of the tool were located in an urban area with a diverse population profile (i.e. based on ethnicity, religion, sexuality, gender and disability). The second iteration of the tool was completed by TPRCs located in a primarily rural county comprising villages, small and large towns and with a less diverse population profile. It is important to note that the aim of this process was to develop and test a tool to assess the efficacy of TPRCs. Therefore, rather than maintain the question wording for each iteration of the tool, questions were refined to improve their clarity and produce a broader spread of responses. Although these changes mean that direct comparisons between local authority areas cannot always be made, some clear patterns can be identified.
Findings
Efficacy
Drawing on the results from the six dimensions, two efficacy scores were calculated for each TPRC. The first score provided a measure of the centre’s capacity and capability; this was calculated from the sum of scores on individual dimensions relating to Organisation, Staffing, Services provided, Geographical coverage, and Links to partner agencies. A maximum capacity and capability score (100%) would be received by a TPRC which had the following attributes: hate crime reporting as its core business; receives specific hate crime funding; employs paid staff dedicated to hate crime reporting; all staff have up-to-date training in handling hate crime reports (i.e. in last 12 months); takes reports 24 hours a day; responds to all types of hate crime; offers a full range hate crime-related services; provides a full range of reporting methods; and has strong partnership links to relevant agencies.
Based on evidence from the literature (cited above) we would expect this hypothetical TPRC to be the best placed to respond to hate crime. A Red Amber Green (RAG) rating 9 was applied to the TPRCs based on each TPRC’s score as a proportion of the total score that was available. The highest scoring centres were classed as green (over 66%), medium scoring as amber (34%–66%) and the lowest scoring were classed as red (up to 33%).
The RAG rating (see Table 2) suggests that the TPRCs are a long way from the ‘ideal type’ TPRC. In both rounds the modal rating was amber: 62% of centres in R1 (13 of 21) and 64% in R2 (9 of 14). Five centres received a green rating in R1 but none of the R2 centres were rated green for capacity.
Third-party reporting centres: capacity and activity scores.

The second activity score was calculated by comparing the number of reports and onward conversions that would be expected given the capacity and capability of the centre with the number of reports actually received and the proportion of those reports that were converted into police reports or other clear actions. Underreporting of hate incidents means that the true number of such incidents that could potentially be reported is unknown. It is acknowledged that there will always be underreporting for a wide variety of reasons, as identified through two sweeps of the CSEW (Smith et al., 2012). These reasons have been categorised as including: (a) a perception that the police will do nothing and/or that they are not interested; (b) the incident is too trivial to report; (c) considering it a private matter for the victim to deal with themselves; (d) being a common occurrence and hence viewed as not worth reporting; and (e) fear of reprisal if the victim does report the incident. Consequently, in this analysis the ‘expected number of reports’ was based solely on the number of reports that were received across each sample – this total number of reports was expected to be shared across centres proportionate to capacity levels. It is hoped that this measure can be refined later as such data on hate crime incidents improve. These elements were scored and the total converted into a RAG rating based on the level of activity and proportion of conversions. The rationale for the rating was as follows. RED: Centre receives no reports when they would be expected to (based on capacity) OR centre receives reports but a low proportion are converted. AMBER: Centre receives reports but fewer than expected OR Centre receives expected level of reports but not all are converted. GREEN: Centre receives expected level of reports (or higher) AND all reports are converted.
As shown in Table 1, in both rounds: R1 = 48% of centres (10 of 21), R2 = 64% of centres (9 of 14), and the modal category was red. These were centres which received no reports although they would be expected to given their capacity. In R1 six centres were rated amber because they received fewer reports than would be anticipated. One centre in R2 received this rating – in this case the centre had received the anticipated level of reports but the conversion rate was low. In R1 five centres were rated green, and four were rated green in R2. These centres received the expected level of reports and all were converted to police reports.
Paucity of provision
The two sites where the tool has been tested – one primarily urban, the other rural but featuring some small to medium sized towns – may not be representative of all local authorities in England and Wales or indeed other jurisdictions. Nevertheless, they offer an indicative insight into third party reporting provision which may have wider applicability, highlighting issues which potentially affect the effectiveness of individual TPRCs and also collectively, provision across a geographical area. The most notable results, across the six dimensions of the tool, which underpin the efficacy assessments above are as follows:
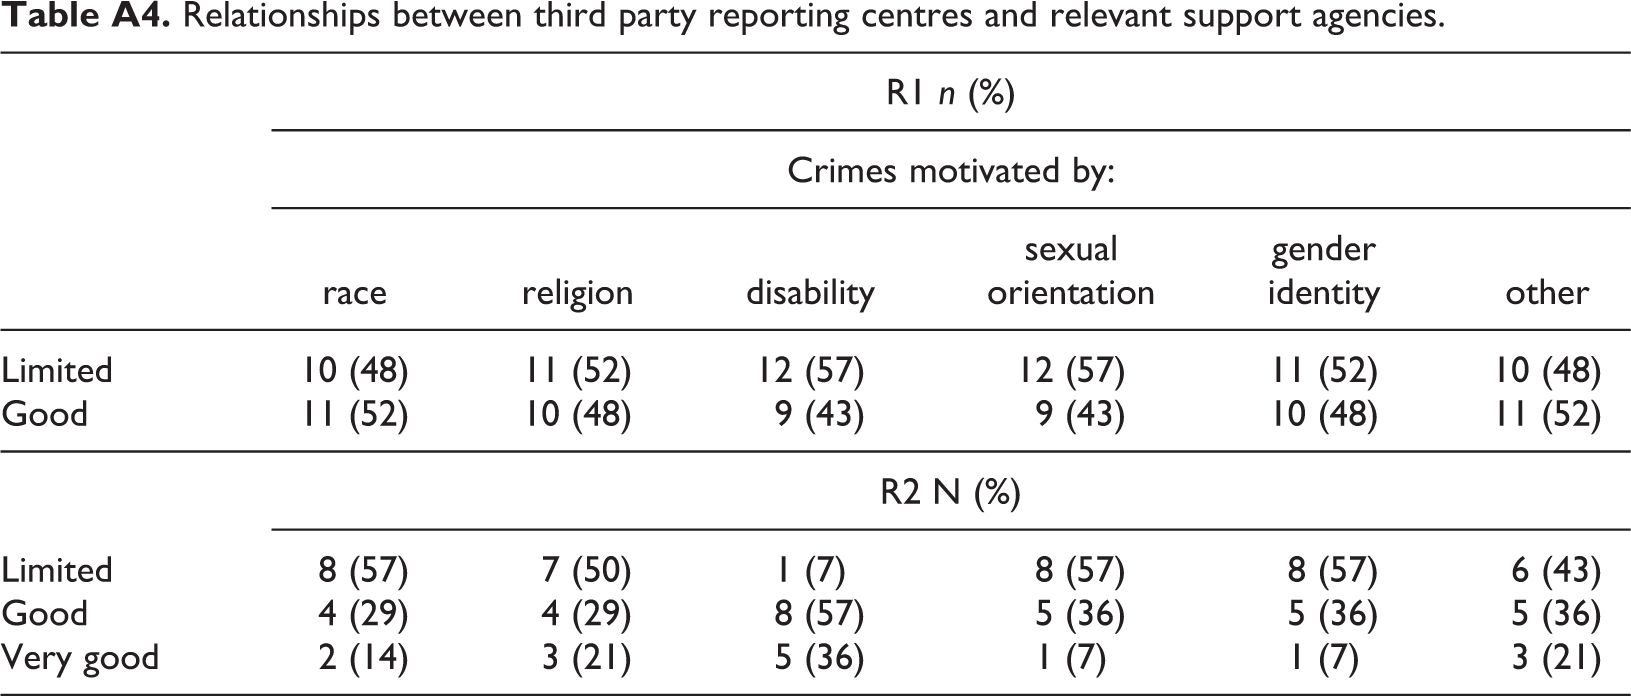
First, there was very limited dedicated hate crime reporting provision and associated with this, very little dedicated funding. Across the two pilot sites, all of the agencies which responded to this question reported that hate crime reporting was not their core business. Only one agency across both sites received any dedicated funding for hate crime reporting (see Table A1 in the Appendix). Second, uptake of reporting services was low. A number of TPRCs had taken no reports in the previous 12 months. In R1 around one-half of the 21 TPRCs reported receiving no victim contacts in the previous 12 months. In R2 only 5 of the 14 centres reported receiving any victim reports in the previous 12 months, although in this site, some centres had only become TPRCs part way through the past year. Third, while centres may be offering a range of provision (see Table A2 in the Appendix), few, if any were monitoring uptake of their own services. All R1 centres offered taking a report for referral to other agencies with nine centres offering to take a report but not to pass it on to other agencies. In R2 only 7 of the 14 centres confirmed that they took reports for passing onto other agencies. However, this appeared to be contradicted by their response to a different question where 11 of the 14 centres reported that they signposted or referred individuals to other agencies. Fourth, a significant proportion of TPRC staff had not had up to date training on taking hate incident reports. In R1 on average, only one-third of paid staff/volunteers at each centre had received training on hate incident reporting within the last 12 months. In R2 on average only one-quarter of staff had received training on hate incident reporting in the last 12 months, although this ranged from 80% of staff in one centre to no staff in two centres. When we combine this finding with the low service uptake, there appear to be few opportunities for staff skills to be tested in a live situation and/or for these to be refreshed. Fifth, around one-half of the TPRCs in both sites reported limited links with support agencies which represent the monitored victim groups (see Table A3 in the Appendix). Sixth, while the conversion rates from reports received to reports referred to other agencies were good for those TPRCs which had received reports, this commendable level of conversion activity was undermined by the low rates of reporting to the services (see Table A4 in the Appendix). These findings generally confirm patchiness in capacity and capability, itself reflecting the lacklustre picture of TPRC activity identified in past studies (Chakraborti and Hardy, 2015; Clayton et al., 2016; College of Policing, National Policing Hate Crime Group, 2014; JUST West Yorkshire, 2012; One Scotland, 2016, 2017; Roulstone and Thomas, 2009; Swift Research, 2005; Wong and Christmann, 2008).
Discussion
Policy on the efficacy of third party reporting
This failing situation is not entirely the fault of the centres themselves. One could view them almost as being set up to fail. Government reliance on TPRCs as a viable means to increase hate crime reporting seems to be predicated on a lack of appreciation of the resources required to make their policy aim meaningful. It is further predicated on a more widespread held assumption about the capacity of VCS and public agencies to undertake this function in addition to the services they are funded to provide. For VCS agencies this is part of a wider underappreciation by government of VCS resourcing (Clinks, 2016; Hucklesby and Corcoran, 2016). Judged on the proliferation of TPRCs across the UK and other jurisdictions there appears to be no reluctance among agencies to rally to the cause of supporting the reporting of hate crime – as noted by the authors elsewhere – just like motherhood and apple pie and no-one is against it (Wong and Christmann, 2016). With some exceptions (noted earlier) the evidence suggests these good intentions are not matched by effective performance. Fundamentally, TPRCs are intended to take reports of hate incidents, to collate that information and to ensure (wherever possible) that these are notified to the relevant statutory bodies, police and local authorities. The continued general underperformance of third party reporting provision raises questions (which are not new, see Christmann and Wong, 2010; Wong and Christmann, 2016) about the resourcing and embeddedness of TPRC provision within social networks and a full appreciation of the barriers to reporting. Whether or not third party reporting is better served by concentrating resources in a few, or smaller number of agencies that are adequately resourced and have appropriate capable dedicated staff or continuing to rely on a spread of agencies where third party reporting is a service that they offer, in addition to their main funded responsibilities, has not been adequately examined. The corollary to this is that a singular emphasis on capacity and capability could jeopardise wider agency goodwill, reduce legitimacy and inadvertently introduce disenfranchisement. This could be at its most acute among agencies which offer geographical proximity to potential hate crime/incident victims – such as neighbourhood centres – by reducing the potential for reporting face to face. Campaigning organisations which are close to individuals from the protected strands, who advocate for and serve their interests (i.e. lesbian, gay, bisexual and transgender, faith and Black and minority ethnic or Black groups) and feel a legitimate right to be involved in delivering such provision may also feel undermined. In the USA, McVeigh et al. (2003) found that the presence of civil rights organisations and the resources of civil rights organisations contributed to higher numbers of reported hate crimes, demonstrating the importance of having an organisational infrastructure to promote positive reporting messages, channel grievances and advocate on behalf of minority groups. As noted by Schweppe et al. (2018), more generally there is a value in civil society hate crime reporting systems as a source of challenge to otherwise hegemonic state constructions of jurisdictional hate crime. In short, there is a trade-off to be made when considering TPRC efficacy, between capacity and capability, representation (both geographical and interest group) and co-production of a socially just ideal. However provision is configured it is important that we do not lose sight of the purpose of TPRCs (MacPherson, 1999), which provide a safe space for victims to report hate incidents and thereby encourage reporting. Considerations of efficacy need to have this goal foremost, and the TPRC tool discussed here offers a means to measure this.
Applying the tool
The findings demonstrate that the tool has a role as a diagnostic instrument for two potential groups of end users: individual TPRCs; and those with commissioning and/or crime reduction co-ordinating responsibilities. In England and Wales, these would include PCCs, police, local authorities, community safety partnerships and criminal justice boards. It offers a ready means to collect data across individual and administrative areas, and if used in multiple areas, the potential for both benchmarking TPRCs within individual areas and against other comparable areas. For example, at a PCC level, adopting the ‘most similar policing group force areas’ as a guide to comparability from one area to another.
The authors acknowledge that the tool does not provide definitive answers about TPRC efficacy. However, as demonstrated by the two separate trials, R1 and R2, the tool does enable specific questions around efficacy to be identified, for example: why are so few victim reports being received by TPRCs? Why have some TPRCs not received any reports in the last 12 months? Is the very limited level of 24-hour reporting cover acceptable in that particular area? Are there sufficient modes of reporting on offer to enable victims and others to report incidents? As indicated, the tool allows for more focused inquiry and once the problems are better understood, identifying suitable remedies. To make best use of the tool we would argue that it needs to be applied across an administrative area to all TPRCs. This benefits individual TPRCs – providing them with their own efficacy scores, which they can benchmark against other centres in their area. The presumption (and hope) is that knowing how they fare may spur those who perform less well to improve. This would also afford commissioners and co-ordinating bodies an overview of provision in their area, enabling them to identify existing capacity and capability, gaps in provision, good and poor performance of individual TPRCs and where remedial action (such as further training and support) may be required. It would also allow commissioners to test the viability of new initiatives compared to any existing provision. For example, the effectiveness of launching reporting centres in commercial organisations or National Health Service sites could be specifically analysed. Equally, the efficiency of further/different funding models could be assessed, providing the commissioner with support to achieve best value.
Limitations of the tool
The authors acknowledge that there are limitations to the tool, in part an artefact of its purpose as an easy to complete diagnostic instrument. Firstly, it is based on self-assessment by TPRCs themselves which limits the reliability and accuracy of the data generated. However, as indicated above, the intention is not that the tool provides a complete solution. Instead, it offers an initial diagnostic assessment, which is intended to be followed up by further investigation by individual TPRCs reviewing their own performance and/or external bodies reviewing TPRCs performance across their geographical area of interest. In addition, reporting rates and performance can be placed in the context of the characteristics of neighbourhoods, their demographic makeup, density of population and mobility of population.
Secondly, it is inevitably limited by the data which the tool gathers – a trade-off between the length of the survey instrument, completion fatigue and the amount of useful fine-grained data captured therein. Our intention was and remains devising a tool which can be completed easily and within a reasonable period of time. The reasonableness of tool length and effort to complete was tested in R2. Based on this iteration of the tool, both of these criteria were found to have been met by TPRC respondents, with these users reporting that it took less time to complete than they had initially thought.
Thirdly, some of the dimensions around which the tool is constructed are open to debate and revision, such as the number of monitored victim groups included – here we recognise that some centres may want to concentrate upon a particular grouping. Also, for example, in the course of drafting this paper, we have reviewed the assignment of maximum capacity and capability which could be received by a TPRC in relation to the type of staff deployed. In the iterations of the tool upon which the findings are based, this is currently yielded by employed paid staff dedicated to hate crime reporting. In the next iteration of the tool, we will consider a means of recognising the benefits of trained professional staff delivering a dedicated hate crime service and the benefits of trained volunteer staff who may be drawn from the communities vulnerable to hate crime. Overall, it should be noted that the dimensions were devised based on a review of the evidence of TPRC efficacy available in 2016 and the early part of 2017. Updating the evidence review and amending the tool to reflect this will form part of further planned refinements.
Conclusion
To date, across England and Wales, potential commissioners of third-party reporting provision, such as PCCs and metro mayors (such as in London and Greater Manchester) which have subsumed the responsibilities of PCCs into their roles and local authorities have had limited, if any, data upon which to make decisions about how best to commission, organise and/or resource third party reporting in their areas. The tool presented in this paper is intended to help to fill this gap. We do not suggest that the tool is perfect, no tool is. This one, like any, has limitations. However, the tool is our practical contribution to addressing a long-standing problem and it is offered in that spirit. It also offers an opportunity to open up a dialogue about what TPRC effectiveness looks like and how it can be assessed, and in doing so, dislocates the silence from government, TPRCs themselves 10 and commissioners.
Footnotes
Notes
Appendix. Selected results from the analysis of tool responses
Relationships between third party reporting centres and relevant support agencies.
| R1 n (%) | ||||||
|---|---|---|---|---|---|---|
| Crimes motivated by: | ||||||
| race | religion | disability | sexual |
gender |
other | |
| Limited | 10 (48) | 11 (52) | 12 (57) | 12 (57) | 11 (52) | 10 (48) |
| Good | 11 (52) | 10 (48) | 9 (43) | 9 (43) | 10 (48) | 11 (52) |
| R2 N (%) | ||||||
| Limited | 8 (57) | 7 (50) | 1 (7) | 8 (57) | 8 (57) | 6 (43) |
| Good | 4 (29) | 4 (29) | 8 (57) | 5 (36) | 5 (36) | 5 (36) |
| Very good | 2 (14) | 3 (21) | 5 (36) | 1 (7) | 1 (7) | 3 (21) |