
Abstract
This study examined the association between adolescents’ obesity and sociometric status among their peers across 1 year. The participants were 2,528 junior high school students from Taiwan (mean age = 13.31 years). The negative associations discovered between obesity and sociometric status were both concurrent and cumulative. Moreover, the adolescents who changed from nonobese to obese were more likely to have lower social acceptance and be isolated in their classrooms. These findings inform concerns regarding the sociometric status of adolescents who are (or are becoming) obese.
Introduction
Child obesity is a major public health concern in Taiwan (Chen et al., 2012). A survey conducted by the Ministry of Education revealed that 34.3% of boys and 25.0% of girls in junior high school were overweight or obese in 2013. Furthermore, compared with the findings of a survey conducted by the World Obesity Federation in Asian countries in 2015, the prevalence of obesity among junior high school students in Taiwan was the highest in Asia (cited in Pan, Davis, Nichols, Hwang, & Hsieh, 2016).
Being overweight can be detrimental to individuals’ social acceptance within their peer groups (Schaefer & Simpkins, 2014; Valente, Fujimoto, Chou, & Spruijt-Metz, 2009). Compared with their normal-weight counterparts, overweight and obese adolescents experienced lower social acceptance in their peer groups (Zeller, Reiter-Purtill, & Ramey, 2008). Moreover, overweight and obese adolescents were more likely to be isolated in the group than normal-weight adolescents were. Strauss and Pollack (2003) found that overweight teenagers are socially marginalized among their peers. For adolescents, being isolated by peers can be an indicator of mental health problems, such as feelings of loneliness, negative self-worth, anxiety, and even depression, as well as academic difficulties and delinquency (Okamoto et al., 2011; Pakaslahti, Karjalainen, & Keltikangas-Järvinen, 2002).
Similarly, being overweight or obese is not an ideal physical feature for Taiwanese people. Previous studies have found that overweight and obese adolescents are at higher risk of weight stigmatization and discrimination than their normal-weight peers (Hand, Robinson, Stewart, Zhang, & Hand, 2017; Myers & Rosen, 1999; Puhl & Heuer, 2009, 2010; Smolak, Levine, & Thompson, 2001). Overweight and obese Taiwanese adolescents were also at a greater risk of weight stigmatization and discrimination among peers (Yen, Liu, Ko, Wu, & Cheng, 2014). Research conducted in Taiwan has demonstrated that overweight and obese adolescents are more likely to have low self-esteem and depression symptoms than normal-weight adolescents (Ting, Huang, Tu, & Chien, 2012; Yen et al., 2010).
The Current Study
Scholars have found negative associations between adolescents’ weight status and sociometric status in cross-sectional studies (Eisenberg, Neumark-Sztainer, Haines, & Wall, 2006; Strauss & Pollack, 2003; Zeller et al., 2008). However, whether these associations are cumulative over time remains unclear. Thus, we hypothesized that over time, adolescents who are overweight or obese retain a poor sociometric status among their peers, even though they have numerous opportunities to interact with these peers. In addition, compared with those who maintain a normal weight, adolescents whose weight status changes from nonobese to obese are hypothesized to experience less social acceptance and more isolation, two major aspects of sociometric status in this study (Bukowski, Sippola, Hoza, & Newcomb, 2000).
Sociometric nomination in a classroom environment has long been employed as a measure of adolescents’ sociometric status (Gifford-Smith & Brownell, 2003; Košir & Pečjak, 2005). In this study, we use social acceptance and isolation as two indicators of adolescents’ sociometric status.
This study used a modified nomination method (Poulin & Dishion, 2008). The typical nomination method involves provision of a student name list in the classroom for participants to check which classmates they like and dislike. However, this typical method does not consider the possibility that students’ best friends may be outside their classrooms. The most-liked friend nomination used in this study was not limited to being in the same classroom. The information obtained may thus be more valid (Apolloni, Marathe, & Pan, 2011; de la Haye, Dijkstra, Lubbers, van Rijsewijk, & Stolk, 2017; Schaefer & Simpkins, 2014).
Methods
Sample Description
This study used data obtained by the Taiwan Youth Project (TYP), which were longitudinal data for two cohorts of adolescents in Northern Taiwan (Yi, 2008a, 2008b). We analyzed the data from the younger cohort (seventh graders in Wave 1). The participants in the cohort (99.51%) were born between September 1986 and August 1987. Weight, height, and social acceptance index data for this younger cohort were collected in the second semester of the adolescents’ eighth grade (Wave 2 of the TYP) and ninth grade (Wave 3 of the TYP) in March 2001 and 2002 (Yi, 2008a, 2008b), respectively.
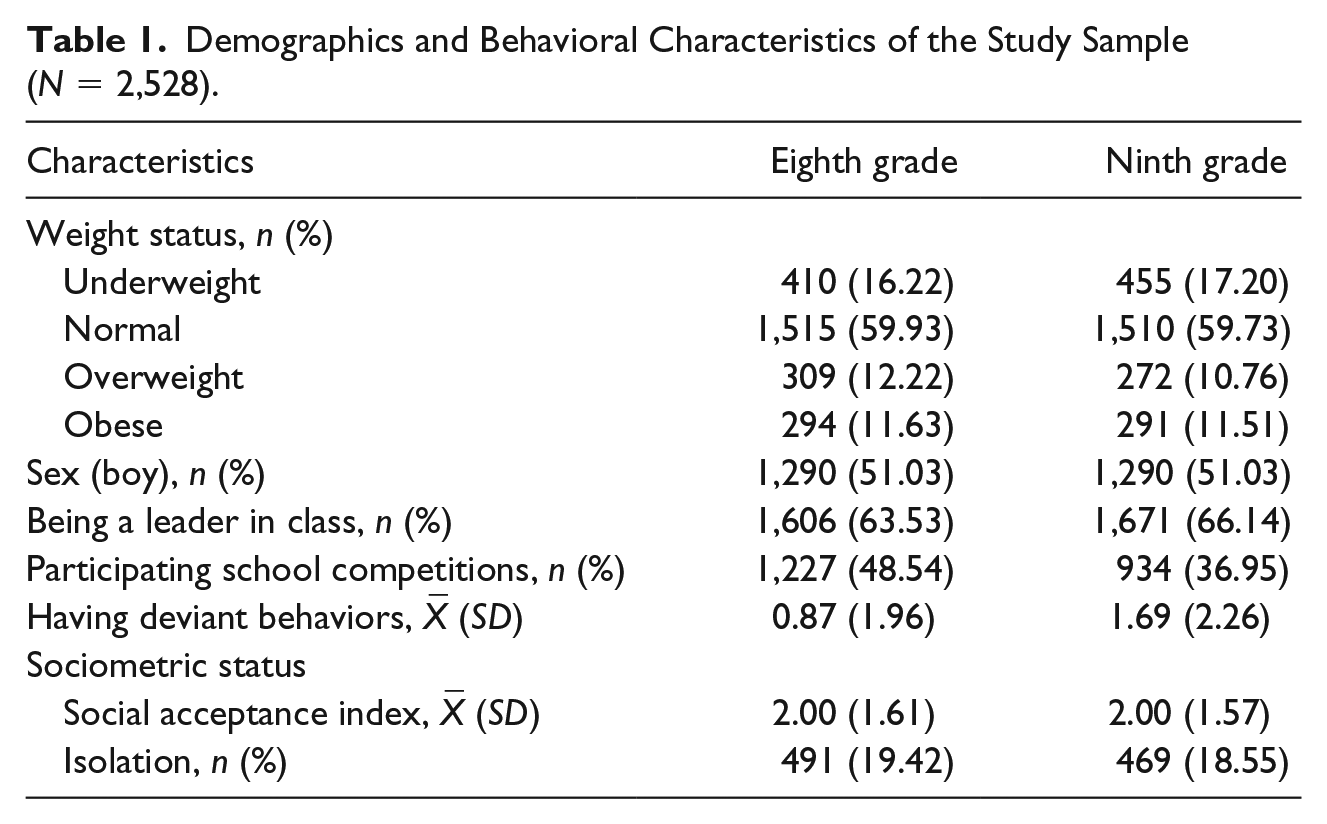
This study included 2,528 eighth-grade adolescents (51.03% boys; mean age [X_age] = 13.31 years; standard deviation [SDage] = 0.48 years) from 81 classrooms in 40 junior high schools. The body mass index (BMI) distribution and sample characteristics are presented in Table 1. In the sample, more than 20% of the adolescents were overweight or obese in both the eighth and ninth grades. In terms of social acceptance index, the participants received an average of two friend nominations from their class in both the eighth and ninth grades. The percentage of adolescents who were isolated was approximately 20% in both grades.
Demographics and Behavioral Characteristics of the Study Sample (N = 2,528).
Measures
Sociometric status
The participants’ sociometric status was measured through sociometric nominations in a class setting. Each participant nominated up to three most-liked friends who were not limited to those in their immediate classroom. The nomination data were collected in the eighth and ninth grades. The size of each class in junior high schools in Taiwan is around 20 to 30. As such, the proportion of like-most nominations would be similar to the original in-degree measure. Therefore, we did not employ the proportion of like-most nominations or standard scores in this study. Conceptually, the participants’ social acceptance index was constructed by summing the number of classmates’ friend nominations (i.e., in-degree measure). Adolescents who received no friend nominations were categorized as being isolated in class (coded 0 = not isolated or 1 = isolated) (Okamoto et al., 2011). We used Gephi 0.9.1, an open source and free software for numerous types of graph and network analyses, to calculate the participants’ social acceptance index (i.e., in-degree measure) and plot a social acceptance network for each class (Bastian, Heymann, & Jacomy, 2009).
BMI
The participants’ weight and height were obtained from their self-reported data in the eighth and ninth grades. Studies have validated self-reported weight and height as indicators of excess weight and obesity in adolescents (Tienboon, Wahlqvist, & Rutishauser, 1992). Each participant’s BMI was calculated by dividing their weight in kilograms by the square of their height in meters. The participants were categorized as underweight, normal, overweight, or obese. The BMI values corresponding to the percentile cutoffs were those defined by Taiwan’s Ministry of Health and Welfare (Health Promotion Administration, Ministry of Health and Welfare, 2017).
Control variables
Control variables were collected from the participants’ self-reports. Sex (coded 0 = boy or 1 = girl) was obtained in the eighth grade. In the ninth grade, the participants also reported whether they considered themselves to be class leaders (coded 0 = no or 1 = yes) and participated in school competitions (coded 0 = no or 1 = yes). The participants also answered whether they exhibited five types of deviant behavior (i.e., running away from home, fighting, cheating at exams, violating school rules, and using drugs); this was scored using a 4-point Likert-type scale from 0 (never) to 3 (frequently), and Cronbach’s α for this scale was .77. In addition, participant’s isolation in the eighth grade was a control variable.
Data Analysis
Participants were categorized as being underweight, normal weight, overweight, or obese in both their eighth and ninth grades. We further categorized them into four subgroups based on the change in their weight status from the eighth to the ninth grade. These four subgroups were (a) maintained a normal weight, (b) remained obese, (c) changed from nonobese to obese, and (d) other.
In this study, we first examined whether overweight or obese students have lower social acceptance index than their peers in their current classrooms. Using linear regression analyses, the adolescents’ ninth-grade social acceptance indexes were regressed on their ninth-grade weight status with the normal-weight group as the reference group (Model 1). In Model 2, adolescents’ ninth-grade social acceptance indexes were regressed on their eighth-grade weight status. Furthermore, we examined whether students’ weight status change from the eighth to the ninth grade was associated with their social acceptance index. In Model 3, the social acceptance indexes were regressed on weight change patterns with the maintained-normal-weight group as the reference group. We controlled for sex, social acceptance index in the eighth grade, being a leader in ninth-grade classes, participation in school competitions, and the five types of deviant behaviors.
We further examined the association of weight status and weight change patterns with isolation in class (yes or no) as the dependent variable. Adolescents’ ninth-grade isolation was regressed on their ninth-grade and eighth-grade weight status with the normal-weight group as the reference group. Finally, we tested whether adolescents’ weight status change from the eighth to the ninth grade was associated with being isolated in class with the maintained-normal-weight group as the reference group. The control variables were being isolated in class in the eighth grade, being a leader in ninth-grade classes, participation in school competitions, the five types of deviant behaviors in the ninth grade, and sex. Analyses were performed using SPSS 22.0 (IBM Corp., Armonk, NY, USA).
Results
Social Acceptance Index
We first examined the associations between social acceptance index, which is an index of sociometric status, and weight status (Table 2). Compared with their normal-weight ninth-grade counterparts, the ninth-grade adolescents who were obese had lower social acceptance (p < .01; Model 1 in Table 2). Students who were obese or overweight in the eighth grade also received lower social acceptance than their normal-weight counterparts did in the ninth grade (all p < .05; Model 2 in Table 2).
Linear Regression Results Assessing the Participants’ Social Acceptance Scores in the Ninth Grade (N = 2,528).
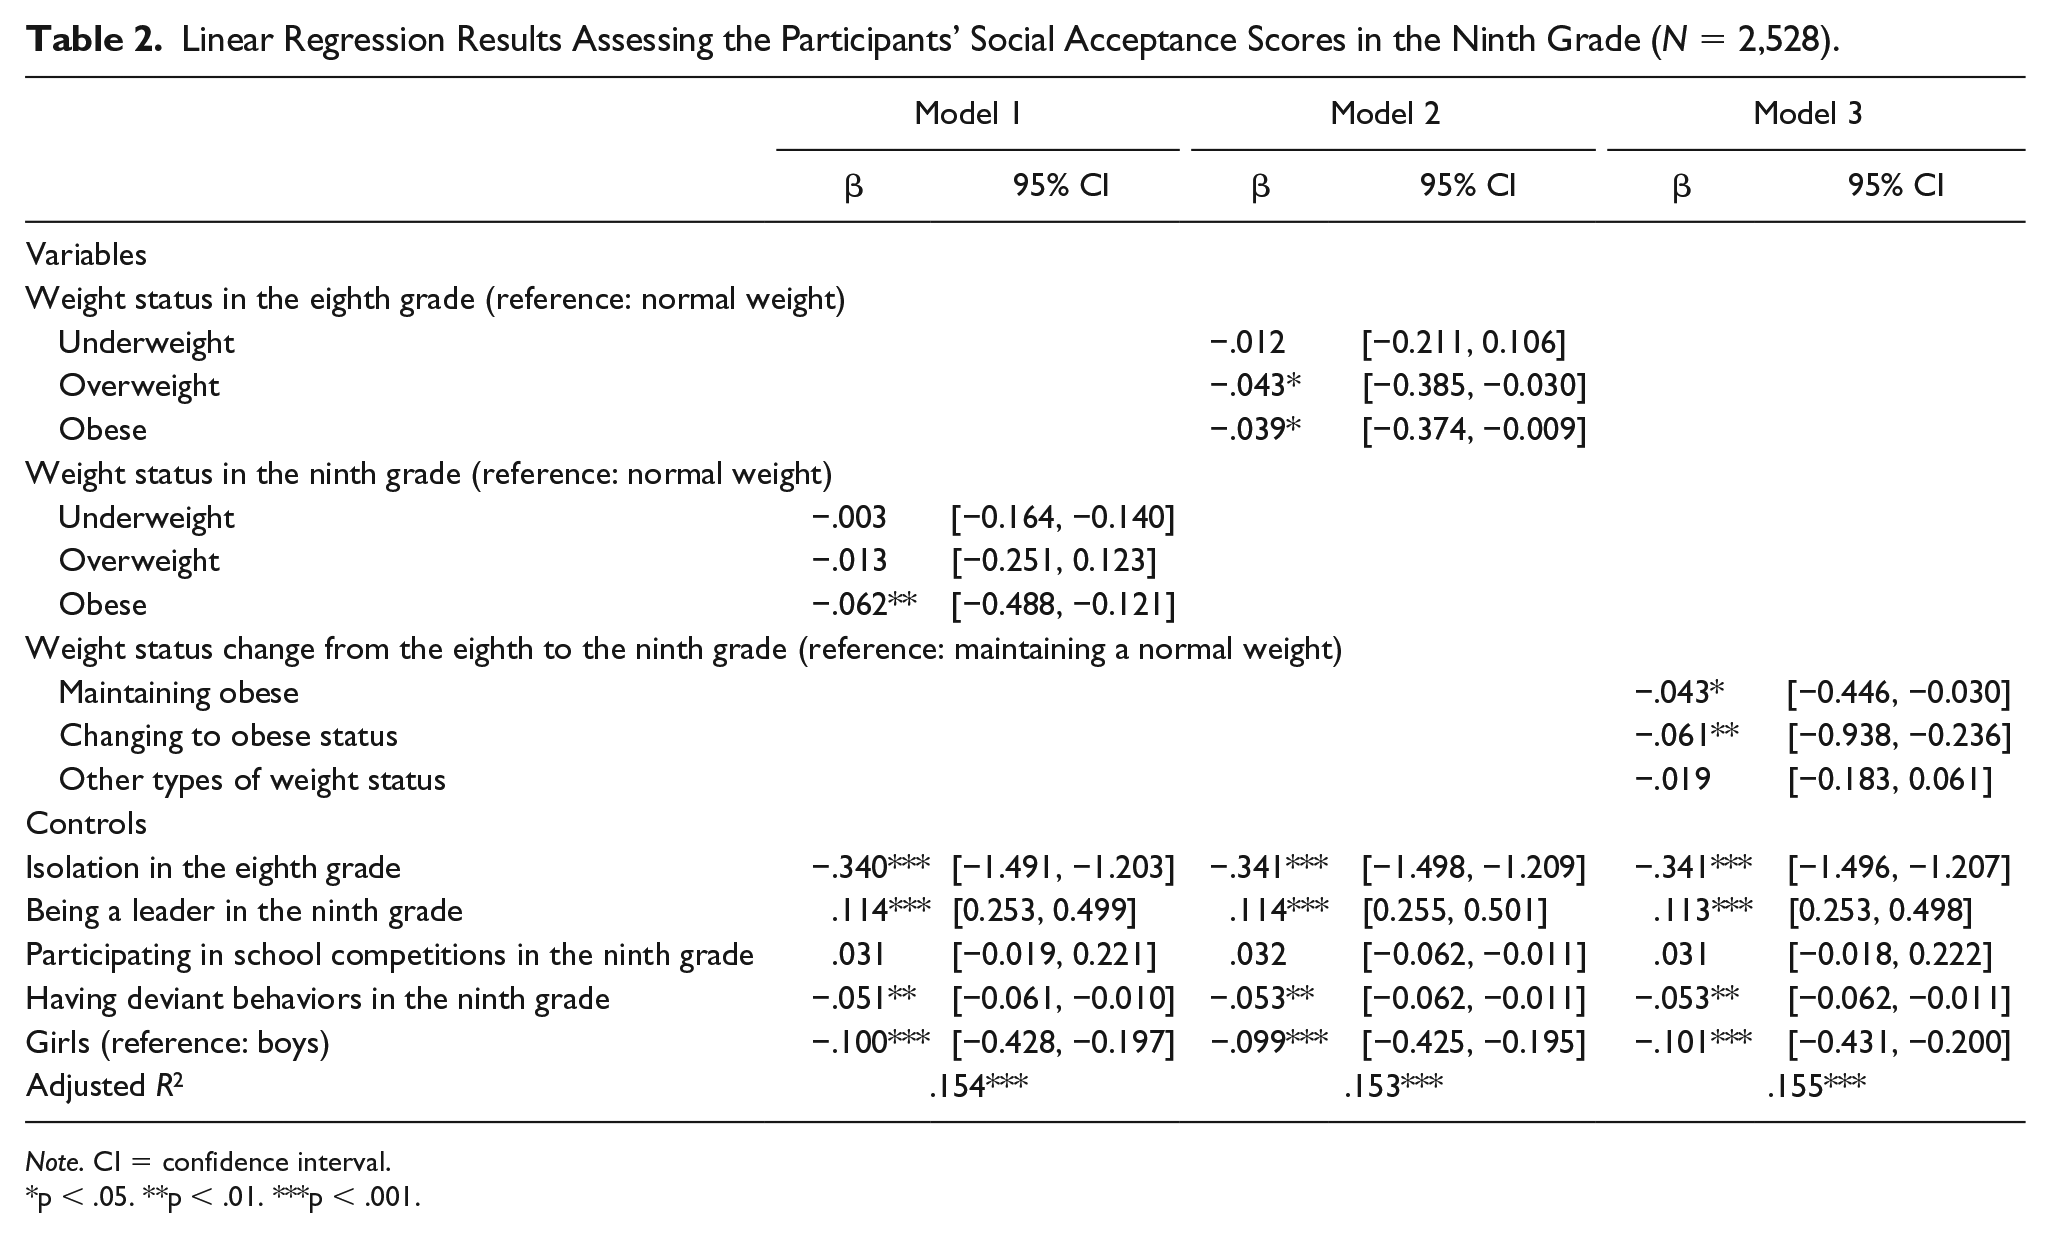
Note. CI = confidence interval.
p < .05. **p < .01. ***p < .001.
Next, we examined the associations between weight status change and social acceptance score. The data revealed that 8.78% of the participants (n = 222) maintained an obese status, 2.27% (n = 69) changed their status from nonobese to obese, and 50.79% (n = 1,284) maintained a normal weight. We discovered that the adolescents who remained obese and those who changed from nonobese to obese from the eighth to the ninth grade had lower social acceptance in the ninth grade than those who maintained a normal weight across the two grades (all p < .05; Model 3 in Table 2).
Isolation
Ninth graders’ isolation, which was another index of sociometric status, was regressed on weight status and weight status change. Logistic regression revealed that the obese ninth graders were 1.5 times more likely than the normal-weight students to be marginalized in the classroom setting (odds ratio [OR] = 1.51, 95% confidence interval [CI] = [1.09, 2.08], p = .013). Furthermore, adolescents who changed from nonobese to obese were more than 2.5 times as likely than those who maintained a normal weight to be marginalized among classmates in the ninth grade (OR = 2.60, 95% CI = [1.45, 4.66], p < .001).
The social acceptance networks are presented in Figure 1 to visualize the weight status of marginalized students in the classroom setting. Four classes were selected from which to draw social acceptance networks on the basis of the percentile ranking (PR) of overweight or obese students in the ninth grade (i.e., PR ≤ 25, 25 < PR ≤ 50, 50 < PR ≤ 75, and 75 < PR ≤ 100). The percentage of overweight or obese students in these four classes was 9.68%, 19.35%, 27.59%, and 53.85%, respectively. Overweight and obese adolescents were more likely to be isolated in the social acceptance network (to be outside the black line range). Even in a class with a higher percentage of overweight and obese students, the overweight and obese adolescents were still more likely to be in isolated positions in the social acceptance network (Figure 1d).
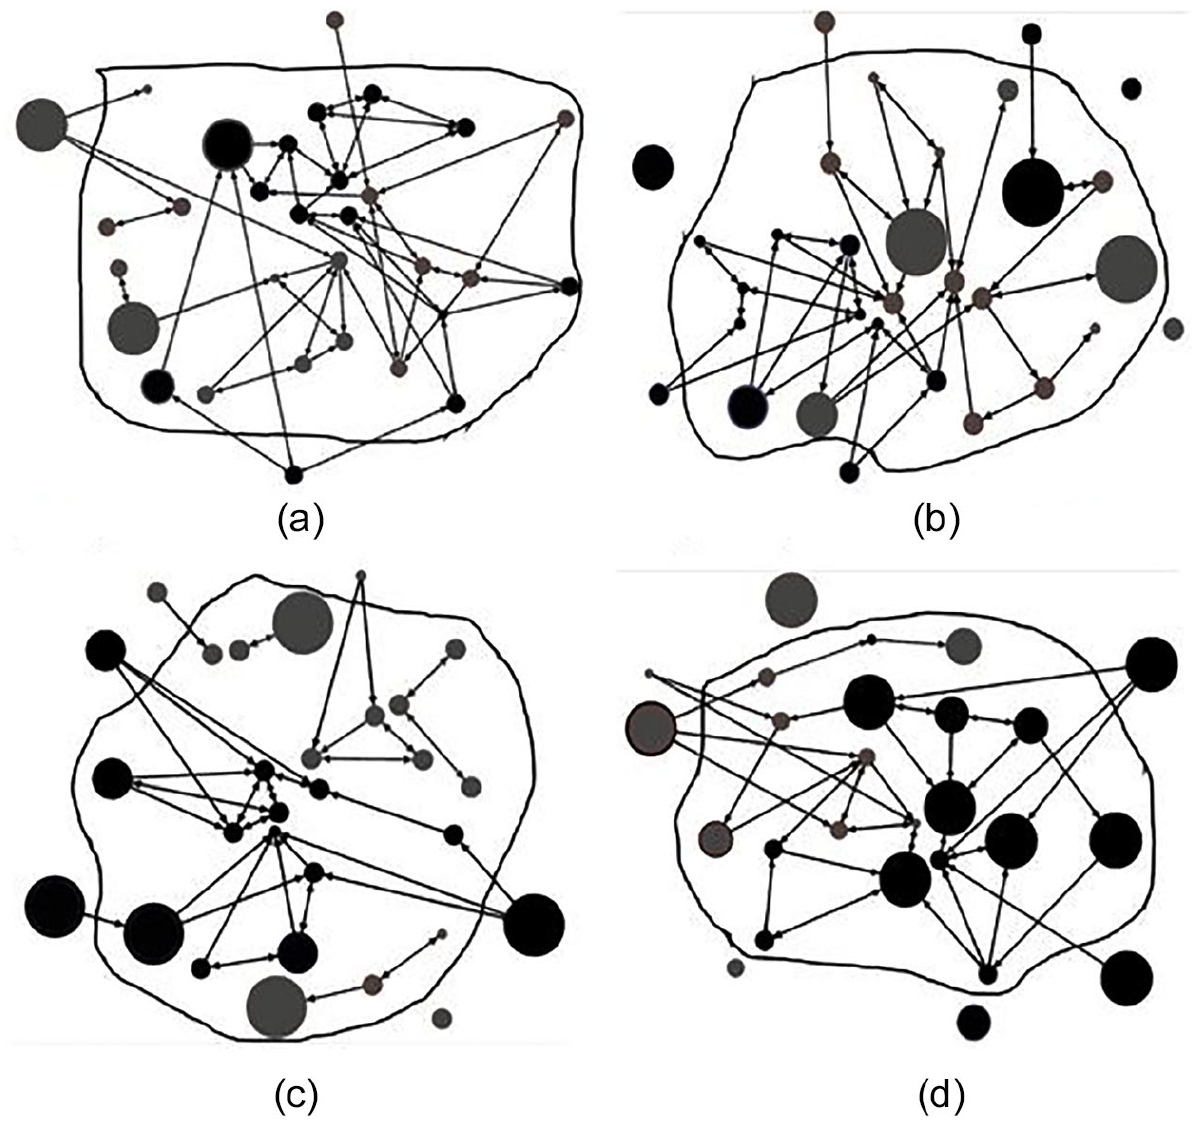
Social acceptance network map for classes: (a) prevalence of overweight and obesity = 9.68%, n = 31; OO = 1/4 (25.00%), NU = 2/27 (7.41%); (b) prevalence of overweight and obesity = 19.35%, n = 31; OO = 1/6 (16.67%), NU = 6/25 (24.00%); (c) prevalence of overweight and obesity = 27.59%, n = 29; OO = 3/8 (37.50%), NU = 2/21 (9.52%); and (d) prevalence of overweight and obesity = 53.85%, n = 26; OO = 5/14 (35.71%), NU = 1/12 (8.33%).
Discussion
Consistent with the literature (Farhat, 2015; Strauss & Pollack, 2003; Zeller et al., 2008), this study discovered that obese adolescents experience lower social acceptance than normal-weight adolescents do. Our findings also corroborate the view of Apolloni et al. (2011) that obese adolescents experience social isolation. Little was previously known regarding the association between adolescents’ weight status change and sociometric status. To our knowledge, this study is the first to demonstrate that sociometric status is jeopardized when an adolescent becomes obese compared with adolescents who maintain a normal weight.
Another noteworthy finding of this study is the continuous association between obesity status and sociometric status across the years of junior high school. In most Taiwanese junior high schools, students in the same class attend all activities and courses together from the seventh to the ninth grade. The students remain with their classmates for more than 8 hours a day. Because classmates have the opportunity to learn about each other better over time, obese students should be able to develop social ties with classmates despite the potential stigma associated with obesity. However, the results of this study indicate that obese adolescents are continually marginalized among their classmates, even in a class with a high percentage of overweight or obese students.
Two possible reasons may explain the negative association between obesity and sociometric status. First, body image is a crucial factor in the formation of relationships, especially in adolescence. Adolescents who become obese tend to be considered physically unattractive (Ehlert, Marston, Fontana, & Waldron, 2015; Zeller et al., 2008). Weight stigmatization and discrimination (Hand et al., 2017; Puhl & Heuer, 2010), weight-based teasing, and bullying (Ehlert et al., 2015; Janssen, Craig, Boyce, & Pickett, 2004) are common among adolescents. Therefore, adolescents are less likely to make friends with their peers who are obese or becoming obese. Second, studies have indicated that obese adolescents are less physically active than their normal-weight counterparts are (Trost, Kerr, Ward, & Pate, 2001). A lack of physical activity in obese adolescents may decrease their opportunities to socialize with other students and become marginalized (Smith, 2003).
However, this study did discover that some obese adolescents were accepted in their classrooms (Figure 1). Gifford-Smith and Brownell (2003) noted that adolescents’ social acceptance is positively correlated with their school adjustment and achievement. Obese adolescents who are accepted by their class may display high levels of social competence and high academic achievement in class. The extent to which high social competence and academic achievement may moderate the negative effect of obesity on relationship formation during adolescence requires further examination.
This study used gender as a control variable and found that girls were more likely to receive lower acceptance and higher isolation than boys were. Previous studies did find that boys and girls are different in terms of sociometric status as well as overweight/obese risks (Fradkin, Valentini, Nobre, & dos Santos, 2018; Mjaavatn, Frostad, & Pijl, 2016). How gender could interact with the weight status as well as sociometric status would be an important issue for future study.
Implications for Mental Health
This study demonstrated that obesity is negatively associated with adolescents’ sociometric status. We also discovered that among 69 adolescents who became obese from the eighth to the ninth grade, 62 (89.8%) had been overweight in the eighth grade. For adolescents who are obese or become obese, a gradual decrease in social acceptance may be an indicator of impaired peer relationships, which may reduce the adolescents’ self-esteem and increase the severity of depressive symptoms (Eisenberg et al., 2006; Strauss & Pollack, 2003; Zeller et al., 2008).
In addition, overweight/obese status and social isolation may co-occur as part of mental health problems, such as depression (Pereira-Miranda, Costa, Queiroz, Pereira-Santos, & Santana, 2017). People who experience depression may show symptoms such as overweight/obese as well as social withdrawal. It is possible that adolescent who experienced mental health issues also showed both changes in weight status and social acceptance. Moreover, this study used like-most nominations from peers, but not social rejection (i.e., like-least nominations). In other words, those overweight/obese adolescents were only less liked, not disliked. Future study may focus on the change of social acceptance for adolescents with overweight and obesity.
Weight management programs may not be a sufficient solution for the relationship-related challenges faced by adolescents with obesity. Researchers revealed that adolescents’ BMI and physical activity levels were associated with those of their social acceptance (Simpkins, Schaefer, Price, & Vest, 2013). Having a group of overweight adolescents in the same program may not be an efficient method of weight control. Instead, a relationship-based intervention focusing on connecting with others and forming stable relationships may be a more effective method for building new relationships or maintaining old relationships in peer groups to implement long-term solutions (Crooks, Chiodo, Zwarych, Hughes, & Wolfe, 2013). A weight management group focusing on social acceptance networks might be more effective at changing the behaviors of adolescents (Shin et al., 2014).
Limitations
We discovered that junior high school students who became obese were more likely to have low social acceptance than that of who do not become obese and even be socially isolated among their peers. However, no evidence has been obtained regarding the causal relationship between obesity and sociometric status in adolescence. Quasiexperimental studies may be a future direction for examination of the link between obesity and sociometric status.
Conclusion
This study discovered that obesity is negatively associated with the development of students’ relationships at school, which are crucial in adolescence (Smetana, Campione-Barr, & Metzger, 2006). We found that sociometric status was jeopardized when an adolescent’s weight status changed from nonobese to obese, especially for overweight students who became obese. Moreover, even after interacting with other classmates for a year or being in a class with a high percentage of overweight or obese students, obese adolescents consistently experienced low social acceptance and were isolated from their classmates. Future efforts should be directed to identifying high-risk students who are obese or becoming obese and provide them with an appropriate intervention.
Footnotes
Acknowledgements
Data analyzed in this article were collected by the research project “Taiwan Youth Project” sponsored by the Academia Sinica (AS-93-TP-C01). This research project was carried out by Institute of Sociology, Academia Sinica, and directed by Dr. Chin-Chun Yi. The Center for Survey Research of Academia Sinica is responsible for the data distribution. The authors appreciate the assistance in providing data by the institutes aforementioned. The views expressed herein are the authors’ own.
Declaration of Conflicting Interests
The author(s) declared no potential conflicts of interest with respect to the research, authorship, and/or publication of this article.
Funding
The author(s) disclosed receipt of the following financial support for the research, authorship and/or publication of this article: This project was partially funded by the Ministry of Science and Technology (107-2410-H-040-002-, 102-2410-H-002 -073 -MY3 ) in Taiwan. This work was also supported by the Innovation and Policy Center for Population Health and Sustainable Environment (Population Health Research Center, PHRC), College of Public Health, National Taiwan University from The Featured Areas Research Center Program within the framework of the Higher Education Sprout Project by the Ministry of Education in Taiwan (grant number NTU-107L9003). No additional external funding was received for this study.