
Abstract
The latter 20th and beginning of the 21st century have ushered in new forms of governance, opening the gates to what has been variously described as a “new public service,” a “multisectored public service,” and a “state of agents.” As government authority is dispersed, we increasingly rely on these new public servants for service delivery and policy implementation. But who are now the agents of the state? How might the changed makeup of a new public service alter our expectations about democratic governance? The questions we investigate in this study are, first, now that the public sector has been transformed, what are the characteristics of the agents of the new governance? And are the new public servants, in the words of Charles Goodsell, “ordinary people”? We use the General Social Survey to shed light on our focal question. Our results suggest that public servants in for-profit settings resemble traditional civil servants in many ways. The growing ranks of social, health, and education public servants in nonprofit settings are distinct in many ways from civil servants and for-profit public servants. Implications of the changing composition of the public sector in an era of transformed governance are discussed.
The notion that government bureaucrats are “significant” people in democracy has long been an important theme in public administration. In 1945, Paul Appleby (1945), following 12 years of federal service, affectionately dedicated his book, Big Democracy, to “scores of thousands of able civil servants performing their duties with high devotion to the interest of a public almost unaware of them” (p. iv). More than 20 years later, Frederick Mosher (1968) bemoaned the control of federal bureaucracies by professionals, but simultaneously acknowledged the stability and reliability professionalization brought to the messy business of the public’s work. In multiple editions of his polemic, The Case for Bureaucracy, Charles Goodsell (1983) argued that our democracy was safe because bureaucrats were simply “ordinary people” rather than the obstructionist functionaries Americans had come to know and despise.
Bureaucrats, in the words of Frederick Mosher, “for better or worse—or better and worse” (1968, p. 142), may no longer be as dominant as they once were. Why? Because many of them have been replaced, privatized, or networked as part of the new governance, the movement to augment direct government by a variety of indirect methods for public action (Salamon, 2002). In The New Public Service, Paul Light (1999a), mapping career changes in MPAs from highly ranked programs, describes the new governance’s consequences for the modern “new public service.” The most prominent of these consequences is that public service is no longer government based, but instead distributed across three sectors—government, nonprofits, and for-profits.
This article revisits prior research about bureaucrats to frame an empirical analysis of the new public servants. Our focal question paraphrases one posed originally by Charles Goodsell: Are the new public servants ordinary people, too? We begin with a brief review of prior research. We then present comparative data drawn from the General Social Survey, a nationally representative survey conducted since 1972. We conclude with a discussion of the implications of our findings for the composition of public service as the new governance grows and what difference the changes might make for democratic governance.
Representative Bureaucracy, Bureau Information Monopoly, and Bureau Voting Model
Several streams of research in public administration bear on the questions we investigate in this study. We place them into three categories: representative bureaucracy; bureau information monopoly; and bureau voting model. This review seeks to articulate major arguments from each of these streams of research and highlight findings from empirical research based on the three streams.
Representative Bureaucracy
Research on representative bureaucracy is the longest standing of the three research streams, first introduced by Kingsley (1944) and further developed by Krislov (1974) and Meier (1975). Krislov (1974) captured the two senses in which we conceive of bureaucracies as representative. The first is the extent to which the composition and methods of selecting members for public service mirror—that is, represent—the larger population. The second sense in which bureaucracies can be conceived as representative is the extent to which substantive outputs are in accord with public opinion. The argument embraced by much of the literature is that if bureaucrats are passively or actively representative, then administrators will be responsive and responsible to the interests of the public.
An especially well known analysis of representative bureaucracy is Goodsell’s (1983) The Case for Bureaucracy. 1 Goodsell (1983) analyzed bureaucrats from several different vantage points and concluded they are quite ordinary people. First, the number of bureaucrats may seem vast, but their work is as varied as the diverse society and economy in which they find themselves situated. A second generalization about bureaucrats with which Goodsell took issue is that their surroundings transform them into petty tyrants, individuals overcome by a bureaucratic mentality. After reviewing the extant literature, Goodsell concluded that research generally disconfirms rather than supports the stereotypes of a bureaucratic mentality. A third widely held belief that Goodsell tried to tackle is bureaucrats suffer personal harm from working in large hierarchical organizations. He finds that bureaucrats are neither more alienated nor powerless than nonbureaucrats. Government bureaucrats were also upbeat about their work, expressing positive affect about rewards they receive from their work. Goodsell notes that satisfaction with pay is an exception, but it does not spill over into satisfaction with other job facets.
In an analysis linked directly to Goodsell’s arguments in The Case for Bureaucracy, Gregory Lewis (1990) sought to answer several questions about differences between bureaucrats and ordinary people using data from the General Social Survey, a nationally representative sample. One of his questions was “Are bureaucrats more likely to favor expanding government?” Lewis found that government employees were no more likely than the rest of the population to favor increasing government spending. Lewis also inquired, “Are bureaucrats less committed to traditional values?” On indicators of religiosity, attitudes about sex and sex roles, and race relations, bureaucrats were again remarkably similar to other citizens. Lewis characterized bureaucrats as “secular humanists” by virtue of their similarities to the general population with regard to religious beliefs and practices, but their greater acceptance of scientific progress. The third question Lewis investigated was whether bureaucrats led stunted emotional lives due to their subjugation in hierarchical organizations. Lewis resoundingly rejects the “oppressed-bureaucrat thesis.” Overall, Lewis concluded that bureaucrats are quite ordinary people, just as Goodsell had argued.
Bureau Information Monopoly
Two lines of research related to the “bureaucrat as ordinary person” thesis are the “bureau information monopoly” (Niskanen, 1971) and the “bureau voting model” (Garand, Parkhurst, & Seoud, 1991). The former line of research has been more visible than the latter, having been popularized by economist William Niskanen’s characterization of government employees as self-interested budget maximizers. These budget maximizers use their information advantages to steer their principals,that is, Congress and the President, to increase their budgets. Niskanen’s model has been criticized as overly broad because few bureaus have information monopolies (Conybeare, 1984). Support for the information monopoly model using indirect tests has been mixed (Blaise & Dion, 1991; Miller & Moe, 1983; Sigelman, 1986).
Bureau Voting Model
Using the National Election Studies (NES) for 1982, 1984, and 1986), Garand et al. (1991) found support for the bureau voting model. The bureau voting model posits that (a) bureaucrats are more supportive of government spending than nonbureaucrats, (b) bureaucrats are more likely to vote than nonbureaucrats, and (c) bureaucrats are more likely to exercise their votes for candidates supportive of greater government spending. Their analysis of NES data supported each of the premises of the bureau voting model. Garand et al.’s findings contrast with Lewis’s (1990) conclusion that government employees are no more inclined than other citizens to favor increased government spending.
Data and Method
Previous research focused primarily on whether government bureaucrats were different from private employees. The governance transformation that has created a multisector public service (Light, 1999a) leads us to reframe the analysis. We create six categories of employees using Standard Industrial Classification codes of the General Social Survey (GSS; Smith, Marsden, Hout, & Kim, 2009), which permits finer grain analysis than previous studies. A second strategy is to control covariates, such as education, family income, political ideology, gender, and race, using econometric methods. Given systematic differences in covariates among groups, these methods may produce more accurate results than simple descriptive statistics and t tests or one-way ANOVA used previously by Goodsell (1983) and Lewis (1990).
Government Bureaucrats and New Public Servants
Goodsell (1983), Lewis (1990), and Frank and Lewis (2004) contrast government employees (traditional public servants) with private counterparts in the rest of the economy. Wittmer (1991) compared government, private, and hybrid sector managers, but did not identify his classification scheme. More recently, Houston, Freeman, and Feldman (2008) separate public servants into governmental and nongovernmental public servants. The new public servants we denote here are similar to these nongovernmental public servants but we extend the distinction made be Houston et al. (2008).
We construct a typology of occupational classes by segmenting service types (i.e., public and nonpublic services) and service providers (i.e., government, for-profit, and nonprofit) using the 1980 Standard Industrial Classification (SIC), a U.S. coding system for classifying industries (Figure 1). There are theoretical and practical reasons for using SIC for classification instead of two questions: if a respondent is employed by government and if he or she is working for a private company, nonprofit organization, or government. Given various forms of organizations along the public–private continuum (Perry & Rainey, 1988), it is not easy to distinguish among government, nonprofit, and for-profit organizations clearly in terms of ownership, funding structure, mode of social control, and other dimensions. Even employees in organizations oftentimes get confused and thus fail to identify the type of their employers correctly. Due to inconsistency in responses and many missing values, both questions may not properly be used for classification. 2 This classification has advantages over the dichotomous approach because it better reflects the diversity of public services in the new governance. In turn, it also has disadvantages that service industries and provision sectors may be confounded; this problem is likely in social/health services where nonprofits and for-profits compete with each other.
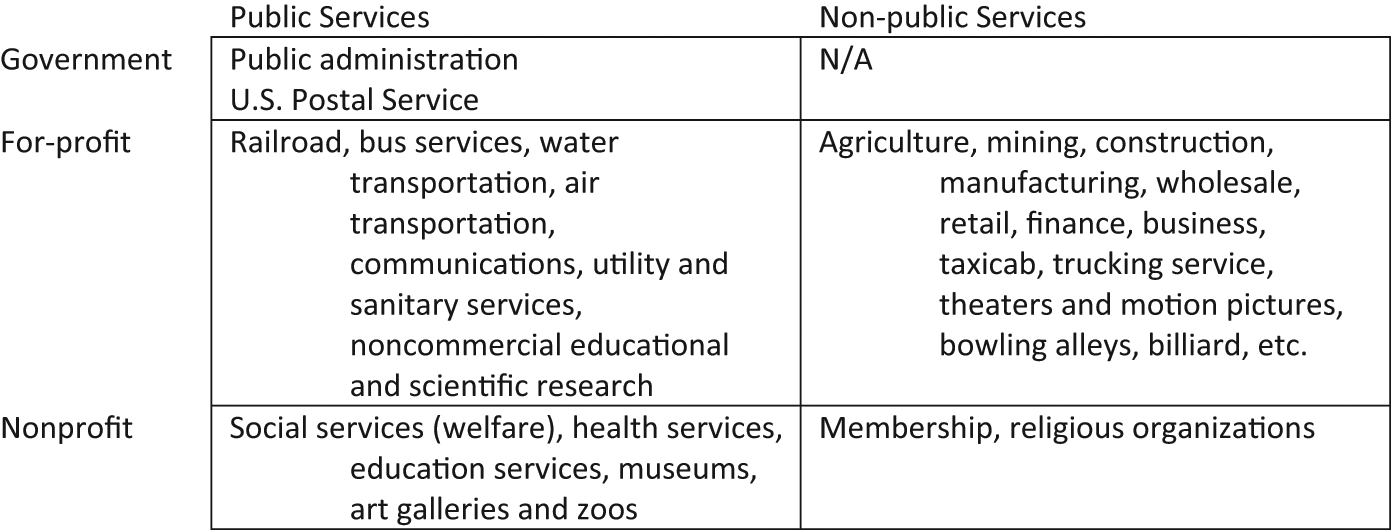
Typology of occupational classes
We define public services as those that are vital for human health, safety, and welfare, while nonpublic services are those that involve discretionary individual consumption. Services in the former categories produce public goods, common-pool resources (e.g., water), and club goods (e.g., highway and cable TV), while the latter are private goods, which relatively easily exclude consumers who have not paid. Public services thus include not only conventional government services but also transportation, utilities, communication, welfare, health, and education, which may be provided by for-profit and nonprofit organizations. 3 Agriculture, mining, construction, manufacturing, wholesale, finance, and trucking are examples of nonpublic services industries.
Government employees, including U.S. Postal Service workers, provide public services in a classic sense. 4 Many nonprofit organizations are involved in providing such public services as social services, health services, education services, and museums/art galleries/zoos. 5 Neither government nor commercial companies produce sufficient goods and services in these areas (e.g., government and market failures), while nonprofit organizations have advantages (e.g., less legal and political constraints, voluntarism, and religious belief) over government and market and can “carve out special niches for themselves” (Smith & Gronbjerg, 2006, pp. 223-225). Nonprofit organizations occupy relatively large portions in these service industries, 6 but they have competed with for-profit counterparts to some extent in recent decades because boundaries of nonprofit and for-profit sectors in these services are not fixed but rather blurring and changing.
Since education workers in elementary/secondary schools, colleges, and universities are relatively homogeneous in terms of socioeconomic status and constitute a large segment of nonprofit employment, we group them separately from other nonprofit public service employees (social and health services) in the analysis. We exclude some professional health and social services such as physicians’ practices and legal services from this nonprofit public service category because they are dominated by commercial for-profit organizations. Nonprofit employees provide not only public but also nonpublic services. Membership and religious organizations tend to pursue individual and mutual benefits rather than public interests. 7 These nonprofit nonpublic services, though included in the model, are not of primary interest in this study.
In the for-profit sector, we differentiate traditional commercial industries from public services such as public transportation, communication, utilities, sanitary services, and noncommercial educational and scientific research. 8 Some of these services were once provided exclusively by government, but are increasingly provided privately through contracting-out and partnerships between government and the private (i.e., nonprofit and for-profit) sector. Frank and Lewis (2004) and Houston et al. (2008) also classified these workers as public servants or nongovernmental public servants. The traditional commercial sector—classified here as for-profit nonpublic services, includes agriculture, mining, construction, manufacturing, wholesale, taxicab, trucking, finance, theaters and motion pictures, and other industries.
The general trends in the tools of collective action and, in turn, the distribution of public service employment across the government, nonprofit, and commercial (for-profit) sectors has been documented by scholars such as Lester Salamon (2002) dating to the 1970s. As Paul Light (1999b) contends in The True Size of Government, getting an accurate picture of whether the size of government “has expanded or contracted depends almost entirely on how one sorts the dates and the data” (p. 2). In Table 1, we use the GSS, a nationally representative sample, to calculate proxies for employment in each of the areas we include in our typology. The table reports employment trends in the GSS for a period from 1977 to 2008, which is significantly longer than the 2000-2008 period that is the primary focus of our analysis. The distribution of employment across the sectors is relatively stable for the 2000-2008 period. Over the course of the longer 1977-2008 period, several trends are observable. The most stark is the decline in government employment, which coincides with Light’s (1999b) estimate that total federal employment declined by nearly 900,000 jobs between 1984 and 1996. The portions of the workforce engaged in social/health and education occupations also increased between 1977 and 2008. For-profit public service employment, which begins with a low base relative to other categories in 1977, is, at best, only incrementally higher in 2008.
Trends in the Distributions of Employees by Groups (Percent)
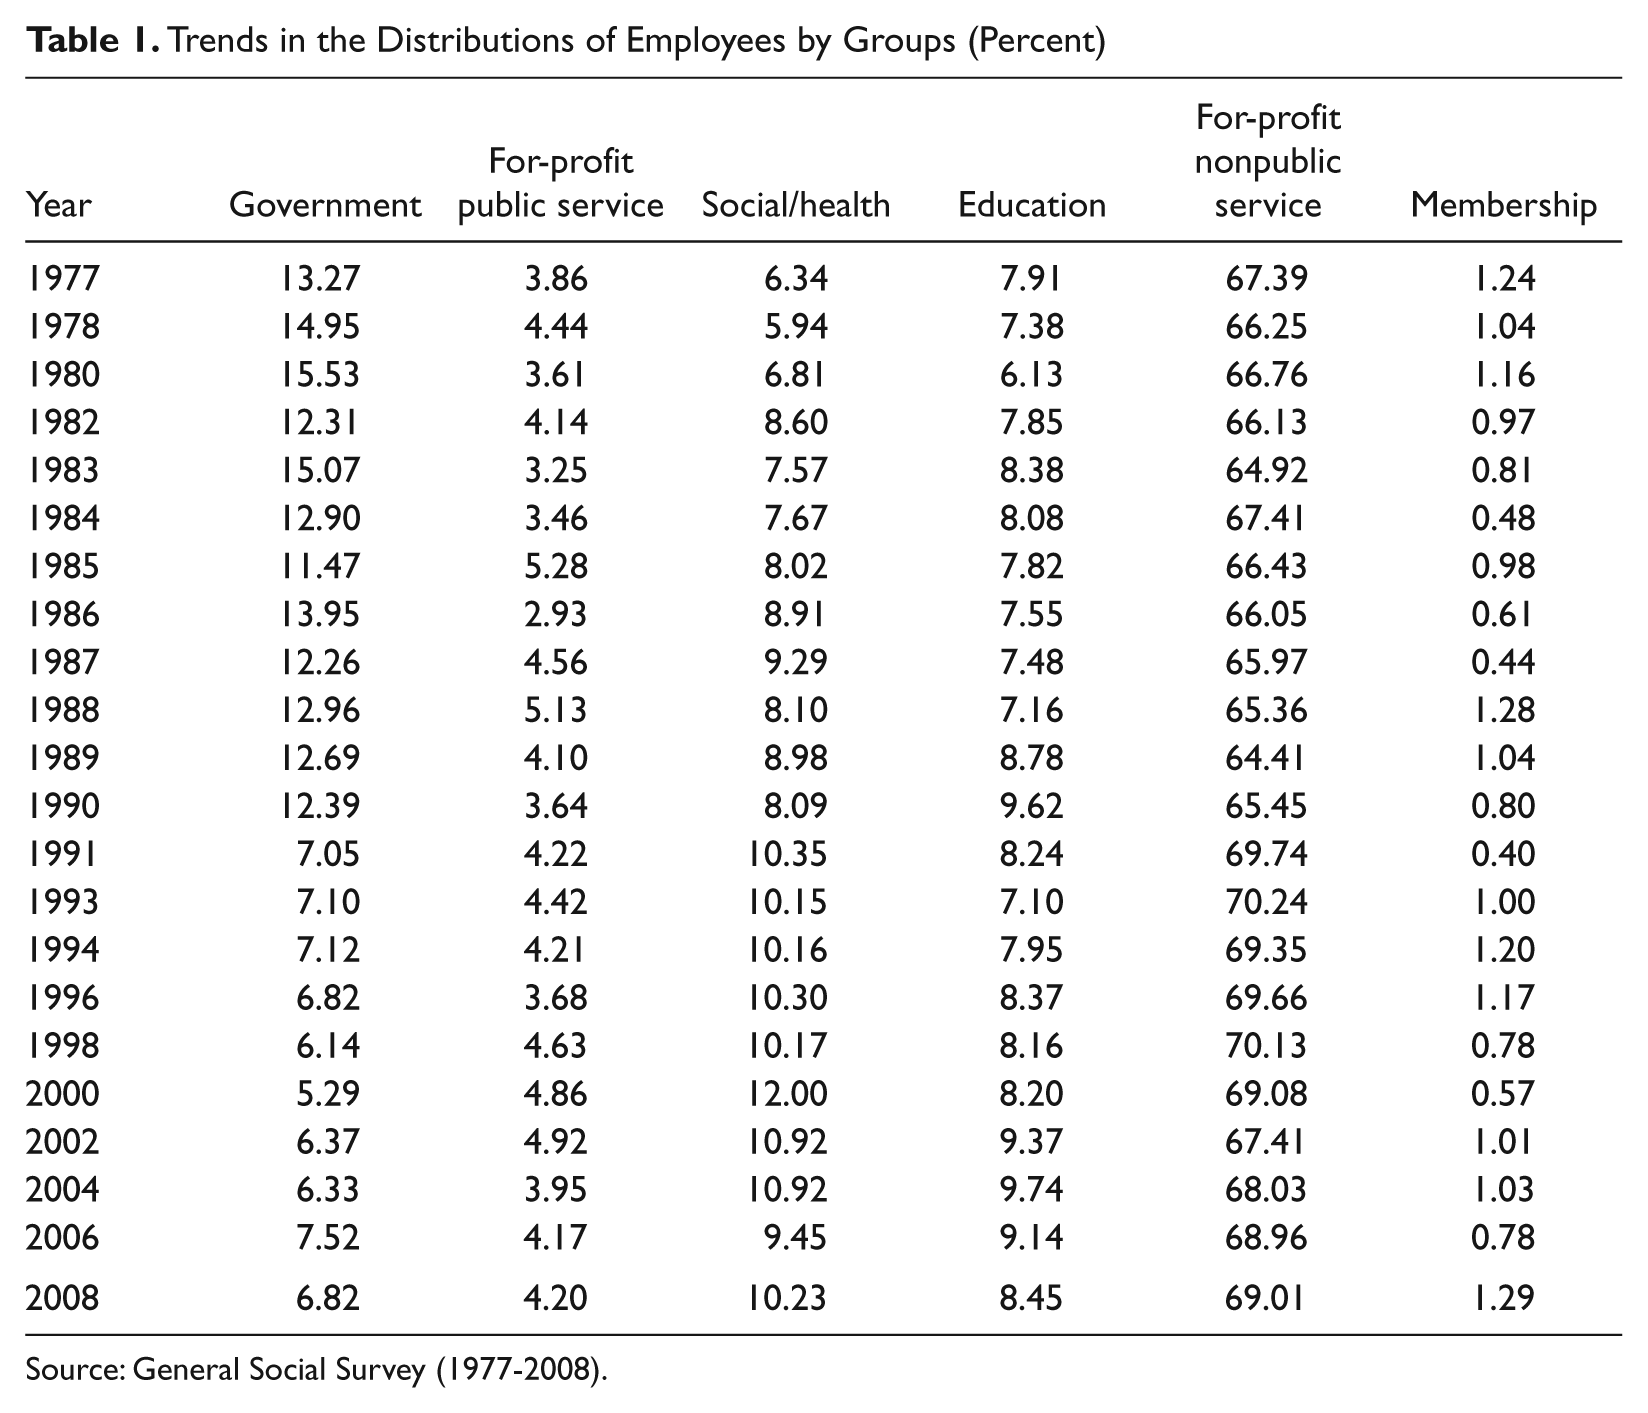
Source: General Social Survey (1977-2008).
Dependent Variables
We looked at five broad categories of questions from the GSS (2000-2008) to inquire how categories of new public servants identified above differ from government bureaucrats and private for-profit employees. The categories of questions included
preferences about government spending;
confidence in institutions;
voting for Republicans and party orientation;
job-related reward preferences; and
social capital-related attitudes—helpfulness, fairness, trust, empathy, and altruism.
We expect that dependent variables such as preferences for government spending and job-related rewards (Houston, 2000; Rainey, 1982), confidence in institutions, and social capital-related attitudes (Houston, 2006) will differ systematically across categories as a consequence of selection and screening processes at work in labor markets. Streams of research on attraction-selection-attrition and socialization support the predictions (Knoke & Wright-Isak, 1982; Perry, Hondeghem, & Wise, 2010; Wright & Grant, 2010). Houston’s (2000, 2006) research using the GSS found that public and private employees differed with regard to both reward preferences and social capital, supporting the plausibility of our hypotheses.
Independent Variables
We created six dummy variables for six groups, that is, government, for-profit public and nonpublic services, education, other nonprofit public services (social and health), and membership and religious organizations, on the basis of the typology we developed. When conducting the analyses, for-profit nonpublic services employees and government bureaucrats were used as baseline reference groups, although we report only statistical significance of analyses employing for-profit nonpublic service employees as a reference group, to examine how respondents in the other categories differ from the two baseline groups. Socioeconomic covariates included are education, political ideology, family income, prestige of jobs, marital status (married), the number of children under age 18, age, gender (male), race (African American), and hierarchical status (manager). Four time dummy variables for 2000, 2002, 2006, and 2008 were added to capture fixed time effects; year 2004 is the baseline.
Table 2 reveals differences across the groups with respect to several key demographics. Government bureaucrats and other public servants are more educated than for-profit nonpublic service (or private for-profit) employees, who are the least educated among groups with an average of 13 years. Government employees are more educated than for-profit public service workers, but less educated than education employees. Similarly, government and nonprofit public service employees are more likely to think their jobs are prestigious than their for-profit counterparts. In particular, education employees report the highest occupational prestige score of 55.6, significantly higher than government bureaucrats’ 49.3. Nonprofit public servants are more ideologically liberal than both government and for-profit workers. Government bureaucrats and the other groups of public servants, except for social and health services, are similar in family income and age, but are higher in income and older than private for-profit and social and health employees. More than half of government and for-profit public servants are male, while female employees dominate in nonprofit public services. The proportions of male workers in these sectors substantially deviated from the balanced proportion in private for-profit services. Government and other public service groups, except for education, employ more African Americans than for-profit nonpublic service organizations. In particular, African Americans represent 23% of employees in the social and health services, much higher than the national average. Government employees and for-profit public servants are similar on most covariates except for education and occupation prestige.
Descriptive Statistics of Covariates (Mean, Standard Deviation)
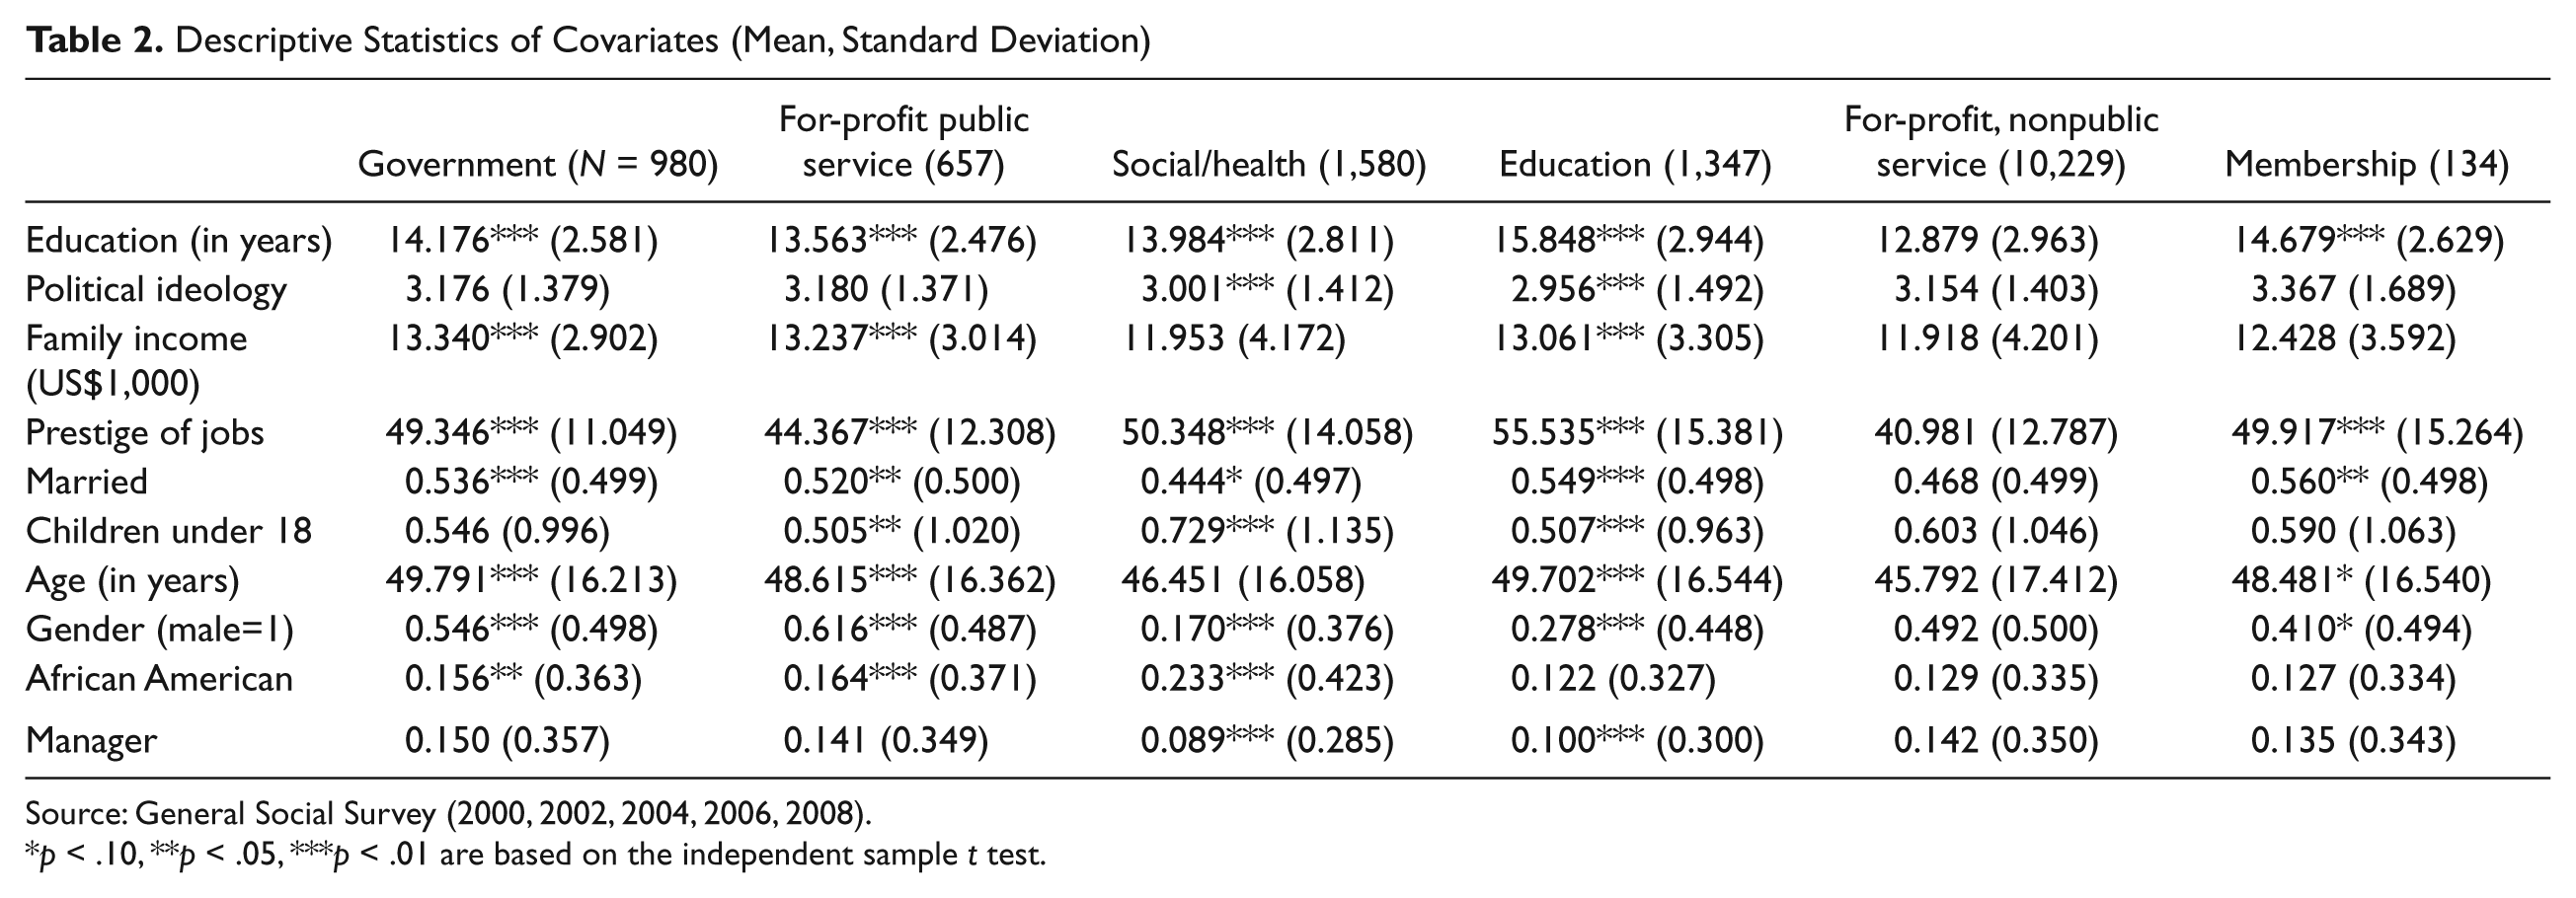
Source: General Social Survey (2000, 2002, 2004, 2006, 2008).
p < .10, **p < .05, ***p < .01 are based on the independent sample t test.
Statistical Analysis
We employed the ordinary least squares (OLS), binary logit model, and independent sample t test depending on types of dependent variables. 9 Government spending preferences and confidence in institutions, for example, are estimated using the binary logit model. Time dummy variables were incorporated in models to examine fixed time effects. Analysis results are summarized in Table 4 through 8, where means, standard deviations in parentheses, and statistical significances of corresponding group dummy coefficients are reported. For simplicity, tables include only statistical significance of analyses that employ for-profit, nonpublic services employees as the reference group. In the binary logit model, marginal effects and discrete changes are computed by means of continuous variables and zero for binary variables.
Results
We present results starting with survey items associated with the bureau information monopoly (Niskanen, 1971) and bureau voting models (Garand et al., 1991). These results encompass preferences about government spending preferences, confidence in institutions, and voting for Republicans. We next turn to respondents’ views about job-related attitudes, particularly reward preferences. The final evidence we explore across the categories involves social capital including empathy and altruism.
Table 3 shows that nonprofit public service employees are more supportive of spending on improving conditions of Blacks, more satisfied with their jobs, and more empathic than government and for-profit counterparts. Government bureaucrats are more likely to vote for Republicans than for-profit, nonpublic service employees. The group dummy coefficients show how government and other public servants differ from for-profit, nonpublic services employees, the baseline group. For instance, OLS suggests that nonprofit public service employees are .04 in the 0 to 1 scale, more satisfied with their jobs and .11 and .12 more empathic than the reference group at the .01 and .05 significance levels, respectively. Four time dummy coefficients represent fixed time effects; voting for Republicans appears to be significantly higher after September 11, 2001 and then declines in 2006.
Examples of Analyses: Binary Logit Model and Ordinary Least Squares
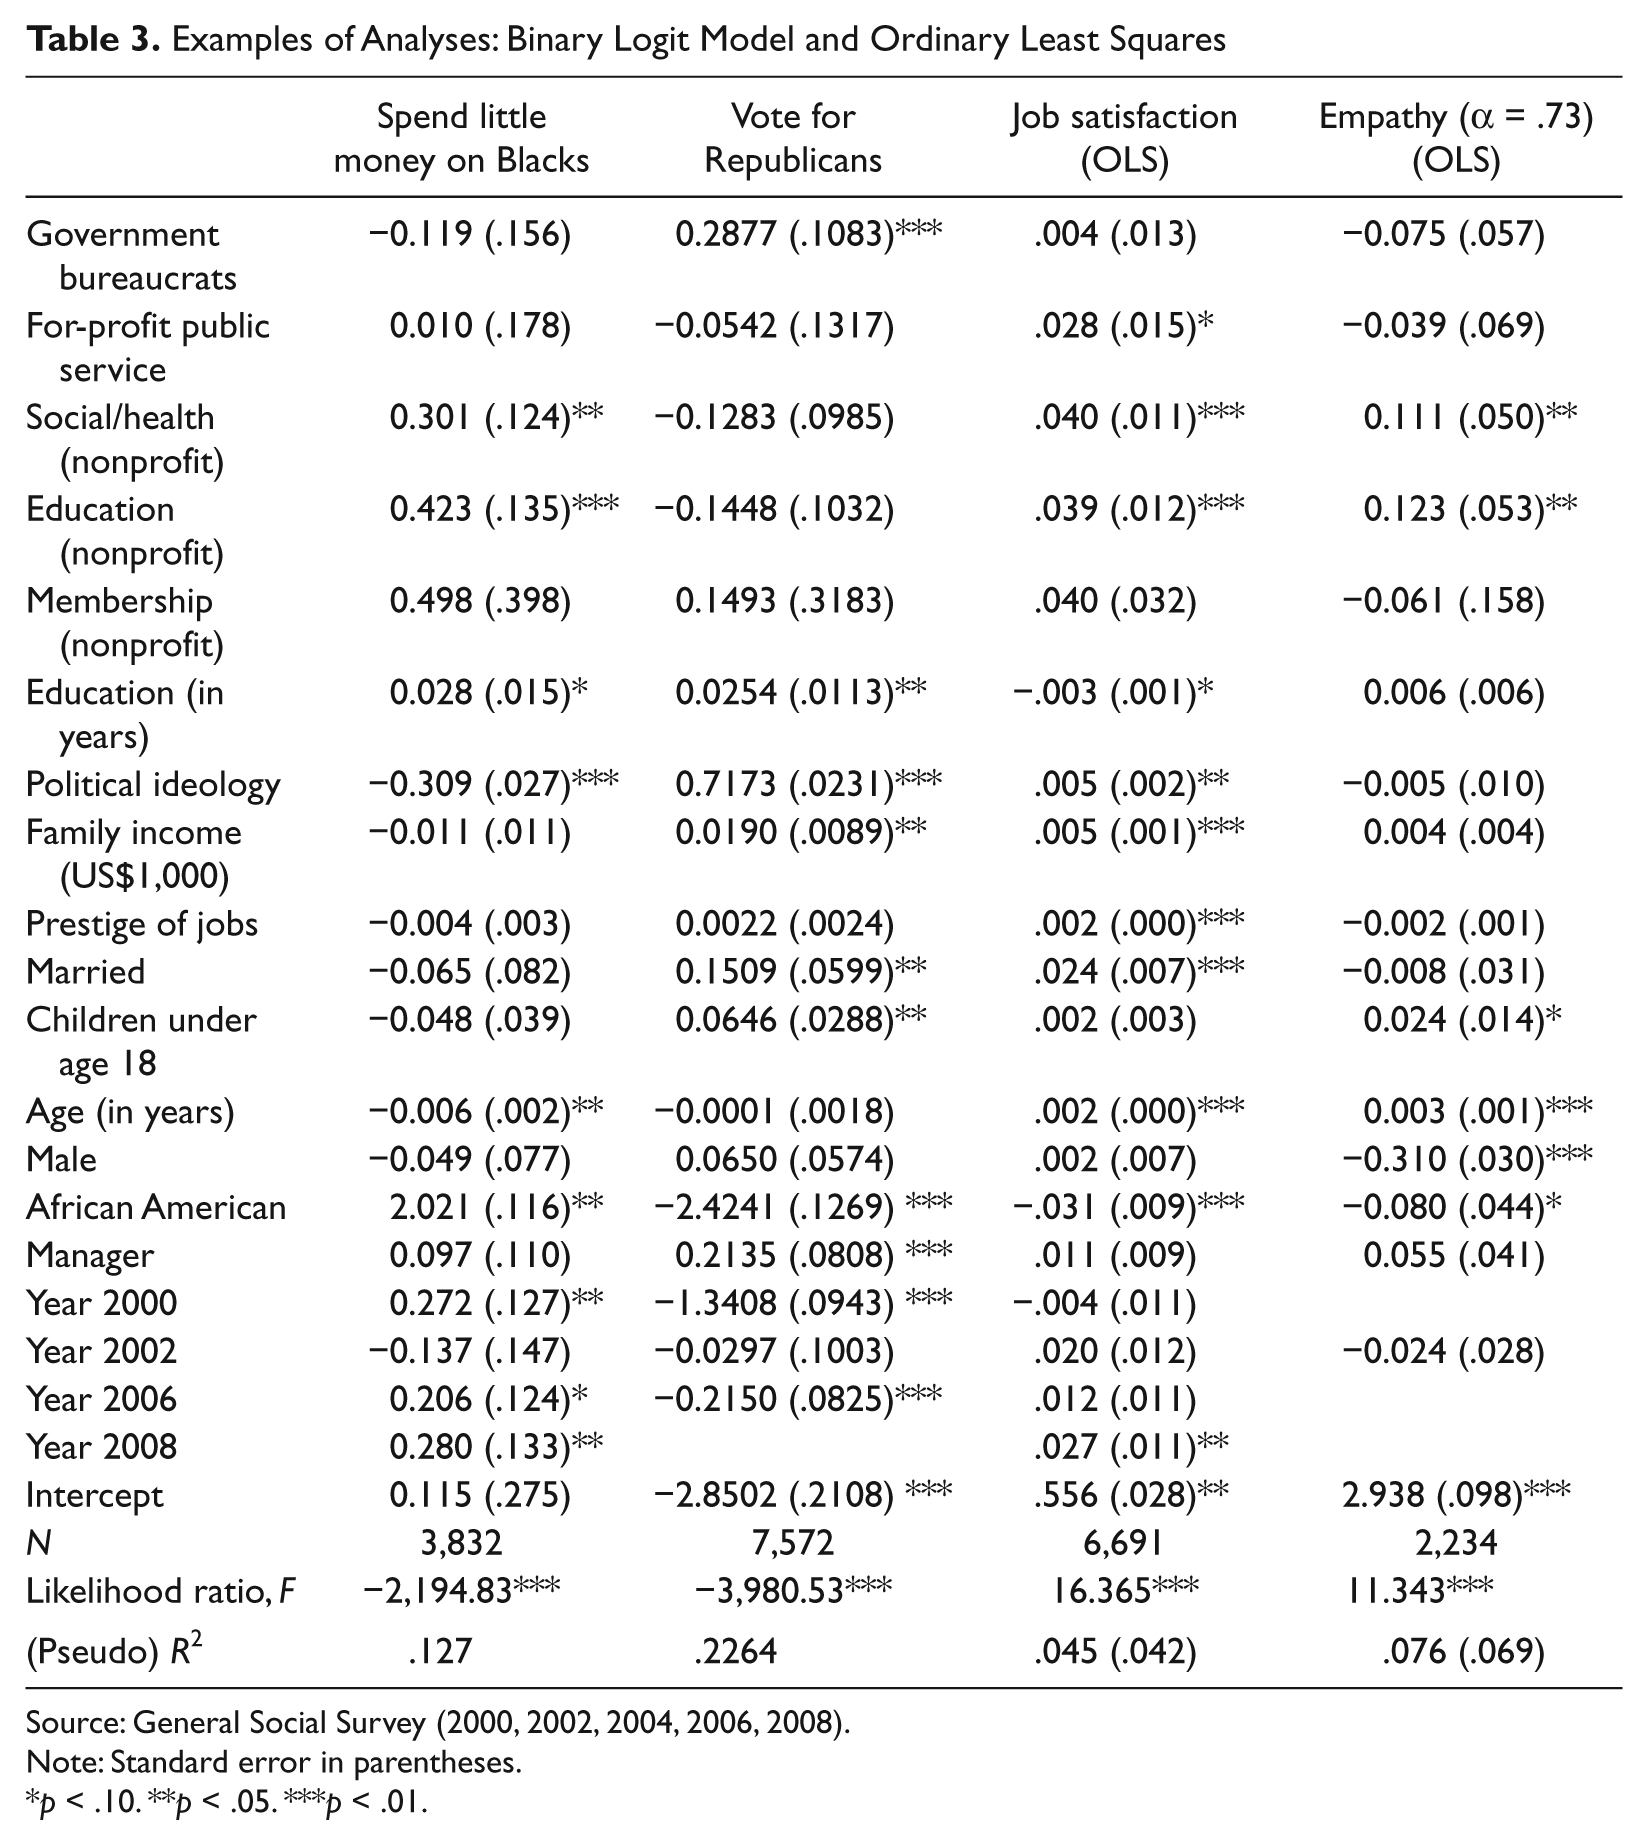
Source: General Social Survey (2000, 2002, 2004, 2006, 2008).
Note: Standard error in parentheses.
p < .10. **p < .05. ***p < .01.
Government Spending Preferences
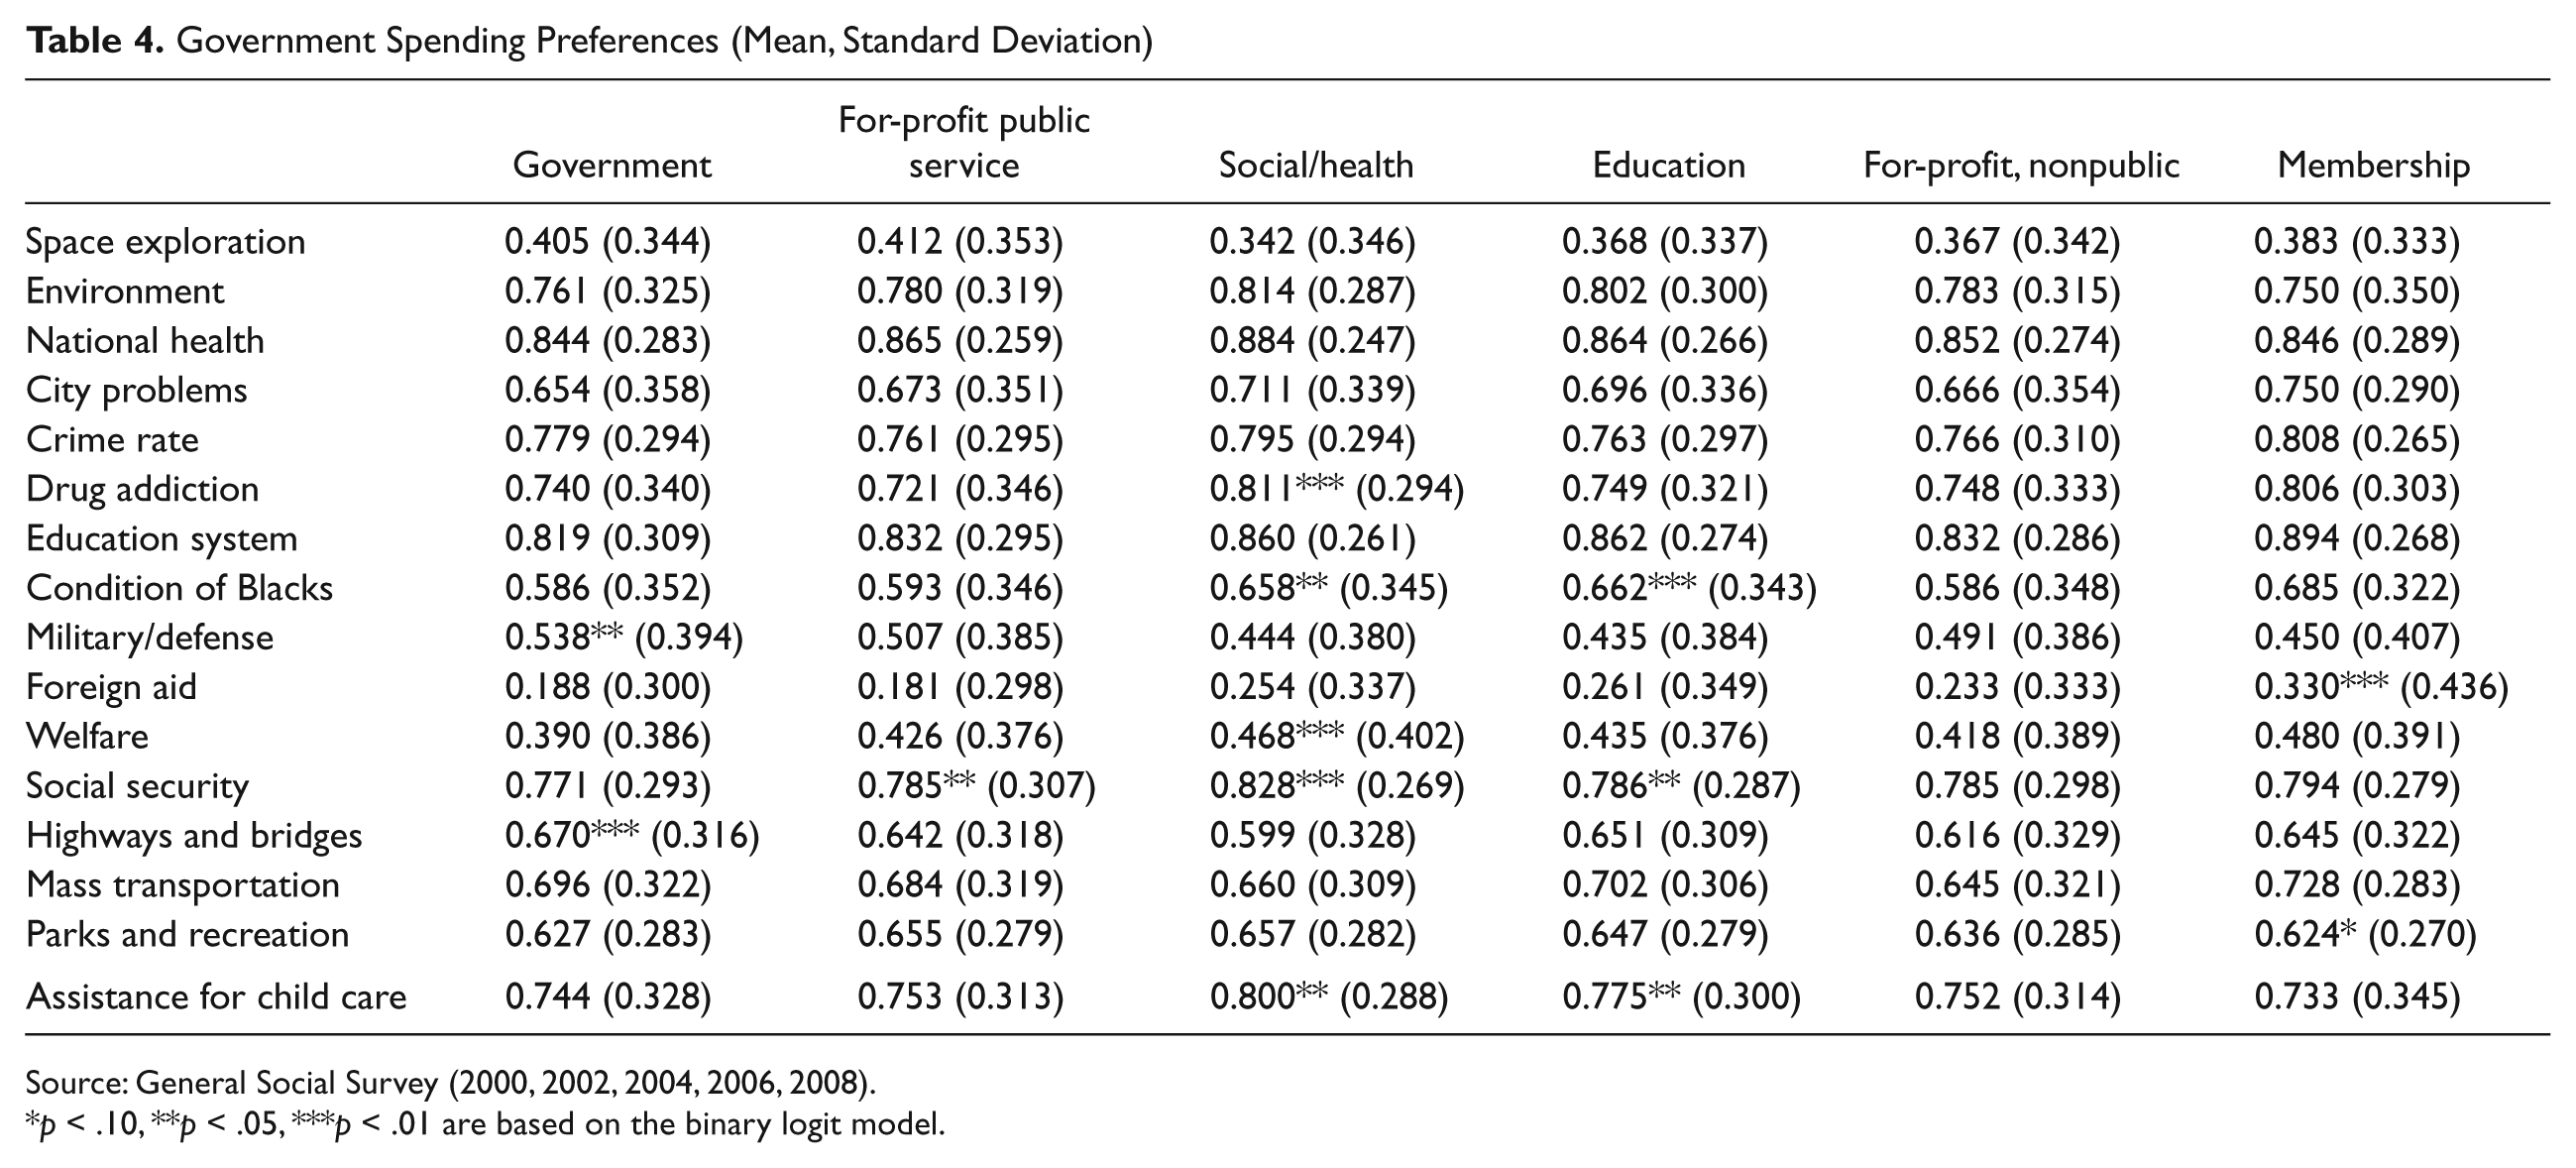
Table 4 suggests that for-profit public servants share opinions similar to government bureaucrats and for-profit, nonpublic services employees with respect to government spending preferences. Nonprofit public servants in social, health, and education services share similar preferences with a couple of exceptions. Nonprofit public service employees are more supportive of spending for improving conditions of Blacks than government bureaucrats and for-profit, nonpublic services employees (Tables 3 and 4). Their means are respectively .658 (social and health services) and .662 (education), which are greater than government’s .586 and for-profit sector’s .593 and .586. 10 The binary logit model suggests that these nonprofit employees are 6% to 9% more likely than for-profit, nonpublic service employees and 8% to 11% more likely than government civil servants to think that government spends little money on improving conditions of Black, holding other independent variables constant at the reference points. However, nonprofit public servants are 10% to 12% less supportive of spending on military, armaments, and defense than government bureaucrats, but do not significantly differ from for-profit, nonpublic service workers. In particular, employees in social and health services are more likely than government and private for-profit employees to think that government spends too little money on drug addiction issue, welfare, social security, and assistance for child care. Government employees are more likely than other groups to support government spending on highways and bridges. There are no significant differences in government spending for space exploration, improving and protecting the environment and health, solving the problems of big cities, halting the rising crime rate, improving education systems, foreign aid, mass transportation, and parks and recreation across groups when controlling covariates. Therefore, government bureaucrats do not appear to have expansive preferences to maximize budgets and spending. If any group represents budget maximizers, it appears to be public servants in the nonprofit sector. Finally, government bureaucrats and for-profit public service employees share similar preferences as a whole.
Government Spending Preferences (Mean, Standard Deviation)
Source: General Social Survey (2000, 2002, 2004, 2006, 2008).
p < .10, **p < .05, ***p < .01 are based on the binary logit model.
Some covariates significantly affect spending preferences. Liberals favor government spending on space exploration programs, environmental protection, national health, city problems, drug addiction, education, conditions of Blacks, foreign aid, social welfare, social security, mass transportation, parks and recreation, and assistance for child care. Conservatives are more supportive of spending on military, armaments, and defense. Younger people support spending on environmental protection, education, conditions of Blacks, foreign aid, social security, parks and recreation, and assistance for child care, while older citizens are more supportive of spending on dealing with drug addiction, armaments and defense, highways and bridges, and mass transportation. African Americans favor more spending on social and welfare programs (e.g., national health, city problem, crime rate, drug addiction, education, conditions of Blacks, foreign aid, welfare, social security, parks and recreation, and assistance for child care) but less on space exploration; for example, they are 13% more likely than other ethnic groups to think that government spent too little on welfare. Time dummy coefficients indicate that citizens’ concern about environment, city problem, condition of Blacks, social welfare, and mass transportation has significantly increased since 2002.
Confidence in Institutions
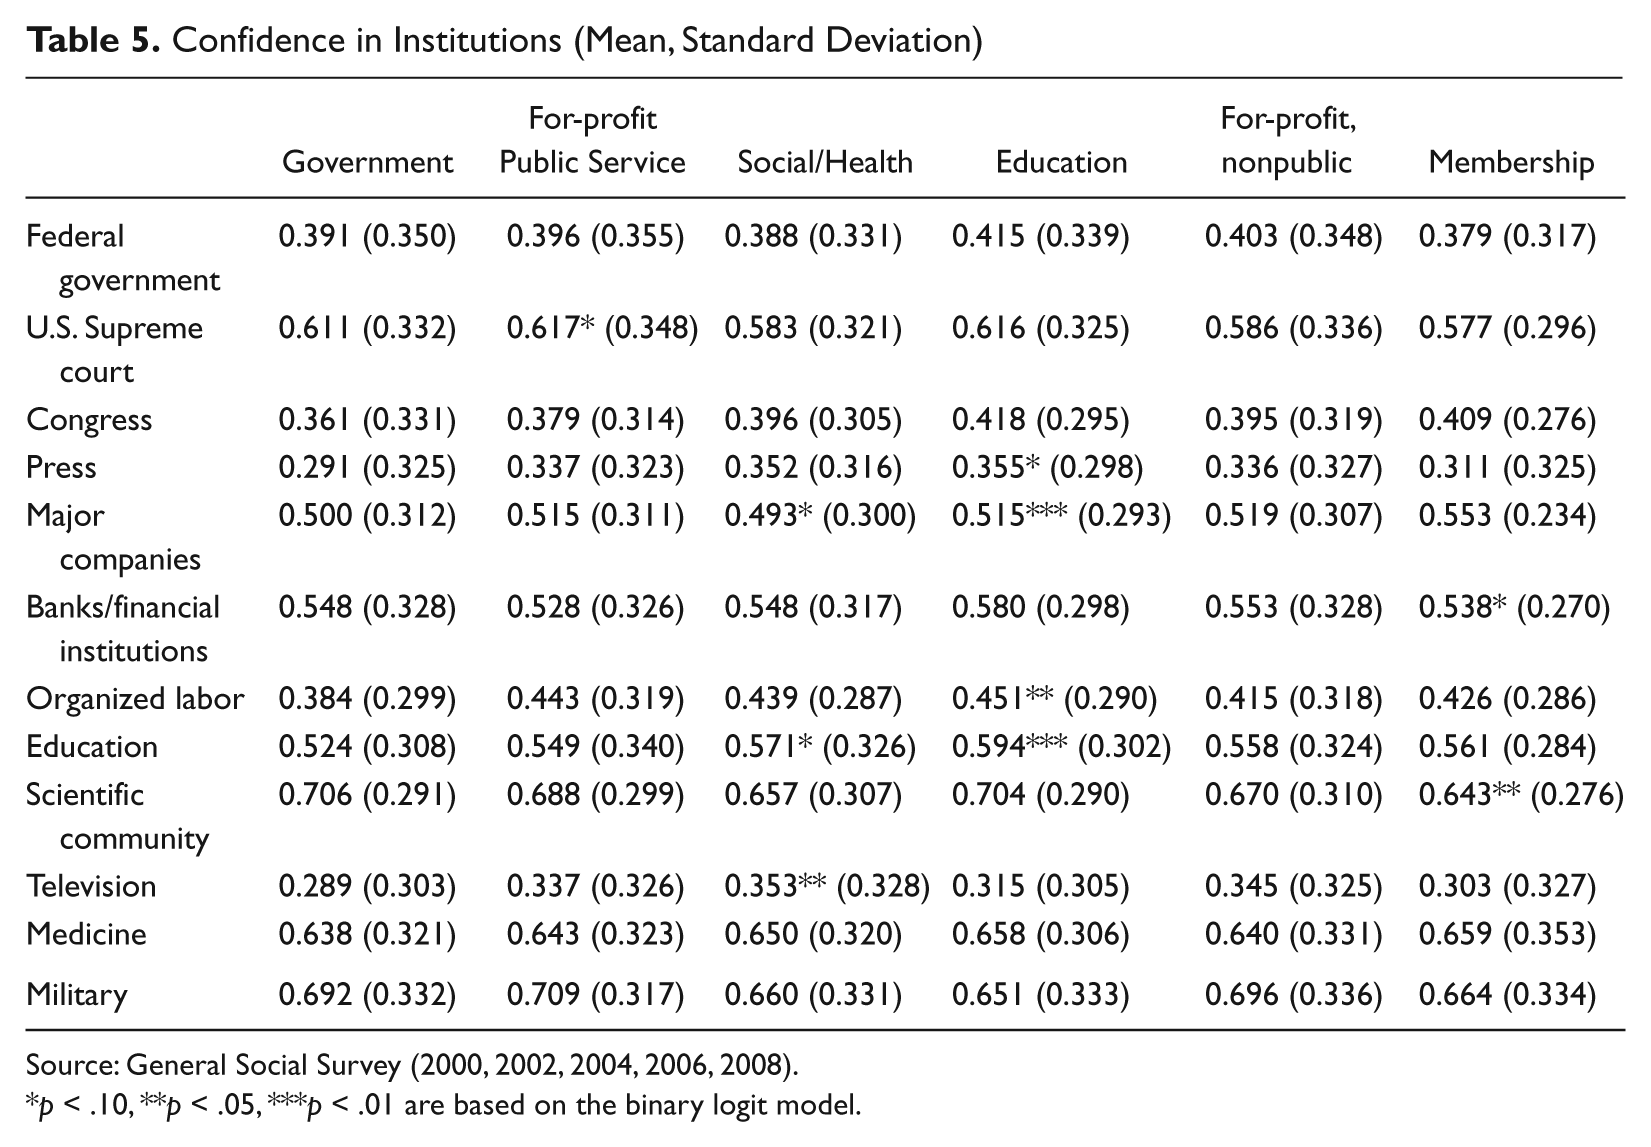
Government and private employees, as Lewis (1990, p. 224) reported, have similar levels of confidence in most institutions (Table 5). Differences in confidence in the executive branch of the federal government, U.S. Supreme Court, Congress, press, banks and financial institutions, scientific community, medicine, and military are not statistically significant across groups. Nonprofit public servants appear to have higher confidence in the press, organized labor, and television than government bureaucrats, although not statistically significant when controlling covariates, and have as much confidence in these institutions as private for-profit employees. Nonprofit public servants show, although not statistically significant, lower confidence in the military than government and for-profit employees.
Confidence in Institutions (Mean, Standard Deviation)
Source: General Social Survey (2000, 2002, 2004, 2006, 2008).
p < .10, **p < .05, ***p < .01 are based on the binary logit model.
Nonprofit public service employees have lower confidence in major companies than for-profit, nonpublic service employees, but as much confidence as government bureaucrats. Not surprisingly, education institutions receive higher confidence from nonprofit public service employees than from government and for-profit counterparts. Again, the confidence in institutions expressed by government and for-profit, public service employees was similar when controlling covariates.
Education has a positive association with confidence in the U.S. Supreme Court, major companies, scientific communities, and medicine, but it is negatively related to confidences in Congress, organized labor, education, television, and military. Liberal citizens have higher confidence in the press, organized labor, scientific community, and television, while conservatives have higher confidence in the federal government, major companies, financial institutions, and military. Older citizens and African Americans tend to have lower confidence in most institutions. The confidence in military and executive branches of the federal government in 2000, 2006, and 2008 was significantly lower than that of baseline year 2004; the higher confidence in federal government in 2002 indicates an effect of September 11, 2001.
Voting for Republicans
Bureaucrats have been depicted (Garand et al., 1991; Niskanen, 1971) as budget maximizers, implying that they might be less likely to vote for Republicans because of the party’s preference for smaller government. However, government employees are about 9% more likely than private for-profit employees to vote or would have voted for Republican candidates in the presidential elections of 2000 and 2004 and for-profit and nonprofit public servants are 10% to 13% less likely than government bureaucrats to support Republicans (Table 3).
According to a descriptive analysis, all groups except for education employees showed higher support for Republicans during the Bush Administration than during the Clinton Administration. However, the relative proportion that each category (would have) voted for Republicans was quite stable and consistent during the past two decades regardless of political regimes. 11 As Page and Shapiro (1992) argue, most categories or occupational classes change their perceptions in the same direction and about to the same extent; The “parallel publics” tend to show little difference in trends among categories (pp. 290-320). The fixed time effect model suggests that the support was higher in 2002 and 2004 than in 2000 and 2006, indicating a 9/11 shock rather than a regime effect. Since the data (1980 SIC) do not distinguish federal employees from other bureaucrats in state and municipal governments, this finding provides a much different picture than a stereotype people have developed based on the federal government workforce alone.
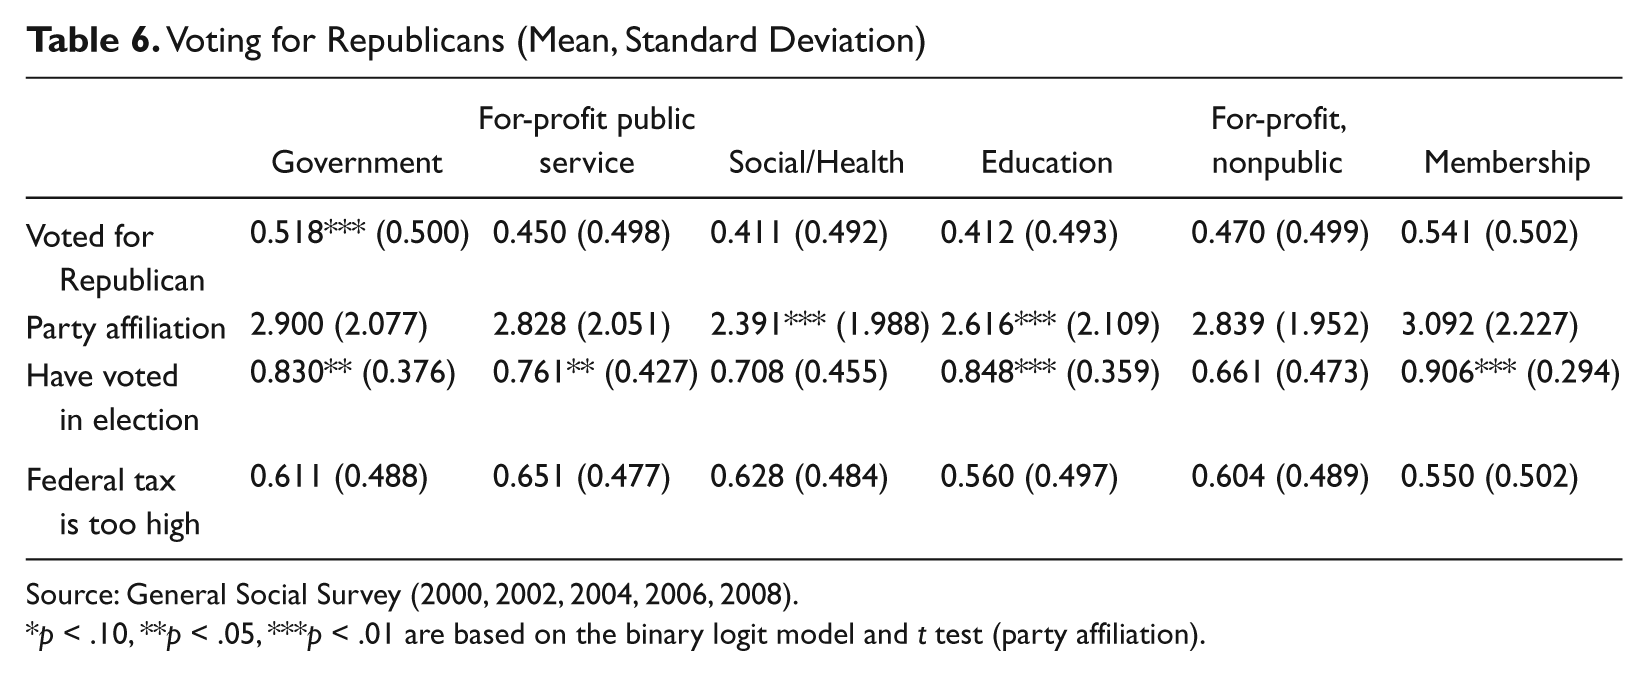
As expected, liberal and African Americans are less likely than other ethnic groups to vote for Republicans. With respect to party identification (0-6 scale), nonprofit public service employees are more likely to identify with the Democratic Party than are government bureaucrats and for-profit, nonpublic service workers. These results are contrary to predictions from the bureau information monopoly and bureau voting models. Government bureaucrats and nongovernmental public servants are more likely to vote than for-profit, nonpublic service employees. In Table 6, 83% to 85% of government bureaucrats and education employees voted, which is 7% to 14% higher rate than other categories of public servants. This finding is consistent with Garand et al. (1991) and Moe (2005).
Voting for Republicans (Mean, Standard Deviation)
Source: General Social Survey (2000, 2002, 2004, 2006, 2008).
p < .10, **p < .05, ***p < .01 are based on the binary logit model and t test (party affiliation).
Budget maximizers have expansive preferences to support taxing and spending. Government bureaucrats and other public servants do not differ from private for-profit employees in responding to the statement that the federal income tax is too high. Conservatives, African Americans, the less educated, young, and women with higher family income are more likely to think that the income tax is too high.
Job-Related Reward Preferences
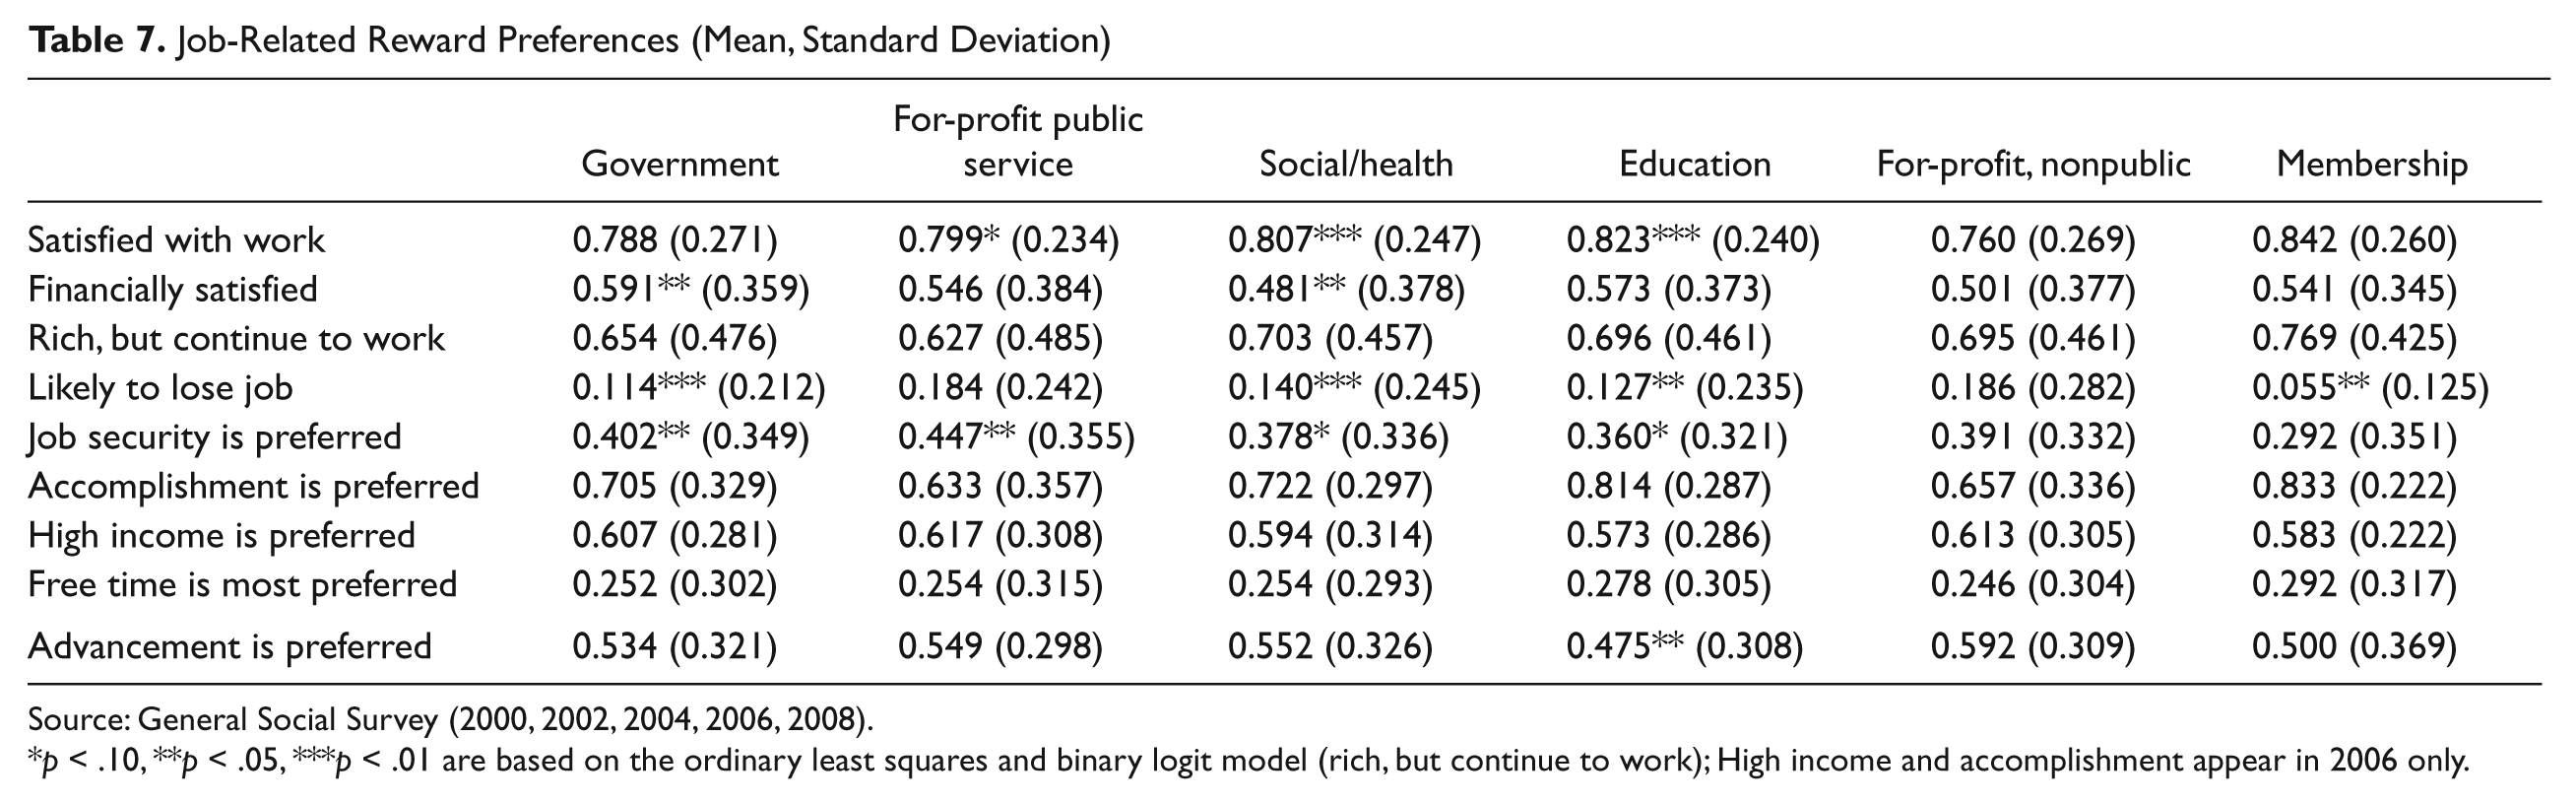
Nonprofit public servants are more satisfied with their work than their government and private for-profit counterparts, who have similar levels of job satisfaction (Table 7). Social and health service employees are .03 in the 0 to 1 scale less satisfied with their present financial situation than respondents in the for-profit, non-public service category and .07 less satisfied than government bureaucrats, who are most financially satisfied among groups. African Americans are less satisfied with their work and financial situations, while wealthy, older citizens have higher job and financial satisfaction. For-profit public servants, although not statistically significant, appear to be less willing to continue to work even if they get enough money to live comfortably than other groups. Educated and liberal men are more willing to continue to work, but wealthy older citizens are not.
Job-Related Reward Preferences (Mean, Standard Deviation)
Source: General Social Survey (2000, 2002, 2004, 2006, 2008).
p < .10, **p < .05, ***p < .01 are based on the ordinary least squares and binary logit model (rich, but continue to work); High income and accomplishment appear in 2006 only.
Employees in government and nonprofit public services including education are less likely than for-profit counterparts to think that they will lose their job or be laid off in 12 months. Nonprofit public service employees are less likely than government and for-profit public servants to prefer no danger of being fired in a job. Nonprofit public servants appear to most prefer the feeling of accomplishment and least prefer high income in a job than government and for-profit counterparts, but these differences are not statistically significant when controlling covariates. Education employees least prefer chances for advancement in a job. Nonprofit public service employees appear to be motivated more by mission and intrinsic factors like the feeling of accomplishment than other rewards; in particular, employees providing social and health services are least satisfied financially, but are more satisfied with their job and more willing to work regardless of high income and job security than government and other for-profit counterparts. Educated citizens prefer feelings of accomplishment and free time, whereas African Americans put more emphasis on high income and chances for advancement. Older Americans are more likely to prefer feelings of accomplishment in a job but less likely to put more emphasis on high income than young counterparts. Other covariates do not matter much in job preferences.
Social Capital
Nonprofit public service employees as a whole have as much social capital as government and for-profit counterparts with a couple of exceptions (Table 8). Education employees appear to be more likely than government and other private workers to think that most people are generally helpful, fair, and trusted, but do not statistically differ. Nonprofit public service employees have higher levels of empathy than government and for-profit counterparts, but do not substantially differ in altruism from private for-profit workers. Government bureaucrats are more altruistic than for-profit, nonpublic service respondents. There is no significant difference across groups in spending more social evenings with relatives, someone who lives in their neighborhood, and their friends who lives outside of the neighborhood. Nonprofit public servants appear to go to bars or taverns less frequently than private for-profit, nonpublic service employees but as frequently as government bureaucrats.
Social Capital (Mean, Standard Deviation)
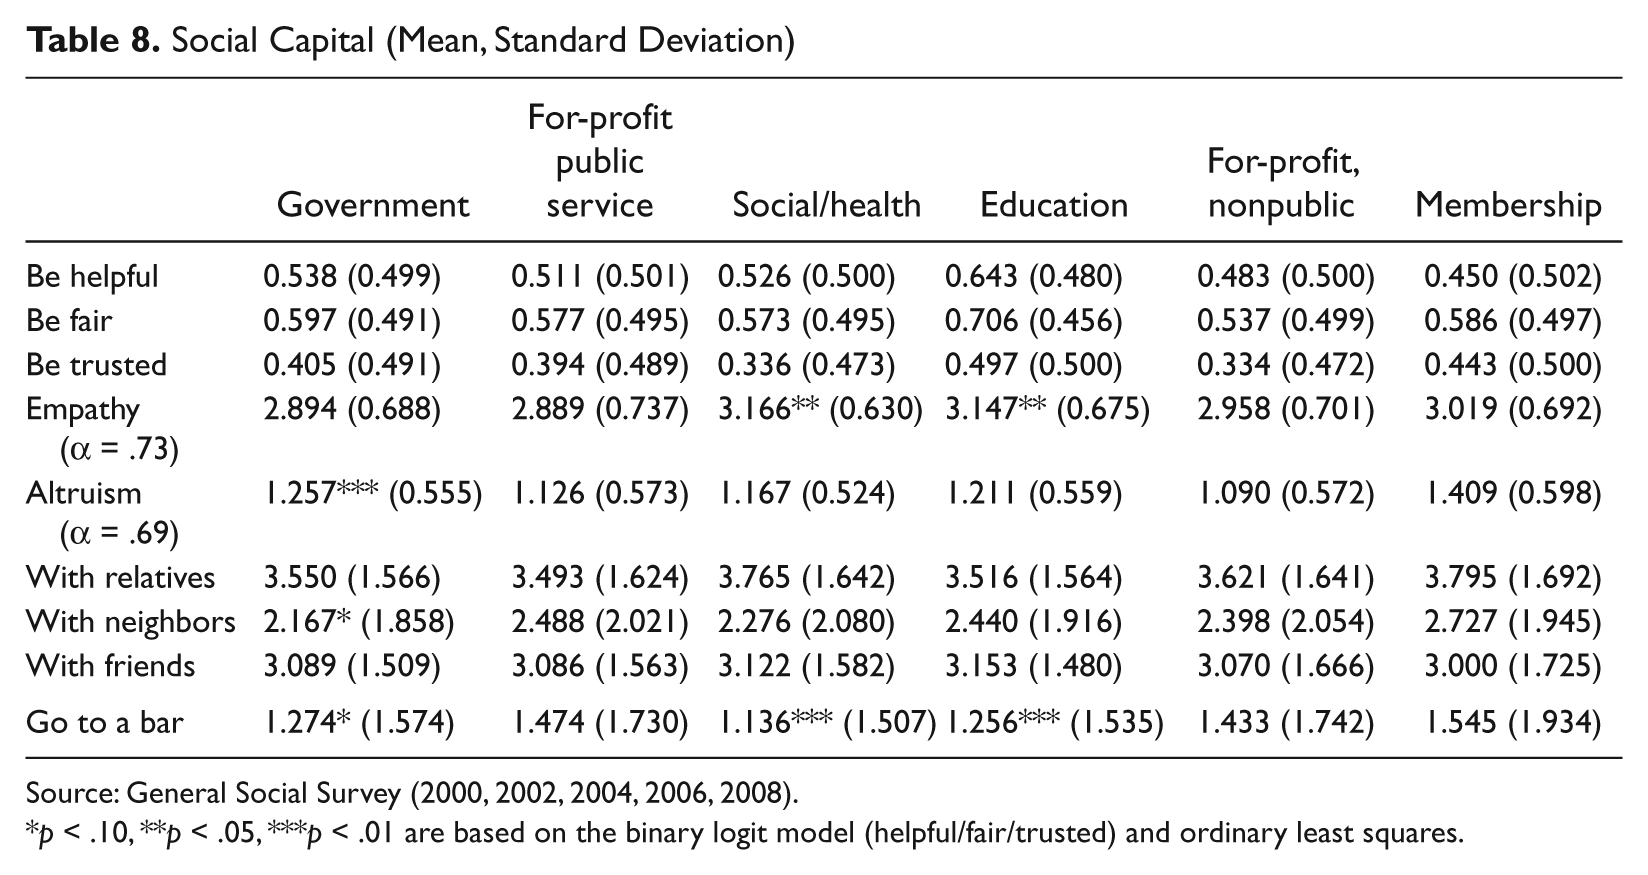
Source: General Social Survey (2000, 2002, 2004, 2006, 2008).
p < .10, **p < .05, ***p < .01 are based on the binary logit model (helpful/fair/trusted) and ordinary least squares.
Education, family income, and age are positively related to social helpfulness, fairness, trust, and empathy, while men and African Americans have lower responses on these items. Older citizens are less likely than younger generations to spend social evening. Education and family income influence spending social evening positively as a whole. Political ideology and other covariates do not matter much.
Discussion
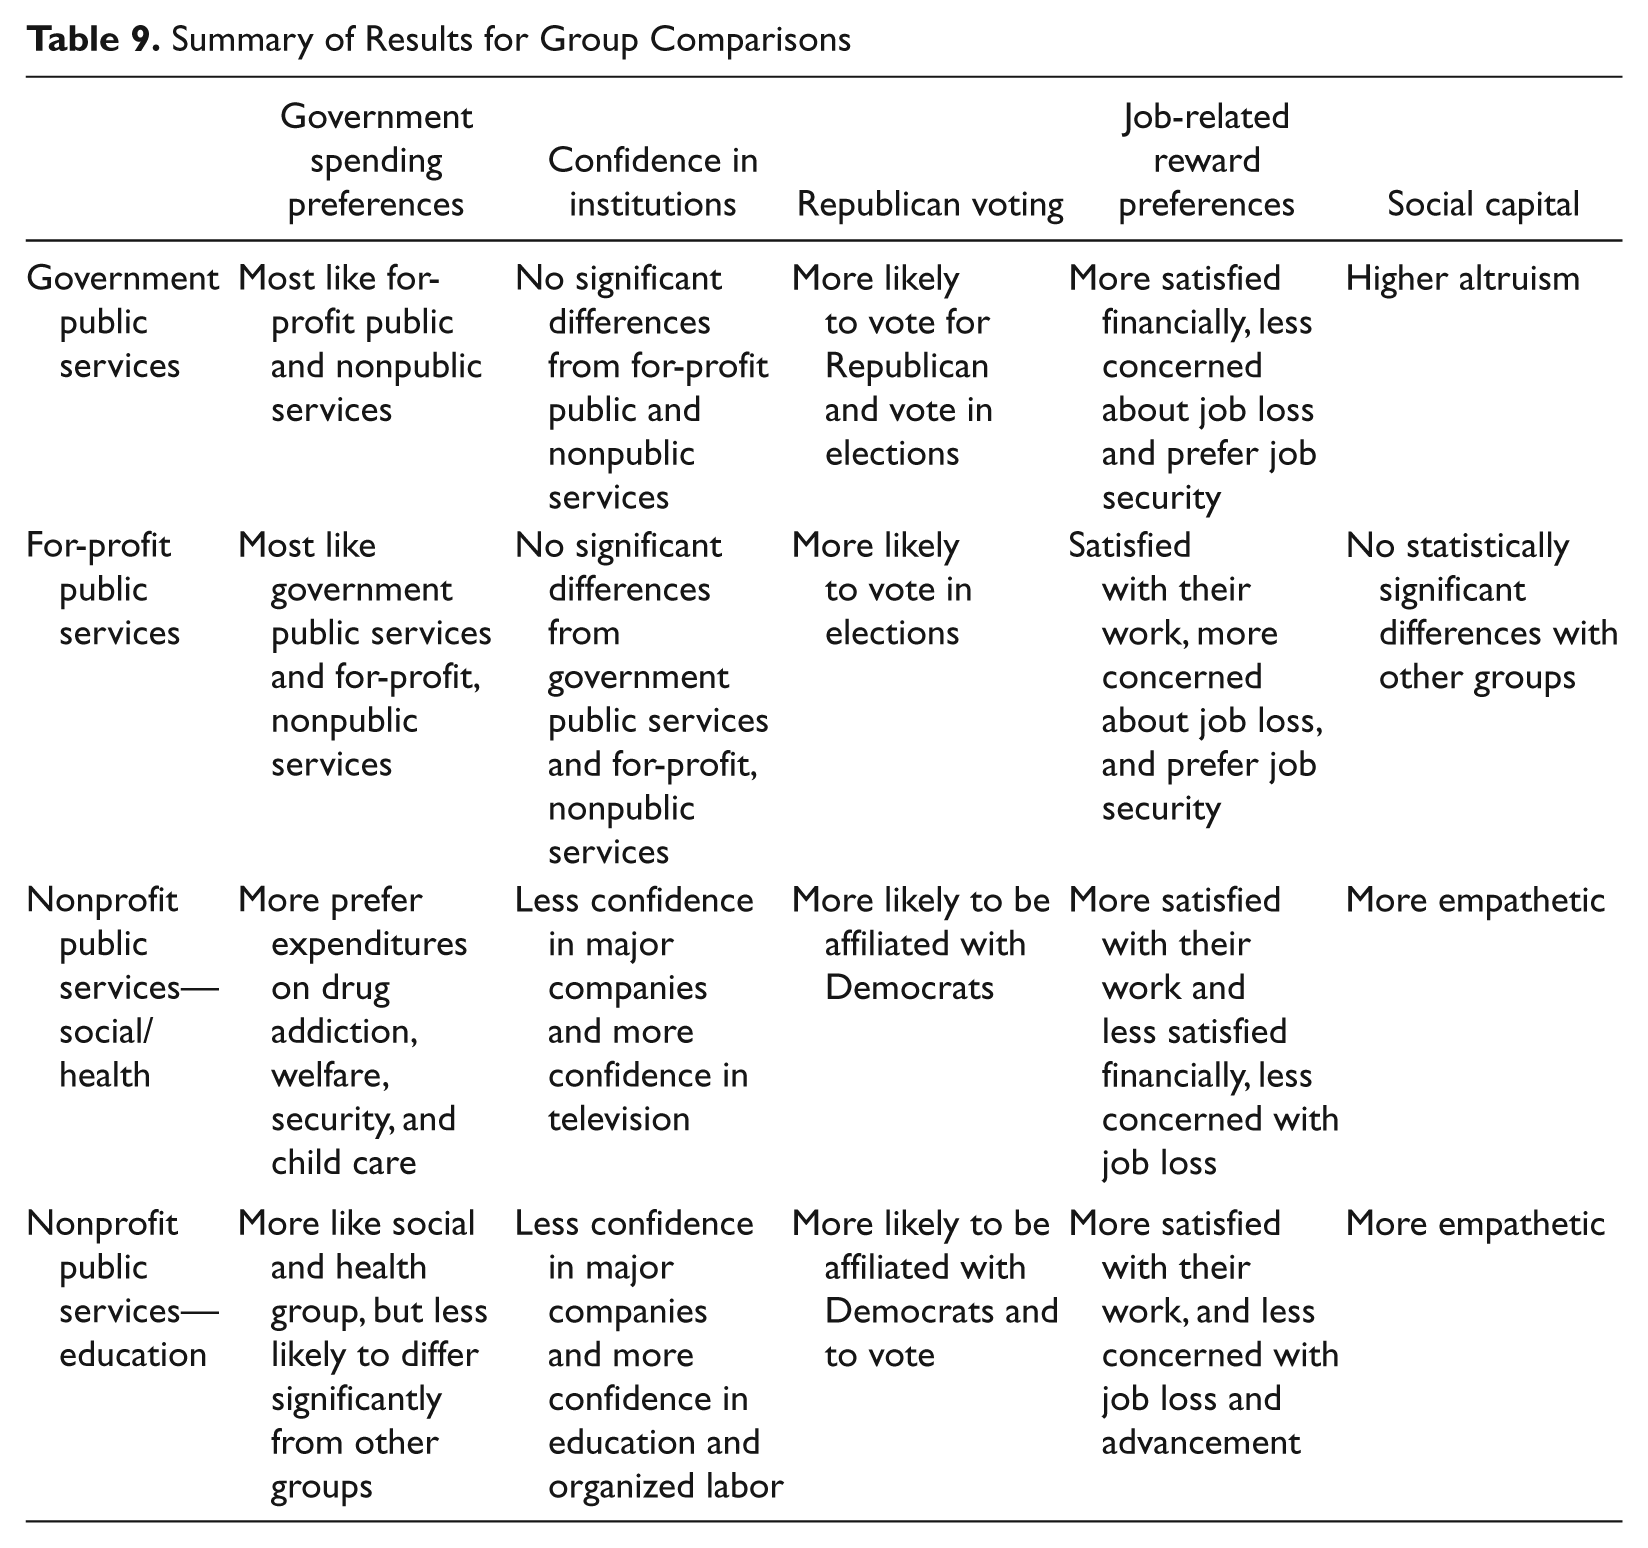
The results of our comparisons of five broad occupational classes from the General Social Survey, which are summarized in Table 9, provide insights into the representativeness of the classes and potential implications of new governance. The most surprising result is how similar government public servants were to both for-profit public servants and for-profit, nonpublic services workers. The analysis confirms that public servants associated with government and for-profit organizations are quite similar to their counterparts in commercial enterprises. The most distinctive groups reside in the nonprofit sector.
Summary of Results for Group Comparisons
Privatization and contracting out are expected to alter incentive structures of employees and thus increase efficiency and productivity in the new governance (Salamon, 2002). An implicit assumption is that for-profit workers are different from government employees who suffer from a “bureaucratic mentality.” Our analysis suggests, however, that for-profit public services workers do not significantly differ in many respects from bureaucrats; they share very similar perceptions and attitudes.
The first question we face, given the similarities between government public servants and for-profit public servants, is what accounts for the convergence in these two groups. We believe several nonmutually exclusive explanations are plausible. One explanation is that similarities in the roles played by public servants, whether they are located in government or the for-profit sector, tend to breed similar orientations. If government and for-profit public servants have similar experiences with clients, other stakeholders, and citizens, then they are likely to develop similar world views. The similarities may be largely the result of common forms of socialization surrounding their work.
A related explanation for the similarity of responses from government and for-profit public servants is “parallel processing,” a situation where for-profit public servants may do different work from government public servants but adopt similar orientations because they interact regularly with their counterparts in government as contractors or related roles. The close proximity and frequent interactions may lead the two groups to adopt similar world views, developing empathy for the predicament of their opposite members, which leads, in turn, to similar orientations.
A third option is that the for-profit public servants were themselves once government public servants. There are clearly several ways in which this might happen. Government work that is outsourced could well carry with it a mandate from the agency outsourcing the work that the government staff members retain their positions with the new operator. We also know that retired government public servants may take up similar employment with for-profit organizations. This third explanation is a viable way of accounting for similarities.
What should be made of the divergence between the government, for-profit classes, and the nonprofit groups? In some respects, the statistical differences between social/health service and education employees reflect what we would have expected to find for government public servants. The former groups are more likely than education and other occupational classes to favor greater social service spending (e.g., drug addiction issue, welfare, social security, and assistance for child care), oppose military and infrastructure expenditures, are liberal and empathic, and identify themselves with the Democratic party. This finding suggests an irony. The growth in nonprofit social service jobs means that the people who are taking on the work of government public servants envision a more expansive role for government than the government public servants they may be replacing.
For-profit public servants do differ from government bureaucrats with respect to job-related perceptions. Like for-profit, nonpublic services employees, for-profit public servants appear to most prefer high income and least prefer a feeling of accomplishment from a job, while they are more concerned with being laid off than government and nonprofit counterparts (Table 7). For-profit public servants are less likely than other groups to continue to work even if they get enough money to live as comfortably as they would like for the rest of their lives although this difference is marginally significant when controlling covariates. Consequently, they appear to be sensitive to monetary incentives and extrinsically motivated.
The notion of bureau information monopoly (Niskanen, 1971) was not supported because no prominent patterns were found in perceptions about government spending. Government bureaucrats and for-profit public servants are more supportive of space exploration and military, armaments, and defense, while nonprofit public service employees want government to spend more money on welfare, dealing with drug addiction, improving conditions of Blacks, social security, and assistance for child care. No significant difference is found in other areas of government spending.
Our findings offer mixed support for the bureau voting model that Garand et al. (1991) posit. Contrary to what we expected, government bureaucrats are more likely than nonprofit and for-profit employees to vote for a Republican candidate. Nonprofit public servants, in particular, are more likely than bureaucrats to exercise their votes for candidates supportive of government spending. As the bureau voting model predicts, both government bureaucrats and education employees are more willing to vote than other private employees.
Nonprofit public service employees tend to be more empathic and intrinsically motivated than government bureaucrats and their for-profit counterparts. They are more likely to help needy people; support welfare and redistribution policy; and be motivated without extrinsic rewards (e.g., income and job security). In particular, employees in social and health services are more highly educated and have higher job satisfaction and job prestige than do respondents from for-profit, nonpublic services. Social and health service employees appear to be least satisfied with their present financial situation, but prefer the feeling of accomplishment in a job and are willing to continue to work even if they get enough money to live. This finding is consistent with Lyons, Duxbury, and Higgins (2006), who suggest “[parapublic sector employees] value the contribution that their work makes to society and the personal fulfillment they drive from their work” (p. 615).
Hence, many nonprofit organizations find their niche in social services, health services, education, and the like, where both markets and government may work less successfully. Employees with empathy and intrinsic motivation are more likely to be interested in these jobs, and nonprofit organizations are more likely to recruit them in labor markets through their selection and screening processes. As a consequence, nonprofit employees in social and health services may be systematically different from their counterparts in government and for-profit sectors. It is notable that the proportion of African Americans and women in the nonprofit sector is much higher than in other categories (Table 2). Even for-profit organizations, competing with their nonprofit counterpart in social and health services, may favor highly motivated workers to improve their efficiency and service quality. The nature of jobs appears to matter rather than does the type of service provision sectors in these occupational classes.
Education represents a large portion of nonprofit public services employees and has different characteristics than other nonprofit industries. Education employees tend to be more educated, have higher family income and occupational prestige, vote at higher rates, and least prefer chances for advancement in a job. Education respondents also exhibit higher levels of social capital such as helpfulness, fairness, and trust. Although some education employees work at public schools, colleges, or universities, they differ from employees in government and social/health services.
Expansion of the role of nonprofits in delivering public services may be shifting influence to people who are more like the stereotype of government bureaucrats than different. At the same time, expansion of for-profit public servants, given their similarities with government public servants, does not appear to alter the characteristics of the aggregate of public servants. If the similarity comes from roles (tasks) themselves and/or the “parallel processing” discussed earlier, decisions to privatize public services should be made with special caution on such managerial issues as performance measurement, monitoring, incentives, and sanctions in order not to “govermentalize” the private sector.
Important covariates are education, political ideology, family income, age, gender, and race. In particular, political ideology and African American have significant effects on respondents’ perceptions and preferences. Liberal and Black respondents are more likely than conservative and other ethnic counterparts to be concerned with social issues like welfare, drug addiction, and security and to have less confidence in institutions, for example. Status in the organizational hierarchy does not matter much with some exceptions; for instance, managers are more likely to vote for a Republican candidate, most prefer chances of advancement in a job, are altruistic, and think that they will be laid off in 12 months.
Conclusion
This study used longitudinal General Social Survey (GSS) data and applied econometric methods to examine how groups of public and nonpublic employees differed on a series of items regarding government spending preferences, political orientation, confidence in institutions, job-related perceptions, and social capital. Our typology makes it possible to reflect the diversity of new governance arrangements by differentiating public servants from nonpublic servants. We found that government and for-profit public servants were surprisingly alike, but, for the most part, very similar to for-profit, nonpublic servants. In contrast, nonprofit public servants were more likely to conform to stereotypes often associated with government bureaucrats.
Although the results are generally consistent with other studies, our methodology has some limitations. First, the GSS makes it difficult to discriminate between nonprofit and for-profit sectors in a completely satisfactory way. Many respondents appeared to fail to identify the sector (i.e., government, nonprofit, and for-profit) that they were working for and/or left the question unanswered. One reason for this result is that borders of three sectors, especially in health and social services, are blurring. Accordingly, the Standard Industrial Classification (SIC) alone may not be sufficient to classify service types (public vs. nonpublic) and service provision sectors correctly.
In addition, there might be trend effects that were not ruled out in this study. Perceptions may change over time and some of them may be sensitive to social events. In the cumulative GSS 1972-2008, party identification and confidence in the scientific community, for example, have been relatively consistent. By contrast, approval of government spending on welfare and protecting the environment, and confidence in the federal government have fluctuated up and down. It is conceivable then that some of the results we report were affected by underlying trends for which we did not test. The trend effects, however, appear to be minor in a short-term analysis. Page and Shapiro (1992), in a similar vein, argue that public opinion tends to be stable, coherent, and consistent rather than volatile and capricious (pp. 42-66).
This research is a first step in what we believe should be more systematic research about the consequences of new governance for democracy. The instrumental effects of new governance have received wide attention, but other consequences, such as how transformation of governance affects democracy, has garnered little scholarly attention (Heinrich, Lynn, & Milward, 2010; Perry, 2007; Smith & Ingram, 2002). Now is an appropriate juncture at which to begin to remedy the gaps in our knowledge about new governance and democracy.
Footnotes
Appendix: Question Wording
Government Spending Preferences: We are faced with many problems in this country, none of which can be solved easily or inexpensively. I’m going to name some of these problems, and for each one I’d like you to tell me whether you think we’re spending too much money on it, too little money, or about the right amount. First . . . are we spending too much, too little, or about the right amount on . . . ? (Space exploration program; improving and protecting the environment; improving and protecting the nation’s health; solving the problems of the big cities; halting the rising crime rate; dealing with drug addiction; improving the nation’s education system; improving the conditions of Blacks; the military, armaments and defense; foreign aid; welfare; social security; highways and bridge; mass transportation; parks and recreation; assistance for child care). * “Too little” was recoded as 1 and 0 otherwise.
Confidence in Institutions: I am going to name some institutions in this country. As far as the people running these institutions are concerned, would you say you have a great deal of confidence, only some confidence, or hardly any confidence at all in them? (Executive branch of the federal government; U.S. Supreme Court; Congress; press; major companies; banks and financial institutions; organized labor; education; scientific community; television; medicine; military). * “A great deal” was set 1 and 0 otherwise.
Voting for Republicans: In 2000, you remember that Gore ran for President on the Democratic ticket against Bush for the Republicans. Do you remember for sure whether or not you voted in that election? IF VOTED: Did you vote for Gore or Bush? IF DID NOT VOTE: Who would you have voted for, for President, if you had voted? IF DID NOT VOTE OR INELIGIBLE: Who would you have voted for, for President, if you had voted? In 2004, you remember that Kerry ran for President on the Democratic ticket against Bush for the Republicans. Do you remember for sure whether or not you voted in that election? IF VOTED: Did you vote for Kerry or Bush? IF DID NOT VOTE OR INELIGIBLE: Who would you have voted for, for President, if you had voted? * If a respondent voted or would have voted for Bush in 2000 or 2004, this variable was coded as 1; Generally speaking, do you usually think of yourself as a Republican, Democrat, Independent, or what? * Rescaled to range 0 to 6; Do you consider the amount of federal income tax which you have to pay as too high, about right, or too low? (1 = too high)
Job-Related Reward Preferences: On the whole, how satisfied are you with the work you do—would you say you are very satisfied, moderately satisfied, a little dissatisfied, or very dissatisfied? So far as you and your family are concerned, would you say that you are pretty well satisfied with your present financial situation, more or less satisfied, or not satisfied at all?; If you were to get enough money to live as comfortably as you would like for the rest of your life, would you continue to work or would you stop working? (1 = yes); Thinking about the next 12 months, how likely do you think it is that you will lose your job or be laid off—very likely, fairly likely, not too likely, or not at all likely? Would you please look at this card and tell me which one thing on this list you would most prefer in a job? (No danger of being fired; Work important and gives a feeling of accomplishment; High Income; Workings hours are short, lots of free time; Chances for advancement). * Variables are rescaled to range 0 through 1 for interpretational convenience.
Social Capital: Would you say that most of the time people try to be helpful, or that they are mostly just looking out for themselves?; Do you think most people would try to take advantage of you if they got a chance, or would they try to be fair? * Reversely coded; Generally speaking, would you say that most people can be trusted or that you can’t be too careful in life; The following statements ask about your thoughts and feelings in various situations. For each item indicate how well it describes you by choosing the number on the showcard where 1 indicates that it does not describe you very well and 5 means that it does describe you very well. Of course numbers 2 to 4 indicate that how well it describes you are in between these points. (I often have tender, concerned feelings for people less fortunate than me; Sometimes I don’t feel very sorry for other people when they are having problems; When I see someone being taken advantage of, I feel kind of protective toward them; Other people’s misfortunes do not usually disturb me a great deal; When I see someone being treated unfairly, I sometimes don’t feel very much pity for them; I am often quite touched by things that I see happen; I would describe myself as a pretty soft-hearted person) * The mean of 7 recoded questions was calculated for the measure of empathy (Cronbach’s α = .73); During the past 12 months, how often have you done each of the following things (Donated blood; Given food or money to a homeless person; Returned money to a cashier after getting too much change; Allowed a stranger to go ahead of you in line; Done volunteer work for a charity; Given money to a charity; Offered your seat on a bus or in a public place to a stranger who was; Looked after a person’s plants, mail, or pets while they were away; Carried a stranger’s belongings, like groceries, a suitcase, or shopping bag; Given directions to a stranger; Let someone you didn’t know well borrow a item of some value like dishes or tools.) * The mean of 11 recoded questions was used for the measure of altruism (Cronbach’s α = .69); Would you use this card and tell me which answer comes closest to how often you do the following things (Spend a social evening with relatives? Spend a social evening with someone who lives in your neighborhood? Spend a social evening with friends who live outside the neighborhood? Go to a bar or tavern?) * All four variables were reversely recoded from 0 to 6.
Covariates: Respondent’s industry (U.S. Bureau of the Census 3 digit occupation and industries codes for 1980); Respondent’s education (from 1st grade to 8 years of college); We hear a lot of talk these days about liberals and conservatives. I’m going to show you a 7-point scale on which the political views that people might hold are arranged from extremely liberal to extremely conservative. Where would you place yourself on this scale? * Recoded as from 0 (Liberal) to 6; In which of these groups did your total family income, from all sources, fall last year before taxes, that is? * Family income was recoded using the midpoints of each class (US$1,000) and then converted into a real income using the Consumer Price Index (CPI-U) of the U.S. Department of Labor; Prestige of respondent’s occupation; Are you currently—married, widowed, divorced, separated, or have you never been married? (1 = married); Number of members under 6 years; Number of members 6 to 12 years; Number of members 13 to 17 years old * The sum of these three variables measures the number of children under age 18; Respondent’s age; Respondent’s gender (1 = male); What race do you consider yourself? (1 = African American); Respondent’s occupation in1988 International Standard Classification (1 = manager if greater than 1,000 and less than 2000—legislators, senior officials, and general managers).
Acknowledgements
The authors thank Charles Goodsell, John Graham, David Houston, David Reingold, and Donald Moynihan for comments on earlier drafts.
Authors’ Note
This article is a revised version of papers presented at the 2010 Korean Association for Policy Studies Annual Summer Meeting and International Conference, Seoul, South Korea, June 18 and the Academy of Management Annual Conference, Chicago, Illinois, August 10, 2009.
Declaration of Conflicting Interests
The authors declared no potential conflicts of interest with respect to the research, authorship, and/or publication of this article.
Funding
The authors disclosed receipt of the following financial support for the research, authorship, and/or publication of this article: The second author’s participation in this research was supported by World Class University (WCU) program through the Korea Science and Engineering Foundation funded by the Ministry of Education, Science, and Technology (R32-20002).