



Abstract
Background
Longitudinal metabolic changes of total choline (tCho), creatine + phosphocreatine (total creatine, tCr), and N-acetylaspartate (NAA) in the pregenual anterior cingulate cortex (pACC) of patients with major depressive disorder (MDD) have not been well evaluated.
Purpose
To evaluate the longitudinal changes of the metabolic levels of tCho, tCr, and NAA in the pACC of MDD patients and normal controls with the use of Single-voxel 1HMRS.
Material and Methods
Single-voxel 1HMRS was acquired in the pACC of 21 female patients with MDD and 26 age- and gender–matched controls. Follow-up scans were acquired in 10 patients with MDD and 15 controls after 9–10 months from baseline scans. Absolute concentrations of tCho, tCr, and NAA, and the ratios of NAA/tCr and tCho/tCr were calculated and compared between and within groups.
Results
The patient group showed slightly improved clinical symptoms, as measured by Beck’s Depression Inventory (P = 0.035), after treatment with antidepressants. Comparison of baseline scans between the groups showed no differences in any of the absolute metabolite concentrations or ratios. The NAA/tCr ratio in the pACC of patients with MDD showed a significant decrease in the follow-up scan (P = 0.032), and the NAA/tCr ratio of the baseline scan showed logarithmic negative association with illness duration (P = 0.024).
Conclusion
A progressive decrease in the NAA/tCr ratio in the pACC of patients with MDD was demonstrated and the decrease in this ratio was at the highest rate in the early period after illness onset. These findings indicate the neuronal degeneration and dysfunction of the pACC, and the importance of early clinical intervention in female patients with MDD.
Introduction
Major depressive disorder (MDD) is a common and potentially serious major psychiatric illness. The lifetime prevalence of MDD reaches up to 15–20%, and the 1-year prevalence is about 6.6% (1–3). Patients with MDD present with a diverse range of symptoms, such as emotional, motivational, behavioral, and cognitive manifestations, and abnormalities in multiple brain regions, such as the orbital and medial prefrontal cortices, amygdala, hippocampus, and related parts of the striatum and thalamus. Because of this, pathologic patterns of neurotransmission in interconnected neural circuits have been proposed (4).
Neurobiological abnormalities related to depression have been reported by neuroimaging techniques (5–8). Furthermore, the proton magnetic resonance spectroscopy (1HMRS) technique has been widely used for detecting neuronal abnormalities in patients with mood disorders (9,10). N–acetylaspartate (NAA) has been considered a putative marker of neuronal integrity; thus, NAA levels may play an important role in monitoring neuronal functioning (11). In MDD, many MRS studies have been performed, but most have shown negative findings in terms of the levels of NAA or NAA/tCr ratio in relation to the pathophysiology of depression (9), and anecdotal studies have reported the increased levels of NAA/tCho (12) and NAA/tCr (13) ratios after antidepressant treatment.
Recently, studies have reported consistent results of reduced gray matter volumes in the medial prefrontal lobes of patients with MDD in studies using voxel-based morphometry (VBM) (14,15). These studies reporting morphological abnormalities suggest further investigations from the viewpoint of neurochemical changes in the prefrontal gray matter of patients with MDD.
The first aim of this 1HMRS study was to investigate metabolite differences between patients with MDD in an antidepressant drug-free state and normal control subjects in the pregenual anterior cingulate cortex (pACC), a region thought to be involved in the pathogenesis of major depression (4). The second aim was to investigate longitudinal changes in neurochemicals in the patients with MDD showing improved depressive symptoms after antidepressant medications and in normal control subjects for comparison. The levels of total choline (tCho), creatine (Cr) + phosphocreatine (total creatine, tCr), and NAA were quantified by single-voxel MRS at baseline and in follow-up scans of patients with MDD and normal controls.
Material and Methods
Subjects
Female subjects (n = 21; mean age ± SD, 42.5 ± 13.95 years) with MDD were recruited from the patients visiting the Department of Psychiatry at our hospital. All patients were in a medication-free state for at least 3 months prior to the study. Of the 21 patients, 11 had never taken any antidepressant drug (drug-naïve). Additionally, 26 healthy female subjects (age, 41.3 ± 10.95 years), matched by age, handedness, and parental socioeconomic status, were recruited from the community. To evaluate progressive metabolic changes, follow-up magnetic resonance imaging (MRI)/MRS scans were performed in 10 patients (age, 42.0 ± 14.75 years; 4 drug-free and 6 drug-naïve prior to the first scan) and 15 normal control subjects (age, 41.3 ± 11.64 years). The subjects who were not included in the follow-up study quit the experiment by their own decision. Although initially we designed to include all patients for the longitudinal MRI scanning, only 10 patients participated in the second scanning. Some patients did not show up at our depression clinic by their own decision during the course of this research, and the others refused to take part in the second MRI scanning due to personal problems such as long scanning time or worrying about radiofrequency.
Patients were taking antidepressant medications, either selective serotonin reuptake inhibitors or serotonin norepinephrine reuptake inhibitors, during the follow-up periods, but were not taking any kind of antipsychotic or mood stabilizer.
Patients were included if they fulfilled the criteria for MDD, based on the Structured Clinical Interview (SCID) of DSM-IV (16). Depressive symptoms were assessed using the Beck Depression Inventory (BDI) (17) and the 17-item Hamilton Depression Rating Scale (HDRS) (18). Both the SCID and HDRS were administered by an experienced psychiatrist. Both patients and normal control subjects were excluded from the study if they had a current or past history of other Axis I disorders, including bipolar disorder, schizophrenia, schizoaffective disorder, claustrophobia, or alcohol or substance dependence. Subjects with previous histories of head trauma, cerebrovascular accidents, cerebral tumors, and other serious medical conditions were also excluded. This study was approved by the institutional review board of Kangwon National University Hospital.
MRI/MRS acquisition and processing
Three-dimensional (3D) T2-weighted (T2W) MRI and 1H-MRSI scans were conducted on a 1.5-T MRI scanner (Gyroscan ACS-NT; Philips Medical Systems, Best, The Netherlands) with quadrature head coil. Coronal, sagittal, and axial 3D T2W MRIs were scanned (coronal, sagittal, contiguous 5 mm without gap, covering the entire brain; repetition time [TR], 15,085 ms; echo time [TE], 100 ms; flip angle, 90°; acquisition, matrix, 240 × 240; field of view [FOV], 200 × 200 mm2; axial, contiguous 3 mm without gap, covering the entire brain; TR, 20,450 ms; TE, 100 ms; flip angle, 90°; acquisition matrix, 256 × 154; FOV, 200 × 200 mm2) for the anatomical references of MRS (Fig. 1).
Location and size of the MRS volume of interest (VOI) in the pregenual anterior cingulate cortex. VOI was overlaid on T2W image.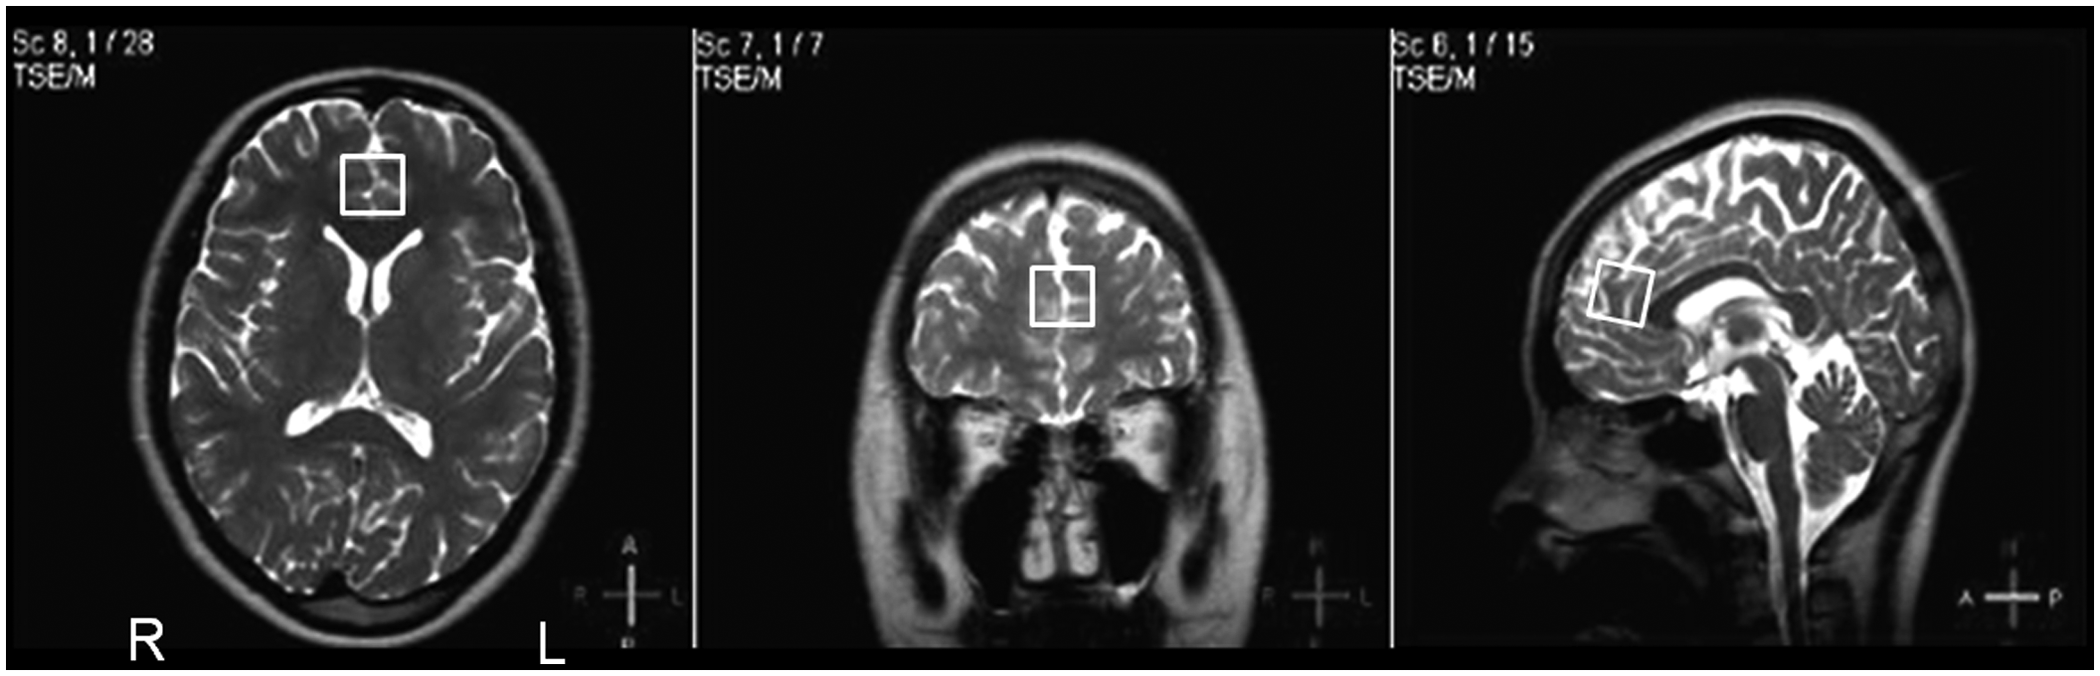
Single-voxel water-suppressed 1HMRS scans were acquired using a point-resolved selective spectroscopy (PRESS) sequence with outer volume suppression (TR, 2000 ms; TE, 144 ms; 512 data point; 1 kHz spectral width; number of signals averaged, 160; voxel sizes, 20 × 20 × 20 mm3). For the insufficient signal-to-noise ratio (SNR) of 1.5 T MRI, tCho, tCr, and NAA were included as the metabolite of interest. Although short TE’s spectrum guarantees good SNR, the signals of myo-inositol, glutamate, and glutamine produced from short echo usually cause baseline turbulence, so TE of 144 ms MRS provides better spectra for tCho, tCr, and NAA in 1.5 T MRI. Short TE decreases the efficiency of water suppression and it makes more difficult to obtain reproducibility of spectra. The local magnetic field homogeneity was optimized using autoshimming procedure (coarse autoshimming – tuning x, y, z gradients – fine autoshimming). Guided by T2 reference images, the volume of interest (VOI) for MRS was placed to encompass bilateral pACC. The posterior boundary of VOI was placed to an anterior tip of the genu of corpus callosum, and the basal boundary of VOI was placed to AC-PC line. The VOI of second MRS scan was placed based on the criteria of first MRS scan and its location was matched to that of first MRS as closely as possible. The anatomical references were determined through the instruction of a neuroradiologist.
Using LCModel (ver. 6.2.0), absolute concentrations of tCho (3.2 ppm), tCr (3.0 ppm), and NAA (2.02 ppm) were calculated using curve-fitting analysis, measuring not a metabolite’s resonance, but a metabolite’s area, accounting for the unsuppressed brain water signal of the same voxel as an internal reference standard (Fig. 2) (19). LCModel is automatic analysis method without subjective input, and it uses model-free constrained regularization to achieve the best compromise between the unpredictable forms of lineshape and baseline. The experimental basis set with fully relaxed model metabolite spectra for TE = 144 ms of Philips 1.5 T MRI scanner was provided by LCModel vendor for metabolites quantification. Eddy-current corrected and water-scaling were performed using unsuppressed water reference signal to estimate absolute quantification. To ensure high-quality data, spectra were rejected when there were large artifacts, spurious echoes, or some other obvious problem in the experimental procedure. The estimated standard deviations of accepted metabolites were <20% from the Cramér–Rao inequality. According to rejection criteria, two normal controls and one patient with MDD were excluded from the cross-sectional study, and one normal control was rejected in the longitudinal analysis. Absolute concentrations of NAA, tCho, and tCr were measured, and the levels of NAA and tCho were also calculated in terms of ratios to tCr in each spectrum. The amounts of metabolites were not corrected for the voxel cerebrospinal fluid (CSF) content in this study.
Longitudinal quantification of the pregenual anterior cingulate cortex: N-acetylaspartate, creatine + phosphocreatine (tCr), and choline. The baseline (a) and follow-up (b) scans were independently analyzed using LCModel’s curve-fitting method. Chemical shifts are indicated in parts per million (ppm). This figure shows one subject’s analysis.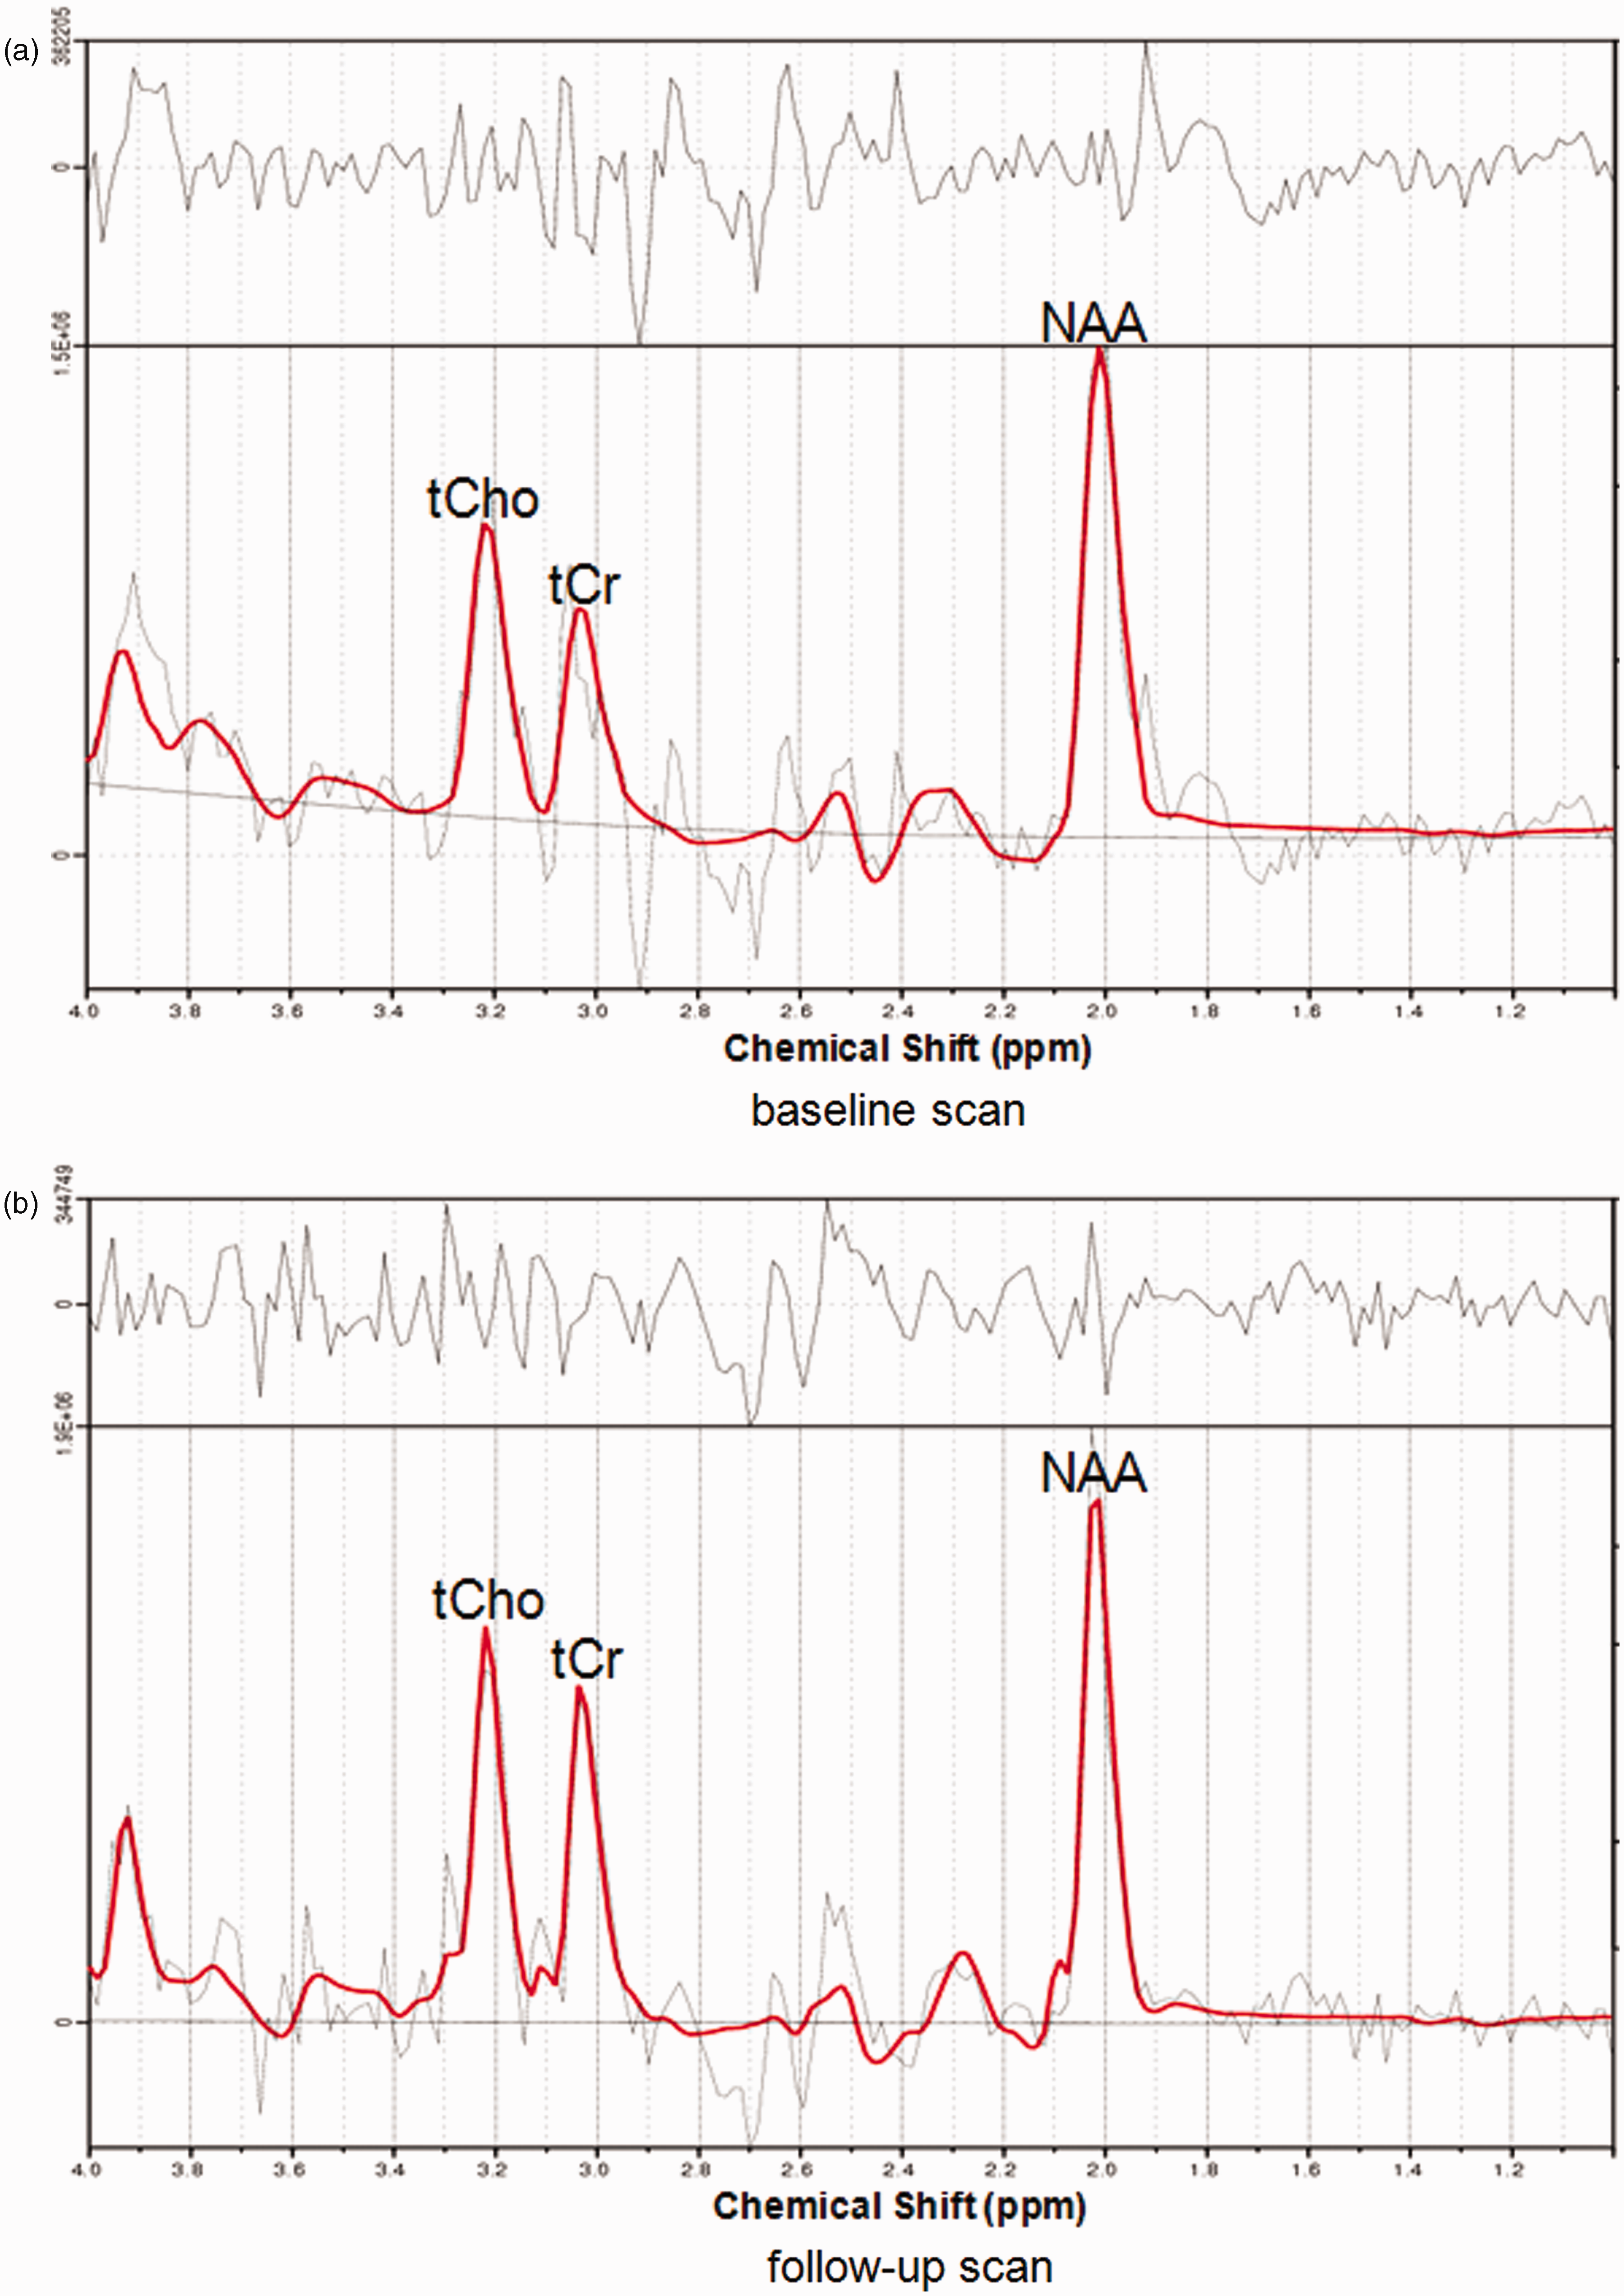
Statistical analyses
Statistical analyses were performed with SPSS (ver. 11.5; SPSS Inc., Chicago, IL, USA). Between-group comparisons of age, tCho, tCr, NAA, tCho/tCr, and NAA/tCr were performed by independent two-sample t-tests and analysis of covariance (ANCOVA), controlling for age. For within-group comparisons of longitudinal metabolite changes in the normal controls and patients with MDD, two-tailed paired t-tests and Wilcoxon signed-rank tests were performed. A repeated-measures analysis of variance (ANOVA) for the between-group comparison of the metabolite change was performed. Relationships between education levels and longitudinal changes in metabolites were tested by Spearman’s rank-order correlation. According to a previous hypothesis on the logarithmic association between illness duration and neuronal degeneration in the hippocampus of patients with MDD (6), logarithmic associations between illness duration and the metabolite ratios of the patients were tested. P values < 0.05 (two tailed) were deemed to indicate statistical significance.
Results
Clinical variables
Clinical variables of normal controls and patients with MDD in the cross-sectional analysis.
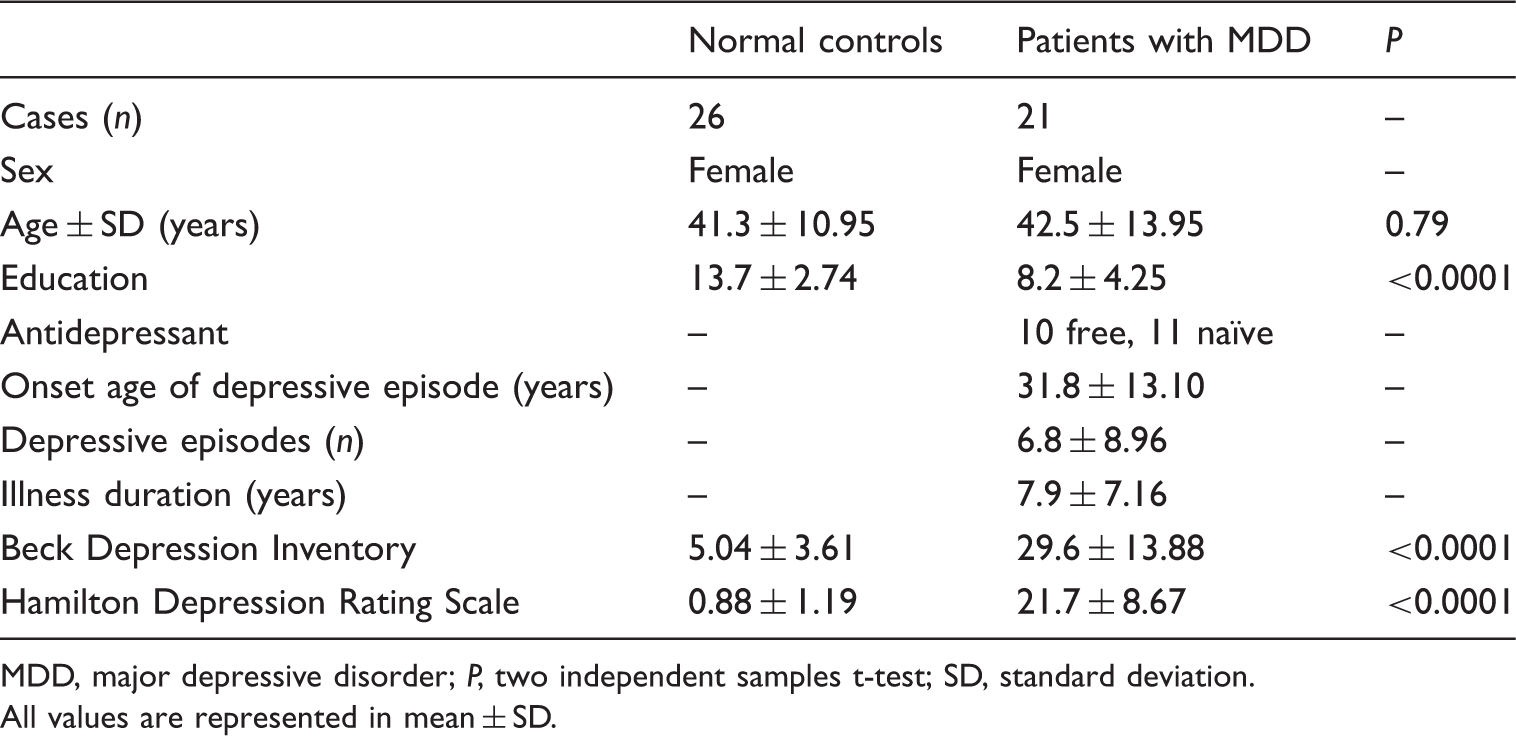
MDD, major depressive disorder; P, two independent samples t-test; SD, standard deviation.
All values are represented in mean ± SD.
Clinical variables of normal controls and patients with MDD in the longitudinal analysis.
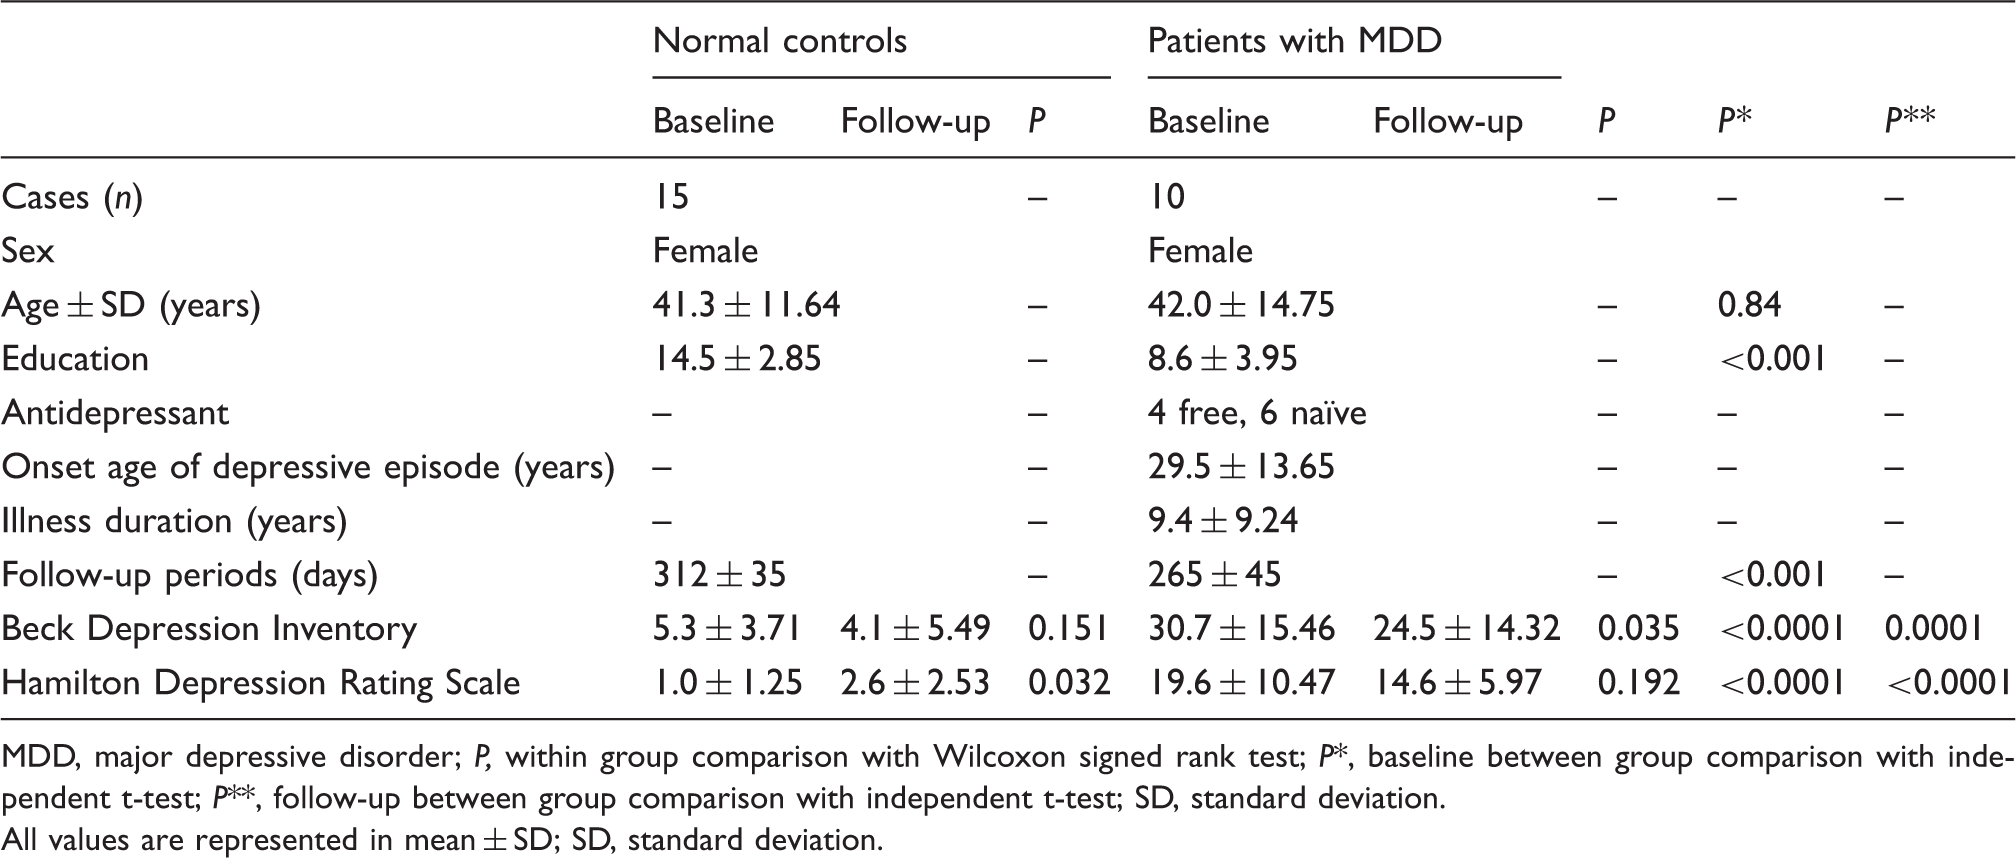
MDD, major depressive disorder; P, within group comparison with Wilcoxon signed rank test; P*, baseline between group comparison with independent t-test; P**, follow-up between group comparison with independent t-test; SD, standard deviation.
All values are represented in mean ± SD; SD, standard deviation.
MRS metabolites
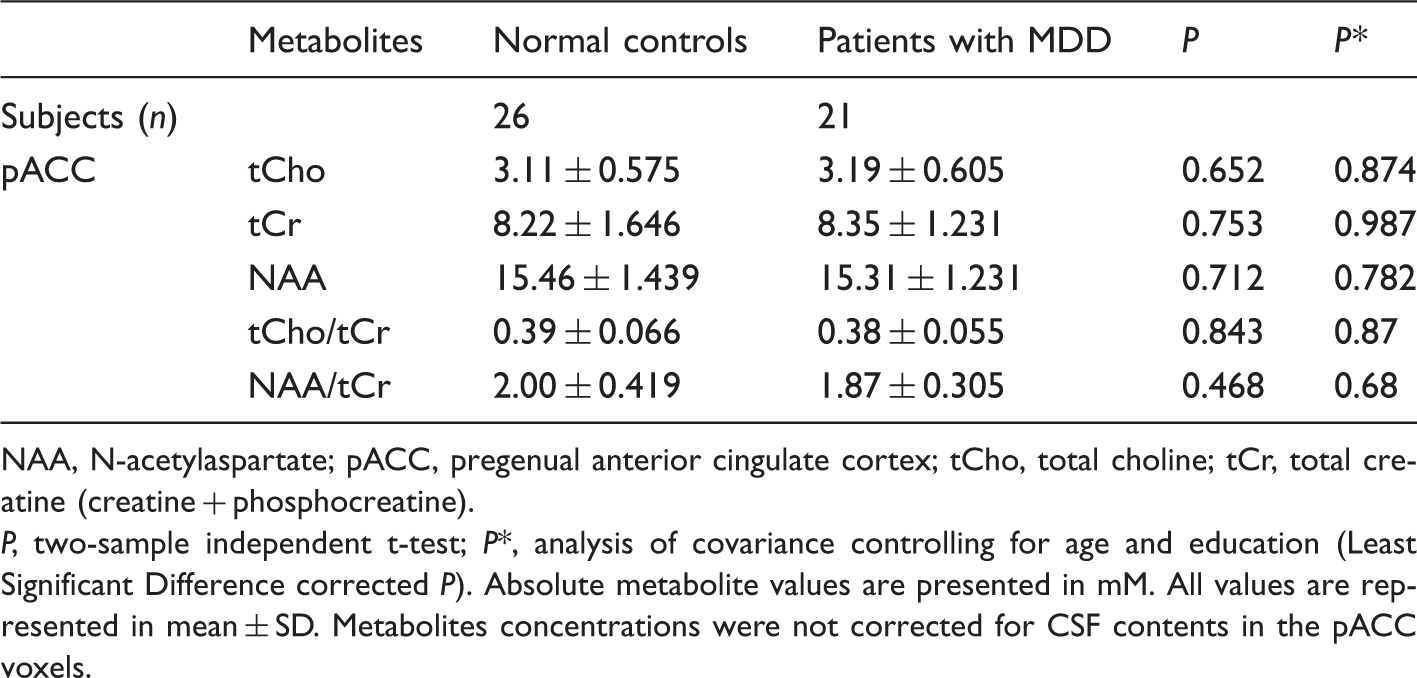
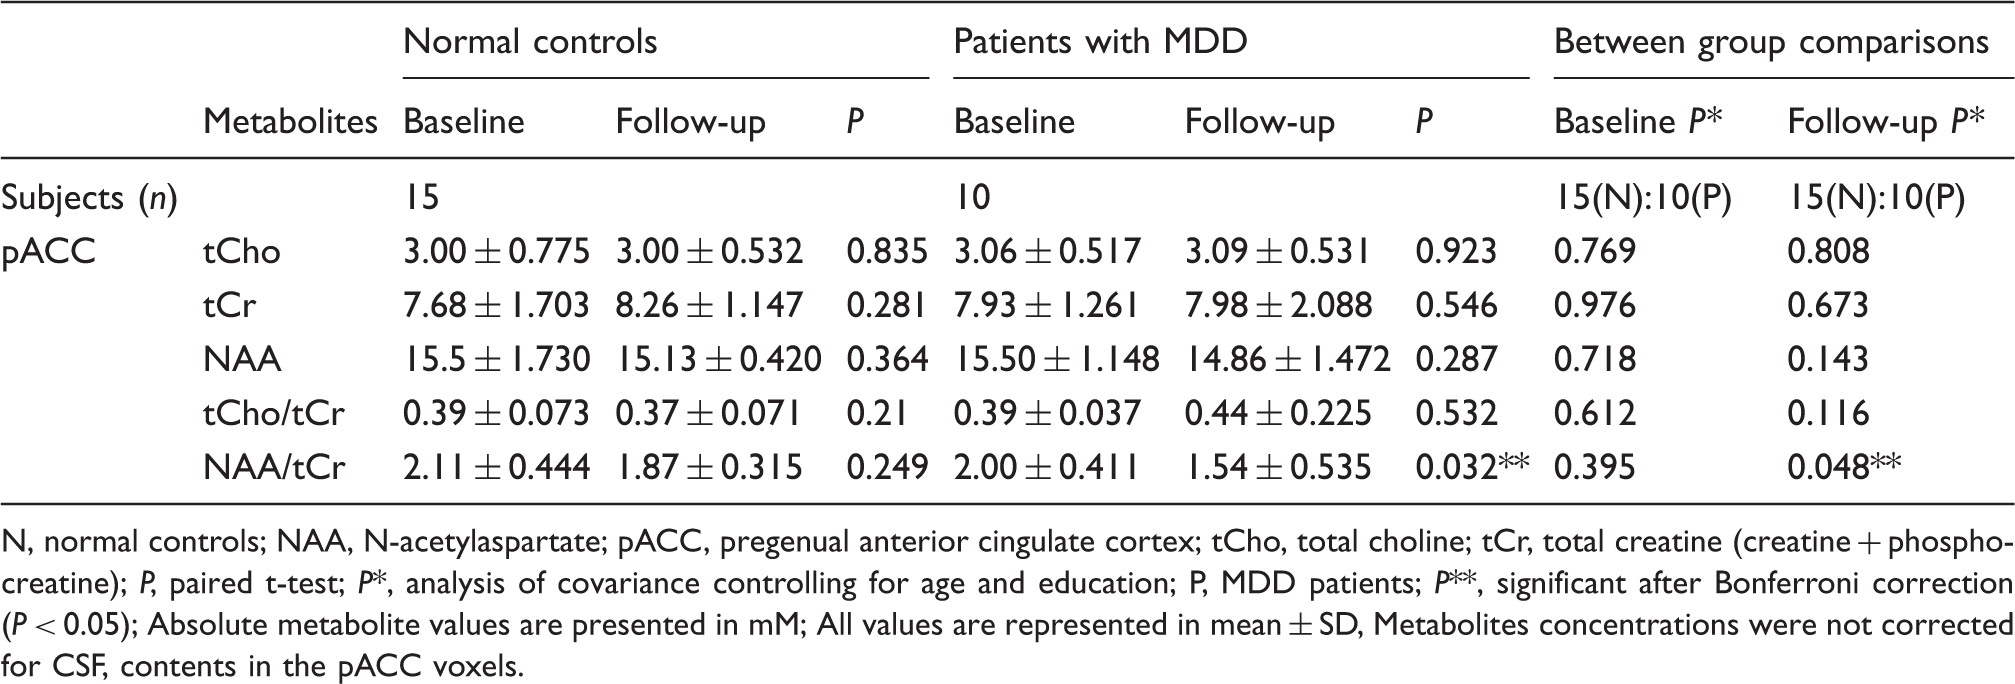
None of the metabolite levels (NAA, tCho, and tCr) or ratios (tCho/tCr and NAA/tCr) in the pACC showed a difference between the normal controls and patients with MDD at baseline (Table 3). The NAA/tCr ratio in the pACC of the patients with MDD decreased significantly in the follow-up scan (baseline: 2.00 ± 0.411, follow-up: 1.54 ± 0.535; P = 0.032, two-tailed Bonferroni correction adjusted), while the NAA/tCr ratio in the pACC of the normal controls did not change significantly (baseline: 2.11 ± 0.444, follow-up: 1.87 ± 0.315; P = 0.249, two-tailed Bonferroni correction adjusted) (Fig. 3). In the comparison between the two groups’ follow-up scans, the NAA/tCr ratio in patients with MDD was significantly lower than the ratio in normal controls (normal controls: 1.88 ± 0.294, patients with MDD: 1.60 ± 0.269; P = 0.024, ANCOVA, controlling for age), but the NAA/tCr ratios of the two groups’ baseline scans were not different (Table 4). Repeated-measures ANOVA demonstrated that antidepressant treatment did not affect the NAA/tCr ratio (group × treatment interaction: F = 0.795, df = 1,23; P = 0.382).
Changes in N-acetyl-aspartate (NAA)/creatine + phosphocreatine (tCr) ratios in the pregenual anterior cingulate cortex (pACC) of normal controls and patients with major depressive disorder (MDD). The NAA/tCr ratio of patients with MDD decreased significantly over 38 weeks (P = 0.032, Bonferroni correction adjusted), while the change of NAA/tCr ratio of normal controls was not significant over 45 weeks (P = 0.498, Bonferroni correction adjusted). Cross-sectional analysis of metabolic levels of MRS between normal controls and patients with MDD. NAA, N-acetylaspartate; pACC, pregenual anterior cingulate cortex; tCho, total choline; tCr, total creatine (creatine + phosphocreatine). P, two-sample independent t-test; P*, analysis of covariance controlling for age and education (Least Significant Difference corrected P). Absolute metabolite values are presented in mM. All values are represented in mean ± SD. Metabolites concentrations were not corrected for CSF contents in the pACC voxels. Longitudinal analysis of metabolic levels of MRS in normal controls and patients with MDD. N, normal controls; NAA, N-acetylaspartate; pACC, pregenual anterior cingulate cortex; tCho, total choline; tCr, total creatine (creatine + phosphocreatine); P, paired t-test; P*, analysis of covariance controlling for age and education; P, MDD patients; P**, significant after Bonferroni correction (P < 0.05); Absolute metabolite values are presented in mM; All values are represented in mean ± SD, Metabolites concentrations were not corrected for CSF, contents in the pACC voxels.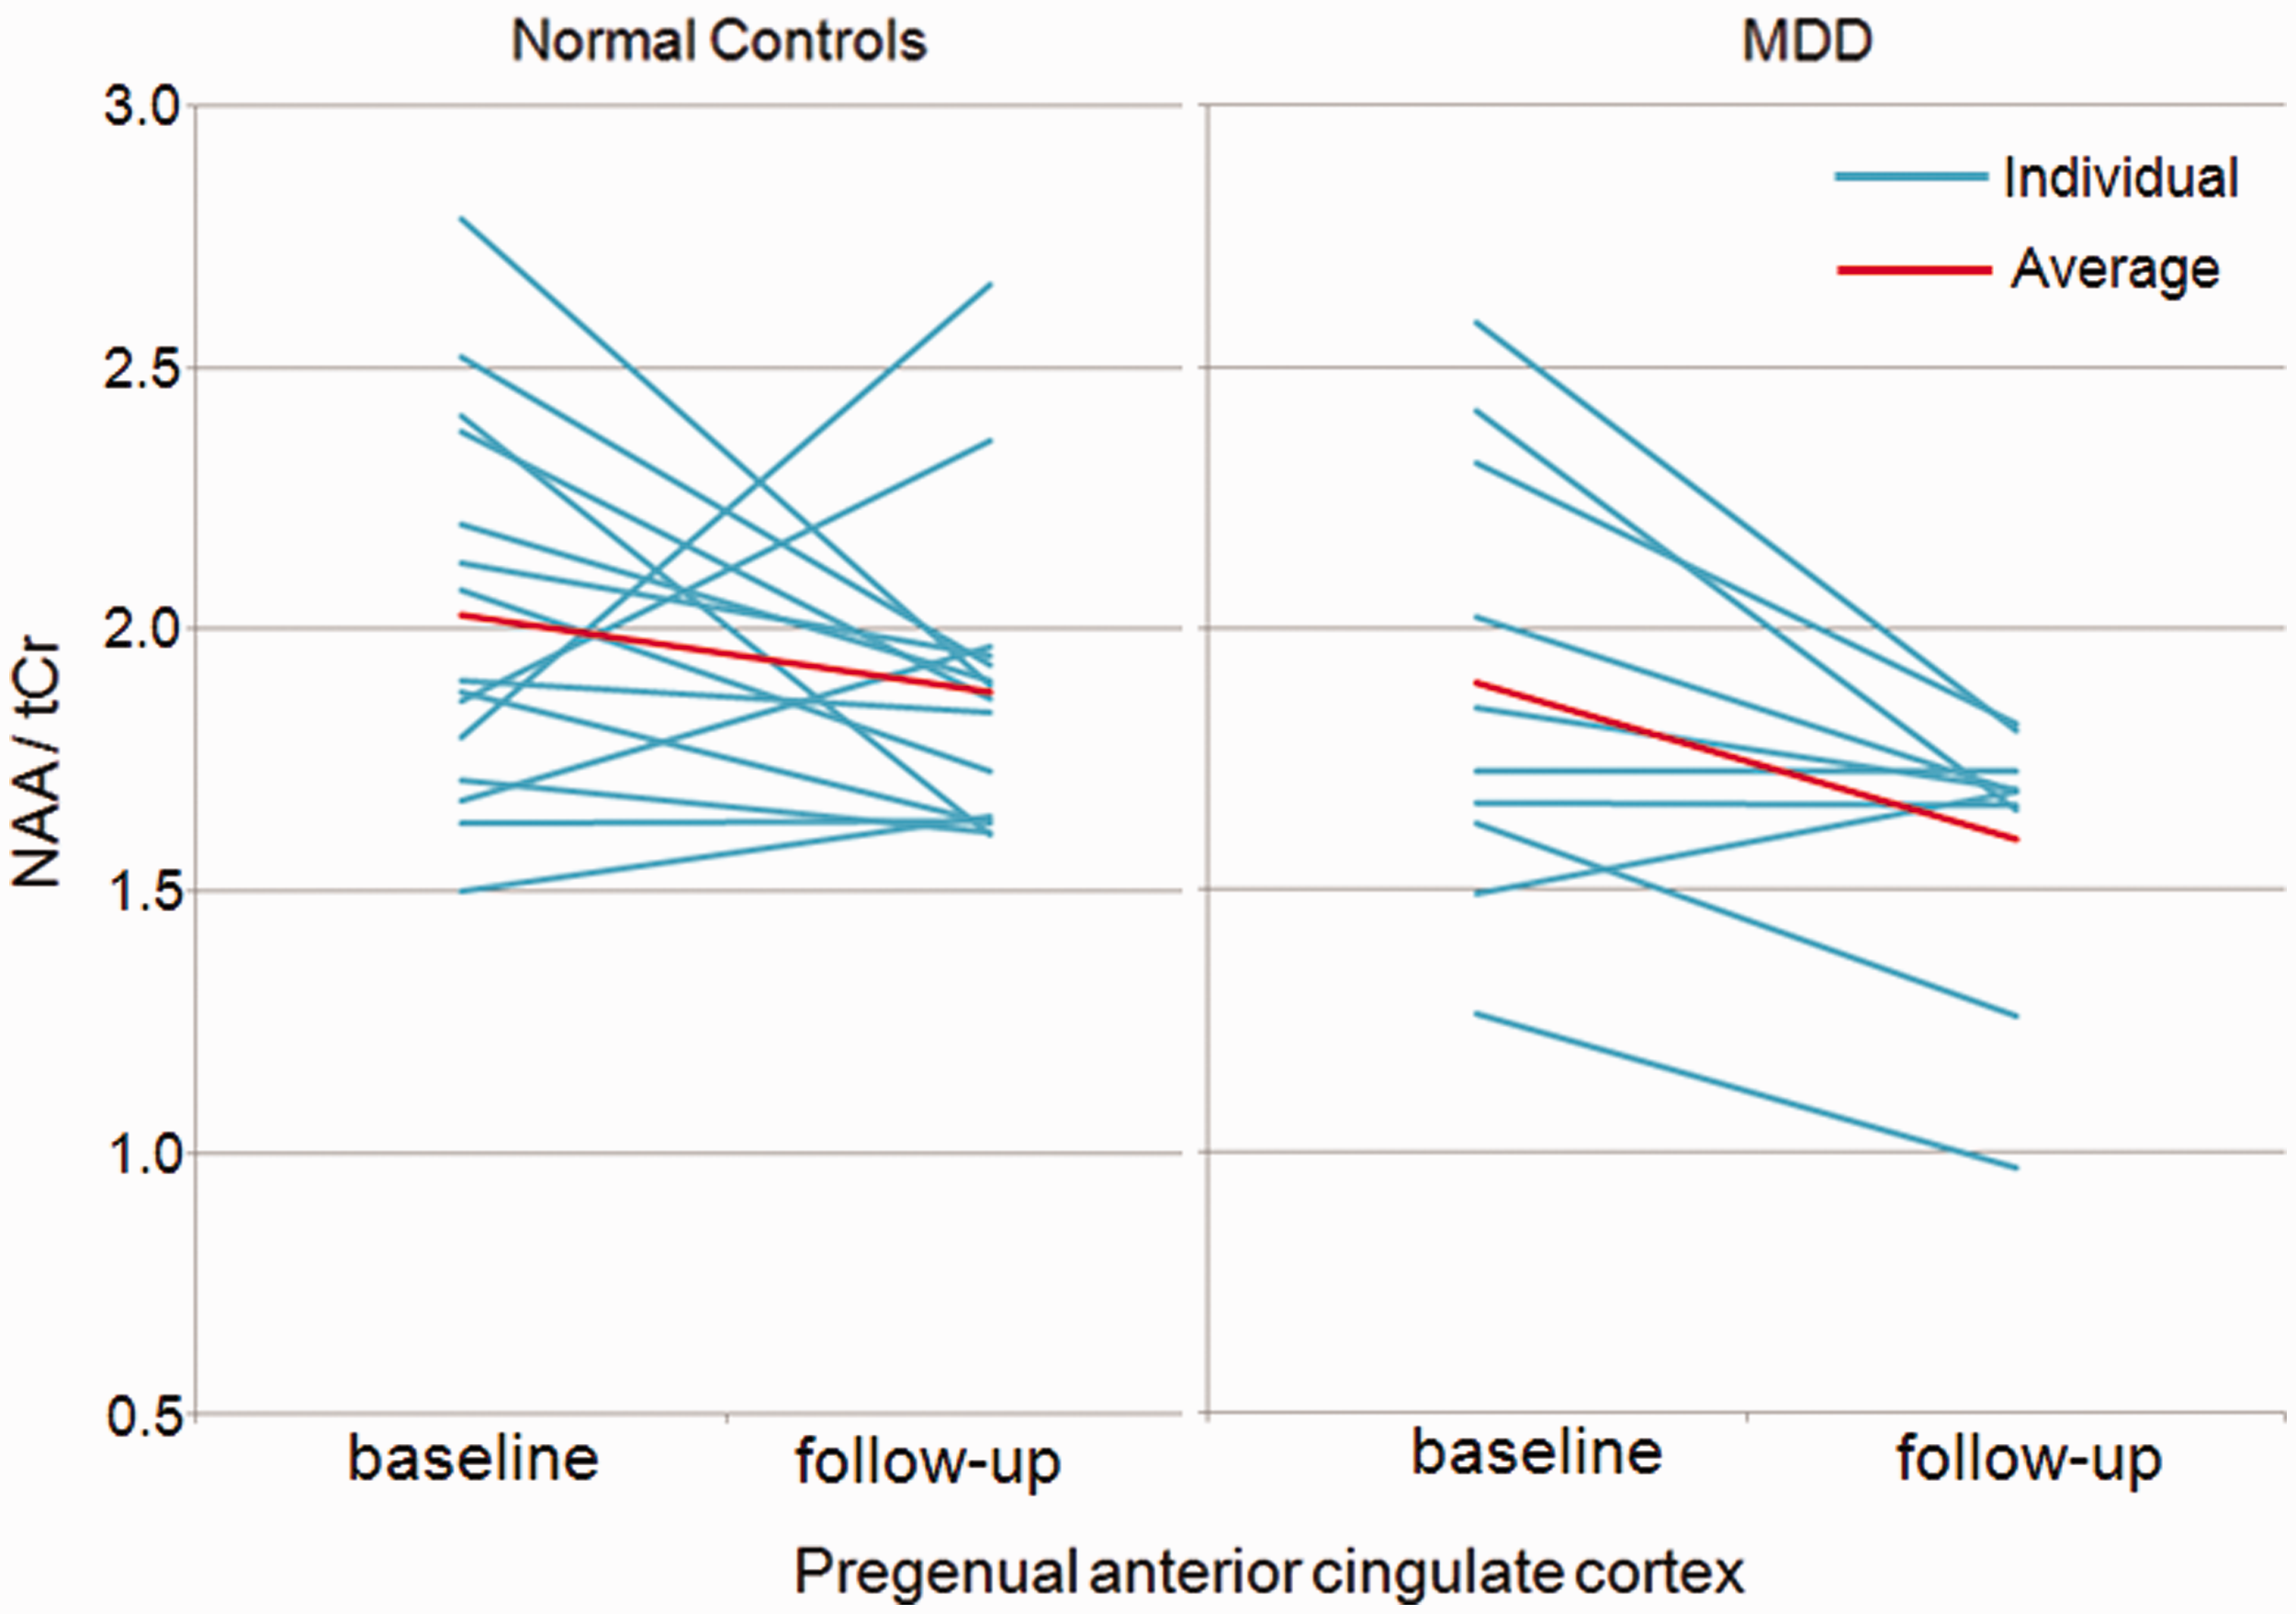
Curve-fitting analysis of MRS revealed a significant logarithmic negative association between illness duration (in months) and the NAA/tCr ratio of the baseline scan (R2 = 0.30, df = 15, P = 0.024, b1 = 2.45, b0 = −0.14), but the linear relation was not significant (R2 = 0.11, df = 15, P = 0.118, b1 = 1.99, b0 = −0.001) (Fig.4). This logarithmic relation was not observed in the follow-up scan (R2 = 0.27, df = 8, P = 0.12, b1 = 2.03, b0 = −0.11). Illness duration was positively correlated with the age of patients with MDD (r = 0.56; P = 0.022), and the NAA/tCr ratio was also associated with the age of these patients (linear correlation, R2 = 0.32, df = 17, P = 0.011, b1 = −0.012, b0 = 2.36, logarithmic correlation, R2 = 0.34, df = 17, P = 0.009, b1 = −0.40, b0 = 3.33). However, in normal controls, no linear or logarithmic association (linear correlation, R2 = 0.032, df = 24, P = 0.383, b1 = −0.007, b0 = 2.27, logarithmic correlation, R2 = 0.025, df = 24, P = 0.437, b1 = −0.233, b0 = 2.84) between the age and NAA/tCr ratio was observed. Thus, apparently no effects of aging were seen on the NAA/tCr ratio in the baseline scan of patients with MDD over the 10 months.
Relationship between the N-acetyl-aspartate (NAA)/creatine + phosphocreatine (tCr) ratio with MDD and illness duration of MDD patients. A logarithmic relation shows a negative association between illness duration (in months) and the NAA/tCr ratio of the baseline scan. Curve-fitting analysis revealed a significant logarithmic negative association between illness duration and the NAA/tCr ratio of the baseline scan (P = 0.024), but linear relation was not significant (P = 0.118).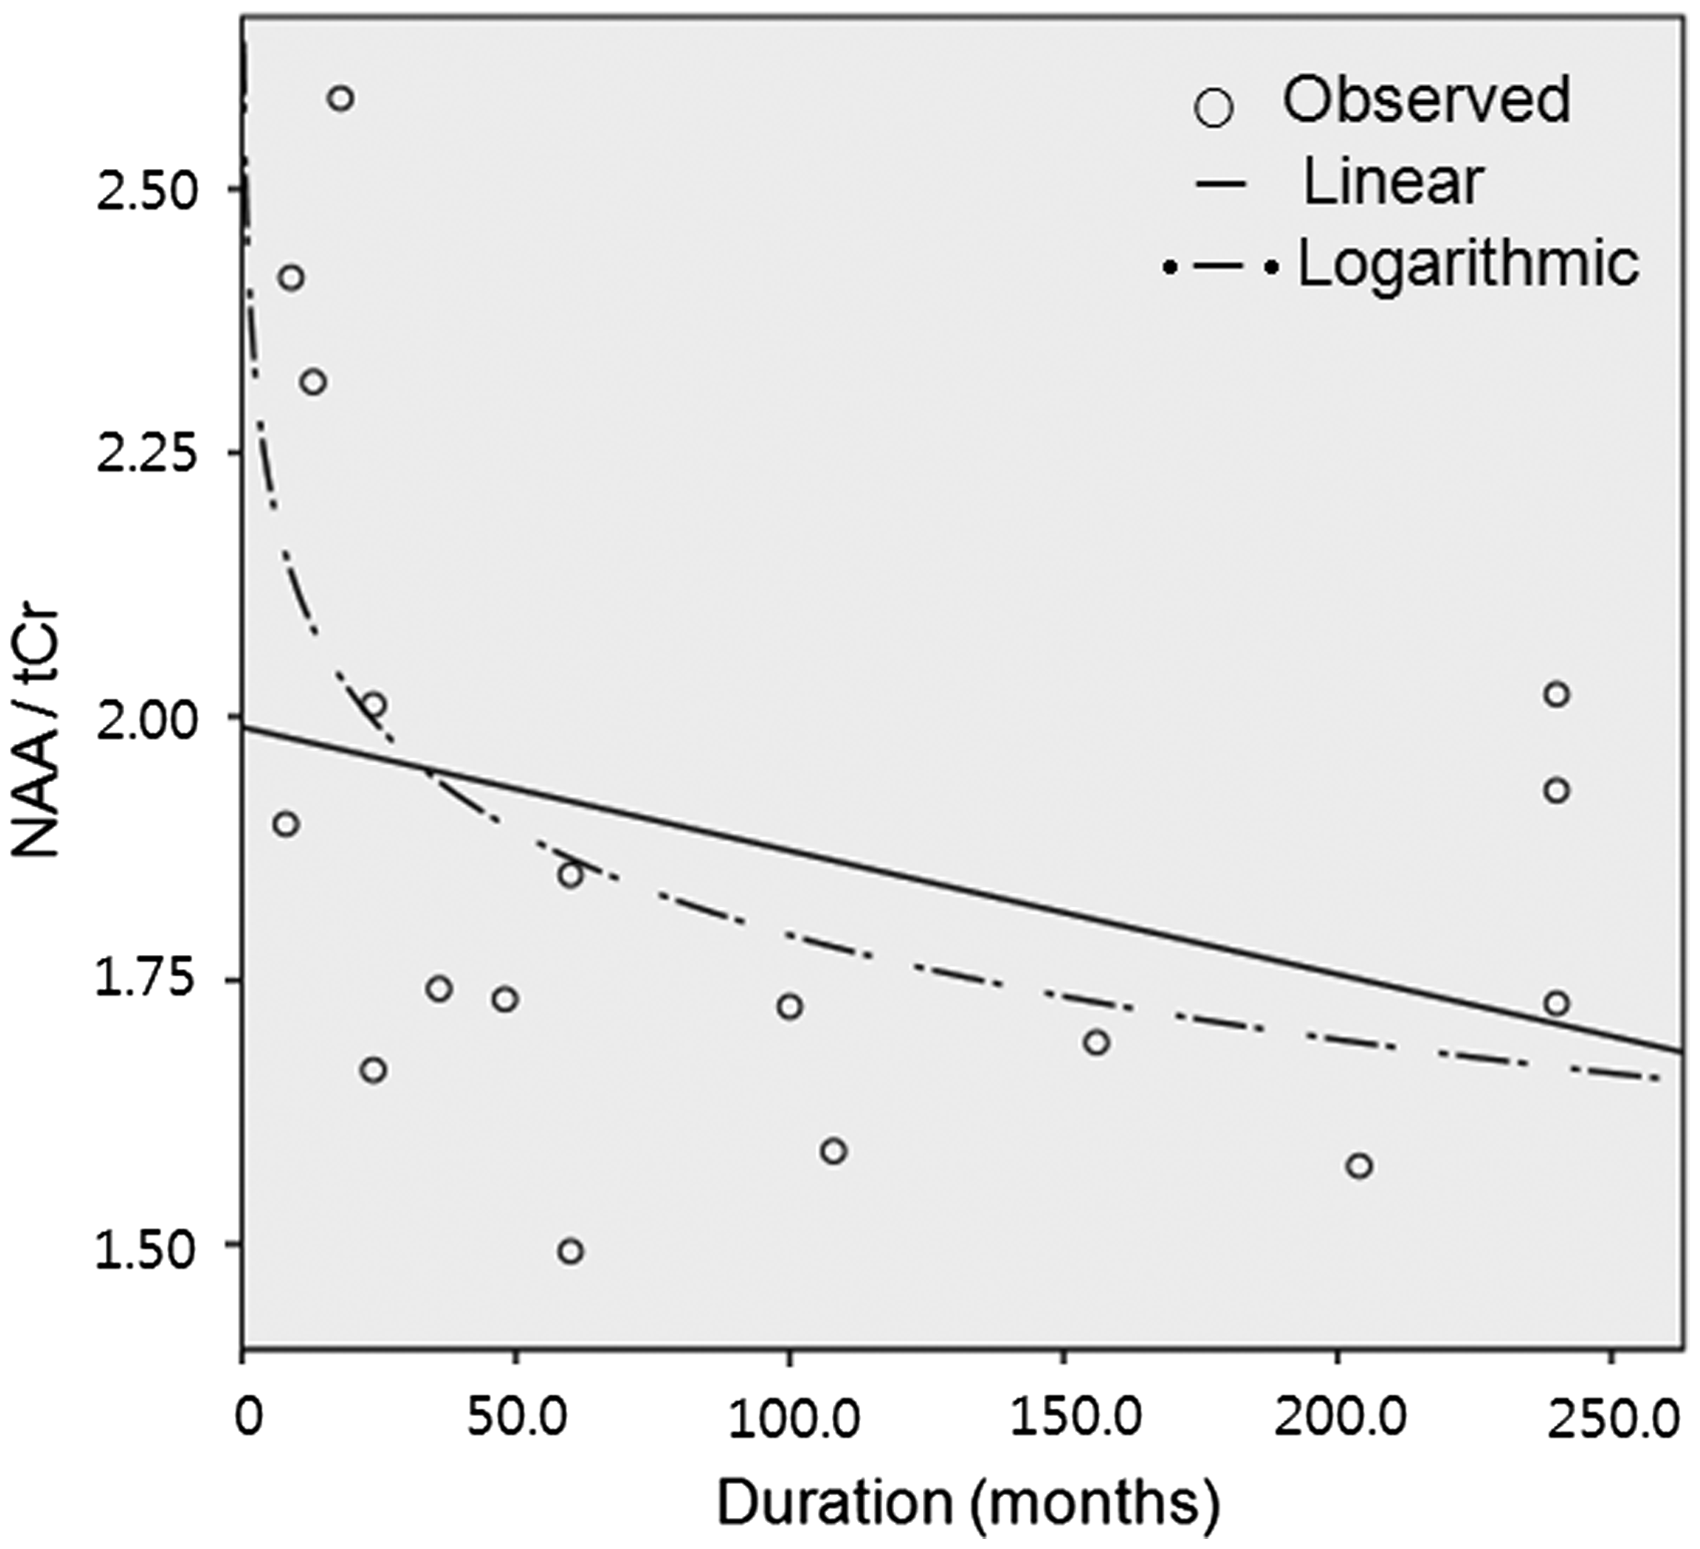
No relationship was observed between the changes in BDI or HDSR scores and the NAA/tCr ratio in either group. Education levels were not correlated with the NAA/tCr ratio differences between baseline and follow-up scans.
Discussion
The pACC is part of the paralimbic region, and functions in adaptive physiological, emotional, and behavioral responses to various stressors from the environment and physiology (20). The pACC is the main focus showing the highest neural activity in happiness among the subregions of the cingulate gyri (21), and it has become known as the “cingulofrontal transition” area, which has functional connections between cingulate cortices and adjacent frontal lobe (22,23). The functional alteration in the ACC has implications for fear conditioning and extinction (24), the ACC has far-reaching afferent connections to amygdala, hippocampus, and sensory cortex (25).
Morphological and histopathologic abnormalities have been confirmed in the ventolateral/orbital prefrontal cortices (PFCs), dorsomedial/dorsal anterolateral PFCs, amygdala, ventral striatum, and raphe nucleus in patients with MDD. Recently, reduced gray matter volumes in the medial prefrontal lobe of patients with subthreshold depression (14), in the ACC of elderly patients with MDD (26), and in the subgenual ACC of drug-naïve female patients with MDD15 have been reported in morphometric studies; these findings indicate reduced neuronal numbers in the ACC. Functional disturbance of the pACC in patients with MDD was revealed by “default-mode network” analysis using functional MRI (27).
NAA is the largest metabolite signal and one of the most abundant amino acids in the central nervous system (28). The decrease in the NAA/tCr ratio is commonly due to non-specific neuronal loss or dysfunction because of various damage (11). To date, studies have performed MRS quantifications on the ACC of adult patients with MDD, and none has reported positive findings of the NAA metabolite in the ACCs of these patients (29–31). Among them, one study reported reduced glutamate, with the implication of pathogenesis in the ACC of patients with MDD (30). In our study, the NAA/tCr ratio in the pACC in patients with MDD did not show a statistically significant difference between the groups on cross-sectional analysis. On longitudinal analysis, our study showed that the NAA/tCr ratio in patients with MDD significantly decreased on the follow-up scan as compared to the initial baseline scan (Fig. 3). Additionally, significantly reduced NAA/tCr ratios were observed in patients with MDD, as compared to normal controls in the between-groups comparison at the follow-up stage. During the follow-up periods, NAA/tCr ratio of MDD was significantly decreased, and there have been some studies reporting atrophy of pACC (14,27). In this study, there was no direct evidence for the structural atrophy, i.e. increasing CSF space in pACC. But there could be neuronal loss causing the concentration changes of metabolites in brain tissues, and these neuronal degenerations could affect large spread of SDs in Table 4.
The progressively decreased NAA/tCr ratio in the pACC of female patients with MDD who showed decreased depressive symptoms in our study occurred despite antidepressant medications. Gonul et al. (13). reported that a significant increase in the NAA/tCr ratio in the left pACC was accompanied by marked reduction in depressive symptoms after antidepressant treatment, apparently contrary to our results. However, some differences exist between the studies. Their patients’ mean age was younger (32.1 years) and the mean illness duration was much shorter (9 months) than those in our study (mean age, 42.0 years; illness duration, 113.2 months; Table 2). Thus, the patients with MDD in our study were in a more chronic state, with multiple depression episodes as compared to the patients in Gonul et al.’s study (13). The patients with MDD in our study were also still at the level of moderate depression even after antidepressant medications, although BDI scores showed significant decreases. Thus, several factors might affect changes in the NAA/tCr ratio in the pACC in a longitudinal study in patients with MDD.
A hippocampus volumetric study revealed the logarithmic association between illness duration and hippocampal volume (6), indicating a rapid hippocampal volume reduction in the early period in the course of the illness. We also observed a similar logarithmic association between illness duration and the NAA/tCr ratio in baseline scans (Fig. 4a); this logarithmic association indicates a rapid decrease of the NAA/tCr ratio in the early stages of MDD. The finding of a rapidly decreasing NAA/tCr ratio in the early period of illness supports the hypotheses of the structural and functional irreversibility of hippocampal changes in the late period of MDD with multiple depression episodes (6). Our study showed that the NAA/tCr ratio decreased rapidly in the early period of the illness, which may partly explain the seemingly different results in Gonul et al.’s study (13) and suggests that clinical intervention might be essential in the early stages of the illness.
Short TE spectra provide a higher SNR and a better possibility to achieve sufficient detection power. However, short TE decreases the efficiency of water suppression and it makes it more difficult to obtain reproducibility of the spectra. The regularized baseline of long TE is flatter than that of short TE, and the good estimations of metabolites could be acquired (32). In the test MRS scan, the spectrum with TE = 144 ms provided more stable lineshape and baseline compared to TE = 35 ms spectrum. For this reason, we adopted TE = 144 ms MRS for the longitudinal MRS study. The use of PRESS sequence in this study would increase SNR compared to Stimulated Echo Acquisition Mode (STEAM) sequence.
Relative quantification yielding concentrations expressed as ratios have been most often used in clinical studies with a reference metabolite of tCr, but this quantification method would be affected by not only numerator but also denominator, or both. Some degenerative diseases such as epilepsy showing the change of tCr level could yield wrong clinical diagnosis, and pathologic changes such as neuronal degeneration or metabolite components change could influence the T1 and T2 relaxation times (33). In a MRS meta-analysis of MDD patients (9), only one study reported increased tCr in the prefrontal white matter among 11 studies, and other studies did not find the changes in tCr concentration. Therefore, the use of tCr as an internal reference metabolite in MDD might be reasonable. Although relative quantification could be useful, absolute quantification could provide the additional diagnostic utility because of its direct measures of metabolites and smaller liability to error (33). Absolute quantification required more technical procedures and high data processing experience such as correction for relaxation and partial volume correction for the CSF amount, but concentration ratios were less sensitive to these effects. The CSF contents in a MRS voxel could vary through the subjects, so the variances of CSF amount in the subjects could affect the metabolite values in various subjects’ MRS voxels. According to a previous study (34), the CSF amount in pACC was about 5% in a MRS voxel, and the percent volume of CSF did not differ between the groups. Although CSF corrected metabolite values was more preferable, CSF uncorrected metabolite values of this study could provide useful physiologic information; in addition, concentration ratios could reduce partial volume effect. A previous technical review paper on MRS in mood disorder (10) showed that 24 of 64 studies did not correct for CSF content, thus, although CSF correction is a preferable method in MRS analysis, it seems not obligatory for clinical MRS studies.
Our study has several limitations. First, the enrolled patients were all female patients. Second, the absolute metabolite levels were not corrected for the amount of CSF in a MRS voxel. Third, the follow-up periods of this exploratory study were about 10 months and the number of patients was small; furthermore, we only revealed one factor, illness duration, affecting the NAA/tCr ratio. To confirm the results of this study, further investigations on other factors that may be involved in NAA/tCr ratio degeneration are needed, along with longer follow-up periods and larger data samples.
In conclusion, this study demonstrated a progressive decrease in the NAA/tCr ratio in the pACC of female patients with MDD who had slightly improved depressive symptoms. The NAA/tCr ratio of pACC decreased at the greatest rate in the early period after illness onset. This suggests progressive neuronal degeneration and dysfunction in the pACC in the medicated female patients and also indicates the importance of clinical intervention in the early stages of MDD.
Footnotes
Funding
This work was supported by the Korea Science and Engineering Foundation (KOSEF) grant funded by the Korea government (MEST) (No. 20090091346) and by 2013 Kangwon National University Hospital Grant.