



Abstract
Background
Diffusion-weighted magnetic resonance imaging (DW-MRI) permits non-invasive assessment of tumor characteristics.
Purpose
To assess the value of DW-MRI as a potential non-invasive marker of tumor aggressiveness in rectal cancer by analyzing the relationship between tumoral apparent diffusion coefficient (ADC) values of MRI and histopathologic prognostic parameters that are not affected by preoperative chemoradiation therapy.
Material and Methods
Forty patients with rectal cancer were assessed with primary staging 3-T MRI, including DWI, before undergoing surgical therapy. In all patients, surgery was performed without neoadjuvant therapy. Mean tumor ADC was measured and compared between subgroups based on pretreatment carcinoembryonic antigen (CEA) levels, MRI parameters (e.g. postoperative local recurrence), and histopathologic parameters, including A (invasive distance: A1, T-stage; A2, mesorectal fascia [MRF] status), B (differentiation grade: B1, poorly differentiated; B2, moderately differentiated; B3, well differentiated), C (others: C1, N-stage; C2, lymphangiovascular invasion).
Results
Mean tumor ADCs were different when comparing groups stratified by histologic differentiation grades (P = 0.0192). There was no significant difference in mean ADCs when stratifying patients according to CEA levels, T-stage, N-stage, MRF status, presence of lymphangiovascular invasion, or the presence of local recurrence.
Conclusion
Significant correlations were found between mean ADC values and differentiation grade. ADC may be useful as an imaging biomarker of tumor aggressiveness, but it cannot serve as an independent biomarker of advanced rectal cancer.
Introduction
Due to its ability to detect and characterize tumors, diffusion-weighted imaging (DWI) is increasingly incorporated into standard magnetic resonance imaging (MRI) protocols for tumor imaging (1–4). DWI measures water diffusion characteristics, which are dependent on multiple factors, such as cell density, vascularity, viscosity of extracellular fluid, and cell membrane integrity (5). DWI could potentially be used as an imaging biomarker for prognostic purposes (6–10).
Determination of prognosis in patients with rectal cancer has traditionally been achieved via histologic evaluation, including the degree of tumor invasion into and beyond the bowel wall (11,12), the number of lymph nodes involved (13,14), and involvement of the mesorectal fascia (MRF) (15), which can also be assessed by preoperative MRI (16,17). Other factors with proven prognostic importance include the plasma carcinoembryonic antigen (CEA) level and histologic factors, such as the tumor differentiation grade or the presence of lymphangiovascular invasion (LVI) (18–20).
A recent study (21) reported that the apparent diffusion coefficient (ADC) might be useful as an imaging biomarker of tumor aggressiveness. However, that study was unable to compare the prognostic utility of initial histologic status versus ADC value, because some patients had undergone preoperative chemoradiation. In contrast to Western countries, most patients in Japan with rectal cancer do not undergo preoperative chemoradiation, mainly because radiation oncologists and medical physicists are in short supply in Japan. In fact, about 62% of all radiation therapy facilities have fewer than one full-time equivalent radiation oncologist (22). Further, some surgeons find it useful to avoid tissue fibrosis induced by preoperative therapy that would otherwise make it difficult to dissect lymph nodes, including the lateral pelvic nodes. Therefore, study of a Japanese population enables comparison of the prognostic utility of ADC versus the initial tumor profile in patients with advanced rectal cancer.
The aggressiveness of rectal tumors can be expressed in different manners, including the T stage, N stage, MRF involvement, CEA levels, differentiation grade of the tumor, the presence of LVI, and the presence of local recurrence (11–15,18–20,23–25). The goal of this study was to evaluate the ability of the ADC value (measured with 3-T MRI) as an imaging biomarker when compared with conventional histologic prognostic factors in patients with advanced rectal cancer. To evaluate the histologic data in greater detail, the resected specimen was sectioned transversely stepwise at 3-mm intervals.
Material and Methods
Patients
Between April 2007 and September 2012, 103 consecutive patients were considered for inclusion in this retrospective study. Inclusion criteria were: (i) histologically (biopsy) proven rectal adenocarcinoma; (ii) treatment by surgical resection without neoadjuvant therapy; (iii) availability of pathology reports of surgical specimens mentioning tumor differentiation grade, T-staging, N-staging, MRF status, and LVI; and (iv) availability of primary staging MRI, including DWI. Patients with predominantly mucinous appearing tumors on the histologic evaluation of the resected specimen were excluded (26).
Clinical and imaging data were retrieved from a patient database that was constructed following approval from a local institutional ethics committee and following provision of written, informed consent by all patients. Sixty-three patients were excluded from the study, including 48 patients who did not undergo MRI, 11 patients who underwent preoperative chemotherapy, two patients with predominantly mucinous tumors on the histologic evaluation of the surgical specimen, one patient with concomitant Paget’s disease of the anal canal in close proximity to the rectal tumor, and one patient with severe artifacts on MRI due to a metallic hip prosthesis. Thus, the final study population consisted of 40 patients (28 men, 12 women), with a median age of 68 years (range, 45–92 years). All of these patients did not undergo neoadjuvant therapy.
MRI
The primary staging MRI was performed before neoadjuvant and surgical therapy. Patients were imaged with a 3-T MR magnet (Siemens, Erlangen, Germany) using a phased array body coil. The imaging protocol consisted of standard T2-weighted (T2W) fast spin echo in three orthogonal directions, which were used for clinical staging (repetition time/echo train time [TR/TE], 3500/87 ms; flip angle, 150°; echo train length, 7; number of signals averaged (NSA), 2; field of view [FOV], 380 mm; matrix size, 386 × 384; slice thickness, 6 mm; number of slices, 20). In addition, an axial diffusion-weighted sequence with background body signal suppression (DWIBS; b-values, 0, 1000 s/mm2; TR/TE, 4000/80 ms; NSA, 8; FOV, 195 mm; matrix size, 83 × 128; slice thickness, 7 mm; number of slices, 20) and an axial T1-weighted gradient-echo sequence (TR/TE, 700/12 ms; NSA, 2; FOV, 240 mm; matrix size, 288 × 384; slice thickness, 7 mm; number of slices, 20) were used, based on previous reports from the participating centers (27–29). All axial sequences were angled in identical planes, perpendicular to the tumor axis as identified on sagittal MRI. The T2W coronal sequence was angled parallel to the tumor axis. Patients were injected with 40 mg butylscopolammonium bromide intravenously to reduce intestinal motion artifacts. They did not undergo bowel preparation in order to avoid rectal distention before the MRI examination.
ADC maps in grayscale were automatically generated using a mono-exponential decay model including both b-values.
ADC evaluation
MR images were analyzed by a surgeon with 9 years of experience in treating rectal cancer (MA) and a board-certified radiologist (MD) with a PhD (HI) with 20 years of specific experience in reading rectal MRI examinations. Both evaluators were blinded to the clinical patient data and pathology reports.
Mean ADC was calculated from a sample of three round/oval-shaped regions of interest (ROIs) that were manually placed within solid tumor parts (identified as focal masses showing intermediate signal intensity on the anatomical T2W images, and locating rectal wall via anatomical colonoscopy and barium enema) of one or two tumor-containing slices. The size and position of the ROIs were chosen to include as much of the solid tumor area as possible.
Histologic evaluation
Total mesorectal excision was performed by one of four dedicated colorectal surgeons (YN, KS, YK, HN), and the fresh specimens were transported directly to the pathology laboratory. Specimens were opened arterially to the upper border of the mesorectum and at least 20 mm above the tumor. Each specimen was pinned to a corkboard and immersed in buffered formalin saline for at least 72 h. Pathologic evaluation was performed by one pathologist (MA) with 4 years of experience. The total mesorectal excisional specimen was sectioned transversely stepwise at 3-mm intervals. The slices were laid out and photographed. This method enabled accurate evaluation of tumor histology, outside invasion of the rectal wall, MRF invasion, lymph node metastasis, and LVI.
Prognostic factors
Clinical, radiologic, and histologic prognostic factors were derived from the clinical patient database. Clinical factors included the plasma CEA level (ng/mL) at the time of diagnosis and the presence or absence of local recurrence after surgery. The following parameters were retrieved from histologic evaluation after surgical resection: pT stage (pT1-2, T3, T4) and pN stage (pN0, N1, N2) (both of which were assessed according to the Sixth American Joint Committee on Cancer TNM staging system), MRF status (free or involved), tumor differentiation grade, and LVI. Differentiation grade of the tumor was scored by the following grades used in our institution: 1, poorly differentiated; 2, moderately differentiated; and 3, well differentiated. LVI was recorded as absent or present.
For T3 tumors showing extramural growth, the distance in mm from the muscular layer to the outermost part of the tumor was also measured on the histologic evaluation data.
Statistical analysis
Statistical analysis was performed using JMP version 8.0 (SAS Institute, Inc., Cary, NC, USA). Student’s t-tests (independent-samples t-test) were used to assess differences between means of the following groups: CEA < 5 ng/mL versus > 5 ng/mL (threshold used in our institution); pT1-2 (tumor limited to the bowel wall) versus pT3-4 (tumor beyond bowel wall); pN0 versus pN1-2 (N+); MRF-free versus MRF-invaded; LVI absent versus LVI present; and local recurrence absent versus present. A one-way analysis of variance (ANOVA) followed by the post hoc Tukey’s test was used to test differences in ADC values among the three predefined differentiation grade groups.
Correlations between pretreatment ADC values and the distance from the muscular layer to the outermost part of the tumor at histologic staging after surgical resection were investigated via determination of the Pearson correlation coefficient.
For all analyses, a P value < 0.05 was considered significant.
Results
Treatment characteristics
All 40 patients underwent immediate surgery. Surgery consisted of a low anterior resection (n = 27), abdominoperineal resection (n = 6), extended resection (n = 4), or Hartmann resection (n = 3).
The median time interval between the primary staging MRI and surgery was 21 days (range, 1–66 days) for all patients.
Clinical and radiologic findings
At the time of diagnosis, 18 patients had CEA levels <5 ng/mL, and 21 patients had CEA levels ≥5 ng/mL. The baseline CEA value was not available in one patient.
Regarding MRI-based findings, seven patients had distant metastasis, two patients had lung metastasis, three patients had liver metastasis, and two patients had lung and liver metastases. The mean follow-up time after surgical resection was 34.5 months. Thirteen patients had local recurrence after surgical resection, with a mean period of recurrence of 11.8 months.
Histopathologic findings
Analysis of the surgical specimens showed nine poorly differentiated tumors, 22 moderately differentiated tumors, and nine well differentiated tumors. LVI invasion was absent in nine patients and present in 31 patients. Nine patients had tumors limited to the rectal wall (T1 or T2), while the remaining 31 had T3 or T4 tumors. Fourteen patients were staged as N0, while 26 had positive nodal disease (N1 or N2). The MRF was not involved in 25 patients and involved in the remaining 15 patients.
Relationships between ADC and prognostic factors
The mean ADC for the whole patient population was 0.893 ± 0.099 × 10⁻³ mm2/s. Table 1 shows the differences in pretreatment tumor ADC values stratified according to different subgroups. Mean ADC was significantly different when stratified according to tumor differentiation grades (P = 0.0192). Fig. 1 shows measurement examples of ADC value. In a less aggressive lesion (a–c), which was limited to the bowel wall without mesorectal lymph nodes and moderately to well differentiated tumor, the ADC value (0.88 × 10⁻³ mm2/s) was higher than that in a more aggressive neoplasm (d–f) staged as T3N1 and moderately to poorly differentiated (ADC value = 0.78 × 10⁻³ mm2/s).
Example of manual placement of an oval-shaped ROI for measurement of the ADC values for each tumor on the ADC map (a, d). ADC measurement in tumors of different aggressiveness (a–f). In a less aggressive lesion ((a) ADC map; (b) b = 1000 s/mm2 image; (c) T2W image), which is limited to the bowel wall without mesorectal lymph nodes and moderately to well differentiated tumor, the ADC value (0.88 × 10⁻³ mm2/s) is higher than that in a more aggressive neoplasm ((d) ADC map; (e) b = 1000 s/mm2 image; (f) T2W image) staged as T3N1 and moderately to poorly differentiated (ADC value = 0.78 × 10⁻³ mm2/s). The differences in pretreatment tumor ADC values stratified according to different subgroups. ADC values given in mm2/s × 10−3. In one patient, the baseline CEA value was not determined. Independent-sample t-test. One-way analysis of variance. In seven patients, the postoperative follow-up time was <15 months. ADC, apparent diffusion coefficient; CEA, carcinoembryonic antigen; LVI, lymphangiovascular invasion; MRF, mesorectal fascia; p, pathological; SD, standard deviation.
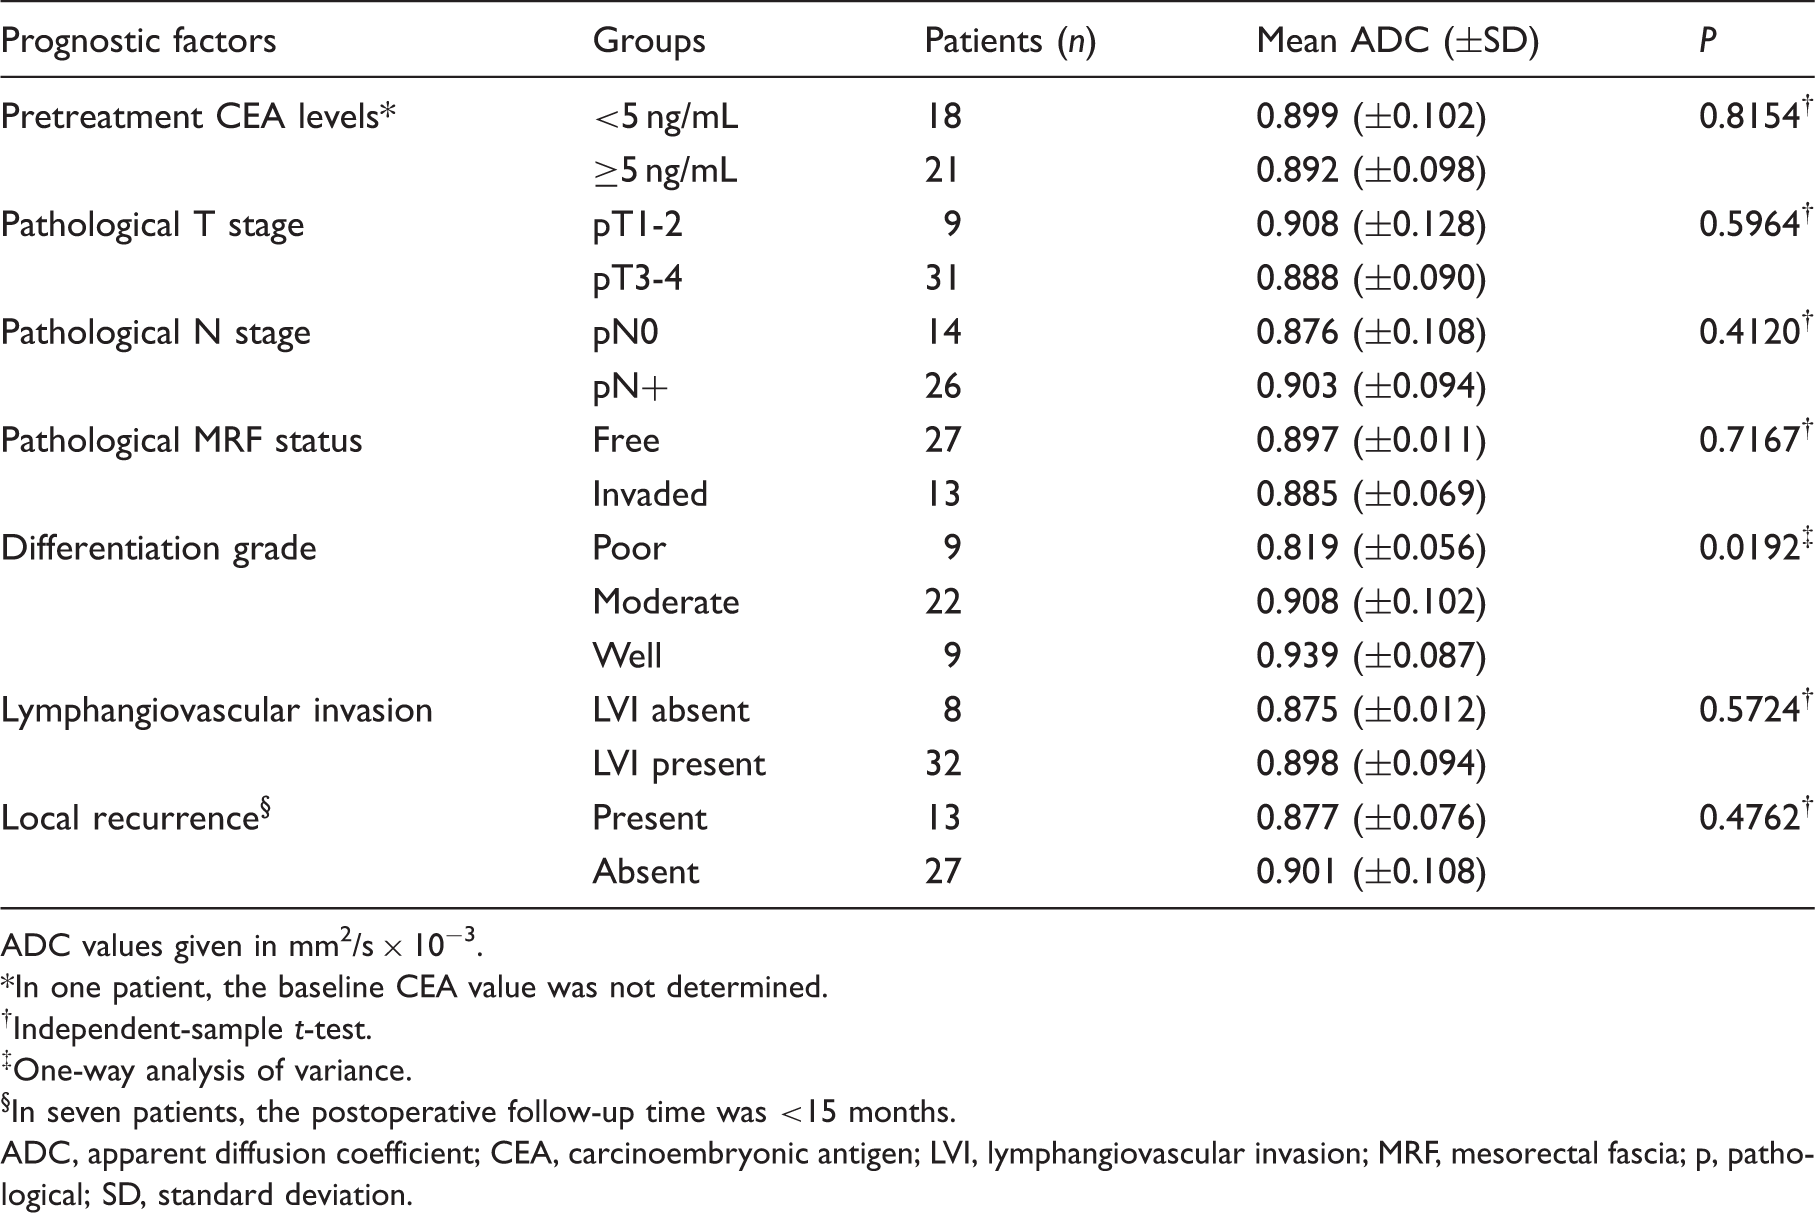
The relationship between ADC values and the different histologic tumor differentiation grades is shown in Fig. 2. Tukey’s post hoc test showed that the mean ADCs between poorly differentiated and well differentiated tumors differed significantly (P = 0.0208). A similar (but not significant) difference was seen when comparing poorly differentiated and moderately differentiated tumors (P = 0.0503).The mean ADC was also different when stratifying according to MRF status, T stage, CEA levels, and local recurrence on follow-up MRI, with poor prognostic factors (lesions growing beyond the rectal wall and invading into the MRF, CEA levels ≥5 ng/mL, and tumor with local recurrence) showing lower ADCs, but these differences were not significant.
Comparison of mean ADC values of tumors by histologic differentiation grade. The whiskers represent the standard deviation. Tukey’s post hoc test shows that the mean ADCs between poorly differentiated and well differentiated tumors differ significantly (P = 0.0208). A similar (but not significant) difference is seen when comparing poorly differentiated and moderately differentiated tumors (P = 0.0503).
A non-significant correlation (r = 0.011; P = 0.5728) was seen between ADC values and the distance from the muscular layer to the outermost part of the tumor (Table 1).
Discussion
This study showed a significant correlation between ADC values and tumor differentiation grade. There was no significant correlation between ADC and T stage, N stage, presence of LVI, presence of MRF invasion, pretreatment CEA levels, presence of postoperative local recurrence, or the distance from the muscular layer to the outermost part of the tumor.
This is the second study to describe a correlation between clinical and preoperative prognostic factors and ADC values in patients with advanced rectal cancer, while it is the first study to describe a correlation using 3-T MRI. Luis et al. published a similar study using 1.5-T MRI in 2012 (21). The results of their study demonstrated significant correlations between ADC values and the tumor differentiation grade on histology and the MRF status and nodal status on MRI. The results of the present study are consistent with their result about the tumor differentiation grade. In contrast, the present results are not consistent with their results about the MRF status and nodal status. One reason for such inconsistency may be that the MRF status and nodal status were analyzed with 3-mm sectioned histologic planes. These histologic analyses enabled detection of micrometastases in small lymph nodes below 3 mm in size and microinvasion of MRF that are not detected with MRI. The result of the present histologic evaluation demonstrated that the mean number of resected lymph nodes was 27, 70% of nodes was <3 mm, and 11% of these small nodes had cancer metastases.
In the present study, all 40 patients did not undergo preoperative chemoradiation. The mean duration from the initial MRI to surgery was 21 days. It was possible to compare the histologic data unaffected by chemoradiation therapy. Furthermore, 3-T MRI enabled higher contrast DWI than lower resolution MRI (30,31).
Recent studies have suggested that tumor activity is somewhat related to the ADC value in patients with advanced cancers (6–10). When compared with biopsy, which is invasive and only characterizes a small portion of the tumor, the ADC value is a noninvasive assessment of the entire nature of the tumor. Tumor tissues contain some interstitial regions. The interstitial regions of tumors can also contain edema, inflammatory cell infiltration, fibrosis, abscess formation, necrosis, small vessels, and mucin produced by cancer cells; all of these factors may affect the diffusion of water molecules. Indeed, Yoshikawa et al. (32) reported that there was a significant correlation between the ADC value and breast cancer histology type, but there was no correlation between the ADC value and breast cancer cell density. They concluded that the ADC value of breast cancer was affected by not only the cancer cell density, but also the entire organized cell density, including the stroma of the breast. Kiryu et al. evaluated the inflammatory activity of Crohn’s disease with DWI in 2009 (33) and reported that the ADC value was 2.31 in the colon wall with non-active disease and 1.52 in the colon wall with active disease. Another study showed that the mean ADC value was 1.47 in the colon wall without disease, 1.21 in the colon wall with active inflammatory bowel disease (IBD), and 0.97 in the colon wall with adenocarcinoma (34). This suggests that interstitial inflammatory infiltration reduces the ADC value in the colon and that lymphocytic infiltration into the cancer tissue stroma may further reduce the ADC value of colon cancer.
In the present study, some patients with well differentiated adenocarcinoma had a lower ADC value when compared with the ADC value of other patients with the same differentiation grade adenocarcinoma. These lower ADC cases had more fibroblasts, lymphocytes, plasmacytes, and neutrophils in the interstitial space of the tumor than other patients (Fig. 3). Several studies have reported that tissue fibrosis is associated with lower ADC values in patients with liver or esophageal cancer (35,36). In the present study, some cases had marked interstitial fibrosis.
Cases A and B were diagnosed as well differentiated adenocarcinoma. (a) Case A: the ADC value is 1.105, which is higher than the average ADC value (0.939 ± 0.087) of well differentiated cases. (b) Case B: the ADC value is 0.758, which is extremely low. This may be due to the presence of many fibroblasts, lymphocytes, plasmacytes, and neutrophils in the interstitial space of cancer glands.
Some of the inflammatory infiltrating cells in cancer tissue are tumor-infiltrating lymphocytes (TILs). The presence of TILs is associated with improved outcomes in patients with cancer. In a review of 52 studies of cancers with TILs, colorectal cancer was the most common kind of cancer within the study population (37), and the presence of TILs resulted in a moderate improvement in outcomes. A similar finding was reported by Won-Suk et al. (38). TILs are considered to inhibit cancer cell invasion and metastasis. In the present study, immunohistochemical analysis was not performed to distinguish between TILs and other inflammatory cells. However, it was possible that there were some cases with TIL infiltration. One reason why there was no significant correlation between ADC values and some prognostic factors in the present study may be that ADC values with 3-T MRI could not reveal the state of cancer interstitial tissue containing inflammatory cells, including TILs.
The present study had some limitations. First, this study was retrospective in nature. Second, the measurements were obtained by measuring three sample ROIs from 20 slices with 7-mm slice thickness on DWI. Although this sampling may not fully represent the overall tumor (39), an effort was made to identify the position of tumor accurately using findings from colonoscopy and barium enema studies. Third, the patient population included relatively few patients with rectal cancer. Fourth, the mean follow-up time was 34.5 months (range, 1–63 months). Therefore outcome parameters, such as disease-free or overall survival, could not be calculated. Further studies using a larger patient cohort and a longer follow-up period are necessary to evaluate the correlation between histologic parameters and the ADC value.
In conclusion, there was a significant correlation between mean ADC values using 3-T MRI and the differentiation grade of advanced rectal cancer. While the ADC value may convey some prognostic important information about advanced rectal cancer, it is not sufficiently robust from a prognostic standpoint to replace biopsy or pathologic data. Further studies are required to evaluate the effect of the tumor and its stroma on the utility of the ADC value.
Footnotes
Funding
This research received no specific grant from any funding agency in the public, commercial, or not-for-profit sectors.