
Abstract
Background
Multiple myeloma (MM) is a hematologic malignancy characterized by the clonal proliferation of plasma cells. Accurate staging is of pivotal importance in the management of MM. Advanced imaging techniques, such as magnetic resonance imaging (MRI), are increasingly used for the initial diagnosis and staging of MM.
Purpose
To compare whole-body (WB) MR diffusion-weighted imaging with background body signal suppression (DWIBS) with (WB) MR fat-suppressed T1-weighted contrast-enhanced imaging (T1-CE) in the pre-treatment staging evaluation of multiple myeloma (MM) patients.
Material and Methods
Thirty-six patients with MM were included in the study. T1-CE and DWIBS were performed using a 3 T scanner. The Durie-Salmon plus staging system was used. Kappa statistics was used to assess agreement.
Results
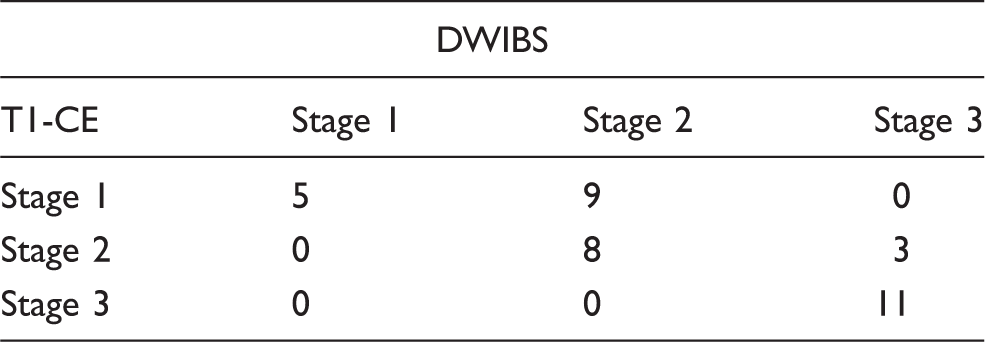
For all MM stages good to very good agreement was found for both T1-CE and DWIBS. The unweighted kappa statistic indicated a moderate, good and very good agreement between T1-CE and DWIBS for stages I, II, and III, respectively. In particular, in 67% of patients the MM staging according to T1-CE was not different from DWIBS. In the remaining 33% of patients, the MM stage obtained with T1-CE was lower than that provided by DWIBS.
Conclusion
DWIBS and T1-CE were concordant in the majority of patients. In a minority of cases DWIBS evidenced areas of water restriction that did not correspond to contrast enhancement areas. Studies monitoring therapeutic response in relation to tumour burden and aggressiveness should be performed to assess the clinical relevance of DWIBS findings.
Keywords
Introduction
Multiple myeloma (MM) is a malignant lymphoproliferative B-cell disease characterized by the accumulation of monoclonal plasma cells in the bone marrow and development of skeletal complications in more than 80% of patients (1). Accurate staging is of pivotal importance in the management of MM (2). Serum urine markers of disease as well as conventional radiography are currently used to stage MM patients. In particular, conventional radiography is still the standard imaging staging procedure for newly diagnosed and relapsed MM. However, magnetic resonance imaging (MRI) techniques are rapidly gaining importance in the pre-treatment staging evaluation of MM patients (3). Different whole-body (WB) MR sequences are performed according to the local standards of the imaging departments (4,5). In particular, contrast-enhanced T1-weighted contrast-enhanced (T1-CE) MR sequence has proven its validity in providing data that allow to quantify bone marrow involvement in MM (6,7). However, contrast media are potentially hazardous in patients with multiple myeloma, due to impaired renal function. Among the possible alternatives to contrast studies, diffusion-weighted imaging with background body signal suppression (DWIBS) is a recently developed WB MR sequence based on DWI. DWIBS is a promising MR sequence that may quantitatively evaluate tissue cellularity by measuring random movements of water molecules using the apparent diffusion coefficient map, which may potentially serve as a radiological biomarker of tumor-related hypercellularity (8). This characteristic has suggested the possible clinical applicability of DWIBS in intra-individual disease monitoring during follow-up of MM patients (9,10). To date, there are no published studies comparing DWIBS to T1-CE sequence in the diagnostic work-up of MM patients. The aim of our study was to compare DWIBS to WB fat-suppressed T1-CE imaging in the pre-treatment staging of MM patients.
Material and Methods
Thirty-six consecutive patients with biopsy proven MM (14 women [age range, 52–75 years; mean age, 63 years] and 22 men [age range, 54–74 years; mean age, 65 years]) were prospectively included in this study. According to the International Staging System (ISS), 27 patients had stage I disease and nine had stage 2 disease. MM was diagnosed according to the criteria of the International Myeloma Working Group (11). Criteria to include individuals into this study were no previous chemotherapy. Informed consent was obtained for all subjects. The study was approved by our institutional review board.
Imaging protocol
WB-MRI was performed with a 3.0 T MR scanner (Achieva, Philips Healthcare, Best, The Netherlands), 80 mT/m maximum amplitude, 0.16 ms minimal rise time, 200 T/m/s maximum slew rate) with patient in supine feet-first position, covering the entire body as a matrix with a maximal longitudinal field of view (FOV) of 200 cm, in combination with automated table movement. WB images were obtained with multiple stacks acquisitions (seven or eight overlapped stacks depending on body height, as follow: head/neck, thorax, abdomen, pelvis, thighs), using Q-body coil for signal receiving and transmitting. The WB-MRI protocol consisted of DWIBS sequence and fat-suppressed three-dimensional (3D) contrast-enhanced T1-weighted (T1-CE) sequence. DWIBS images were acquired using single-shot echo-planar imaging (EPI) sequences with a short time inversion recovery (STIR) pre-pulse for fat suppression (FOV, 375–390; TR/TE/flip angle, Shortest/260°; slice thickness/interslice gap, 4/2 mm; matrix, 256; NSA, 6). Sixty slices each stack (n = 4: head/neck; thorax; abdomen; pelvis and proximal femur) were obtained using free-breathing technique on axial plane; motion probing gradients in three orthogonal axes were applied for two b values, 0 and 1000 s/mm2. DWIBS images were reformatted in the coronal plane. Fat-suppressed 3D T1-CE sequence (FOV, 395; TR/TE/flip angle, 1.8/2.4/10°; slice thickness/interslice gap, 4/2 mm; matrix/voxel size, 154 × 256/1.13 mm3; NSA, 2) was performed in the coronal plane before and after the administration of 0.2 mmol/kg gadopentetate dimeglumine, Gd-DTPA, (Magnevist, Bayer Schering Pharma AG, Berlin, Germany), injected into the antecubital vein (3 mL/s flow rate) followed by 20 mL saline solution using an automated injector (Spectris MR, Medrad Inc., Indianola, PA, USA). After i.v. administration the rolling table platform was moved to the skull, thorax, abdomen, pelvis, and femur to acquire datasets in coronal plane during equilibrium contrast phase. DWIBS and T1-CE sequences were performed in the same examination session, performing DWIBS first. Total acquisition time was less than 40 min.
Image analysis
All WB-MR images were transferred and analysed offline onto a workstation (View Forum, Philips Healthcare). Images were evaluated in the coronal plane. DWIBS images were displayed with gray-scale inversion. Visual analysis of DWIBS and of T1-CE was performed evaluating the number of areas of water restriction and of contrast enhancement in the skull, spine, sternum and rib cage, upper and lower extremities, respectively. According to the number of focal lesions >5 mm the patients were classified in three stages using the Durie-Salmon Plus staging system (12). Three radiologists, fully blinded to the results of previous or current diagnostic imaging modalities, independently analyzed during two different reading sessions, the DWIBS images (session 1) and the T1-CE images (session 2). Within each reading session, the readers did not have a time limit for image analysis. The time period that separated the two reading sessions was 21 days. The two readings were repeated after 40 days. For the staging the majority of opinion was used when there were inter-observer discrepancies. When no majority opinion existed between the three radiologists, a consensus opinion was reached. Areas of discrepancies on the DWIBS were reviewed first and the T1-CE reviewed on a separate occasion blind to the DWIBS assessment.
Statistical analysis
Inter- and intra-observer agreement was analyzed for the T1-CE and DWIBS sequences, respectively, using the unweighted kappa statistic. Agreement was defined as poor (κ < 0.2), fair (κ > 0.2 to κ ≤ 0.4), moderate (κ > 0.4 to κ ≤ 0.6), good (κ > 0.6 to κ ≤ 0.8), and very good (κ > 0.8 to κ ≤ 1). Percentages of equal staging, understaging, and overstaging with DWIBS relative to T1-CE were calculated with binomial exact 95% CI. These percentages do not indicate the number of cases in which DWIBS findings led to correct or incorrect staging; they represent numbers relative to those for T1-CE. Statistical analyses were executed with NCSS software (version 7.00, NCSS, Kaysville, UT, USA).
Results
Change in classification in the Durie-Salmon plus stages I–III according to DWIBS findings.

A 71-year-old woman with MM with concordant staging between whole-body T1-CE and DWIBS. (a) Coronal whole-body T1-CE and (b) maximum-intensity-projection (MIP) gray-scale inverted diffusion-weighted images show multiple bilateral bone metastasis in the spine, ribs, and pelvis (arrows). The patient was concordantly classified as stage 3 at both T1-CE imaging and DWIBS.
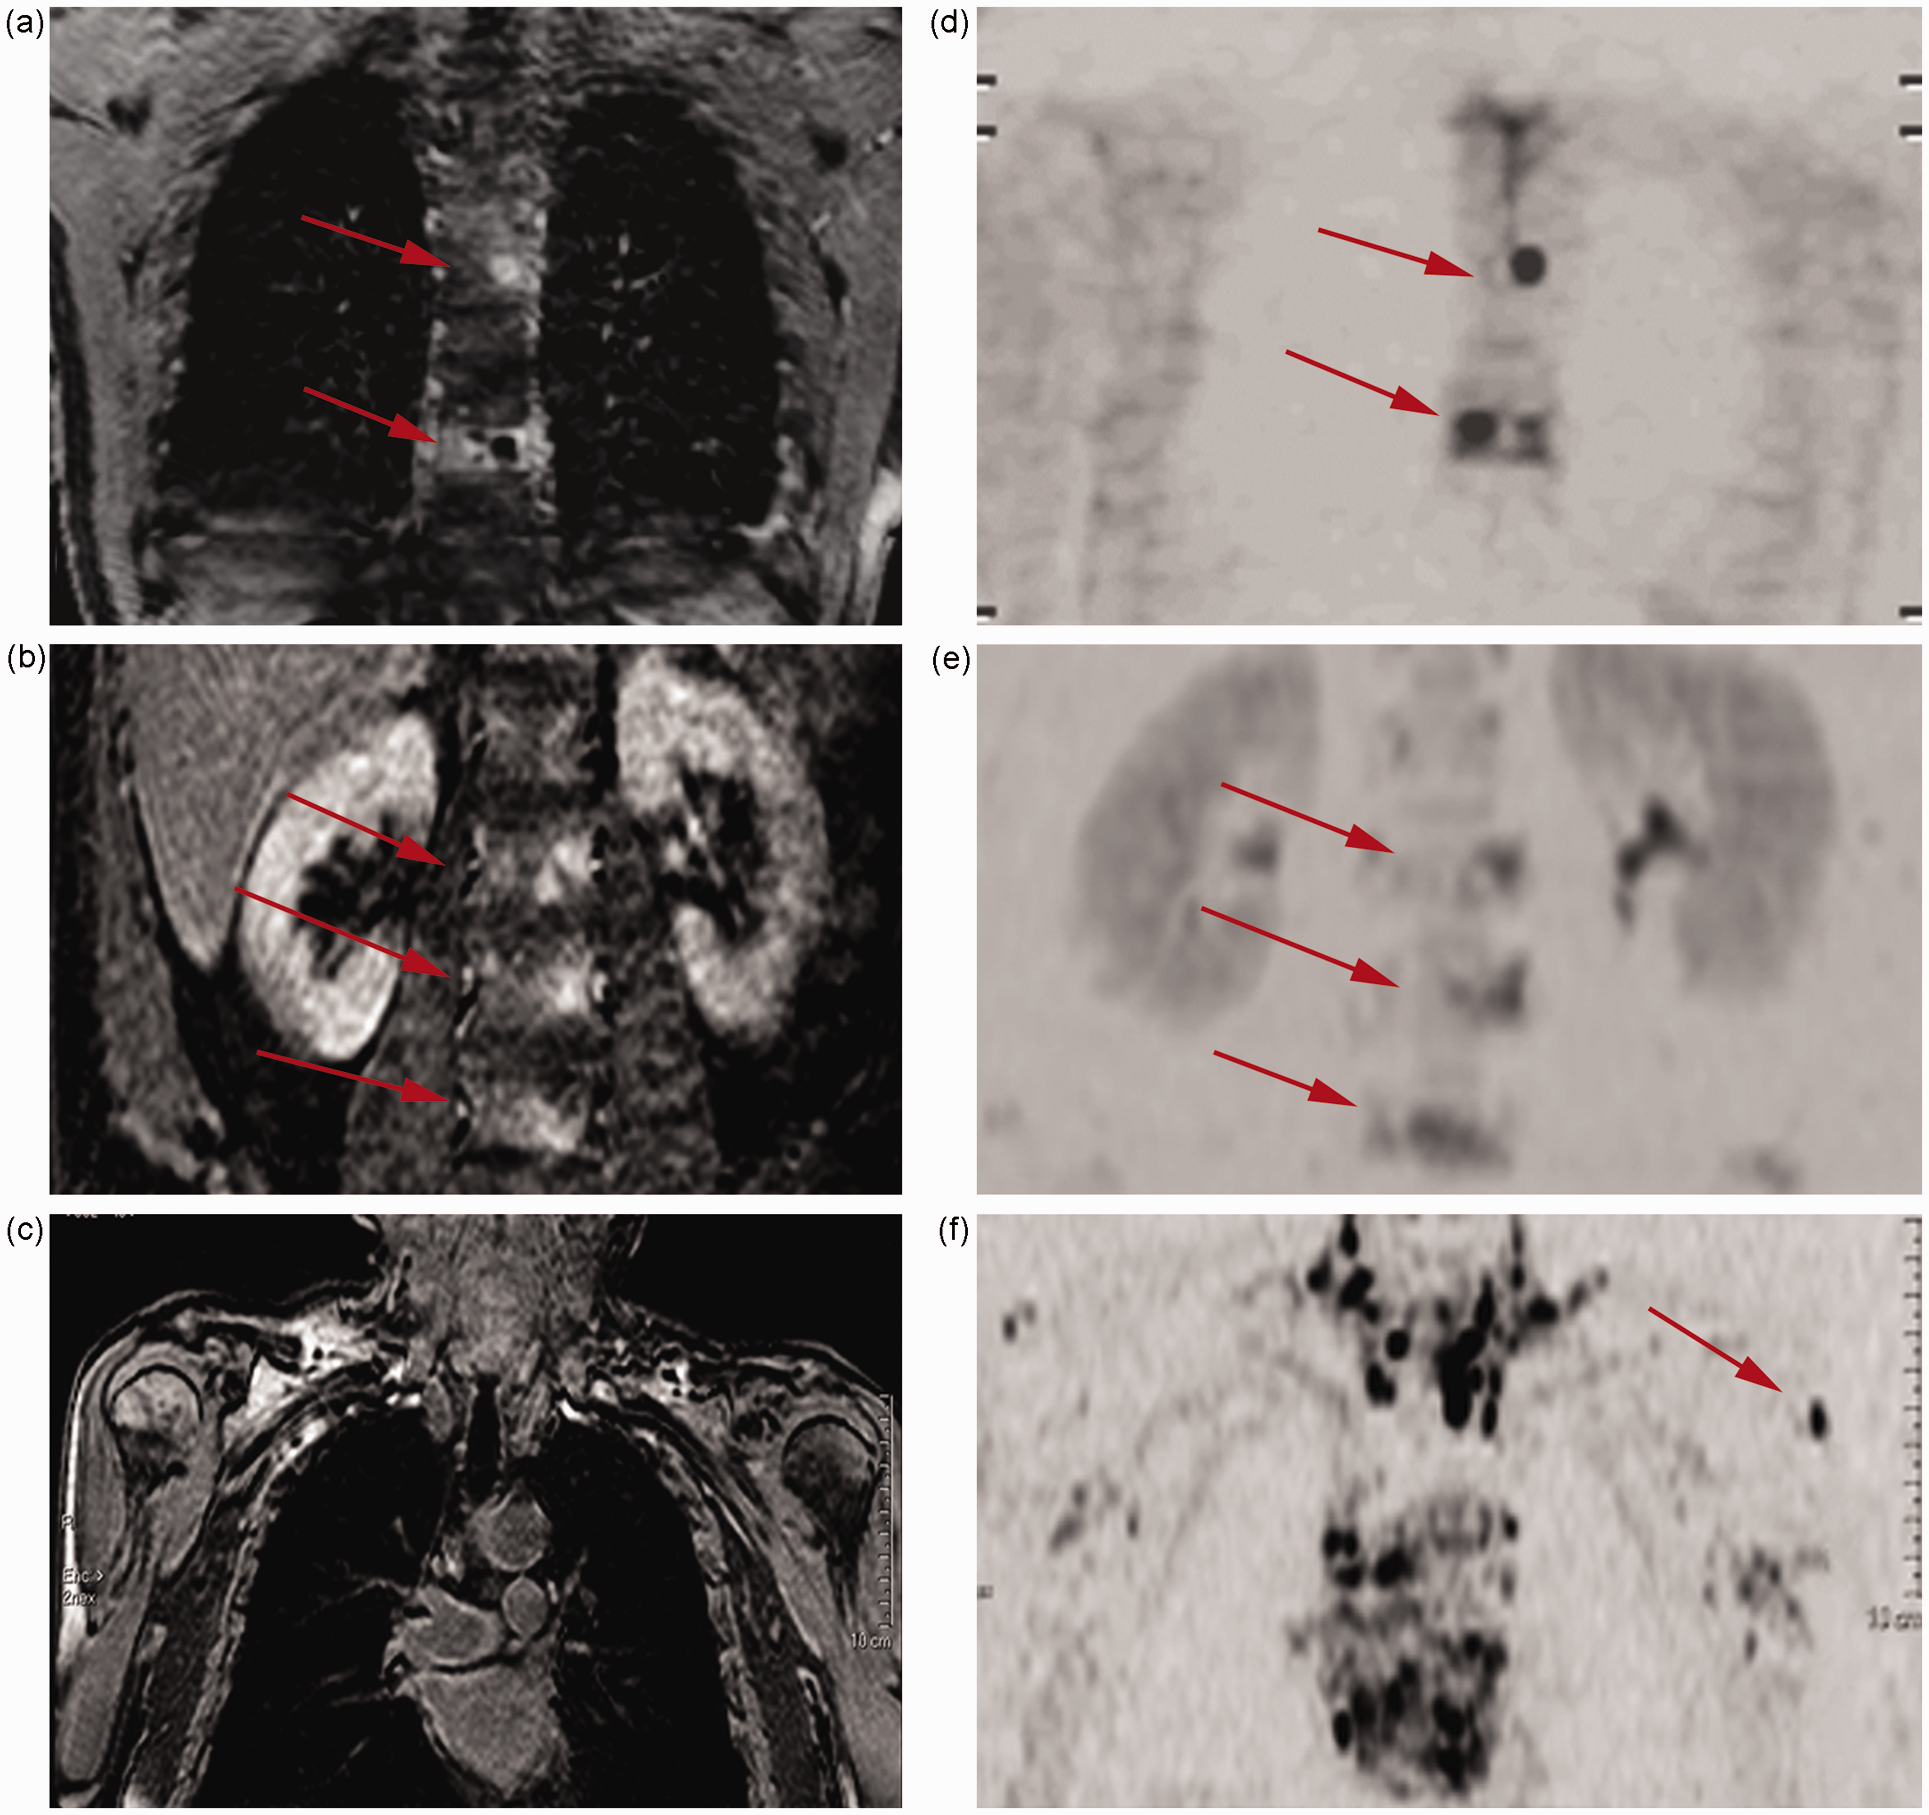
A 69-year-old man with MM with discordant staging between T1-CE and DWIBS. (a, b) Coronal T1-CE and (d, e) maximum-intensity-projection (MIP) gray-scale inverted diffusion-weighted images show five vertebral metastasis (arrows). DWIBS shows an additional left upper extremity lesion (arrow, f) not visible on the T1-CE image (c). The patient was classified stage I disease at T1-CE imaging, and stage II at DWIBS.
Discussion
MRI with DWIBS has been demonstrated elsewhere to permit a more accurate staging of the disease when compared with bone survey (13). In the present study we compared the areas of water restriction seen in DWIBS with the focal areas of contrast enhancement seen in T1-CE imaging in the pre-treatment evaluation of 36 MM patients using the WB-MR technique. For the evaluation of these MR changes we used the Durie-Salmon Plus staging system.
We observed good to very good levels of intra- and inter-reader reliability for both sequences. Also, our results show that staging with DWIBS is equal to that with T1-CE in approximately 67% of patients. Hillengass et al. investigated the role of DWI for non-invasive and quantitative monitoring of bone marrow infiltration in patients with monoclonal plasma cell disease using histology as reference standard (9). The authors found that the degree of plasma cell infiltration and vascular density correlated positively with the apparent diffusion coefficient (ADC) measurements. Thus, it is not surprising that our initial results show that staging with DWIBS is equal to that with T1-CE in the majority of patients.
However, in our study, very good agreement was observed only for stage III, with stages I and II having only moderate to good agreement. In particular, in 12 patients DWIBS evidenced areas of water restriction that did not correspond to focal contrast enhancement on the T1-CE images. Different hypothesis can be suggested to explain these discrepancies. It has been demonstrated that changes in diffusion of water within pathological tissue may occur before they are seen on standard MRI (14,15). On the other side, changes in water diffusion in the bone marrow site due to metabolic changes not related to malignant lesions have also been documented (16,17). Indeed, the reason for signal intensity changes on diffusion weighted imaging is not exactly known (18). There is evidence that diffusion changes may be attributable to many factors, such as shifts of water from the extracellular space to the intracellular space, increased tortuosity of the diffusion pathways, restriction of the cellular membrane permeability, cellular density, and disruption of cellular membrane depolarization (19,20). In particular, several causes of false positive focal increases in bone marrow signal intensity on DW images have been documented, e.g. isolated islands of red bone marrow within yellow marrow, bone marrow edema caused by fracture, degenerative disease, bone infarction, infection, and hemangioma (21). Indeed, it has been reported that the capability of WB-DWI to improve sensitivity for detection of bone pathologic lesions may be at the expense of specificity (22). In accordance with these lines of evidence some authors have considered focal high signal on DWIBS images as a false positive finding when no corresponding abnormality could be observed at T1-CE imaging (23).
Performing image interpretations with ADC maps may overcome several false positive increases in signal intensity on high b-value images (21). However, ADC correlations with cellularity are non-univocal in several tissues (21,24). In particular, in bone marrow, once all fat cells are lost, increasing bone marrow cell density may cause some ADC reductions, thus giving rise to possible misleading interpretations (21).
Since no imaging gold standard is so far available for the evaluation of MM, and histopathologic correlation of all identified lesions could not performed, due to ethical reasons, the specificity and the sensitivity of the two techniques could not be established in our study.
In conclusion, our data show that in pre-treatment staging of MM DWIBS findings are concordant with T1-CE in the majority of patients; however in 33% of cases DWIBS evidenced focal areas of water restriction that did not correspond to contrast enhancement areas. Studies with a larger cohort of patients monitoring therapeutic response in relation to tumor burden and aggressiveness should determine whether areas of water restriction evidenced on DWIBS and not corresponding to visible areas of contrast uptake on T1-CE have any clinical relevance in the pre-treatment staging of MM patients.
Footnotes
Acknowledgements
The authors would like to thank Philips Healthcare for technical support.
Conflict of interest
None declared.
Funding
This research received no specific grant from any funding agency in the public, commercial, or not-for-profit sectors.