
Abstract
Background
Clinical oncological studies attempt to improve precision of data by central radiological assessments. However, it is unclear, to which extent local and central assessments diverge.
Purpose
To quantify inter-reader variability and the deviation of local from central radiological assessments of computed tomography (CT) scans.
Material and Methods
This was a sub-study of a randomized clinical phase IIb trial in metastatic renal cell carcinoma (RCC), comparing first-line sorafenib with interferon-alpha-2a (IFN-α-2a). It analyzed agreements of local with central RECIST CT assessments by Cohen’s kappa (κ), symmetry tests, deviations in waterfall plots, Bland–Altman plots, and parametric survival analyses.
Results
The concordance between local and central radiologic review was quantified by κ = 0.53. While local assessment yielded progressive disease (PD) in 18.6%, central assessment classified 22.5% of patient time points as PD exhibiting only a partial overlap with the 18.6% The tumor shrinkage rates in waterfall plots were 68.1% in local and 55.8% in central review (57.8% and 59% by Reader 1 and Reader 2). Bland–Altman plots identified a systematic shift of tumor change rates by −7.5% in local compared to central assessments, that may reflect a systematic tendency of more favorable results in local assessments. The discordance between local and central review was reflected by a time to progression (TTP) hazard ratio (HR) of 1.73 (P = 0.0003).
Conclusion
These data suggest that central radiologic review may reduce technical measurement variability in clinical trials, which should be scrutinized in future studies compared to a volumetric reference.
Introduction
Clinical oncological development studies have sought to improve the precision of radiological assessments and to reduce the inter-reader variability impacting study endpoints such as time to progression (TTP), progression-free survival (PFS), overall response rate, or disease control rate (DCR) by employing an independent central blinded radiology review as opposed to using the local radiology assessment data as provided by study investigators. Although it is widely accepted by clinical science and regulatory agencies that standardized independent blinded central radiologic review is preferable to local radiologic review, there are few specific data that measure and quantify differences between local and central radiologic review at an individual trial level in clinical terms for a multi-kinase inhibitor (1). Multi-kinase inhibitors differ from classical chemotherapeutics in that they exert rather cytostatic than cytotoxic effects resulting in lower remission rates and relatively high rates of prolonged stable disease (SD). In this context it is of interest to which extent clinical study outcome parameters based on RECIST are influenced by local versus central radiological assessments.
It has been found in a subset of 33 non-small-cell lung carcinoma patients of a large clinical study that intra-observer and inter-observer variability of RECIST (2) measurements of lung lesions was considerable and could lead to significant misclassifications when assessing baseline computed tomography (CT) scans twice within 5–7 days (3). However, the quantification of the divergence of local and central radiologic CT scan assessments has not been addressed so far.
We investigated the concordance and discordance of inter-reader variability within central radiologic review and between local and central radiologic review of serial CT scans during the treatment period of a randomized phase IIb study and focused on their effect on allocation to RECIST categories and outcome parameters.
Material and Methods
Our study was based retrospectively on data from an oncological clinical trial that investigated sorafenib versus IFN-2a as a first-line treatment in patients with advanced or metastatic renal cell carcinoma. The clinical data regarding efficacy and safety were published previously (4). We analyzed the data of the central and local radiologic assessments of lung lesions of this trial in 170 metastatic RCC patients with up to 484 CT scan assessment time points in total. Central radiological assessment was an independent blinded review by a specialized contract research organization employing two independent blinded skilled radiologists and a third radiologist, in case of deviating assessments, who used DICOM files of CT images. Local radiological assessment was the result that was reported in the case report form by the investigator of each study center.
Both central and local radiologic response assessments (complete response [CR], partial response [PR], stable disease [SD], progressive disease [PD]) were carried out according to the RECIST criteria as described in 2000 (5).
Agreement between different readings (local vs. central, Reader 1 vs. Reader 2 of central radiologic review) was measured with Cohen’s kappa (κ) (6). The McNemar-Bowker test of symmetry (7,8) was performed to detect a significant discordance between the reading methods.
The percentage of maximum tumor shrinkage compared to baseline was evaluated with waterfall plots (9) and Bland–Altman plots (10), to reveal the deviations between the different reading methods. Central values were averaged over the raters for this. In Bland–Altman plots the mean of the two measurements (here: local and central assessment or assessment of Reader 1 and Reader 2) was plotted on the x-axis against the difference of the two measurements on the y-axis.
Time to progression (TTP), defined as time from randomization to progression (event) or last assessment (censoring), was analyzed using parametric survival analysis. A frailty model (11) was used to account for the paired structure of the observations. Patients who died during the study were censored for TTP.
P values ≤ 0.05 (5%) were considered statistically significant. Statistical analyses were performed with SAS 9.3. The parametric survival model with frailty factor was calculated using STATA 13.1.
The clinical phase IIB study protocol including the present investigation of radiological assessments had been IRB approved and conducted according the World Medical Association Declaration of Helsinki.
Results
Inter-reader variability within central radiologic assessment
Concordance within central radiological assessments.

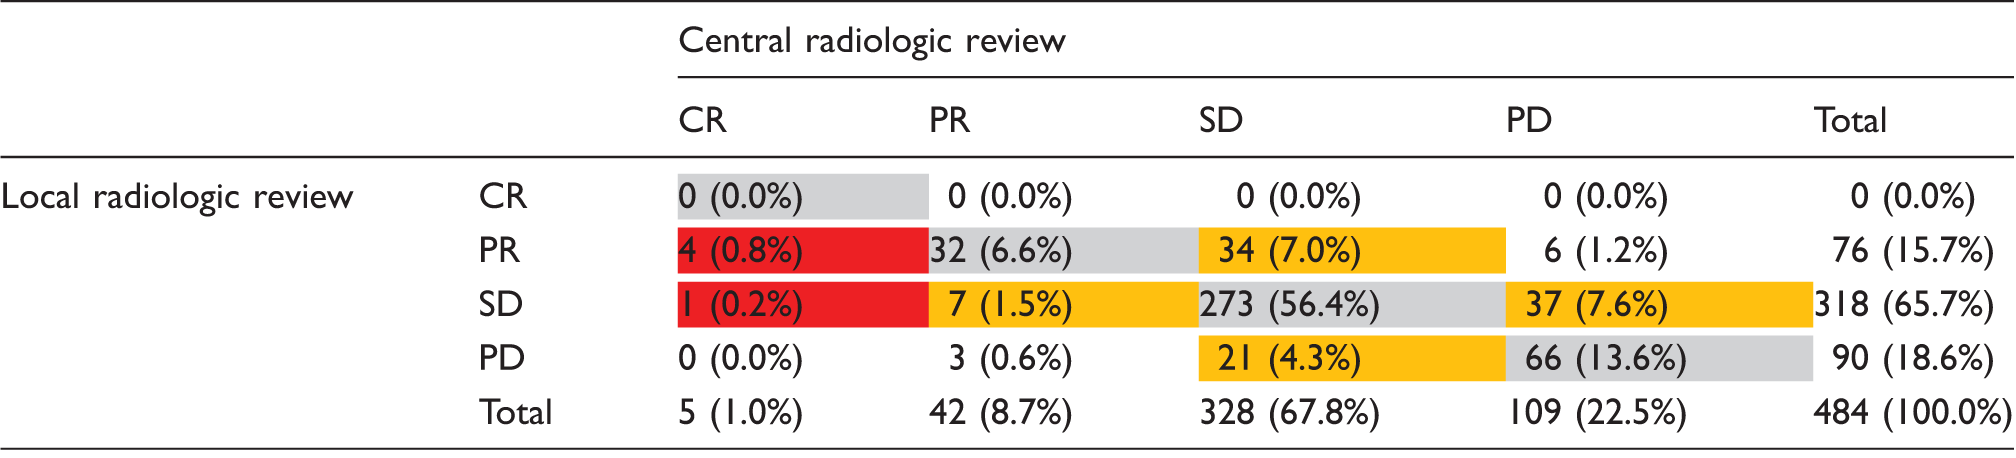
The table shows the concordance (gray fields) and discordance (other fields) of central Reader 1 versus central Reader 2 in regard to allocation of patient time points to the RECIST categories complete response (CR), partial response (PR), stable disease (SD), and progressive disease (PD). While Reader 1 assessed PD in 21.0% (101 of 482 CT scan time points) in total, Reader 2 assessed PD in 21.8% (105 of 482) in total. The numeric overlap of 21.0% was not necessarily constituted by the same patients. The orange fields point out a potential asymmetry. However, the McNemar–Bowker test for asymmetry was not significant (P = 0.08).
Variability between local and central radiologic assessment
Concordance of local and central radiological assessments.
The table displays the concordance (gray fields) and discordance rates (other fields) of central radiologic assessment versus local radiologic assessment in regard to allocation of patient time points to the RECIST categories complete response (CR), partial response (PR), stable disease (SD), and progressive disease (PD). The orange fields point out notable asymmetries and the red fields extreme asymmetries. While local assessment yielded a rate of 65.7% patient time points with SD, central assessment resulted in 67.8% with SD. However, of the 65.7% (n = 318) with SD according to local assessment only 273 (56.4%) were SD according to central review, while one (0.2%) was CR, 7 (1.5%) were PR and 37 (7.6%) were PD. In addition, of the 67.8% (n = 328) with SD according to central assessment, 0 were CR, 34 (7.0%) PR, and 21 (4.3%) PD determined by local assessment.
Concordance of central and local radiological review regarding progression.
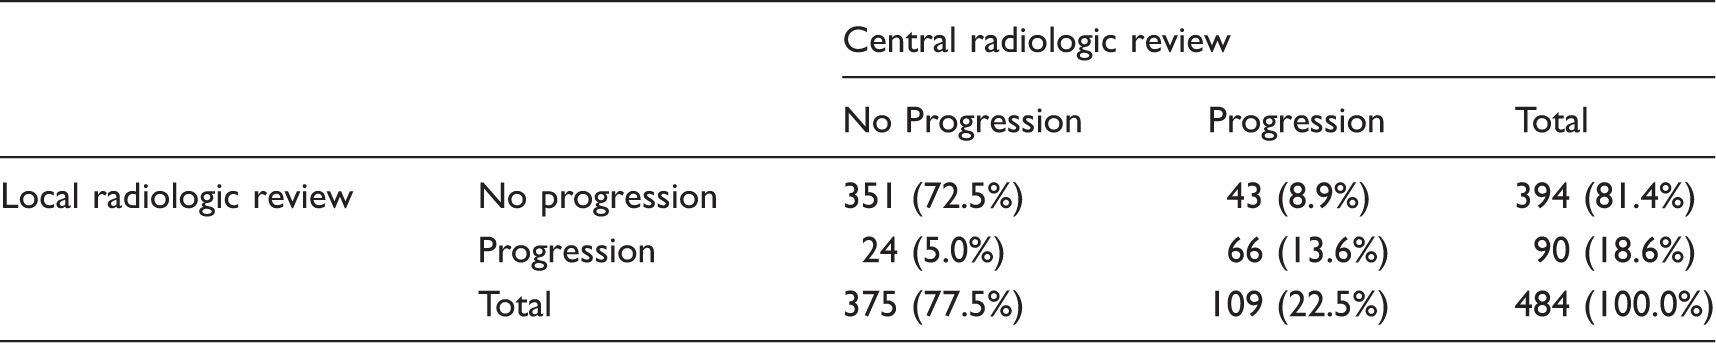
The table shows the concordance, discordance, and asymmetry of central versus local radiologic assessments in regard to the allocation of patient time points to the category “no progression” (disease control [DC]) or “progression” (progressive disease [PD]). While 351 (72.5%) DC assessments and 66 (13.6%) PD assessments were in agreement, 24 (5.0%) and 43 (8.9%) assessments were not in agreement, respectively. Thus, in 13.9% there were doubts about the right classification based on the discordance between local and central results. The concordance was quantified by a κ of 0.58 (95% CI, 0.49–0.67).
When we restricted our analysis to the set of best response assessments based on 166 CT scans, the concordance was quantified by κ = 0.55 (95% CI, 0.43–0.69). An asymmetrical discordance was confirmed (P = 0.0215). While the PD rates were both about 19% in central and local assessments, the partial response (PR) and the stable disease (SD) rates were 18.7% and 62.7% in local vs. 7.8% and 72.3% in central review, respectively.
Variability between local and central radiologic assessments in waterfall plots and Bland–Altman plots
Waterfall plots have been established in depicting effects of targeted therapies by showing the extent of maximum achieved tumor shrinkage for each patient. We studied the variability between Reader 1 and Reader 2 within central assessments (Fig. 1a) as well as between local and central assessment (Fig. 1b). The waterfall plots of Readers 1 and 2 are in relatively good agreement with each other yielding a tumor shrinkage rate of 57.8% (96/166) and 59.0% (98/166), respectively (Fig. 1a). In contrast, the waterfall plots of local and central review differed more with a tumor shrinkage rate of 68.1% (111/163) by local review and 55.8% (91/163) by central review (Fig. 1b).
Waterfall plots of maximum tumor shrinkage (a) by Reader 1 versus Reader 2 within central radiologic assessment and (b) by central versus local radiologic assessment.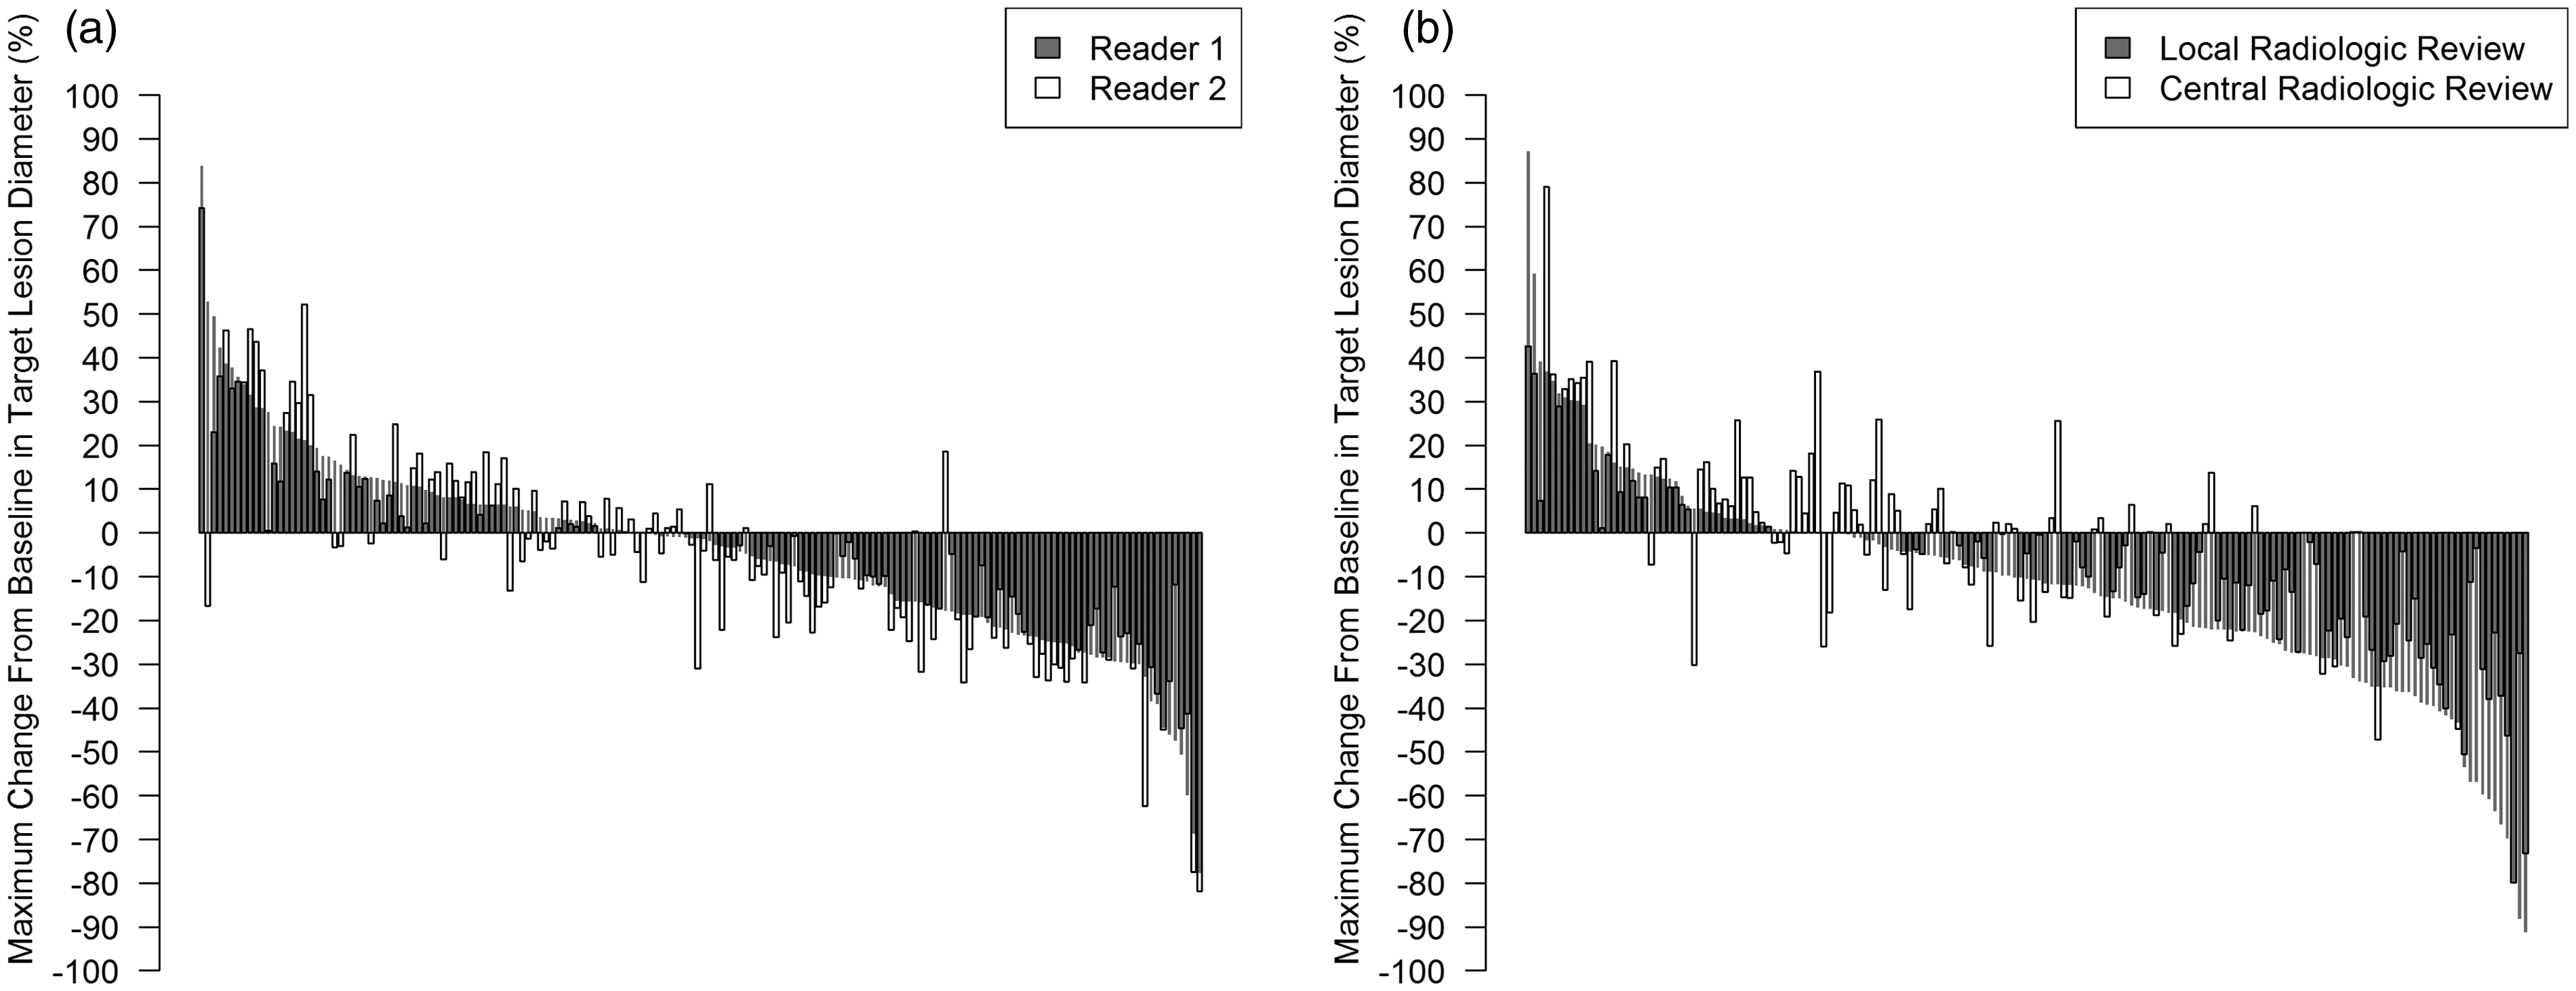
A similar pattern can be seen in the Bland–Altman plots (Fig. 2a and b). Fig. 2a shows a Bland–Altman plot comparing the agreement of Reader 1 and Reader 2 within the central radiologic assessment. The results are centered nearly at the horizontal line of zero (mean, 0.9%), indicating that there is no systematic shift. The limits of agreement (LOA) are −21.4% to 23.2%. The local radiologic assessment showed a mean of −7.5% points (LOA, −37% to 22%) in comparison to central assessment indicating a systematic shift (Fig. 2b).
Bland–Altman plots (a) of the mean of Reader 1 and Reader 2 measurements in relation to differences between Reader 1 and Reader 2 measurements and (b) of the mean of central and local radiologic measurements in relation to differences between central and local radiologic measurements.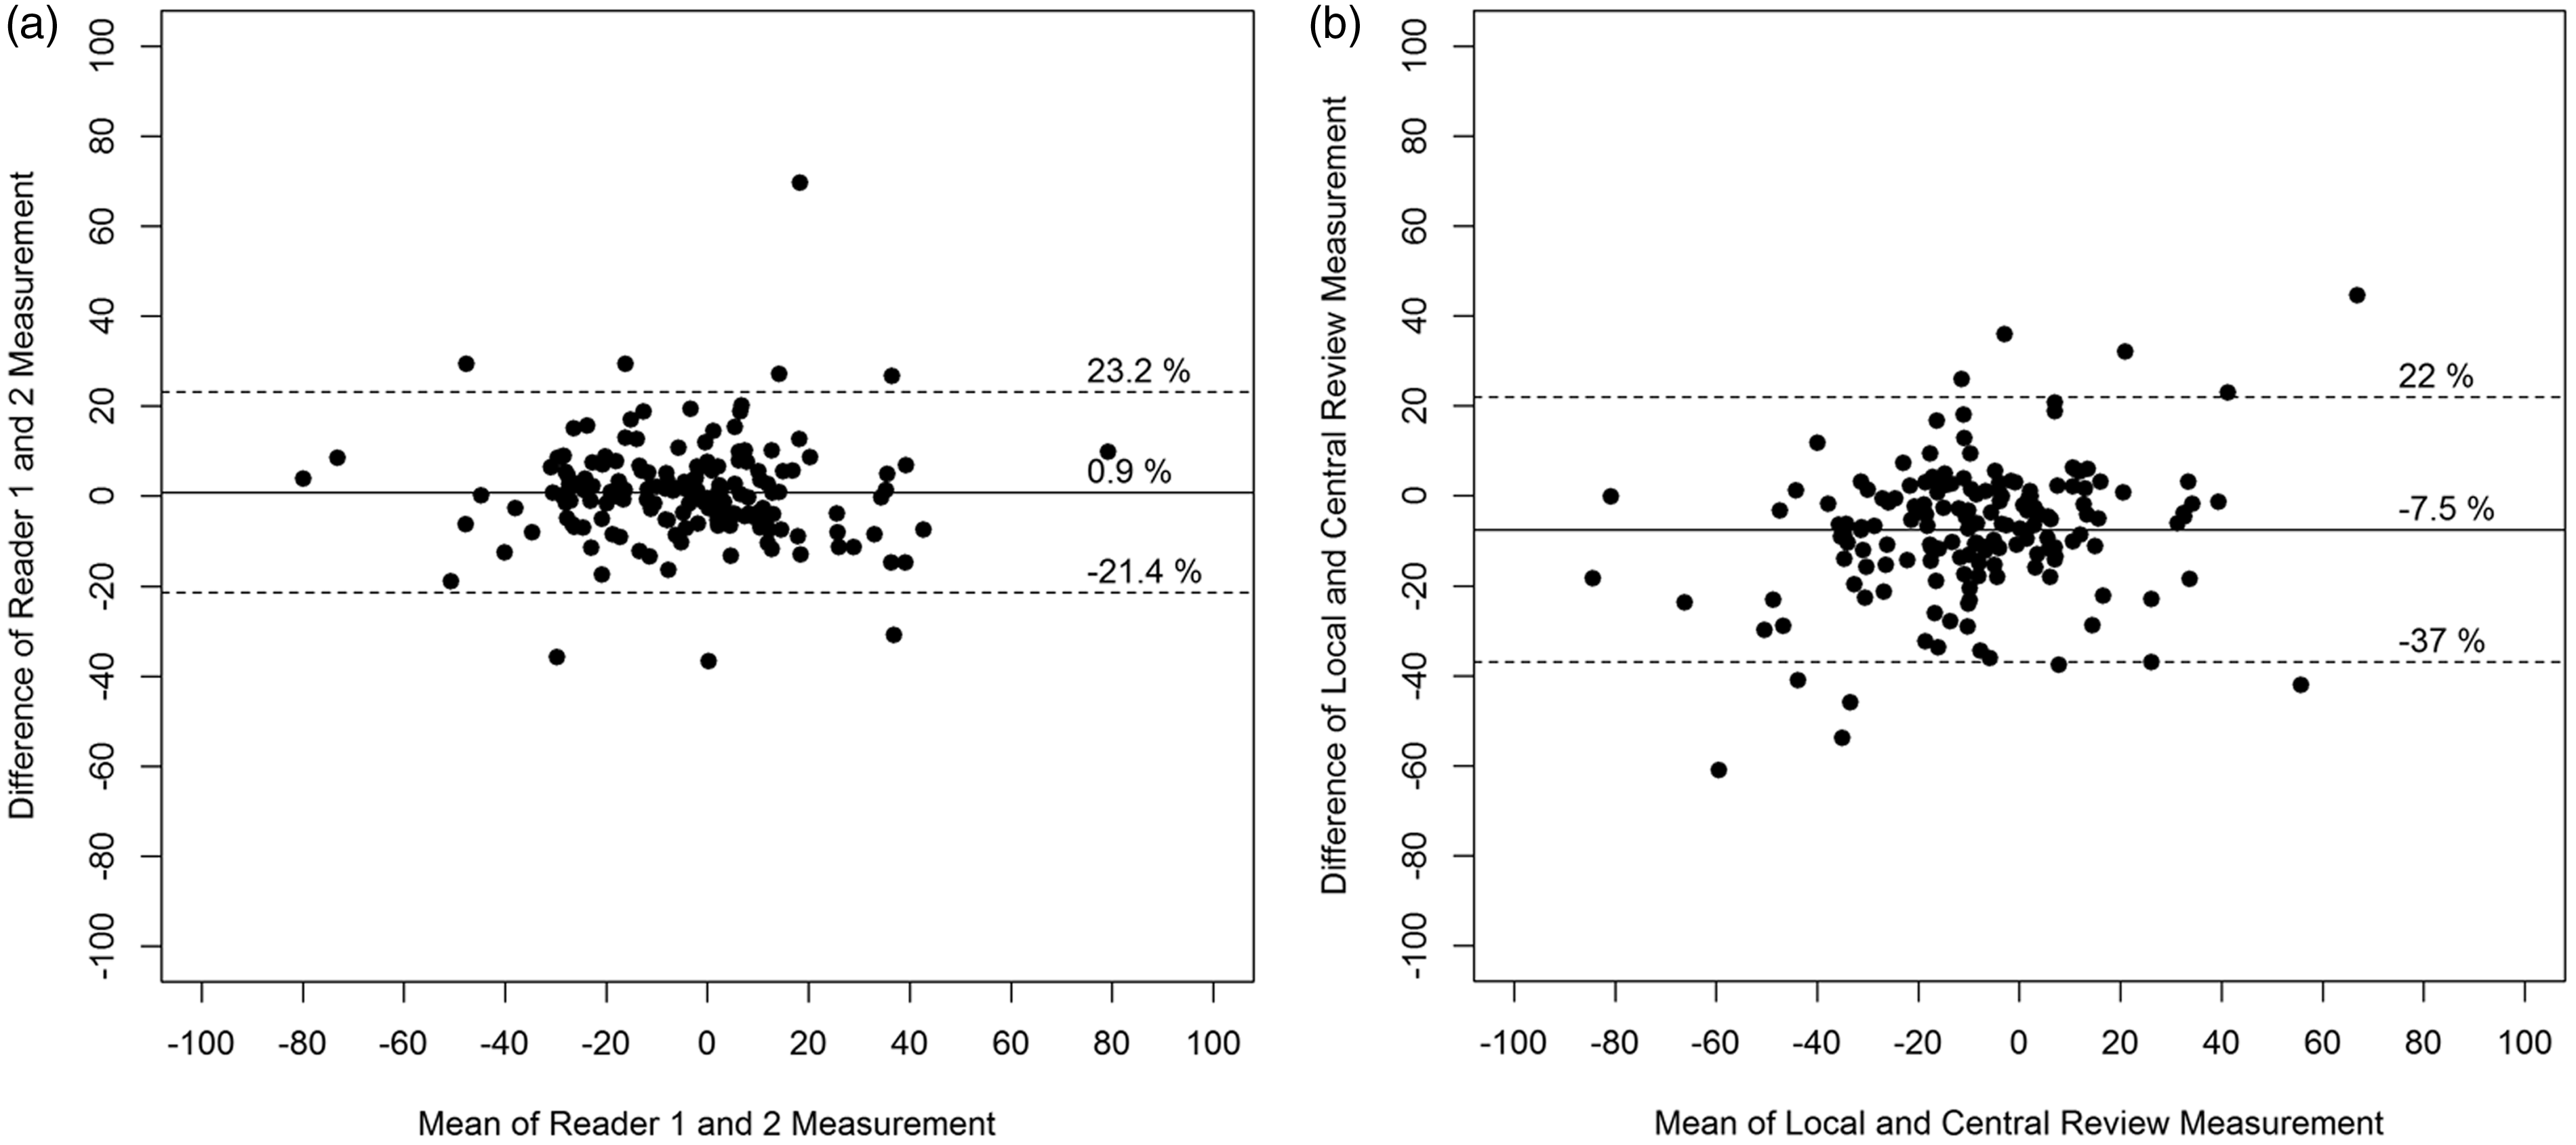
The tighter LOA between Reader 1 and Reader 2 indicate a lower variability between the measurements than between local and central review. The comparison of local and central radiologic review indicates that the local radiologic assessments showed on average tumor decreases that were more pronounced (by 7.5% points) compared to central review and tumor increases that were less pronounced (by 7.5% points) compared to central review.
Variability of TTP depending on radiologic assessment
For clinical trials with cytostatic tyrosine kinase inhibitors (TKIs) TTP is considered a suitable endpoint, because it reflects the duration of tumor control as an important benefit for patients.
There was a significant difference between the local and central TTP comprising all patients irrespective of their tumor therapy group (HR, 1.73; 95% CI, 1.29–2.34; P = 0.0003). Thus, the “risk” of progression was assessed to be higher by central review compared to local review. In contrast, there was no significant difference between Reader 1 and Reader 2 within central review for TTP (HR, 1.06; 95% CI, 0.79–1.41; P = 0.71).
Discussion
The comparison of Reader 1 and Reader 2 within the central radiologic review revealed a mean difference of 0.9% (LOA, −21.4% to +23.2%) according to our data in Bland–Altman plots in regard to the maximum tumor reduction versus baseline. Another study examining intra-scan variability between Reader 1 and Reader 2 reported for 33 patients a relative difference of −2.0% (LOA, −31.0% to +27.0%) and an absolute difference of −0.4 mm (LOA, −3.8 to +3.0 mm) (12). Furthermore, a dataset of 30 selected patients from a phase II/III study in metastatic colorectal cancer patients was analyzed for reader variability of three specifically trained radiologists (13). The within-patient variability of relative changes of these three readers was +/− 11%, when target lesions were independently selected by the three readers. Nine of 29 patients (31%) were assessed with a variability of more than 10% by the three readers.
It is not surprising that the concordance of radiologic assessments was better between Reader 1 and Reader 2 within the central review than between local and central assessments, because Reader 1 and Reader 2 followed the same specific standardized procedure, whereas local radiologists and investigators may have followed variable procedures and standards across study centers. However, the result that the local assessment showed in general a smaller tumor size (by a mean of −7.5% points) than the central assessment is intriguing. The systematic shift of local results towards more favorable results compared to central results may have a considerable impact on response rates and progression rates. For instance, a tumor decrease of 25% (corresponding to SD per RECIST) as determined by central review would be on average 32.5% (PR) as determined by local review. Furthermore, a tumor increase of 22.5% (PD) as determined by central review would be on average an increase by only 15% (SD) as determined by local review. These theoretical examples illustrate how this systematic deviation may affect the allocation of patients to response categories. This finding raises the question, whether the local investigators’ clinical knowledge about patients’ clinical states, laboratory values, and other tests influenced the quantification of changes compared to baseline directionally.
The discordance between local and central review may cause organizational problems for a study in general. If the number of TTP or PFS events is considerably smaller by local assessment than by central assessment, the study evaluation will be delayed. Alternatively, if the number of events is considerably greater by local assessment than by central assessment, the number of statistically required central events may not be reached reducing the power of the study.
This study leads to the question whether central radiologic review provides an additional value in terms of precision and reliability of these data in comparison to local review that warrants the additional financial and personnel resources and additional complexity of the study. Certainly the requirement by regulatory authorities is a striking argument to implement central radiologic review, since the registration of a new medical entity may be at stake. Employing central radiologic review may theoretically enable clinical trial programs to reduce the number of study patients at the same power or to reduce the risk of falsely negative studies by increasing the power. Moreover, the implementation of a central independent radiologic review may be a good idea in randomized clinical phase IIb studies, which form the basis for a development decision to embark on a phase III study.
On the other hand, it is conceivable that the local review could be superior to central review under certain circumstances, e.g. if the specific tumor type or stage requires specific clinical information such as patient clinical status, co-morbidities, prior or concomitant radiation, the history of loco-regional treatments, drug toxicity, and other clinical manifestations that may support the interpretation of radiological images.
Since the variability between local and central assessment may arise from the different settings as a systematic bias, it probably may not reflect the degree of impact that is caused by radiologic assessment variability per se, since clinical studies are either evaluated completely by central or completely by local radiologic review. Thus, the two arms, that are compared, are very well controlled, because the method of radiologic review is the same in both arms for each individual center. The potential of a bias between the study arms is basically minimized by a randomization plan per study center.
Beyond the variability of radiologic assessments, there are also other factors that require a solid statistical powering of such studies including inter-patient biological tumor variability and pharmacokinetic variability. This notion raises the question to which proportion the radiologic assessment variability contributes to the overall variability in clinical trials and thus to the requirement of relatively large patient numbers.
A third superior reference method would be required, to compare central and local radiologic review against this reference, in order to evaluate whether local or central radiologic review depicts the real tumor state better. In recent years, there have been a number of reports (14–17) showing the potential advantages of volume-based computer-assisted tumor size measurements compared to the clinical standard of linear measurements (RECIST) regarding the precision of lesion measurements at one time point and of change rate measurements. It has been shown that computer-aided volumetric assessments of lung nodules may allow a reliable classification as progressive disease at a volume increase of 27%, as opposed to 73% (73% volumetric increase correspond to 20% increase in the sum of longest linear diameters) that is required by RECIST (18). Moreover, we have shown in a separate examination comparing central versus volumetric radiological assessments based on the same dataset of this randomized clinical phase IIb study in RCC patients that the median unsigned change rate difference was 11.4% with manual linear diameter measurements, whereas it was significantly smaller (better) at 1.8% with effective volumetric diameter measurements (19). It would be interesting to test this hypothesis in the dataset of a different large study.
The limitation of this study is that the data basis is only a phase IIb study, though with a relatively large patient number of 170, but not a phase III study. Furthermore, it would have been of interest to determine the inter-reader variability for local assessment. However, it would have been too costly to plan for two local radiological readers within the routine setting of this clinical trial for each center. This study adds to our understanding of the extent of divergence between local and central assessments by quantifying this difference in the setting of a regular clinical efficacy study. Thus, it may provide a basis for designing future studies to take this divergence extent principally into account.
In conclusion, the present data revealed a systematic deviation of local radiological assessments from central assessments in that being more favorable by local assessments. Further studies may scrutinize the quantification of deviation between local and central assessments by testing central versus local assessments in comparison to a volumetric computer-aided reference method employing larger datasets of phase III studies.
Footnotes
Declaration of conflicting interests
The author(s) declared no potential conflicts of interest with respect to the research, authorship, and/or publication of this article.
Funding
The author(s) disclosed receipt of the following financial support for the research, authorship, and/or publication of this article: This research was supported by Bayer HealthCare.