



Abstract
Background
Accurate response evaluation in patients with neuroendocrine liver metastases (NELM) remains a challenge. Radiomics has shown promising results regarding response assessment.
Purpose
To differentiate progressive (PD) from stable disease (SD) with radiomics in patients with NELM undergoing somatostatin analogue (SSA) treatment.
Material and Methods
A total of 46 patients with histologically confirmed gastroenteropancreatic neuroendocrine tumors (GEP-NET) with ≥1 NELM and ≥2 computed tomography (CT) scans were included. Response was assessed with Response Evaluation Criteria in Solid Tumors (RECIST1.1). Hepatic target lesions were manually delineated and analyzed with radiomics. Radiomics features were extracted from each NELM on both arterial-phase (AP) and portal-venous-phase (PVP) CT. Multiple instance learning with regularized logistic regression via LASSO penalization (with threefold cross-validation) was used to classify response. Three models were computed: (i) AP model; (ii) PVP model; and (iii) AP + PVP model for a lesion-based and patient-based outcome. Next, clinical features were added to each model.
Results
In total, 19 (40%) patients had PD. Median follow-up was 13 months (range 1–50 months). Radiomics models could not accurately classify response (area under the curve 0.44–0.60). Adding clinical variables to the radiomics models did not significantly improve the performance of any model.
Conclusion
Radiomics features were not able to accurately classify response of NELM on surveillance CT scans during SSA treatment.
Keywords
Introduction
Approximately 75% of patients with gastroenteropancreatic neuroendocrine tumors (GEP-NETs) develop hepatic metastases (1–3). Currently, the only potentially curative treatment for patients with neuroendocrine liver metastases (NELM) is resection of the primary tumor and metastases (4–6). Unfortunately, this is only feasible in about 10%–30% of patients as many patients present with diffuse NELM at the time of diagnosis (4,5). Somatostatin receptor analogues (SSAs) are the most frequently used systemic therapy in these patients. They not only decrease symptoms in functional GEP-NETs, but also have antitumor effects leading to a longer progression-free survival (PFS) (7–9). Accurate response evaluation in these patients is essential in order to timely modify the treatment regimen in case of progression. Response Evaluation Criteria in Solid Tumors version 1.1 (RECIST1.1) is most commonly used in clinical practice for response evaluation, even though primarily developed for clinical trials and other tumor types than GEP-NETs (10). RECIST1.1 solely relies on changes in the sum of the size measurements of target lesions on a single slice on CT and cutoff values for each response category are rather broad. In other words, a relatively large change in size is necessary for RECIST1.1 to detect response and progression. Given the slow growth pattern and indolent behavior of most GEP-NETs (11,12), as well as the limited size reduction during SSA therapy (7,8), RECIST1.1 likely underestimates progression or treatment response. Alternative response criteria have been proposed to overcome the limitations of RECIST1.1 with different cutoff values and/or incorporation of tumor attenuation in the criteria, as seen in the Choi criteria for GIST and modified (m)RECIST criteria for hepatocellular carcinoma (HCC) (13,14). However, these were not developed for GEP-NETs and have only been studied in GEP-NETs treated with targeted therapies (11,12,15–17). Incorporation of tissue attenuation or other cutoff values might be more appropriate, yet they are still based on a single measurement of the tumor. Since a heterogeneous response is a common finding in NETs (18–20), single 2D measurements might not be representative of the actual response, because they do not reflect changes in the whole tumor (21,22).
Radiomics is a method of quantitative imaging analysis that extracts features from medical images, which have the potential to provide information about the whole tumor phenotype and microenvironment. This way, radiomics is able to capture more than just size changes or tumor attenuation and can include information on tumor shape and size, textural features, and statistics on spatial intensity distributions. Previous studies have shown promising results regarding response evaluation (and prediction) in several tumor types (23–25). For GEP-NETs, radiomics is still in an early stage, but promising results have been reported for radiomics and prediction of response in patients treated with peptide receptor radionuclide therapy (PRRT) (26). However, little is known regarding the use of radiomics for response assessment in patients treated with SSA, in whom response evaluation is challenging. Radiomics could provide better patient-specific response evaluation in patients treated with SSA. Therefore, the aim of this explorative study was to investigate the feasibility of response classification with radiomics in patients with NELMs treated with SSA.
Material and Methods
Data were retrospectively collected according to the guidelines of the Declaration of Helsinki. The study was approved by the institutional review board of the Netherlands Cancer Institute (IRB-NKI), who granted an official waiver of ethical approval (IRBd19176, 05-07-2019). Due to the retrospective nature of the study, patient consent was waived.
Patients were selected from a cohort of patients with well-differentiated GEP-NETs that were included in a previous study in our institute between March 2014 and March 2017 (27). Inclusion criteria were as follows: (i) histologically proven, well-differentiated sporadic GEP-NETs; (ii) available World Health Organization (WHO) grade; (iii) presence of liver metastases; (iv) available sufficient quality (slice thickness of ≤5 mm), contrast-enhanced (CE)-CT in late arterial (AP) and portal venous phase (PVP) at time of diagnosis and follow-up; and (v) treatment with SSA. Patients were excluded if they had hepatic steatosis or underwent local liver treatment before baseline (including [radio]embolization, radiotherapy, PRRT, and iodine 131-meta-iodo-benzyl-guanidine [131-I-MIBG] therapy), since this can affect the texture of the whole liver, including the metastases. To ensure a reliable response assessment, only patients with ≥2 consecutive CE-CT scans were included. CT images with severe artefacts that affected assessment of the NELM were excluded. NETs were graded according to WHO 2017 (28). Patients were followed according to the European Neuroendocrine Tumor Society (ENETS) guidelines (29). Follow-up consisted of anatomical imaging every 3–12 months alternated with functional imaging once every 1–2 years, depending on clinical condition and response to treatment. Patients were followed until development of progressive disease (censored) or until last available imaging until February 2019 (uncensored).
Study endpoints
The reference standard was RECIST1.1. Results were analyzed on a per-lesion basis (to assess radiomics features for individual lesions) and separately on a per-patient basis (to adhere to clinical practice). Follow-up scans were reassessed according to RECIST 1.1 (10,27,30) by two independent senior radiologists (BH, DvdZ), with 12 and 7 years of experience in abdominal imaging, respectively. The two most reproducibly measurable and representative NELM were selected as target lesions. In case of a solitary metastasis, only one NELM was selected. For the lesion-based analysis, complete response (CR) was defined as disappearance of the target lesion, partial response (PR) as ≥30% decrease of the lesion diameter, progressive disease (PD) as ≥20% increase of the lesion diameter, and stable disease (SD) if the lesion did not meet the criteria for PR or PD.
For the patient-based analysis, response was defined according to RECIST1.1 by assessing the change in the sum of diameters of the target lesions. CR was defined as disappearance of all NELM, PR as ≥30% decrease in the sum of the lesion diameters (SLD), PD as ≥20% increase in the SLD or occurrence of new lesions, and SD if the SLD did not meet the criteria for PR or PD and no new lesions occurred. The analysis was repeated without taking new NELM into consideration, to allow for better estimation of the radiomics features for the patient-based analyses, as they do not reflect changes within the selected target lesions.
Since the aim was to assess whether radiomics can accurately classify disease progression, response was dichotomized into two groups: group A, progressive disease, including PD; and group B, stable disease, including CR, PR, and SD.
Radiomics workflow
The radiomics workflow is explained in detail in Supplement A1 and visualized in Fig. 1. Radiomics analyses were performed on the first CE-CT scan that showed PD during follow-up (group A), or on the last CE-CT scan during follow-up in case of SD (group B). CT images were retrieved from the picture archiving and communication system (Vue PACS, Philips NV, Version 12, 2022, Best, The Netherlands), anonymized and transferred to an offline workstation for segmentation. Detailed CT-imaging parameters are listed in Supplement A1. One dedicated reader performed manual delineation of the volumes of interest (VOI), defined as each NELM that was selected as target lesion for RECIST1.1. Radiomics features were extracted from each VOI separately in both AP and PVP. In total, 56 radiomics features were extracted in each scanning phase (AP and PVP) (Supplement S1).
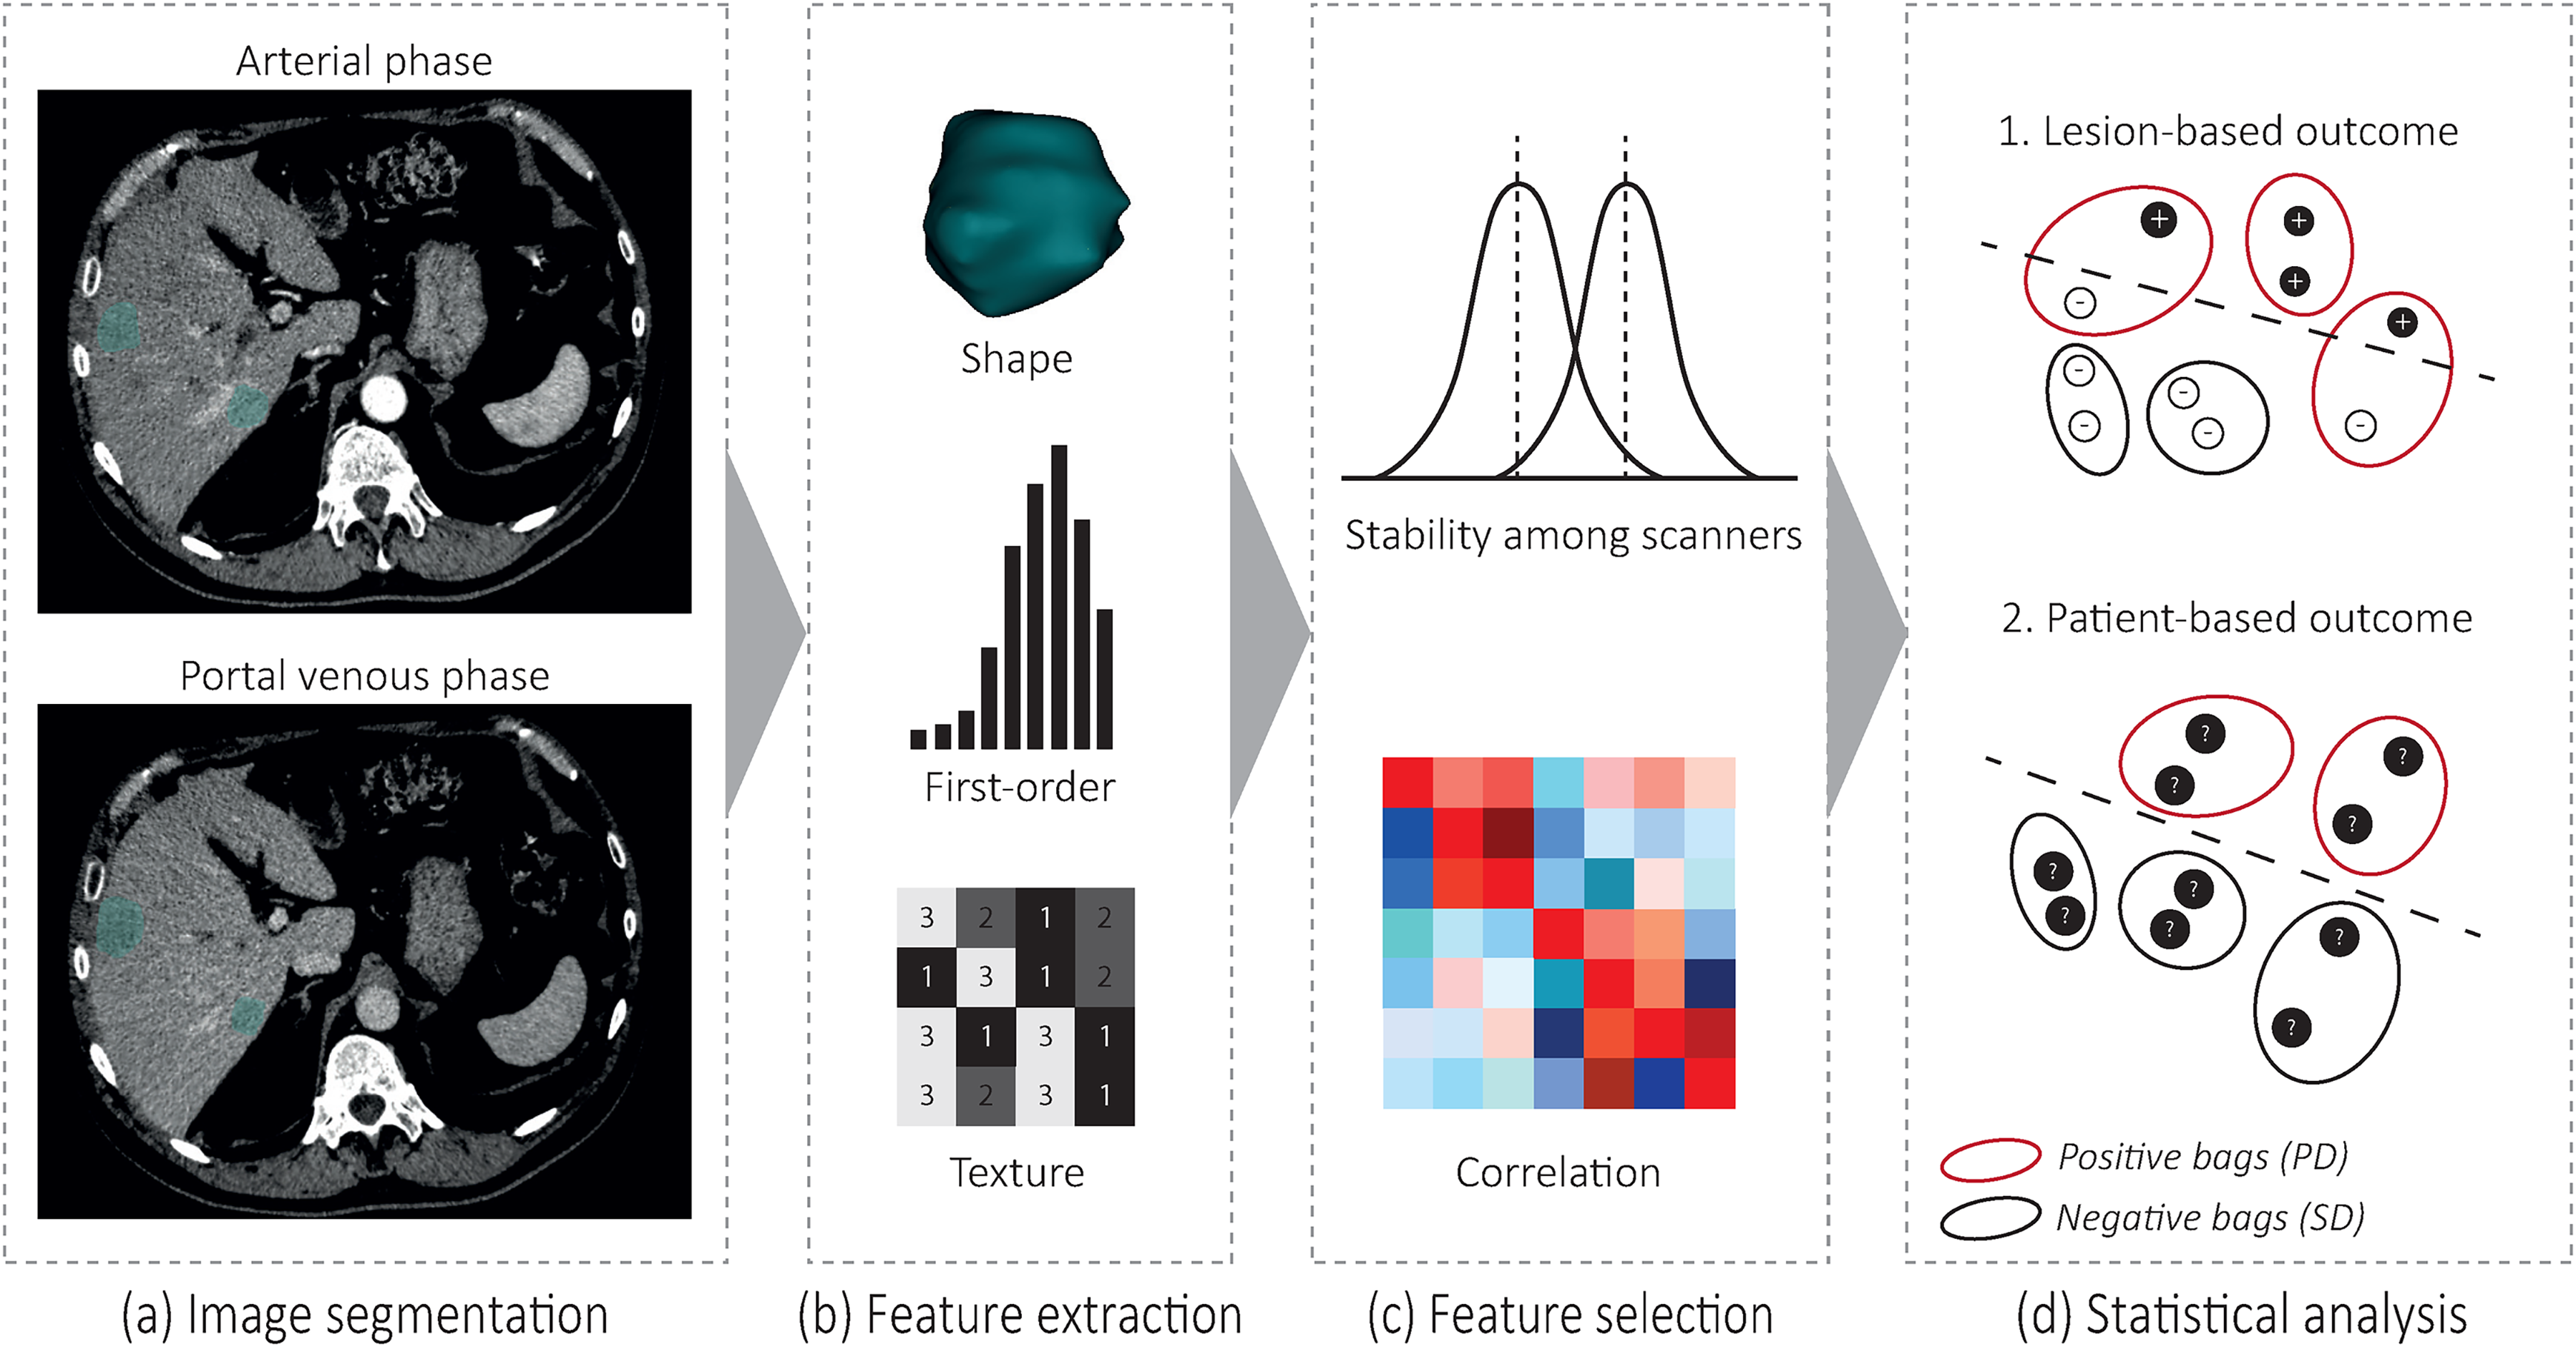
Overview of the radiomics workflow for the patient-based outcome. (a) Image segmentation of the whole tumor volume on arterial and portal venous phase. (b) Extraction of shape-based, histogram-based and texture features. (d) Feature selection by removing unstable and highly correlated features. (d) Statistical analysis. The so-called bags represent patients that either have progressive or stable disease. The circles in the bag represent the two target lesions.
Statistical analyses
Baseline patient characteristics were assessed using descriptive statistics. Before analysis, radiomics features were normalized with a z-score transformation. Uncorrelated and stable features were considered for further analyses. Differences in radiomics features between SD or PD were compared with univariable analysis (Mann–Whitney U) and the false discovery rate (FDR) was computed via the Benjamini–Hochberg method to account for multiple testing. Multiple instance learning (MILR) with regularized logistic regression via least absolute shrinkage and selection operator (LASSO) penalization was used to compute a classification model on the patient level, as radiomics features were measured at the lesion level (31). The so-called bags in MILR represent the patients and the instances in the bag represent the target lesions. First, the lesion-based outcome was added to each target lesion and a patient, or bag, was labelled with PD if one of the target lesions was classified as PD and was labelled SD only if both target lesions were classified as SD. For the patient-based analyses, the label of the bag was the patient-based outcome (Fig. 1). For each outcome measure, three radiomics models were trained: the AP model – AP-based features only; the PVP model – PVP-based features only; and the AP + PVP model – both AP- and PVP-based features. Next, known prognostic features, such as WHO grade and age, were considered for each model, to assess whether clinical features would improve the classification. Threefold cross-validation was used to obtain the optimal penalty value for the LASSO penalization in absence of an external validation set. For each iteration, 2000 possible values of the penalization parameter were tested and the model was trained with the best parameter on the whole dataset to obtain the final model. The performance of the models was assessed via receiver operating characteristic (ROC) curves and area under the ROC curve (AUC). The confidence intervals of the AUC were obtained via bootstrapping. Analyses were performed with R (4.1.0, MILR and pROC) and SPSS version 25.0 (IBM Corp., Armonk, NY, USA).
Results
Patients
Of the individuals, 46 were eligible for inclusion in this study (Fig. 2). Patient characteristics are listed in Table 1. A total of 19 (40%) patients had PD (group A) and 28 (60%) patients had SD (group B). None of the patients had defined CR or PR as defined by RECIST1.1. Median follow-up (interval between baseline and CE-CT from which radiomics features were calculated) was 9 months (range = 1–45 months) for group A and 19 months (range = 4–50 months) for group B.
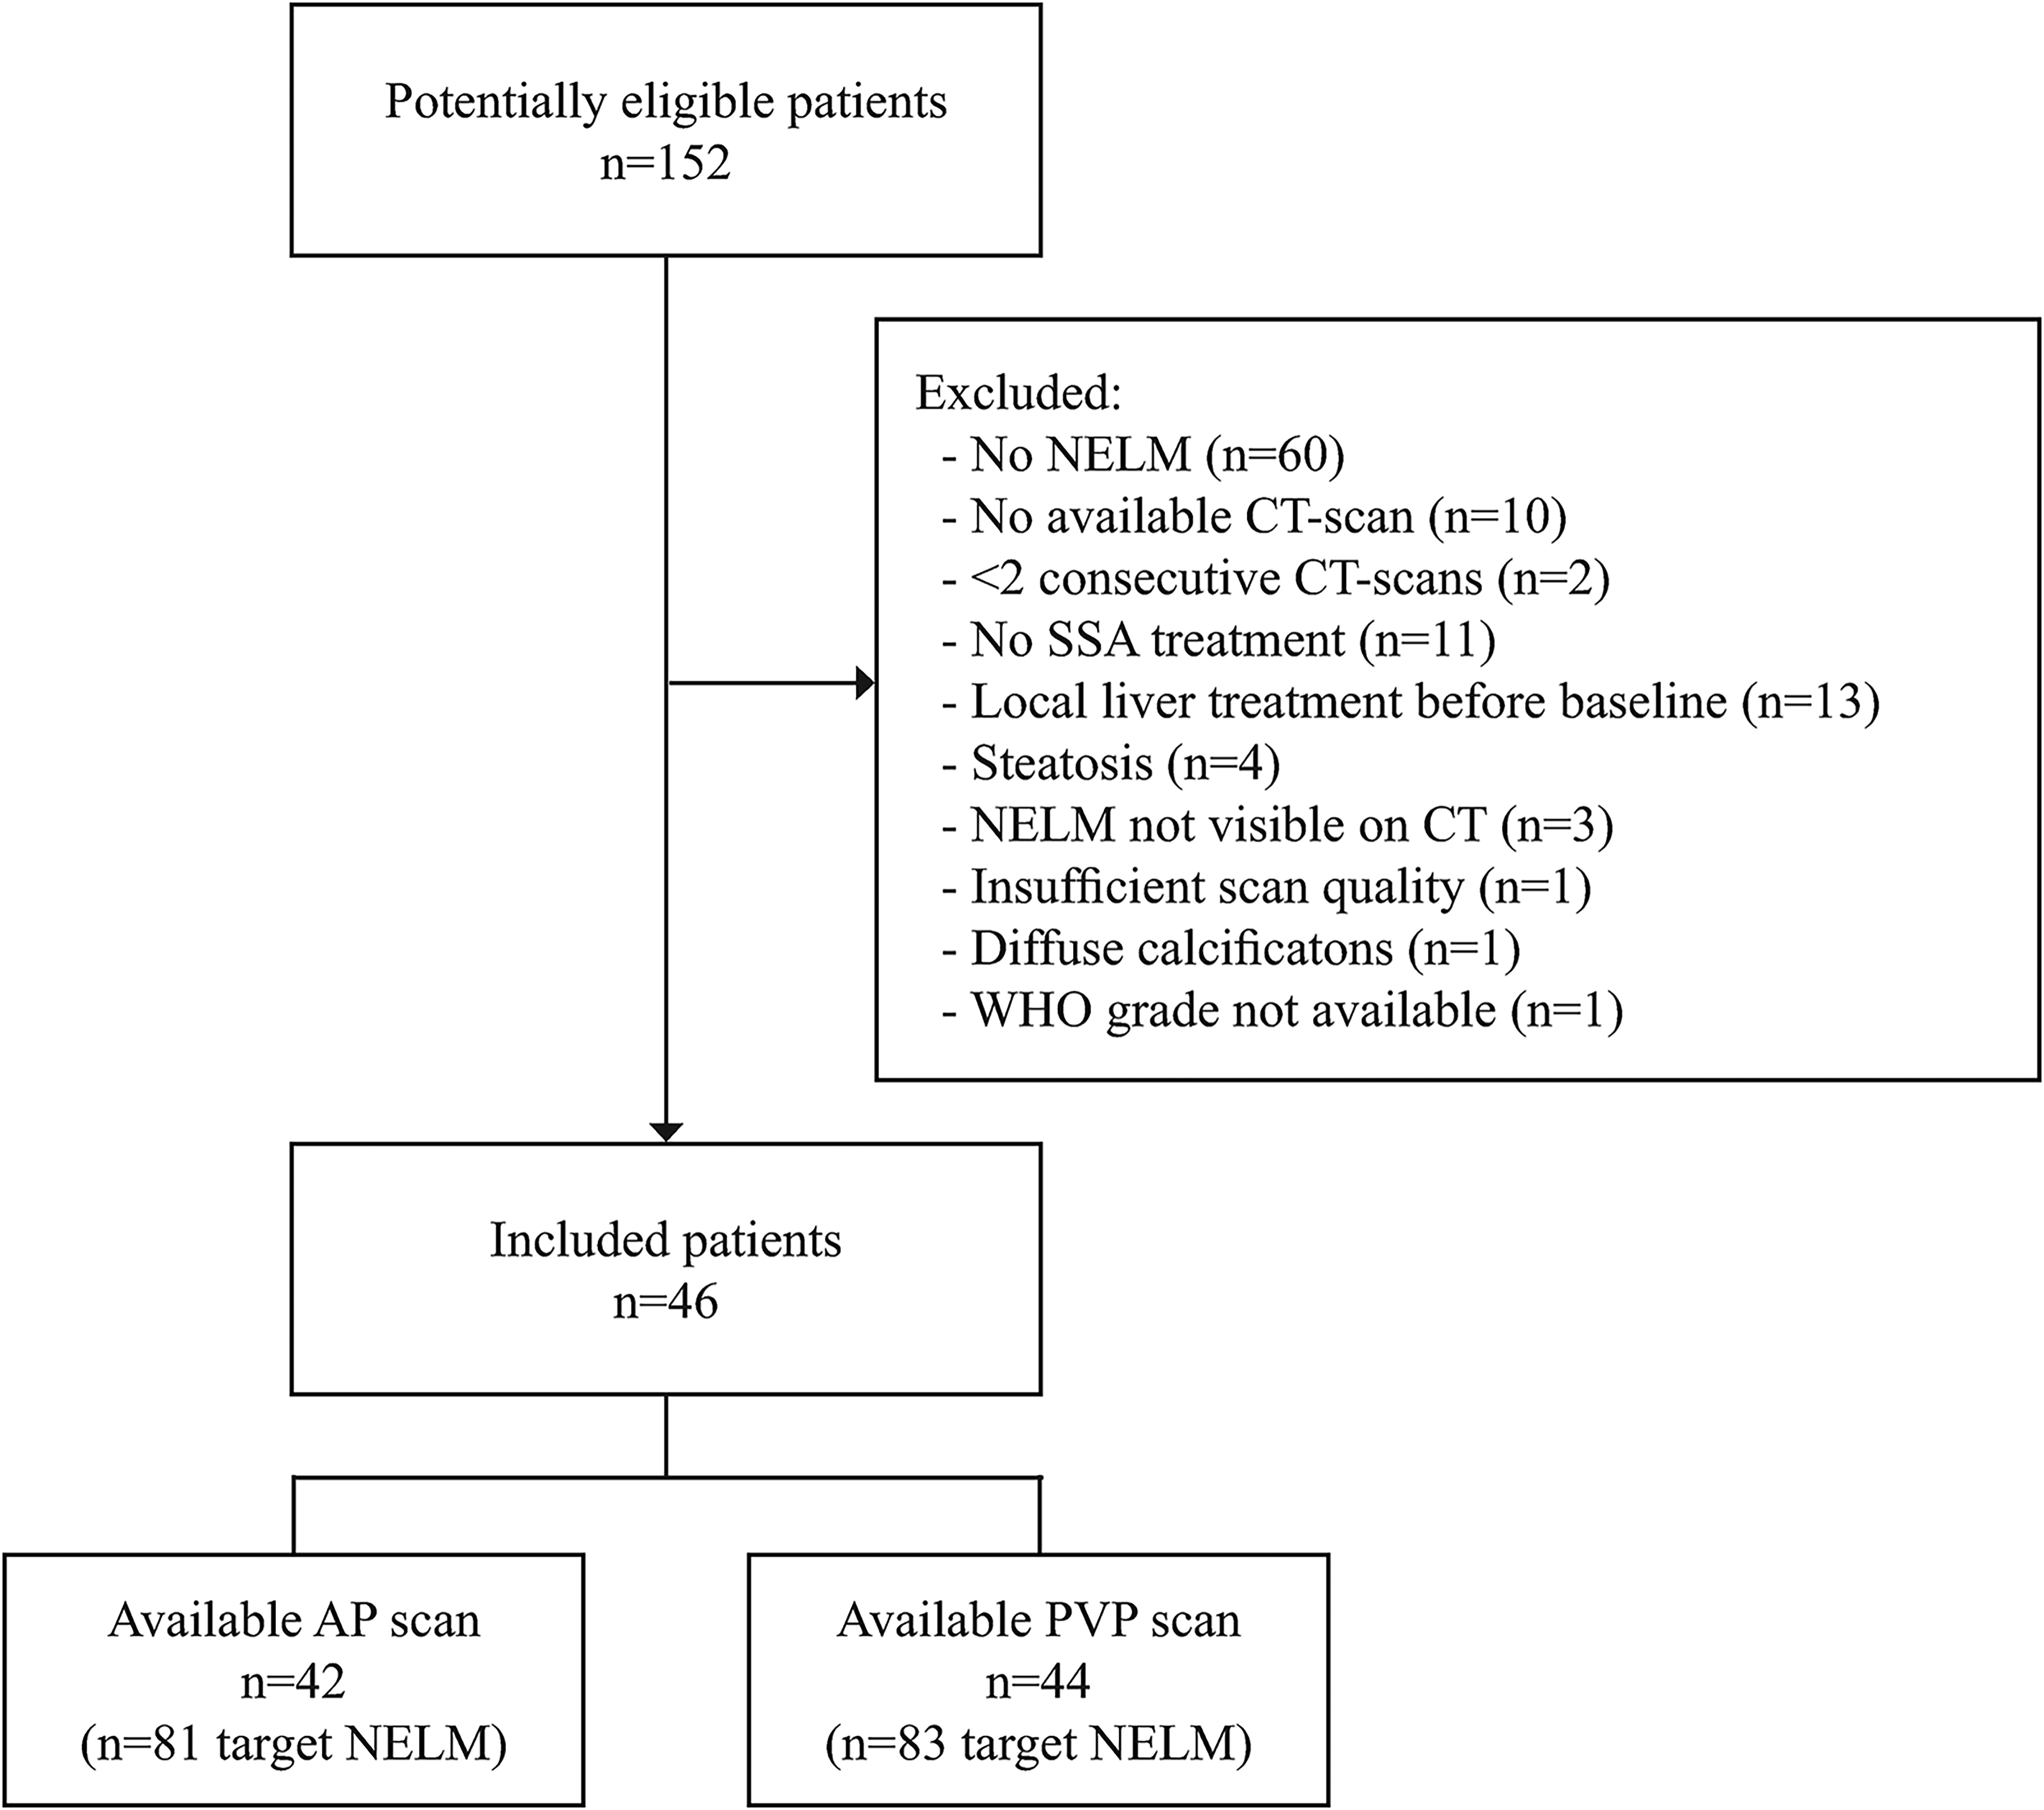
Flow chart of the patient selection. AP, arterial phase; CT, computed tomography; NELM, neuroendocrine liver metastases selected as target lesions by RECIST 1.1; PVP, portal venous phase; SSA, somatostatin analogue; WHO, World Health Organization.
Patient characteristics (n = 46).
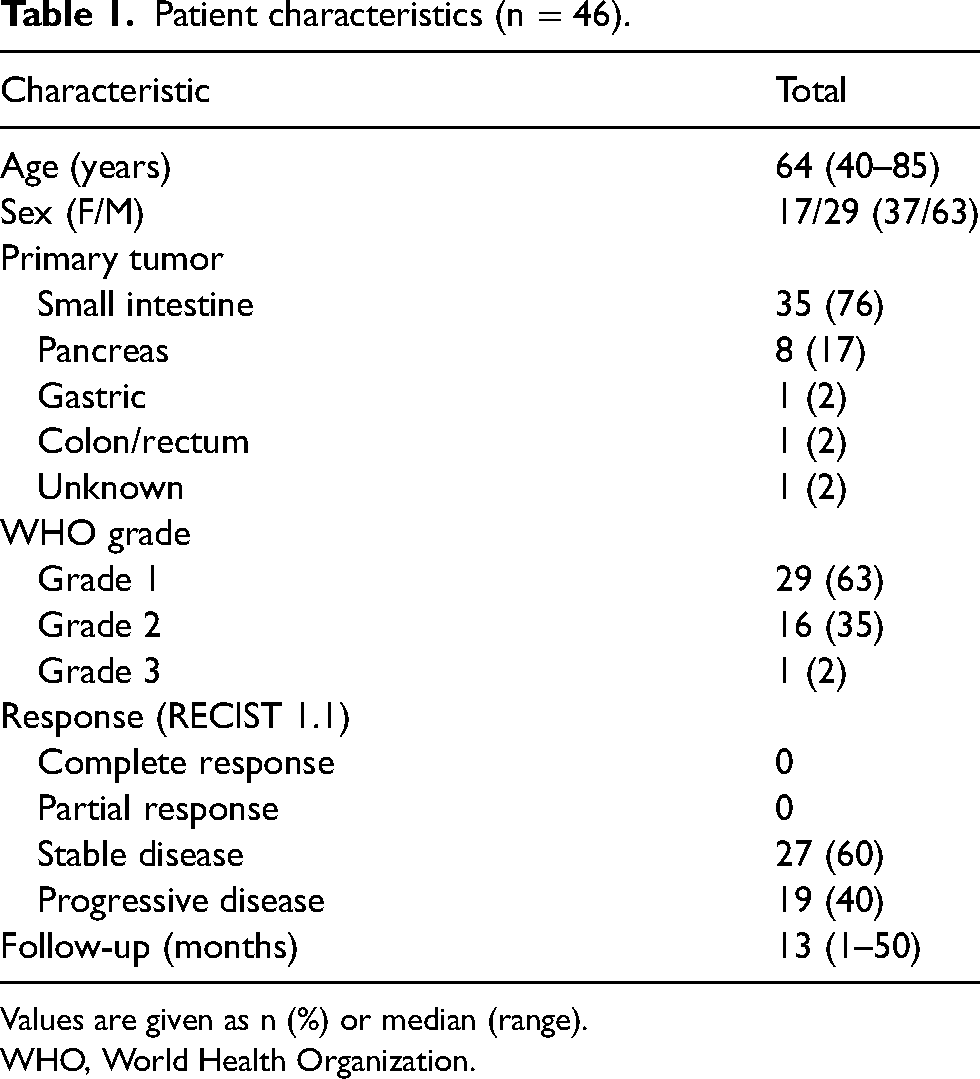
Values are given as n (%) or median (range).
WHO, World Health Organization.
Feature selection and univariate analysis
In total, 30 features of the 112 extracted features (AP: n = 10, PVP: n = 20) were not stable among scanners, according to Kruskal–Wallis testing of each phase separately. A total of 34 AP and 22 PVP radiomics features were excluded because of a high correlation, leaving 12 AP and 14 PVP features for further analysis. None of the features were significantly different between patients with PD and SD, on either AP or on PVP (Supplemental Tables S2 and S3).
Multivariable analysis
None of the clinical features (WHO grade and age) were selected by MILR as important features in the model based on clinical features only.
For the radiomics models, MILR based on the lesion-based outcome showed a moderate performance based on the AP (AUC = 0.60, 95% confidence interval [CI] = 0.46–0.75) (Table 2). The radiomics model based on PVP or AP + PVP model had a lower performance, yet not significantly different from the AP model (AUC = 0.44, 95% CI = 0.30–0.59 and AUC = 0.51, 95% CI = 0.43–0.59, respectively). Adding clinical variables did not improve the performance, regardless of the contrast phase (AUC = 0.48–0.53) (Table 2).
Performance of each model based on the lesion-based outcome.
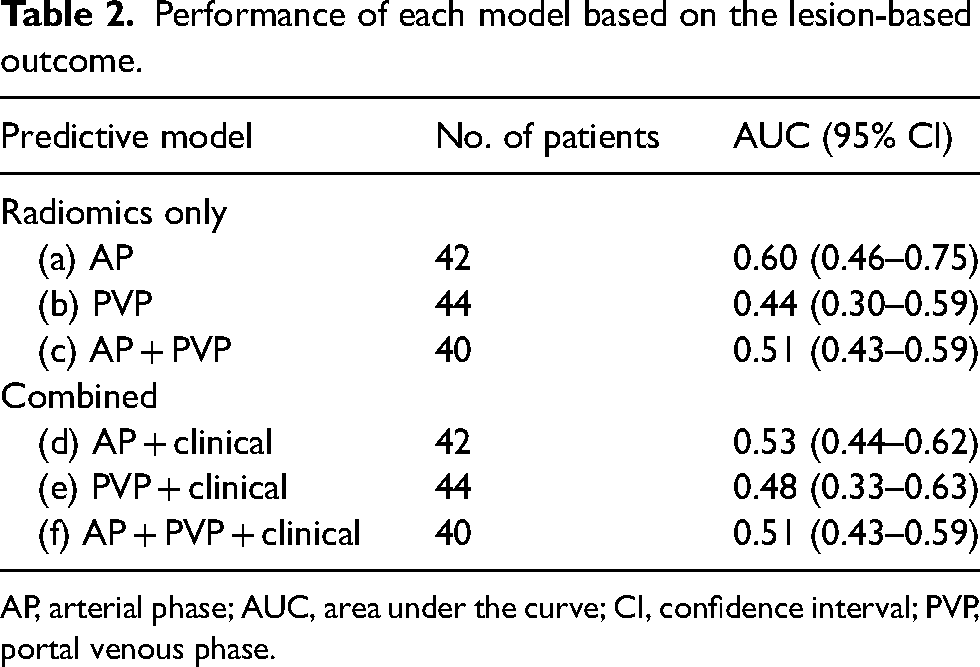
AP, arterial phase; AUC, area under the curve; CI, confidence interval; PVP, portal venous phase.
For the patient-based analyses, the models had an even lower performance measure, regardless of the contrast phase (AUC = 0.50–0.55) (Table 3). For either contrast phase, model performance for response classification according to RECIST1.1 improved by adding clinical variables and all three models had a similar low performance (AUC = 0.48–0.55) (Table 3). Performance did not improve when new liver lesions were not considered for patient-based outcome, regardless of the contrast phase (AUC = 0.48–0.53) (Table 4), nor did adding clinical variables to these models (AUC = 0.51–0.56) (Table 4). Supplementary Table S4 shows the selected features for each outcome.
Performance of each model based on the patient-based outcome.
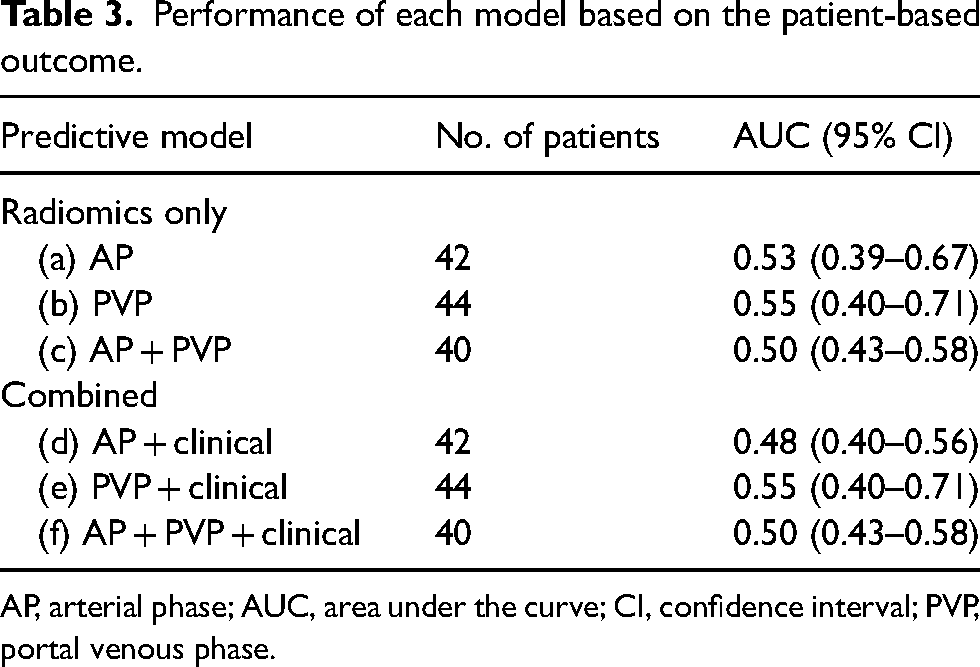
AP, arterial phase; AUC, area under the curve; CI, confidence interval; PVP, portal venous phase.
Performance of each model based on the patient-based outcome without taking new lesions into consideration.

AP, arterial phase; AUC, area under the curve; CI, confidence interval; PVP, portal venous phase.
Discussion
This explorative study aimed to identify radiomics features that show potential to distinguish progressive from stable disease response in patients with NELM who were treated with SSA, as a first step in investigating the feasibility of radiomics for prediction of response earlier during the course of the disease. Regardless of analysis type (lesion- or patient-based) and scan phase, no model could be developed that could accurately assess response with radiomics. Even when clinical variables were added to the model, performance did not improve. The best performance was observed for the lesion-based analyses based on the AP, yet the performance remained low (AUC = 0.60).
A few reasons exist that could account for the lack of success to develop a model that could accurately classify response. First, RECIST1.1 as a reference standard has limitations and its value for GEP-NET is debatable. Pathological response is the most accurate reference standard, but this is not feasible for NELM as it would require multiple biopsies. Due to the unfit reference standard, relevant radiomics features may be falsely dismissed, while in fact they would be relevant if a more accurate reference standard would have been applied. However, despite the obvious limitations, RECIST1.1 is still considered the most suitable method available for response assessment in patients with a GEP-NET, as it is used in clinical workflow and has been proven to be reproducible (6). A second possible explanation is that GEP-NETs exhibit a high biological heterogeneity and have, therefore, a wide range of possible phenotypes on imaging. In other words, the variance of radiomics features in each group is large, and as a result, feature values are overlapping in turn leading to the lack of a generalizable difference. Delta-radiomics, which analyses the changes in radiomics features over time in an individual lesion, captures the longitudinal changes within a NELM in more detail and could potentially aid in a more accurate response evaluation. This way, differences between the tumors are discarded, offering a more reliable assessment of the heterogeneous GEP-NET population. Delta-radiomics is still in a preliminary stage, but has shown promising results for treatment response in colorectal cancer (32–34) and lung cancer (35,36). An explorative study showed promising results for response to PRRT for NET in general (37). Because of the limitations of RECIST 1.1, it is recommended for future studies to either use a surrogate marker for response, such as overall survival (OS) or the Tumor Growth Rate (TGR) (11,38) or explore the value of delta-radiomics. Finally, MRI-based radiomics may be explored, as it has a higher sensitivity for the detection of (small) NELM compared to CT (39,40). It could be that CT does not provide enough detailed imaging for NELM, while MRI does provide more detail and information from different sequences, and therefore, has more potential response for classification.
No other studies are available for direct comparison that use radiomics in the specific cohort under study in this manuscript; however, reports are available on radiomics analyses on a similar cohort yet evaluating different outcomes or modalities. In GEP-NET patients treated with PRRT, conflicting results were reported regarding response and PFS (26,41) based on radiomics features derived from either the primary tumor or metastases on pre-treatment Ga68-DOTATATE-PET. Önner et al. reported that skewness and kurtosis were higher in non-responders to PRRT (26), while Werner et al. were not able to predict PFS with radiomics (41). Two other studies reported a lower entropy in patients with primary pNETs or pNET liver metastases that had a longer PFS on CE-CT (42,43), albeit in a cohort without SSA treatment. One study found no predictive radiomics features derived from Ga68-DOTATOC-PET for recurrence-free survival in patients with a pNET who underwent surgical resection (44). In general, the present study employed a more robust statistical methodology compared to previous studies, which predominantly performed univariate analyses without any validation.
A strength of the present study is that radiomics analyses were performed on both AP and PVP CT images and that two target lesions were included. Neuroendocrine tumors may only be clearly visible and delineable on one of both phases (45). In theory, it is expected that combining both phases improves the accuracy of the model compared to monophasic analyses. Neither phase was found to be superior to the other for response classification. Other studies found conflicting results regarding scan phase. Yu et al. reported that PVP-based radiomics features outperformed AP-based features to distinguish non-hypervascular pNETs from pancreatic adenocarcinoma (46), while Luo et al. found that an AP-based model was superior to a model based on either PVP or AP + PVP radiomics features for the prediction of tumor grade in pNETs (47). Given the conflicting results in small samples, it remains unclear what the best phase is to perform radiomics analyses on in NELM.
Remarkably, no additional value was found by adding prognostic clinical features to the radiomics model, while previous reports show that it usually improves the performance of models based on radiomics features only (48,49). Even addition of the WHO grade – a known prognostic factor for OS and PFS – did not improve the performance. A possible explanation is that WHO grade of the primary tumor sometimes differs from the WHO grade of the metastases (49).
The present study has some limitations. First, the study was retrospective and included a small number of patients. Second, the patient cohort was heterogeneous with regard to the primary tumor, grade, and treatment, yet only GEP-NETs were included and about 75% of the patients had a small-intestine NET. Patients did not receive an equal cycle of therapy and/or SSAs before analysis. However, GEP-NETs are relatively rare, and this cohort does reflect a real-life clinical situation in which treatment regimens for patients are different. Third, radiomics analyses were only performed on NELM, rather than other metastatic sites outside the liver. The main reason to focus on NELM was the high prevalence of NELM in GEP-NET patients and the impact they have on long-term outcome (50,51) and quality of life as well as the high reproducibility of measurements of NELM (52). Fourth, a single reader delineated all tumors; however, it has been reported that radiomics features are robust between different readers (53).
While the majority of previous radiomics studies in GEP-NET patients reported promising findings, this study found no radiomics features that could distinguish PD from SD in patients treated with SSA for NELM. Even though the results are negative, we believe that they can provide important insights for future research, which was also suggested by Song et al. (54). Therefore, we encourage researchers to publish both positive and negative findings and to focus on performing high quality studies with adequate methodology in which more definite evidence can be provided for the current pending issues in GEP-NET diagnosis, treatment and prognostication.
In conclusion, CT-based radiomics was not able to distinguish progressive from stable lesions at time of progression in patients with liver metastasized GEP-NETs treated with SSA, and therefore, it seems not feasible to predict response in this population with the current approach. The results of this exploratory study can be used as hypothesis-generating for further studies. Future research could explore delta-radiomics or MRI in an attempt to improve response assessment in GEP-NETs, preferably with a reference standard based on long-term outcome.
Supplemental Material
sj-pdf-1-acr-10.1177_02841851221106598 - Supplemental material for CT-based radiomics to distinguish progressive from stable neuroendocrine liver metastases treated with somatostatin analogues: an explorative study
Supplemental material, sj-pdf-1-acr-10.1177_02841851221106598 for CT-based radiomics to distinguish progressive from stable neuroendocrine liver metastases treated with somatostatin analogues: an explorative study by Femke CR Staal, M Taghavi, Eun K Hong, Renaud Tissier, Mark van Treijen, Birthe C Heeres, Dennis van der Zee, Margot ET Tesselaar, Regina GH Beets-Tan and Monique Maas in Acta Radiologica
Footnotes
Declaration of conflicting interests
The author(s) declared no potential conflicts of interest with respect to the research, authorship, and/or publication of this article.
Funding
The author(s) received no financial support for the research, authorship, and/or publication of this article.

Supplemental Material
Supplemental material for this article is available online.
References
Supplementary Material
Please find the following supplemental material available below.
For Open Access articles published under a Creative Commons License, all supplemental material carries the same license as the article it is associated with.
For non-Open Access articles published, all supplemental material carries a non-exclusive license, and permission requests for re-use of supplemental material or any part of supplemental material shall be sent directly to the copyright owner as specified in the copyright notice associated with the article.
