



Abstract
Background
Readout-segmented echo-planar imaging (RS-EPI) could improve the imaging quality of diffusion-weighted imaging (DWI) in various organs. However, whether it could improve the imaging quality and diagnostic performance for the patients with orbital tumors is still unknown.
Purpose
To compare the image quality and diagnostic performance of RS-EPI DWI with that of conventional single-shot EPI (SS-EPI) DWI in patients with orbital tumors.
Material and Methods
SS-EPI and RS-EPI DW images of 32 patients with pathologically diagnosed orbital tumors were retrospectively analyzed. Qualitative imaging parameters (imaging sharpness, geometric distortion, ghosting artifacts, and overall imaging quality) and quantitative imaging parameters (apparent diffusion coefficient [ADC], signal-to-noise ratio [SNR], contrast, and contrast-to-noise ratio [CNR]) were assessed by two independent radiologists, and compared between SS-EPI and RS-EPI DWI. Receiver operating characteristic curves were used to determine the diagnostic value of ADC in differentiating malignant from benign orbital tumors.
Results
RS-EPI DW imaging produced less geometric distortion and ghosting artifacts, and better imaging sharpness and overall imaging quality than SS-EPI DWI (for all, P < 0.001). Meanwhile, RS-EPI DWI produced significantly lower SNR (P < 0.001) and ADC (P < 0.001), and higher contrast (P < 0.001) than SS-EPI DWI, while producing no difference in CNR (P = 0.137). There was no significant difference on the diagnostic performance between SS-EPI and RS-EPI DWI, when using ADC as the differentiating index (P = 0.529).
Conclusion
Compared with SS-EPI, RS-EPI DWI provided significantly better imaging quality and comparable diagnostic performance in differentiating malignant from benign orbital tumors.
Keywords
Introduction
Diffusion-weighted imaging (DWI), which enables measurement of apparent diffusion coefficient (ADC), is considered an essential magnetic resonance imaging (MRI) method for diagnosing orbital disease (1–3). DWI has shown potential as an imaging biomarker for differentiating benign and malignant orbital lesions, and in assessing therapeutic response (4–11). In current clinical practice, single-shot echo-planar imaging (SS-EPI) is used most widely due to its resistance to patient motion and scanning speed (12). However, SS-EPI can result in geometric distortions, image blurring, ghosting artifacts, and problems related to fat suppression. These detrimental effects would become more severe at high-field MR strengths (13). Thus, the diagnostic ability of DWI based on SS-EPI would be limited.
Standard SS-EPI DWI is prone to distortion, primarily because of its long readout time and low bandwidth in the phase-encoding direction (14). Thus, previous investigators have developed several methods to address this issue, including half-Fourier acquisition single-shot turbo spin-echo imaging (HASTE), single-shot fast spin-echo, line-scan imaging, a reduced field-of-view (FOV) approach, and interleaved and parallel EPI approaches (14). These methods may yield high-quality images, but are not widely used owing to long acquisition times and the increased specific absorption rate for clinical resolution.
DWI based on readout segmented EPI (RS-EPI), with two-dimensional (2D) navigator echoes for reduced sensitivity to motion, has been suggested as an alternative imaging approach (12–22). In setting up RS-EPI DWI, the k space is divided into multiple segments along the direction of the readout. This permits the usage of shortened echo spacing in each segment, and can reduce geometric distortion and susceptibility artifacts by accelerating the k-space traversal along the direction of the readout (22). These superiorities of RS-EPI DWI have been found in the imaging scans of various organs at 3.0 T MRI, including pediatric and adult brains (13,15–17), breasts (19), kidneys (20,22), and the head and neck regions (21). In addition, one prior study has validated the feasibility of RS-EPI in orbital DWI, and reported that RS-EPI could improve the image quality of orbital DWI in healthy participants (23). However, to the best of our knowledge, no study has compared the lesion visualization and diagnostic performance of DWI based on standard SS-EPI and RS-EPI in patients with orbital tumors at 3.0 T.
Therefore, the purpose of our study is to evaluate the clinical utility of orbital RS-EPI DWI, and to compare its imaging quality and diagnostic performance with that of SS-EPI DWI in patients with orbital tumors at 3.0 T.
Material and Methods
Patients
This study protocol was approved by the institutional review board of our hospital; written informed consent was waived due to the retrospective nature of our study. The following inclusion criteria were applied to constitute the final group of 32 patients with orbital tumors (17 men, 15 women; mean age, 53 ± 13 years; age range, 25–88 years) in our study: (i) both SS-EPI and RS-EPI DWI were performed for pre-treatment MRI evaluation; (ii) the largest diameter of the lesion exceeded 1 cm; (iii) the image quality was adequate for further analysis; and (iv) the diagnosis was made based on the pathological examination
The group of 32 patients contained 21 patients with benign tumors (9 men, 12 women; mean age, 50 ± 10 years; age range, 25–66 years) and 11 patients with malignant tumors (8 men, 3 women; mean age, 58 ±16 years; age range, 28–88 years). Twenty-one benign orbital lesions comprised cavernous malformation (n = 10), pleomorphic adenoma of the lacrimal gland (n = 5), schwannoma (n = 3) and inflammatory pseudotumor (n = 2), and solitary fibrous tumor (n = 1). Eleven malignant orbital lesions comprised lymphoma (n = 10) and metastasis (n = 1).
MRI
MRI was performed with a 3.0-T MR scanner (Magnetom Verio; Siemens Healthcare, Erlangen, Germany) with a 12-channel head coil, with patients resting in the supine position. Conventional MRI was acquired using the following sequences: axial T1-weighted (T1W) imaging (repetition time/echo time [TR)/TE], 600/10 ms); axial, coronal, and sagittal T2-weighted (T2W) imaging (TR/TE, 4700/79 ms) with fat saturation; axial, coronal, and sagittal post-contrast T1W imaging with fat saturation (TR/TE, 600/10 ms).
Sequence parameters for SS-EPI and RS-EPI.

Qualitative comparisons of image quality
Criteria for qualitative comparison of image quality in DWI in patients with orbital tumors.

Quantitative comparisons of image quality
SNR was defined as the ratio between mean signal amplitude inside the region of interest (SROI) and standard deviation of the background noise (SBG) (SNR = SROI/ƠBG) (24). Contrast was defined as the ratio between the mean signal intensity of the lesion (SROI) and that of the brainstem on DW images (SB) (contrast = SROI/SB) (24). CNR was defined as the difference between SROI and SB divided by the standard deviation in the lesion ROI (ƠROI) and brainstem ROI (ƠB), as expressed by the following formula (24):
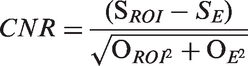
During the measurements of CNR, contrast, and SNR, the slice on which the orbital mass showed the largest diameter was chosen. Three circular ROIs were retrospectively placed on the mass (yellow), brainstem (green), and background (red) (Fig. 1a) on the DW image (b = 1000 s/mm2). Then, the CNR, contrast, and SNR were calculated manually according to the abovementioned formula.
ROI placements for the quantitative measurements. For the measurements of SNR, contrast, and CNR, three circular ROIs were placed on the mass (yellow), brainstem (green), and background (red), retrospectively (a). Then, they were calculated manually according to the corresponding formula. For the measurement of ADC value, ROIs were placed on each slice of the whole tumor (b). Then, the ADC value was calculated automatically by software.
In terms of the measurement of ADC, all imaging data were post-processed offline using in-house software (FireVoxel; CAI2R; New York University, NY, USA) (25). Whole-tumor ROIs were drawn on every slice encompassing the lesion (Fig. 1b), and ADC was calculated using the following formula: ADC = −ln(Sb/S0)/b, where b represents the diffusion sensitivity coefficients and Sb and S0 represent the corresponding signal values of the given ROIs.
Two independent radiologists (reader 1, with 15 years of experience; reader 2, with 5 years of experience), who were blinded to the study design and pathological results, retrospectively performed the qualitative and quantitative measurements. The average of the two measurements was adopted for analysis.
Statistical analysis
Continuous variables were expressed as mean ± standard deviation (SD), and the normality was tested using the Kolmogorov–Smirnov test. The differences of qualitative and quantitative parameters between SS-EPI and RS-EPI DW images were compared using paired t-tests. Receiver operating characteristic (ROC) curves were generated to evaluate the diagnostic ability of ADC values that were obtained from SS-EPI and RS-EPI DW images in differentiating orbital benign and malignant tumors, and then the area under curves (AUC) were compared using the method of Delong et al. (26).
The inter-reader variability of qualitative and quantitative metrics was assessed using Kappa analyses and intra-class correlation (ICC) coefficient, respectively (27). Bland–Altman plots were used to assess agreements in ADC values (28). The kappa and ICC coefficients were in the range of 0–1.00, and they were interpreted as follows: < 0.40, poor; 0.41–0.60, moderate; 0.61–0.80, good; r ≥ 0.81, excellent. Statistical analyses were performed using SPSS software (SPSS, version 19.0; SPSS, Chicago, IL, USA) and MedCalc software (MedCalc, version 9.0; MedCalc Software, Mariakierke, Belgium). A P value of 0.05 and less indicated a significant difference.
Results
Qualitative analysis
Qualitative and quantitative parameters between RS-EPI and SS-EPI.

Except for the P values, data are reported as mean ± standard deviation. Qualitative and quantitative measurements are based on all orbital tumors. Unit for ADC value is × 10–3 mm2/s.
ADC, apparent diffusion coefficient; CNR, contrast-to-noise ratio; ICC, intra-class correlation coefficient; RS-EPI, readout-segmented echo-planar imaging; SNR, signal-to-noise ratio; SS-EPI, single-shot echo-planar imaging.
Table 1 summarizes the average scores of the qualitative assessments of SS-EPI and RS-EPI. RS-EPI was superior to SS-EPI DW images regarding image sharpness (2.313 ± 0.454 versus 1.141 ± 0.261, P < 0.001), geometric distortion (2.609 ± 0.416 versus 1.203 ±0.333, P < 0.001), ghosting artifacts (2.672 ±0.373 versus 1.344 ± 0.410, P < 0.001), and overall imaging quality (2.750 ± 0.751 versus 4.359 ± 0.571, P < 0.001) (Fig. 2). Representative SS-EPI and RS-EPI DW images of the patients with orbital tumors are shown in Figs. 3 and 4.
Bar graph showing the comparison between SS-EPI and RS-EPI diffusion weighted images in terms of four qualitative imaging parameters. T2W image (a), SS-EPI DW image (b), and RS-EPI DW image (c) of a 48-year-old woman with pleomorphic adenoma of the lacrimal gland. A marked geometric distortion of the vitreous body was seen on the SS-EPI DW image, while these were significantly reduced on the RS-EPI DW image. T2W image (a), SS-EPI DW image (b), and RS-EPI DW image (c) of a 72-year-old man with orbital lymphoma. A marked distortion artifact that located behind the mass was seen on the SS-EPI DW image, while it was significantly reduced on the RS-EPI DW image.


Quantitative analysis
Detailed inter-reader ICC values for the measurements of quantitative parameters are listed in Table 3. The ICC values were 0.930 and 0.910 for SNR, 0.894 and 0.885 for contrast, and 0.825 and 0.891 for CNR of SS-EPI and RS-EPI DW images. These results indicated the excellent agreement between the two readers.
The comparisons of quantitative image parameters between SS-EPI and RS-EPI are listed in Table 3. SNR, contrast, and CNR were 134.870 ± 64.682, 0.875 ±0.374, and 6.159 ± 4.928 for SS-EPI, respectively, and 51.350 ± 19.241, 1.278 ± 0.615, and 4.650 ± 3.973 for RS-EPI, respectively. RS-EPI was superior to SS-EPI in SNR (P < 0.001) and contrast (P < 0.001), but not in CNR (P = 0.137).
Comparison of ADC value and diagnostic ability
Excellent inter-reader agreements were also obtained during the measurements of ADC values from SS-EPI or RS-EPI DW images (ICC, 0.991 and 0.988) (Table 3). Representative Bland–Altman plots reflecting the agreements of the measurements of ADC value from SS-EPI or RS-EPI DW images are shown in Fig. 5. The mean ADC values of all the orbital tumors on the RS-EPI DW images were significantly lower than those on the SS-EPI DW images (P < 0.001).
Bland–Altman plots showing the reproducibility of mean ADC derived from SS-EPI and RS-EPI DW images of orbital tumors. Difference of mean ADC value between two readers (y axis) was plotted against mean ADC value of two readers (x axis), with mean absolute difference (bias) (solid line) and 95% confidence interval of the mean difference (limits of agreement) (dashed lines). The plots in the figure showed the absolute ADC values from reader 2, while setting the ADC values from reader 1 as the standard.
Based on both SS-EPI and RS-EPI DWI, the mean ADC value of malignant tumors was significantly lower than that of benign mimics (SS-EPI, 0.715 ± 0.365 versus 1.199 ± 0.157, P < 0.001; RS-EPI, 0.666 ± 0.338 versus 1.140 ± 0.138, P < 0.001) (Fig. 6). Table 4 summarizes the diagnostic performance of ADC value from SS-EPI or RS-EPI DW images in differentiating orbital malignant from benign tumors. There was no significant difference in the AUC for the mean ADC value (AUC, SS-EPI versus RS-EPI, 0.887 versus 0.896, P = 0.529) (Fig. 7).
Bar graph showing the comparisons of ADC values between malignant and benign group. Diagnostic ability of ADC value obtained from RS-EPI and SS-EPI for differentiating orbital benign and malignant tumors. Unit for ADC value is 10−3 mm2/s. Data in parentheses indicates 95% confidence interval. ADC, apparent diffusion coefficient; AUC, area under curve; RS-EPI, readout-segmented echo-planar imaging; SS-EPI, single-shot echo-planar imaging. ROC curves of using mean ADC value derived from SS-EPI and RS-EPI DW images to differentiate benign and malignant orbital tumors.


Discussion
In our study, we demonstrated higher image quality of orbital DWI using RS-EPI, compared with the standard SS-EPI technique. In addition, no significant difference was found on the diagnostic performance of ADC value from SS-EPI and RS-EPI DW images for differentiating orbital malignant from benign tumors. RS-EPI technique significantly improved the image quality, while maintaining comparable diagnostic performance. Our study indicated RS-EPI might be a promising approach for quantitating orbital DWI.
In terms of the qualitative imaging assessment, RS-EPI was found to be superior to SS-EPI DWI in reducing geometric distortion and ghosting artifacts, while increasing image sharpness and overall image quality, which was consistent with previous studies (13–24). In RS-EPI DWI, the k space was divided into several segments along the direction of the readout. This permitted the use of shortened echo spacing in each segment, and then the reduction of T2* blurring, geometric distortion, and susceptibility artifacts by accelerating the k-space traversal along the direction of readout (22,29,30). Moreover, a navigator-based reacquisition technique was performed for phase correction in RS-EPI DWI, which can provide potential correction for shot-to-shot phase artifacts (22). Considering the abovementioned sequence characteristic, it was not surprising that RS-EPI could significantly improve the overall image quality of orbital DWI.
Controversial results have always existed in comparisons of SNR between SS-EPI and RS-EPI. Previously, Wu et al. found that RS-EPI had a higher SNR in renal DW images than SS-EPI did in an animal study (22). However, Bogner et al. insisted that the SNR of RS-EPI DWI of the breast was lower than that of SS-EPI (24). Our study agreed with the latter study. This can be explained by the more efficient k-space coverage of SS-EPI and higher actual resolution of RS-EPI (24). In addition, we added the average of the SS-EPI to 5, and therefore it was not surprising that the SNR of SS-EPI was higher than that of RS-EPI. Regarding SNR, we considered that it was difficult to conclude which sequence would have higher SNR, because SNR can be influenced by several factors, such as the optical TE, the effect of PSF, and the T2 value of the tissue measured (23). SNR depends on the specific protocol actually used to a large extent. In this study, no significant difference was found in the CNR between RS-EPI and SS-EPI, which was consistent with previous studies (24,29). Moreover, similar to previous studies, the contrast of orbital tumors on DW images was significantly better for RS-EPI than for SS-EPI, thus enabling better visual discrimination of orbital tumors on RS-EPI DWI (24).
As to the ADC value, controversial results have always existed among previous studies. Koyasu et al. found that there was no significant difference in the ADC value of parotid gland lesions between RS-EPI and SS-EPI DW images (21). However, Wisner et al. (31) and Zhao et al. (29) found that the mean ADC values derived from RS-EPI were lower than those from SS-EPI DWI. Our study results were in accordance with the latter two studies. As to the potential reason, Wisner et al. indicated that T2* blurring in SS-EPI DW images would make the ADC measurement be influenced by adjacent normal tissue with high ADC value (31). While Zhao et al. proposed that the distortion and artifacts might be a more reasonable explanation, because no adjacent normal tissue with high ADC value could be found in the sinonasal region (29). The distortion and artifacts which were more commonly seen in SS-EPI DW images, could result in the inhomogeneous ADC maps, and consequently make the measured ADC value increased. In our opinion, we give more support to the latter explanation. One prior study found no significant difference in the ADC value of the brainstem in the healthy volunteers between two DW images (23), therefore the former explanation does not seem reasonable. The difference might mainly result from the aforementioned distortion and artifacts. Therefore, the ADC value measured from RS-EPI DW images might be more accurate for the quantitation of Brownian motion of water molecules in orbital tumors.
In our study, we found the mean ADC value of malignant orbital tumors was significantly lower than that of benign mimics, and an ADC value of 0.727 × 10⁻³ mm2/s from SS-EPI DWI was optimal for the differentiation (sensitivity 81.8%, specificity 100%;). The cutoff value, sensitivity, and specificity were different from Razek et al. (cutoff value, 1.15 × 10⁻³ mm2/s; sensitivity 95%, specificity 91%) (8) and Sepahdari et al. (cutoff value, 1.0 ×10⁻³ mm2/s; sensitivity 63%, specificity 84%) (9). In our opinion, this controversy might be associated with the different magnetic field strength, MR acquisition parameters, and patients’ compositions (3).
Previously, Boner et al. found that, on the basis of an ADC threshold of 1.25 × 10⁻³ mm2/s, RS-EPI demonstrated a higher diagnostic accuracy for differentiating benign and malignant breast lesions than SS-EPI DW images (24). However, we did not find superior diagnostic ability for RS-EPI DW image in the present study. Limited sample size and monotonous pathological composition might be the potential reason for the non-superiority. Besides that, the ADC cutoff value derive from RS-EPI was different from that from SS-EPI. It implied that the ADC cutoff value derive from SS-EPI DW imaging could not be directly used in RS-EPI DWI related studies. Further study with larger sample size and more pathological compositions could help to clarify to the cutoff ADC value from RS-EPI DWI for differentiation, and provide more definitive evidence of the effect of RS-EPI DWI on diagnostic performance.
Our study had several limitations. First, the TE of the SS-EPI was slightly longer than that of the RS-EPI (85 versus 69 ms). This fact would benefit the RS-EPI DW image (14). Second, the ADC values derived from two DWI techniques were not correlated with histopathologic examination. Further studies performing this correlation analysis would help to clarify the value of ADC from RS-EPI DW images for accurately quantitating the Brownian motion of water molecules in orbital tumors. Third, the pathological composition of malignant group is very monotonous. Most of the cases were lymphoma patients. Therefore, further comparison between lymphoma and other malignancies could not been performed. Last, this study was performed at a single center with limited sample size. Further multicenter studies with a larger number of patients are needed to confirm our study results.
In conclusion, our study showed that RS-EPI can significantly improve the image quality of orbital DWI by reducing the susceptibility artifacts, distortion, and imaging blurring. RS-EPI DWI could be a robust tool for delineating the contours of tumors. Compared to SS-EPI, RS-EPI DWI showed comparable diagnostic performance in differentiating benign and malignant orbital tumors. Our study results confirm the feasibility of further usage of RS-EPI for orbital DWI in a clinical setting.
Footnotes
Declaration of Conflicting Interests
The author(s) declared no potential conflicts of interest with respect to the research, authorship, and/or publication of this article.
Funding
The author(s) received no financial support for the research, authorship, and/or publication of this article.