
Abstract
Background
The sensitivity of dynamic contrast-enhanced magnetic resonance imaging (DCE-MRI) for detecting breast cancer was high and the specificity was relatively low. However, diffusion-weighted imaging (DWI) has a high specificity in the diagnosis of malignant lesions.
Purpose
To evaluate the accuracy of the multiparametric MRI (mp-MRI) in distinguishing the breast malignant lesions from the benign lesions.
Material and Methods
A comprehensive search of the PubMed, Embase, and Cochrane Library electronic databases was conducted up to March 2020. Data were analyzed for the following indexes: pooled sensitivity and specificity; positive likelihood ratio; negative likelihood ratio; diagnostic odds ratio; and the area under the curve.
Results
A total of 2356 patients with 1604 malignant and 967 benign breast lesions were included from 22 studies. The pooled sensitivity, specificity, positive likelihood ratio, negative likelihood ratio, diagnostic odds ratio, and area under the curve for mp-MRI were 0.93, 0.85, 6.3, 0.08, 81, and 0.96, respectively. The pooled sensitivity, specificity, and area under the curve for DCE-MRI alone were 0.95, 0.71, and 0.92, respectively. The pooled sensitivity, specificity, and area under the curve for DWI alone were 0.88, 0.84, and 0.93, respectively.
Conclusion
The mp-MRI did not improve the sensitivity but increased the specificity for the diagnosis of breast malignant lesions.
Introduction
Breast cancer is the most common tumor suffered by women (1,2). An improvement in the accuracy of imaging diagnosis would help clinicians to make judgments and the patients to get timely treatment. Dynamic contrast-enhanced magnetic resonance imaging (DCE-MRI) has become an important tool for the detection, diagnosis, and stage of breast cancer (2–5). The morphological and functional features of the lesions could be obtained and analyzed using DCE-MRI (6,7); however, the sensitivity of DCE-MRI for detecting breast cancer was high and the specificity was relatively low (4,6,8–13). Thus, it may lead to unnecessary biopsy procedures (2).
Several studies have reported that the combination of diffusion-weighted imaging (DWI) and DCE-MRI could improve the specificity (2,4,6,8,10,11,13,14). DWI can reflect the diffusion of water molecules in the intracellular and extracellular spaces and be quantified by the apparent diffusion coefficient (ADC) (2,5,12,15). In some histopathological types of tumors, for example, the mean value of ADC of mucinous cancer may be higher than that of benign lesions for the content of mucin protein, of which the proportion is 2/47 and 1/75, respectively (16,17), but the diffusion of water molecules is limited in most malignant lesions due to the high cell density and the small extracellular space. Therefore, the mean value of ADC of malignant lesions is lower than that of benign lesions (18,19). This indicated that DWI has a high specificity in the diagnosis of malignant lesions. Some authors also demonstrated that the ADC can be used to differentiate malignant breast lesions from benign lesions (20–24). Meanwhile, the value of ADC could be used as an imaging biomarker for the diagnosis of breast cancer (25–28). Currently, the combination of DWI and DCE-MRI is defined as multiparametric MRI (mp-MRI) (29).
The aim of the present study was to retrospectively investigate whether the mp-MRI could improve the accuracy of the diagnosis of malignant breast lesions.
Material and Methods
Literature search
Studies that were published up to March 2020 were collected in PubMed, Embase, and the Cochrane Library electronic databases. To avoid the omission of studies, we used subject words plus free words in the search. The search words included breast, dynamic contrast-enhanced, DCE, DWI, diffusion-weighted, ADC, and apparent diffusion coefficient.
Data extraction
The studies that were included in the present study had to meet following criteria: the combination of DWI and DCE-MRI imaging; published in English; data obtained using a 1.5-T or 3.0-T MRI machine; sensitivity and specificity can be obtained directly or indirectly; and the final diagnosis was based on histopathological examination or follow-up. The main extracted data included the publication period, the first author, the type of study, the location of study, the age of the participants, the gold standard of diagnosis, machine type, coil type, lesion size, scan parameters, and true-positive (TP), false-positive (FP), false-negative (FN), and true-negative (TN) findings using DWI or ADC, DCE-MRI, and mp-MRI.
Statistical methods
Stata 15.0 was used to analyze the pooled sensitivity, specificity, positive likelihood ratio (PLR), negative likelihood ratio (NLR), diagnostic odds ratio (DOR), and summary receiver operating characteristic (SROC) curve. Quality assessment of study and risk of bias were achieved through Review Manager 5.2. Meta-regression analysis was used to analyze research type, MRI unit, and diagnosis standard by using Meta-Disc. Student’s t-test and analysis of variance (ANOVA) were performed on field strength and the minimum or maximum b-value by using SPSS 23. P values < 0.05 were considered statistically significant.
Results
Study selection and data extraction
The flow chart is shown in Fig. 1. A total of 785 studies were obtained by searching the PubMed, Embase, and Cochrane electronic databases, of which 260 were excluded for duplication and 249 studies were excluded after reading the title and abstract. A further 103 studies were excluded for the study type (not articles), 40 studies were excluded for the language, and 111 studies were excluded for failure to meet the eligibility criteria after carefully reading the full text: failure to extract the number of true positives, false negatives, false negatives, and true negatives; no mp-MRI to diagnose breast cancer; and did not use 1.5-T or 3.0-T MRI machines. Finally, 22 studies were included in the meta-analysis (2–4,8–12,14–17,29–38).
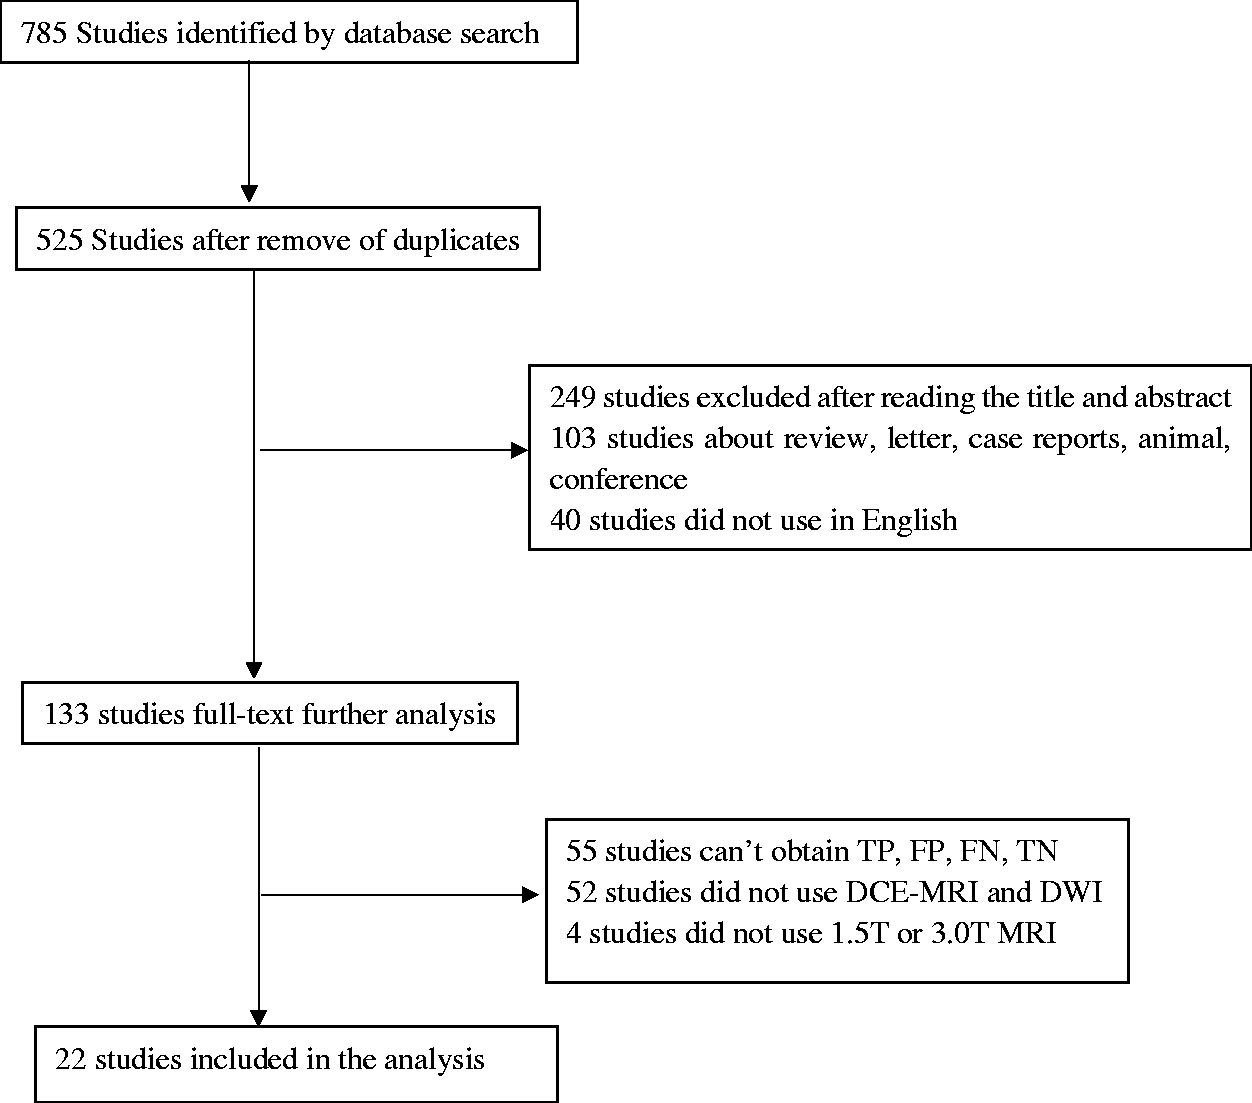
Flow chart of summarizing the selection and exclusion of studies.
The accuracy of mp-MRI in the diagnosis of breast cancer
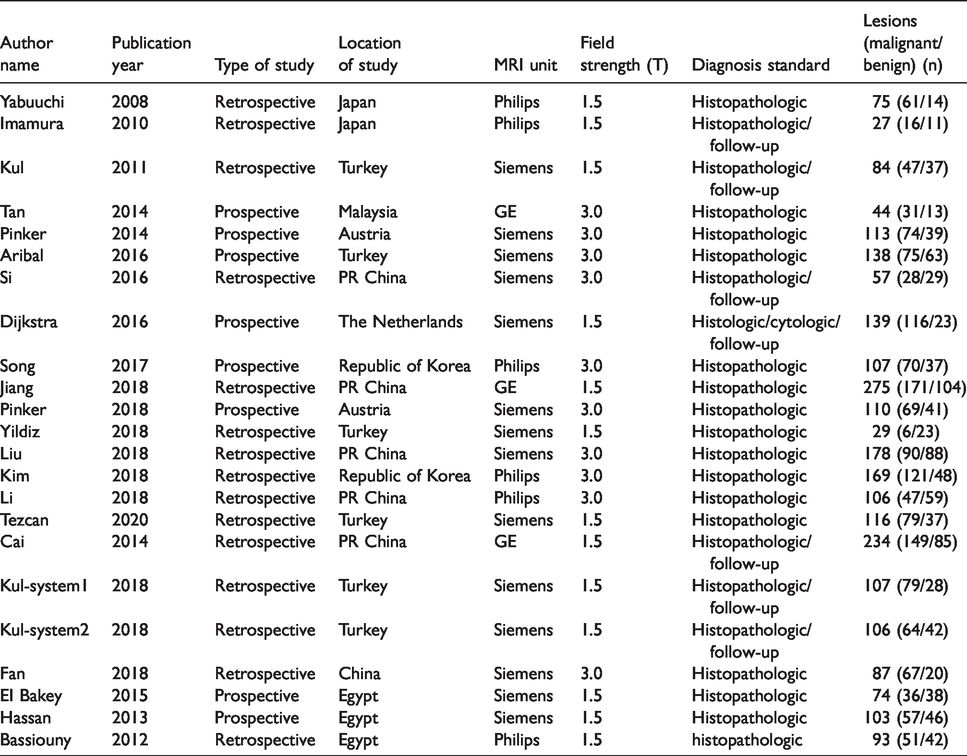
Table 1 showed the basic information of the studies, including the name of the primary researcher, published year, research type, MRI unit, field strength, diagnosis standard, the number of lesions (malignant/benign).
The key parameters extracted from the studies.
These results including the pooled sensitivity, specificity, PLR, NLR, DOR, and heterogeneity were shown in Table 2. There are strong heterogeneities for sensitivity and specificity among the 22 included results (I2 = 0.79, P < 0.001; I2 = 0.83, P < 0.001). The pooled sensitivity, specificity, PLR, NLR, and DOR for mp-MRI were 0.93, 0.85, 6.3, 0.08, and 81. The pooled sensitivity, specificity, PLR, NLR, and DOR for DCE-MRI alone were 0.95, 0.71, 3.3, 0.07, and 49. The pooled sensitivity, specificity, PLR, NLR, and DOR for DWI alone were 0.88, 0.84, 5.5, 0.14, and 40. The pooled sensitivity and specificity of mp-MRI for the diagnosis of breast malignant lesions are shown in Fig. 2.
The results of pooled estimates and heterogeneity measures for all studies.
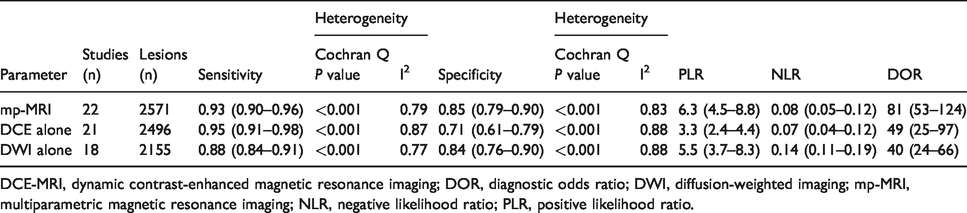
DCE-MRI, dynamic contrast-enhanced magnetic resonance imaging; DOR, diagnostic odds ratio; DWI, diffusion-weighted imaging; mp-MRI, multiparametric magnetic resonance imaging; NLR, negative likelihood ratio; PLR, positive likelihood ratio.
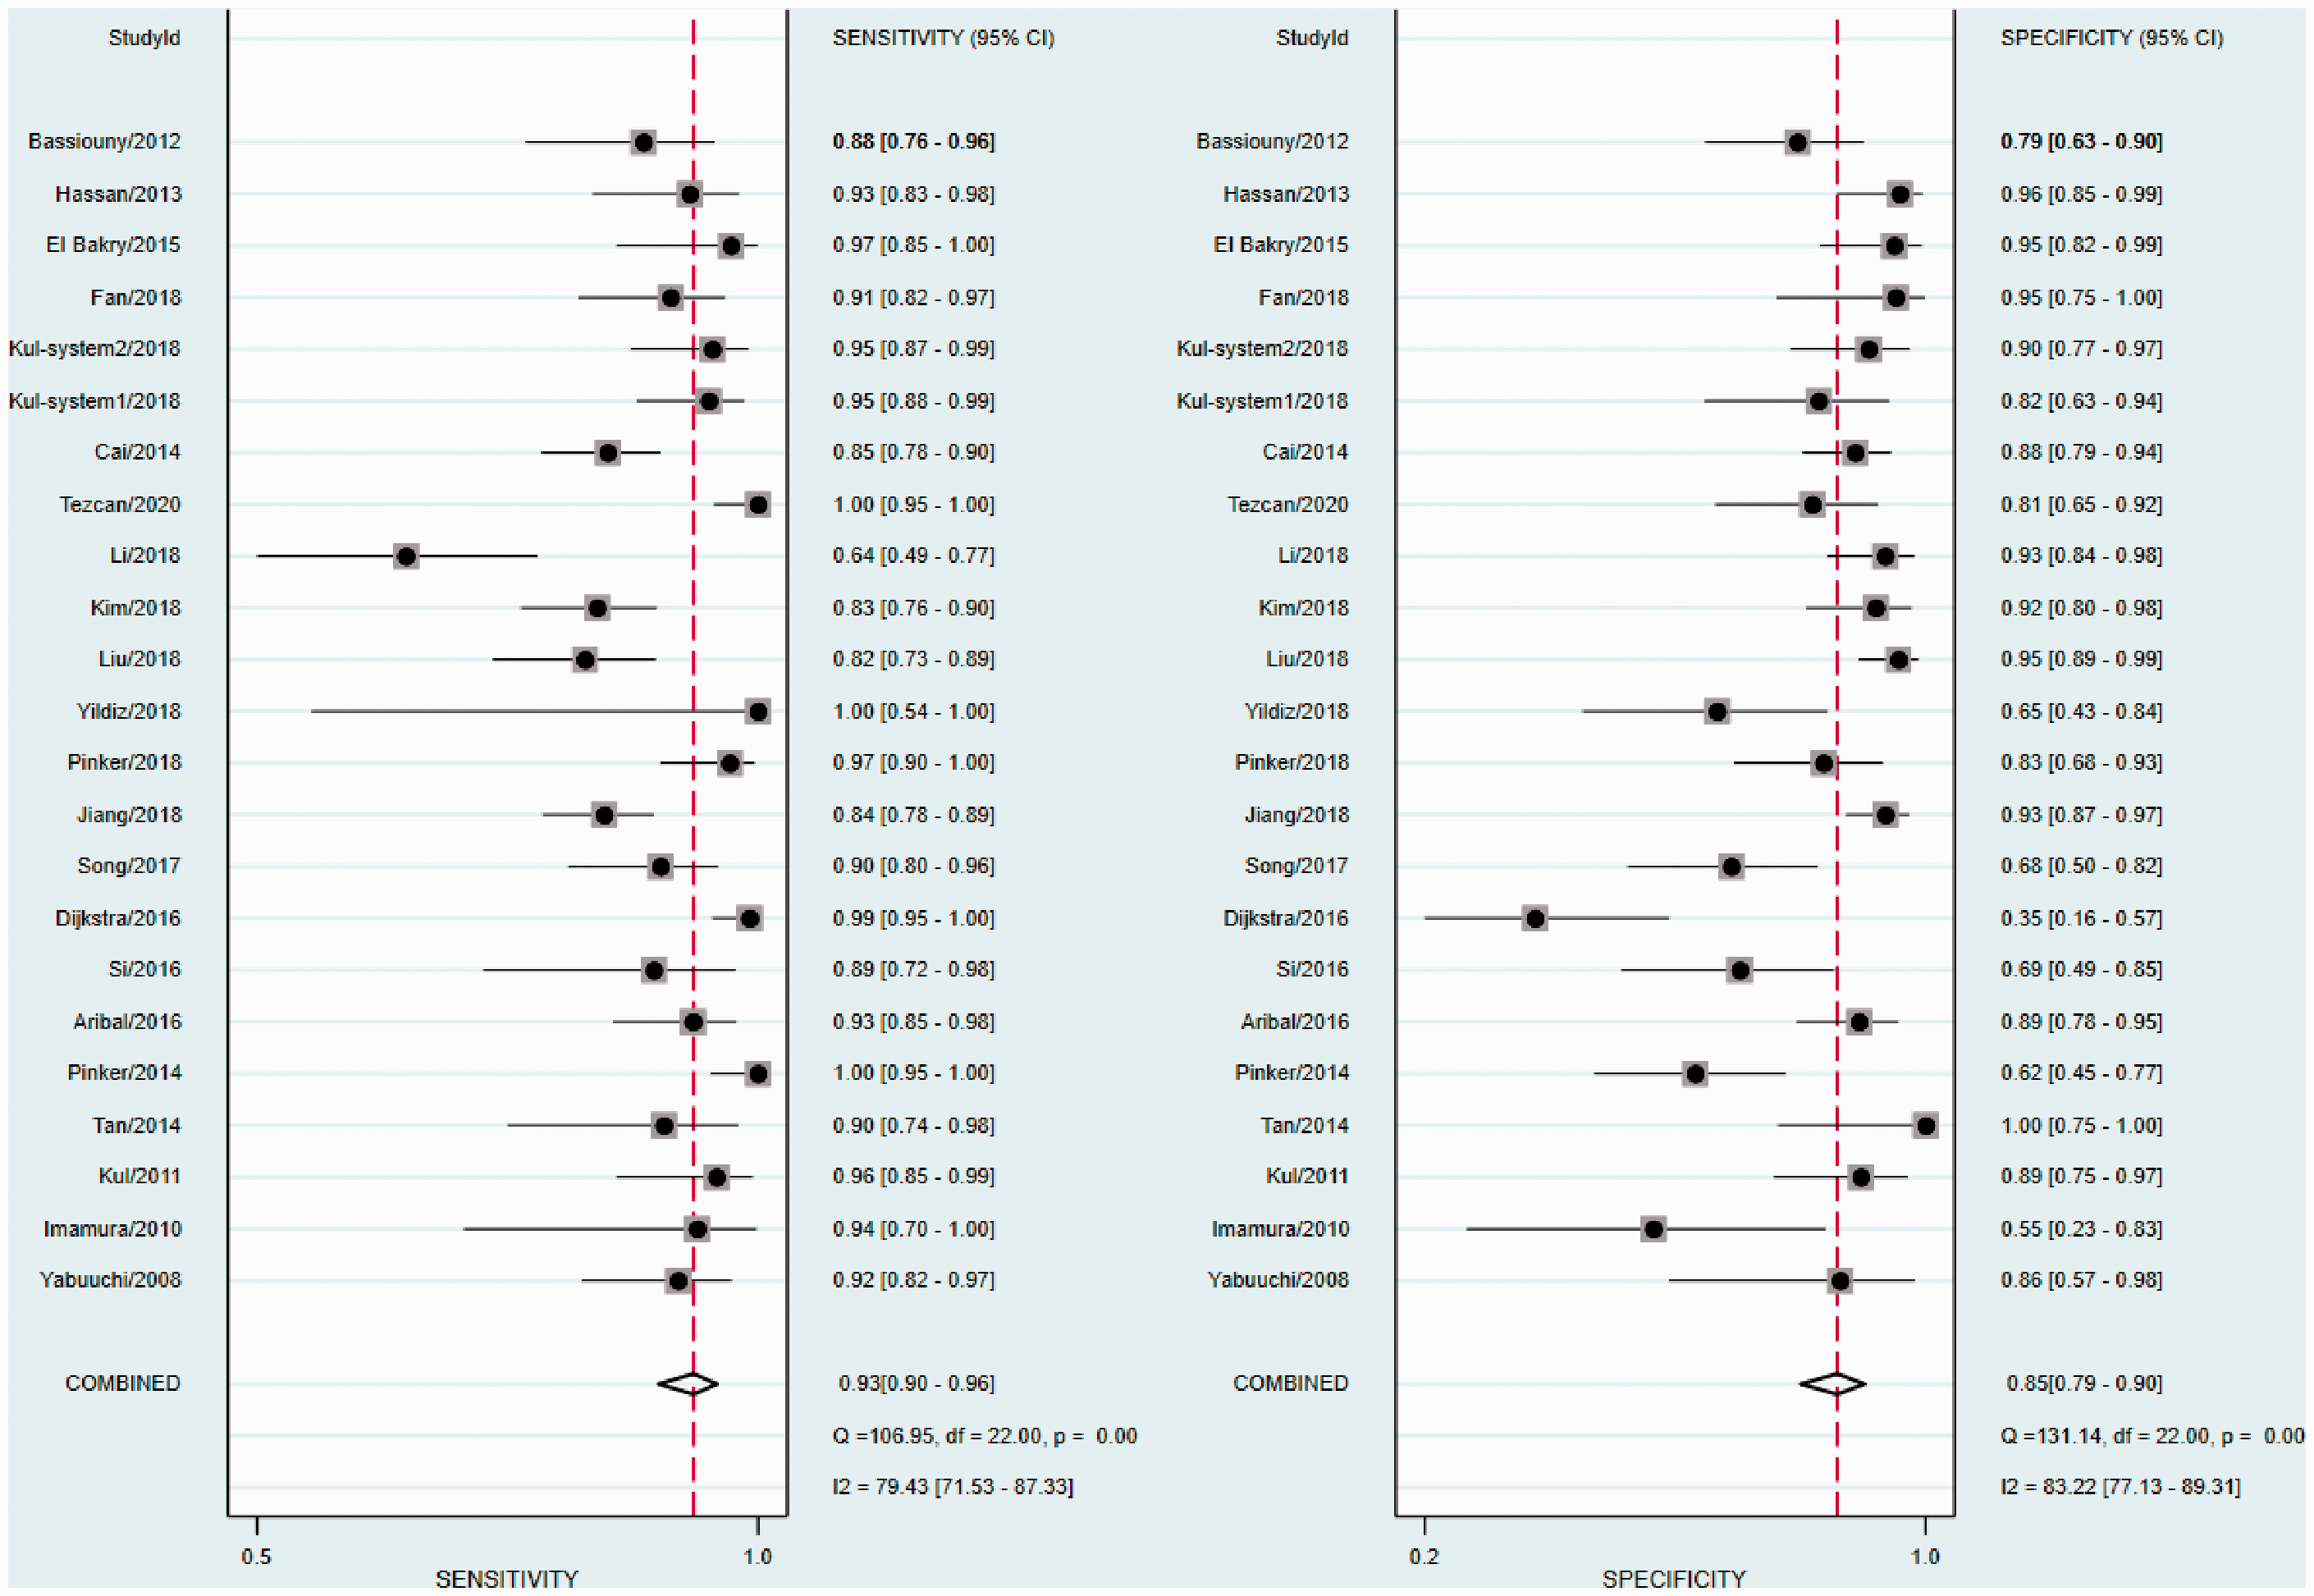
Forest plots of sensitivity and specificity of mp-MRI with 95% confidence intervals. mp-MRI, multiparametric magnetic resonance imaging.
The source of heterogeneity was analyzed by performing meta-regression analysis by removing the covariate with the largest P value one by one. In addition, the MRI unit was found to be related to the heterogeneity (relative diagnostic odds ratios (RDOR) = 1.74, 95% CI = 1.02–3.01, P = 0.042) and no threshold effect was found (R = 0.413, P = 0.05; Table 3)
Meta-regression (inverse variance weights, n = 22).

CI, confidence interval; MRI, magnetic resonance imaging; RDOR: relative diagnostic odds ratios.
SROC curves using mp-MRI, DCE alone, and DWI alone are shown in Fig. 3. The pooled area under the curve (AUC) was 0.95, 0.91, and 0.92 for mp-MRI, DCE alone, and DWI alone, respectively.
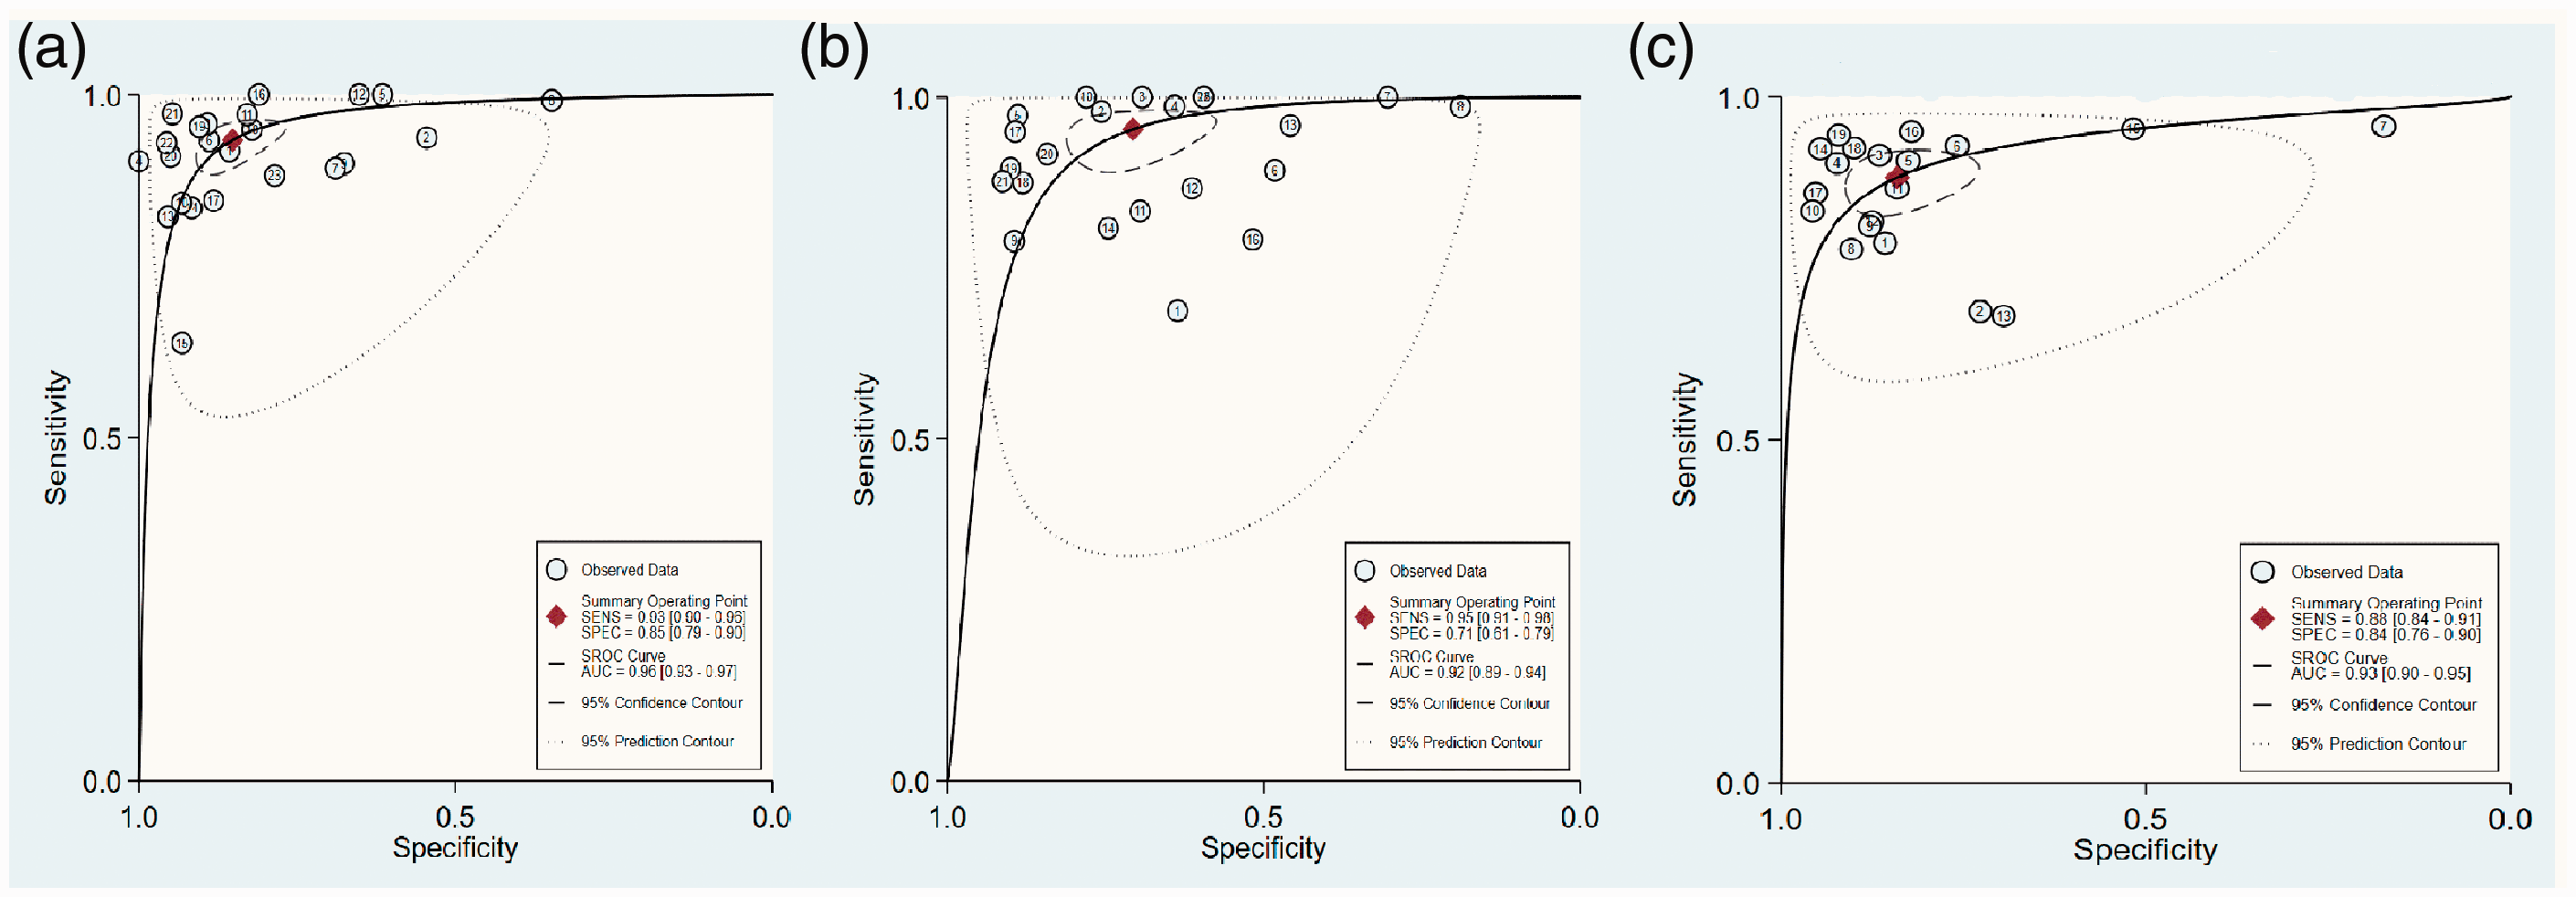
SROC curves by using mp-MRI (a), DCE-MRI alone (b), and DWI alone (c). DCE-MRI, dynamic contrast-enhanced magnetic resonance imaging; DWI, diffusion-weighted imaging; mp-MRI, multiparametric magnetic resonance imaging; SROC, summary receiver operating characteristic.
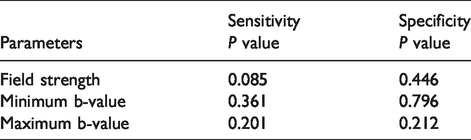
The Deeks’ funnel chart suggested that there was no publication bias in the included literature (P = 0.92). However, the Egger test indicated that there is a certain degree of publication bias (Fig. 4). Neither field strength nor the minimum or maximum b-values were found to be related to the sensitivity and specificity (Table 4).

The funnel plots (a) and Egger test (b). The asymmetry in the funnel plots indicated there was no publication bias (P = 0.92), while the Egger test indicated there may be publication bias.
Results of different sub-analyses.
Discussion
MRI is a non-invasive, non-ionizing radiation and multi-directional imaging technology, and it has been widely used in clinical examination of breast lesions (11). Currently, DCE-MRI is the most sensitive imaging technology, which can evaluate tumor morphology and semi-quantitative enhancement kinetics (7). However, due to the lower specificity of DCE-MRI, DWI has been added to the DCE-MRI to improve its specificity (39). The results of this meta-analysis show that the sensitivity and specificity of mp-MRI are 0.93 and 0.85, and the specificity was higher than that of DCE-MRI alone. In addition, the AUC was 0.96, indicating that the diagnostic efficacy of the mp-MRI was reliable.
The heterogeneity was affected by the threshold effect and the non-threshold effect. Generally, many factors, such as research type, population selection, and different imaging techniques, might lead to heterogeneity by affecting the non-threshold effects. In the present study, the research type, MRI unit, and diagnosis standard were analyzed to decrease the heterogeneity for the non-threshold effect. The MRI unit was found to be related to the heterogeneity. However, due to the heterogeneity being too high, it was still necessary to expand the sample size and optimize the selection of influencing factors to further study the source of heterogeneity.
The main parameters of DCE-MRI include Ktrans (volume transfer coefficient), Kep (flux rate constant), Ve (extracellular volume ratio), Vp (plasma fraction), and contrast enhancement kinetic. The contrast enhancement kinetic can be divided into three categories: 1 = persistence type I (persistent enhancement); 2 = plateau type II (initial strong enhancement and plateau phase); 3 = wash-out type III (initial strong enhancement and wash-out) (3,17). Several authors have demonstrated that the number of benign breast lesions among the lesions with type I contrast enhancement kinetic was larger than that among lesions with type II or type III contrast kinetics. It means that the lesions with type I contrast kinetic tend to be benign (36,40–42). In addition, the number of malignant breast lesions was larger among the lesions with type III contrast enhancement kinetic than that among the lesions with type I or type II contrast enhancement kinetics (36,40–42). This phenomenon in the tumor tissue mainly resulted from more new blood vessels and a high permeability of blood vessels, leading to contrast agents quickly entering the blood vessel cavity. These abovementioned parameters were the main parameters to distinguish the malignant breast lesions from benign lesions.
The field strength can contribute to the improvement of the quality of the image. 3.0-T MRI can increase the signal-to-noise ratio of the image and improve the temporal and spatial resolution of the image; thus, it may detect smaller lesions (2,43–45). However, because the size of most selected lesions in the present study was >10 mm, no significant difference was found between 1.5-T MRI and 3.0-T MRI in the accuracy of the diagnosis of breast cancer. A meta-analysis has also shown that 3.0-T MRI does not have an obvious advantage in the diagnostic accuracy for breast cancer when compared with 1.5-T MRI (46).
DWI is a new technology of functional MRI, which can indirectly reflect the characteristics and changes of tissue microstructure. Due to the different structures of different tissue, the directions of diffusion of water molecules in them are also different. These directions were limited by the cell membrane and myelin sheath. Several authors reported that the mean ADC value of the malignant breast lesion was no more than 1.46 × 10⁻³ mm2/s (47). However, there is currently no uniform clinical applicable ADC value to discriminate benign and malignant breast lesions (48). Dijkstra et al. (9) reported the specificity of mp-MRI was only 34.8%. The reason may be that the value of the ADC threshold (2 × 10⁻³ mm2/s) is too large, which would increase the number of false positives, unnecessary biopsies, and even the psychological burden on patients.
At least two b-values are required for calculating the ADC value, so b-values may be used to distinguish the malignant breast lesions from the benign breast lesions. When the b-value is bigger, the ADC value is less affected by blood perfusion and can better reflect the diffuse movement of water molecules in the tissue. Compared to benign lesions, the malignant lesions can be easily detected using this technology, but the quality of the image from the technology will be low (13). Studies have shown that the optimal b-value is 800 s/mm2 (13,49). However, Chen et al. (50) revealed that it did not affect the accuracy of diagnosis of benign and malignant breast tumors when the maximum b-value was in the range of 600–1000 s/mm2. The previous meta-analysis results showed that the minimum or maximum b-value had no statistical significance for improving the diagnosis of breast lesions (51), and the result of the present study is consistent with them. The maximum b-value was 800, 850, or 1000 s/mm2, and the minimum b-value was usually 0 or 50 s/mm2 in these included studies.
The present study has several limitations. First, the different scanning parameters (such as section thickness, spatial resolution, scanning field of view, the method of delineating the region of interest, etc.) could have effects on breast cancer images. It was necessary to further optimize the imaging techniques, but there has not been a uniform standard. Second, some physiological activities including breathing motion, beating heart, and blood flow perfusion might decrease the accuracy of diagnosis. Third, the numbers of true positives, false negatives, false positives, and true positives were calculated from the sensitivity and specificity in some literature. Rounding was used when decimals appeared, which may lead to lower accuracy. Fourth, when several parameters were used in DCE-MRI, the parameter with the maximum sum of sensitivity and specificity is selected for analysis in a study, which may decrease the accuracy of data due to inconsistent use of parameters. Fifth, the types, dose, and injection speed of the contrast agents could affect the quality of DCE-MRI, which might affect pooled sensitivity and specificity.
In conclusion, although mp-MRI has comparable sensitivities, it could increase the specificity. Thus, mp-MRI may be more valuable than DWI alone and DCE-MRI alone in distinguishing malignant breast lesions from benign lesions. It is necessary to further explore the value of mp-MRI in breast diseases by increasing the sample size and using the standard parameters in the future.
Footnotes
Declaration of conflicting interests
The author(s) declared no potential conflicts of interest with respect to the research, authorship, and/or publication of this article.
Funding
The author(s) received no financial support for the research, authorship, and/or publication of this article.