
Abstract
Background
The computed tomography angiography (CTA) spot sign represents active contrast extravasation within acute primary intracerebral hemorrhage (ICH) and is an independent predictor of hematoma expansion (HE) and poor clinical outcomes. The spot sign could be detected on first-pass CTA (fpCTA) or delayed CTA (dCTA).
Purpose
To investigate the additional benefits of dCTA spot sign in primary ICH and hematoma size for predicting spot sign.
Material and Methods
This is a retrospective study of 100 patients who underwent non-contrast CT (NCCT) and CTA within 24 h of onset of primary ICH. The presence of spot sign on fpCTA or dCTA, and hematoma size on NCCT were recorded. The spot sign on fpCTA or dCTA for predicting significant HE, in-hospital mortality, and poor clinical outcomes (mRS ≥ 4) are calculated. The hematoma size for prediction of CTA spot sign was also analyzed.
Results
Only the spot sign on dCTA could predict high risk of significant HE and poor clinical outcomes as on fpCTA (P < 0.05). With dCTA, there is increased sensitivity and negative predictive value (NPV) for predicting significant HE, in-hospital mortality, and poor clinical outcomes. The XY value (product of the two maximum perpendicular axial dimensions) is the best predictor (area under the curve [AUC] = 0.82) for predicting spot sign on fpCTA or dCTA in the absence of intraventricular and subarachnoid hemorrhage.
Conclusion
This study clarifies that dCTA imaging could improve predictive performance of CTA in primary ICH. Furthermore, the XY value is the best predictor for CTA spot sign.
Introduction
Primary intracerebral hemorrhage (ICH) accounts for 10–15% of all strokes and carries a mortality rate of about 40% within one month (1,2). Half of these deaths occur within the first 48 h and frequently result from early hematoma expansion (HE) (3). Several reports proposed the spot sign on computed tomography angiography (CTA) as a radiological marker predictive of HE in the acute stage, in-hospital death, and 90-day mortality for primary ICH (4–8). However, there are variabilities in CTA acquisitions at each institution. It is known that the CTA spot sign is a dynamic process, which is also present on delayed CTA (dCTA), venous phase CTA, dynamic CTA, post-contrast CT (PCCT), and CT perfusion (CTP) (9–16). Some articles have described that delayed or venous CTA imaging would improve spot sign detection (9–12). Most studies reported the pooled results of spot sign jointly detected by the first-pass CTA (fpCTA) and dCTA, and the clinical importance of spot sign detected only on dCTA but not fpCTA was rarely mentioned (17). In this study, we attempt to determine the additional benefits of spot sign detected only on dCTA for predicting significant HE, in-hospital mortality, and poor clinical outcomes in primary ICH. The non-contrast CT (NCCT) hematoma size was also analyzed for prediction of the spot sign on fpCTA or dCTA in primary ICH.
Material and Methods
This retrospective study was approved by the Institutional Review Board of our institution. The requirement to obtain informed consent was waived due to its retrospective nature. All patients’ records/information were anonymized and de-identified prior to analysis.
Patient selection
A retrospective review was performed on consecutive patients presenting with ICH from January 2011 to December 2013 who underwent NCCT and CTA of the brain. In total, 156 cases were reviewed but only patients where NCCT demonstrated ICH were included. All included patients were admitted to our emergency department due to clinical symptoms. Fifty-one patients with secondary ICH, including trauma, aneurysm, vascular malformations, neoplasms, venous infarction, or hemorrhagic transformation of ischemic infarction, were excluded. Five patients were excluded due to a delay of more than 24 h from the onset of symptoms to the performance of CTA. A total of 100 patients (64 men, 36 women; mean age = 57.6 years) with primary ICH were finally included.
Clinical data
Clinical data were obtained from reviewing clinical charts, electronic records, surgical operation notes, outpatient follow-up, and telephone access if required. Glasgow Coma Scale (GCS) scores and National Institutes of Health Stroke Scale (NIHSS) on arrival were recorded. In-hospital mortality and modified Rankin Scale (mRS) on discharge were also recorded. Poor clinical outcome was defined as (i) the inability to walk or attend to one’s own bodily needs without assistance (mRS 4); (ii) being bedridden, incontinent, and requiring constant nursing care and attention (mRS 5); or (iii) death in hospital or within three months after hospital discharge (mRS 6) (18).
Image acquisition
CT imaging was obtained with a 64-slice CT scanner (Somatom Definition; Siemens Medical Solutions, Erlangen, Germany). NCCT images of brain were acquired from the skull base to the cranial vertex with the following parameters: 120 kVp, 380 mAs, slice thickness/spacing = 4.8/4.8 mm. The protocol of brain CTA at our institution includes fpCTA and dCTA imaging (Fig. 1). The brain fpCTA studies are acquired with imaging parameters of 120 kVp, 200 mAs from the atlas (C1) to the cranial vertex in the helical scan mode. Non-ionic iodinated contrast medium (Optiray, 320 Mallinckrodt Medical Inc., St. Louis, MO, USA) at a rate of 3.0 mL/s with volume of 100 mL (if the body weight of the patient was <50 kg, the dosage was volume of body weight × 2 mL) was administered via the antecubital vein. The fpCTA imaging was acquired at 10–15 s delay after the contrast medium injection according to the bolus-tracking technique. Volume data of fpCTA were then reformatted into two-dimensional (2D) maximum intensity projection (MIP) imaging for interpretation with slice thickness/spacing of 7/2 mm in axial, coronal, and sagittal planes. dCTA imaging encompasses an approximately 60 s delayed post-contrast CT acquisition after the first-pass scan without a new bolus of contrast (Fig. 1). dCTA imaging was acquired with the following parameters: 120 kVp, 380 mAs, slice thickness/spacing = 4.8/4.8 mm. Studies were then viewed on a Picture Archiving and Communication System (PACS) (INFINITT PACS; INFINITT Healthcare, Seoul, Republic of Korea) workstations.
The timing of NCCT, fpCTA, and dCTA are documented. The HER (mL/min) is calculated by changes in hematoma volumes between NCCT and dCTA divided by the amount of time lapsed.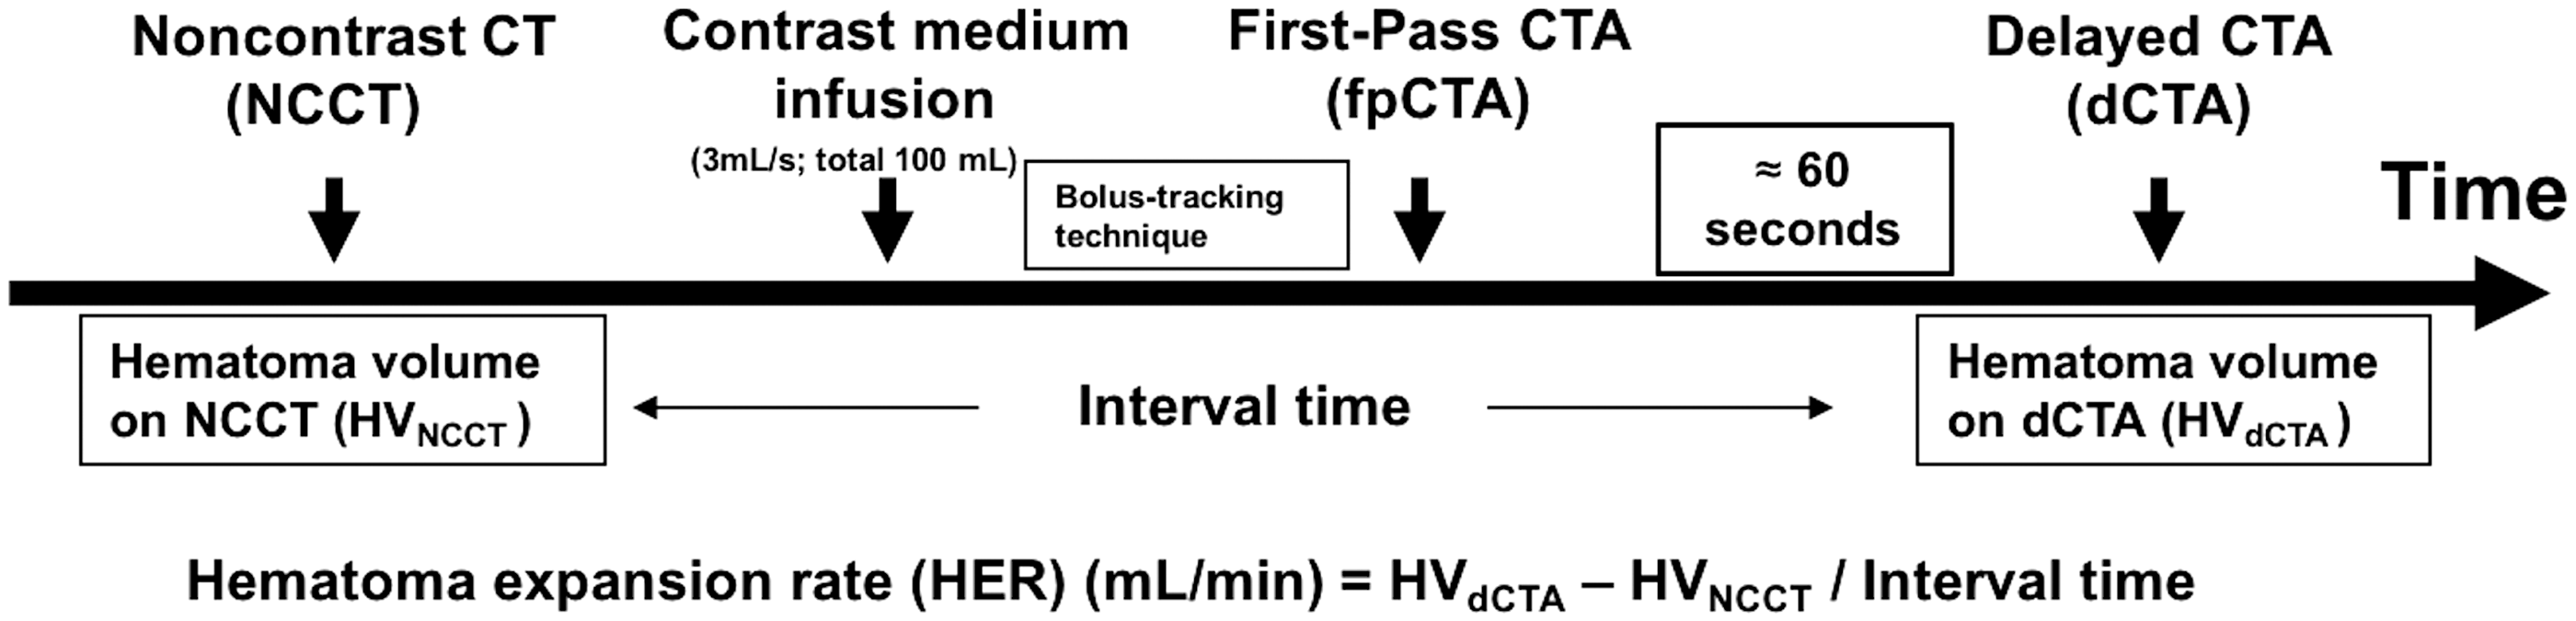
Image analysis and interpretation
All studies were separately evaluated by two experienced neuroradiologists (TCW and TYC with ten and 15 years of experience, respectively), both blinded to the clinical and radiological outcome. In accordance to available references (9,15), the spot sign was defined as: ≥1 focus of spot-like or serpiginous contrast pooling within the ICH; an attenuation ≥120 HU; absence of connection to vascular structures adjacent to the ICH; and of any size and morphology. The maximum axial dimension of the intracranial hematoma on NCCT was determined first, then the maximum perpendicular axial dimension was determined on the same slice. The product of these two perpendicular axial dimensions was defined as XY value throughout this article. Hematoma volume measurements were obtained by using the freehand region of interest (ROI) tool on Infinitt PACS. Significant HE was defined as an absolute hematoma growth >6 mL or relative growth of >33% from the initial ICH volume (5,9). The progression rate of HE (HER) was presented as milliliter per minute (mL/min) calculated by changes in measured hematoma volumes between the NCCT and dCTA divided by the length of time that had elapsed (Fig. 1).
Statistical analysis
Statistical analyses were performed using SPSS for Windows (V.24.0, IBM, Chicago, IL, USA). Continuous data were analyzed by Kruskal–Wallis rank sum test and categorical data were analyzed by Chi-square or Fisher’s exact test. Post-hoc analysis was further done for comparison between each group. P values <0.05 were considered statistically significant. The performance of spot sign on fpCTA, only dCTA, and both phases for predicting significant HE, in-hospital mortality, and poor outcomes was calculated. For prediction of CTA spot sign by hematoma size on NCCT, receiver operating characteristic (ROC) analysis was performed. Inter-observer reliability for presence or absence of spot sign was determined by using the Cohen κ coefficient, whereas for continuous data of hematoma volumes, the intraclass correlation coefficient (ICC) was calculated with the two-way random model and absolute agreement on average measures. Interpretation of the Cohen κ and ICC were interpreted according to methods described by Landis et al. (19) as: 0.0–0.20 = slight; 0.21–0.40 = fair; 0.41–0.60 = moderate; 0.61–0.80 = substantial; and 0.81–1.00 = almost perfect. Due to substantial to almost perfect reproducibility (ICC values of 0.79–0.96) for measurements of the maximum axial dimension, XY value, and hematoma volume on NCCT and dCTA, the subsequent statistical evaluation was performed by the mean value calculated from both raters.
Results
Radiographic findings
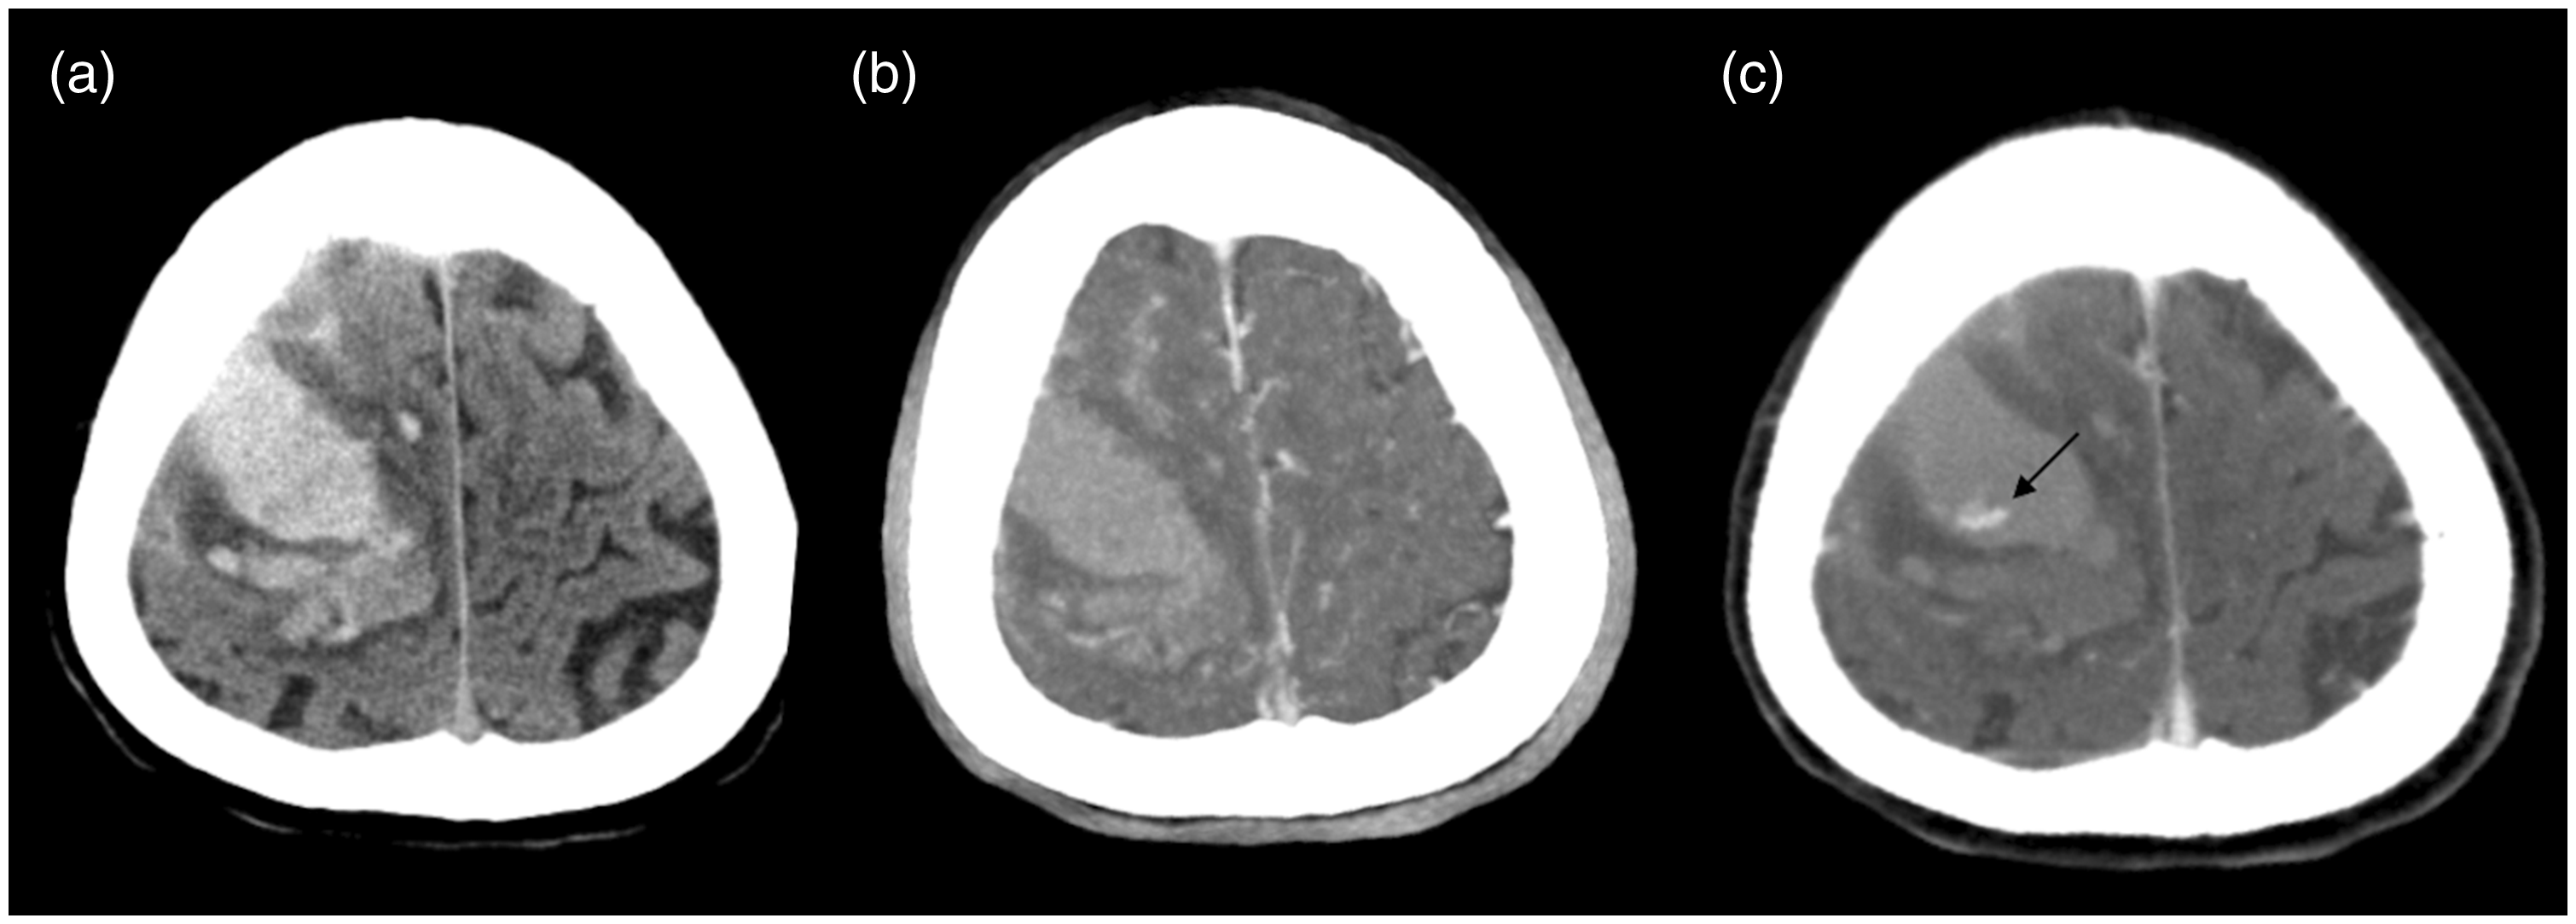
In the 100 cases studied, 21 (21%) showed the spot sign on the fpCTA (Group 1) (Fig. 2). Another 15 (15%) showed the spot sign only on dCTA (Group 2) (Fig. 3). There were no cases presenting with the spot sign on fpCTA but not on dCTA. There were 64 cases (64%) without the spot sign on either fpCTA or dCTA (Group 3). The radiographic findings are summarized in Suppl. Table 1. Increased hematoma expansion rates (HER) and more significant HE are observed in groups 1 and 2 compared with group 3 (P < 0.05). The inter-observer reliability for detection of the spot sign is almost perfect with κ of 0.98 and 0.96 for the fpCTA and dCTA, respectively.
A 73-year-old woman with positive spot sign on both fpCTA and dCTA. (a) NCCT demonstrates a lobar hemorrhage in the left frontal lobe with mild midline shift to right side. The maximum axial dimension of the initial hematoma is 62 mm, with XY value of 3210 mm2 and hematoma volume of 85.3 mL. (b) The fpCTA shows a spot sign (arrow) within the hematoma. (c) The dCTA reveals spilling of contrast material from the spot sign and significant hematoma expansion with volume of 119.8 mL. The elapsed time between the NCCT (a) and the dCTA (c) is 75 min. The measured volume changes and ratio of the hematoma between NCCT (a) and dCTA (c) is 34.5 mL and 1.4 mL, respectively, and the hematoma expansion rate (HER) is 0.46 mL/min. A 75-year-old man with positive spot sign only on dCTA. (a) NCCT demonstrates a lobar hemorrhage in the right frontal lobe. The maximum axial dimension of the initial hematoma is 63.4 mm, with XY value of 2713.5 mm2 and hematoma volume of 64.3 mL. (b) A spot sign is observed (arrow) on the dCTA (c) but not the fpCTA (b). (c) The dCTA shows hematoma expansion with volume of 66.2 mL. The elapsed time between the NCCT (a) and the dCTA (c) is 26 min. The measured volume changes and ratio of the hematoma between NCCT (a) and dCTA (c) is 1.9 mL and 1.03 mL, respectively, and the HER is 0.07 mL/min.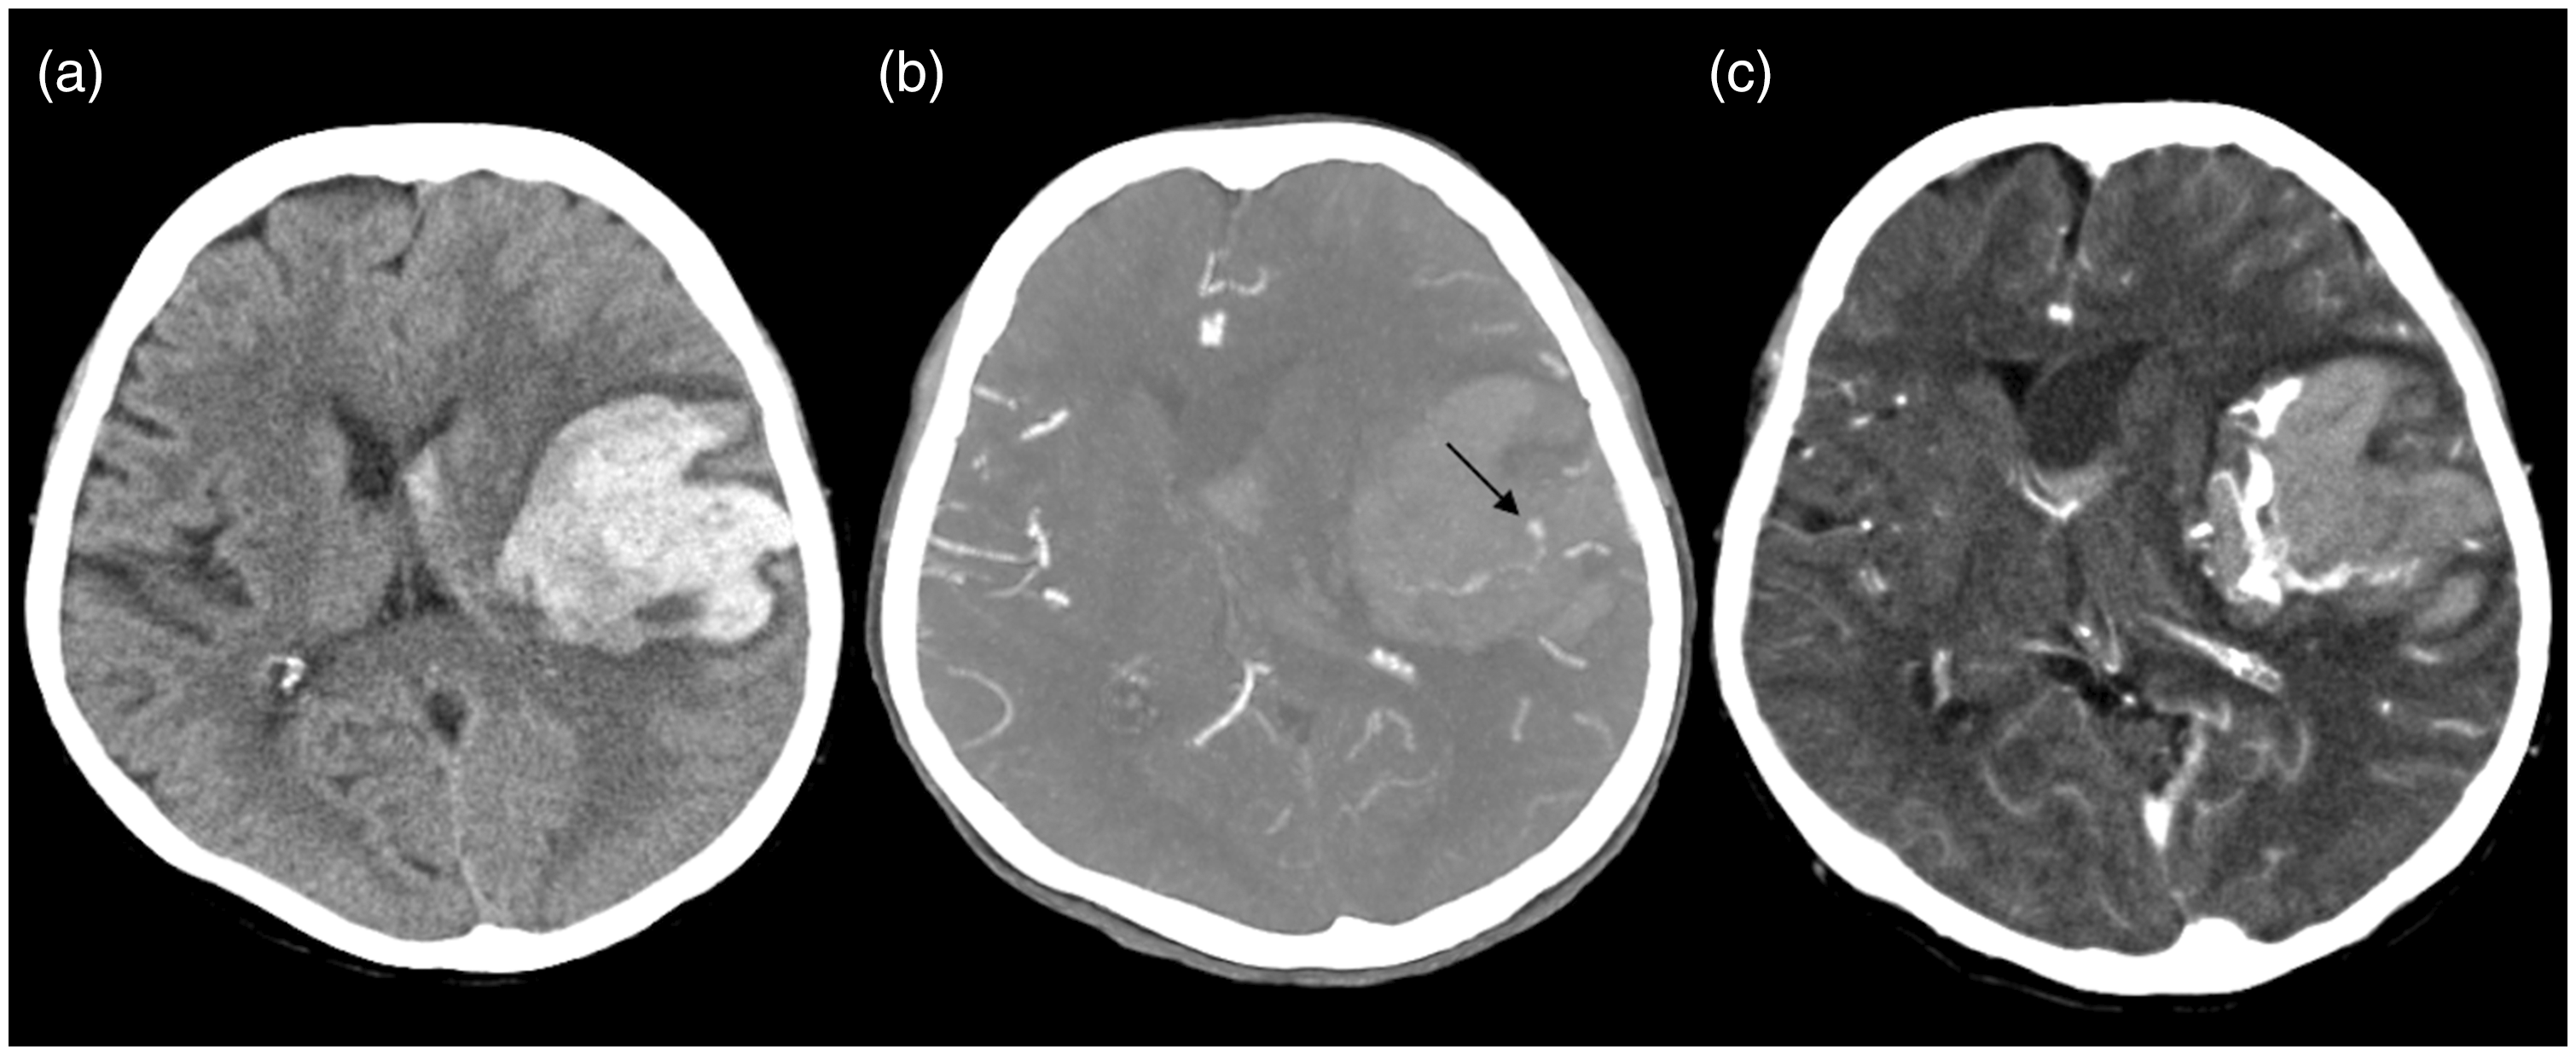
Clinical demographic data and outcomes
The clinical demographic data and outcomes are summarized in Suppl. Table 2. Lower GCS and higher NIHSS on arrival is noted for groups 1 and 2 compared with group 3 (P < 0.05). Poor clinical outcomes (mRS ≥ 4) are observed in groups 1 and 2 compared with group 3 (P < 0.05).
CTA spot sign for predicting significant HE, in-hospital mortality, and poor clinical outcomes
The performance of the spot sign on the fpCTA, only dCTA, and combination of both phases for predicting significant HE, in-hospital mortality, and poor clinical outcomes are summarized in Suppl. Table 3. With the combination of fpCTA and dCTA, there is increased sensitivity up to 90% for significant HE and in-hospital mortality, and from 31% to 56% for poor clinical outcomes compared with using the fpCTA only. Besides, there is also increased negative predictive value (NPV) after combination of fpCTA and dCTA.
Hematoma size for predicting CTA spot sign
Performance of hematoma size on NCCT for predicting spot sign on fpCTA or dCTA in primary ICH.
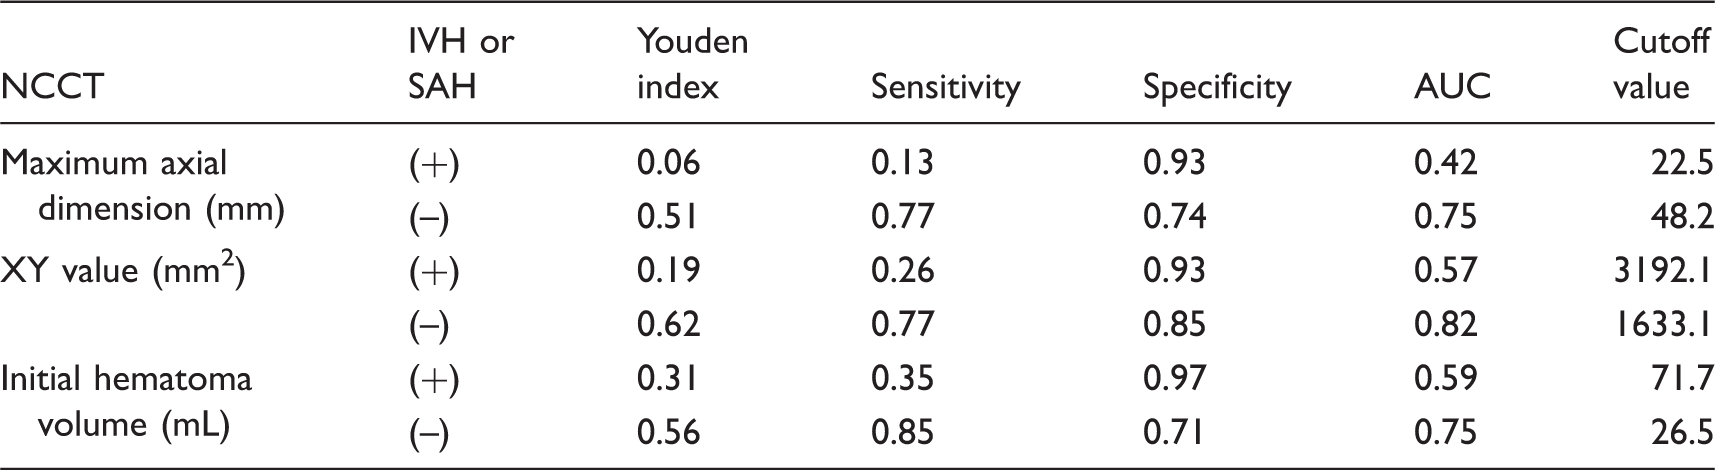
NCCT, non-contrast computed tomography; IVH, intraventricular hemorrhage; SAH, subarachnoid hemorrhage; AUC, area under the curve.
Discussion
This study attempts to determine the additional benefits of spot sign detected only on dCTA for predicting outcomes in primary ICH. The results have concluded that spot sign on either fpCTA or only dCTA could predict the high risk of significant HE and poor clinical outcomes (mRS ≥ 4). Increased sensitivity and NPV for detection of significant HE, in-hospital mortality, and poor clinical outcomes were observed when combining fpCTA with dCTA. Furthermore, the XY value of the hematoma is the most useful predictor for the CTA spot sign in the absence of IVH and SAH.
Some articles reported delayed CTA as offering an increased detection rate (32–43%) of the spot sign, but the clinical impact of the spot sign only detected on dCTA had not been reported (17). Although Ciura et al. (15) first described the predictive accuracy of the spot sign on fpCTA and the 90-s dCTA for detection of HE and mortality in ICH patients, 10 of the 15 cases with spot sign on 90-s dCTA also presented with the spot sign on fpCTA. This study is the first to report the HER, significant HE, in-hospital mortality, and clinical outcomes in a group of patients with the spot sign “only on dCTA” but not fpCTA, and emphasizes the importance of paying attention to dCTA imaging even if there is no spot sign on fpCTA. The median HER of 0.23 mL/min for patients with spot sign on fpCTA is identical to the contrast extravasation rate (0.23 mL/min) in a CTA spot sign study reported by Brouwers et al. (20). It is reasonable that there is association between HER and contrast extravasation rate. The median HER of 0.07 mL/min for patients with spot sign only on dCTA is first reported in our study and no available data could be correlated. The slower contrast extravasation rate may explain why some patients had spot sign only on dCTA but not fpCTA.
Rodriguez-Luna et al. (16) reported that 40% (10/25) patients with the spot sign on dCTA (venous phase) would experience significant HE. In contrast, more than half of patients (53.3%) with the spot sign only on dCTA would undergo significant HE in our study. Therefore, for patients with the spot sign on either fpCTA or only dCTA, proactive interventions such as aggressive blood pressure reduction and craniotomy might be considered because of the high risk of poor outcomes in these patients. It is our observation that surgical interventions reduced the ratio of in-hospital mortality and poor clinical outcomes for patients with spot sign on either fpCTA or only dCTA, and further prospective study with large sample size need to be investigated. In this study, the dCTA imaging provides additional information that may alter clinical decision-making.
Ederies et al. (21) and Hallevi et al. (12) demonstrated that the spot sign on post-contrast CT improves sensitivity rates for HE. Other authors reported dynamic CTA (11) and CT perfusion (13,14) showed improved detection of the spot sign. From this study, we found the added 60-s dCTA imaging offers optimal results without the need for extra post-contrast CT scan or contrast medium administration. However, the optimal delayed timing for capturing the CTA spot sign still need to be validated by biological experiments.
According to the latest guideline for primary ICH management, CTA and contrast-enhanced CT remain as “may be considered” to help identify patients at risk for HE (Class IIb; Level of Evidence B) (22). Hemphill et al. (23) reported that ICH size >30 mL would lead to higher ICH scores and a greater likelihood of poor clinical outcomes. Becker et al. (4) reported that a larger hematoma size would lead to higher incidence of a positive spot sign. This study first proposes the quantitative hematoma size including the maximum axial dimension, XY values, and initial hematoma volumes as predictors for the spot sign on fpCTA or dCTA in primary ICH. Although CTA is popular in primary ICH evaluation, the cutoff values of hematoma size for predicting CTA spot sign may provide additional vital clinical information. However, these predictions are not precise in patients with IVH or SAH. This may be due to underestimation of the real hematoma size in the presence of intraventricular leakage.
This study proposes the additional value of spot sign detected only on dCTA in primary ICH, and a fast measurement of hematoma size on NCCT for predicting spot sign on fpCTA or dCTA is also presented.
However, there are still several limitations to our study. This is a retrospective study, and the case number with the spot sign only on dCTA after subgroup is relatively small, precluding a further multivariate assessment. Although CTA spot sign is a dynamic process, there are short and variable time intervals (median = 48–60 min) between the NCCT and dCTA in our study without the inclusion of 24-h follow-up CT as in previous studies conducted by other authors (9,10,16,24). As in other ROI-based studies, subjective freehand ROIs might have influenced the accuracy of the hematoma measurements. Finally, the additional delayed CTA acquisition leads to increased radiation exposure; however, we implemented the necessary modifications to our protocol to keep radiation doses as low as possible.
In conclusion, the presence of spot sign on either fpCTA or only dCTA could predict the high risk of significant HE and poor clinical outcomes (mRS ≥ 4). The additional dCTA imaging should be noticed in primary ICH, as it is helpful in improving the sensitivity and NPV for the prediction of significant HE, in-hospital mortality, and poor clinical outcomes. As for primary ICH without IVH and SAH, the XY value is the best predictor (AUC of 0.82) for spot sign on fpCTA or dCTA.
Footnotes
Declaration of Conflicting Interests
The author(s) declared no potential conflicts of interest with respect to the research, authorship, and/or publication of this article.
Funding
The author(s) received no financial support for the research, authorship, and/or publication of this article.
References
Supplementary Material
Please find the following supplemental material available below.
For Open Access articles published under a Creative Commons License, all supplemental material carries the same license as the article it is associated with.
For non-Open Access articles published, all supplemental material carries a non-exclusive license, and permission requests for re-use of supplemental material or any part of supplemental material shall be sent directly to the copyright owner as specified in the copyright notice associated with the article.