



Abstract
Background
Brain atrophy is associated with mild cognitive impairment (MCI), and by using volumetric and visual analyzing methods, it is possible to differentiate between individuals with progressive MCI (MCIp) and stable MCI (MCIs). Automated analysis methods detect degenerative changes in the brain earlier and more reliably than visual methods.
Purpose
To detect and evaluate structural brain changes between and within the MCIs, MCIp, and control groups during a two-year follow-up period.
Material and Methods
Brain magnetic resonance imaging (MRI) scans of 11 participants with MCIs, 18 participants with MCIp, and 84 controls were analyzed by the visual rating method (VRM) and tensor-based morphometry (TBM).
Results
At baseline, both VRM and TBM differentiated the whole MCI group (combined MCIs and MCIp) and the MCIp group from the control group, but they did not differentiate the MCIs group from the control group. At follow-up, both methods differentiated the MCIp group from the control group, but minor differences between the MCIs and control groups were only seen by TBM. Neuropsychological tests did not find differences between the MCIs and control groups at follow-up. Neither method revealed relevant signs of brain atrophy progression within or between MCI subgroups during the follow-up time.
Conclusion
Both methods are equally good in the evaluation of structural brain changes in MCI if the groups are sufficiently large and the disease progresses to AD. Only TBM disclosed minor atrophic changes in the MCIs group compared to controls at follow-up. The results need to be confirmed with a large patient group and longer follow-up time.
Keywords
Introduction
Brain atrophy and enlargement of the cerebrospinal fluid (CSF) spaces are associated with normal aging, but when dementia occurs, these processes are stronger, faster, and associated with cognitive decline (1–4). Atrophy of the medial temporal lobe (MTL) and the hippocampus is often associated with mild cognitive impairment (MCI) (5–10). By evaluation of the atrophy of the MTL, it is possible to differentiate between individuals with MCIp and MCIs, as well as to predict later conversion to Alzheimer’s disease (AD) (5–12). In parallel with the progressive cognitive decline in MCI and AD, cortical atrophy spreads to other regions of the temporal (4,13) and parietal lobes (13). When it reaches the frontal lobes, cortical atrophy is associated with impairment of executive functions (14,15). Ventricular enlargement has been used to differentiate between AD, MCI, and control participants (3), and volume changes of the temporal horn have predicted MCI conversion to AD (4).
Magnetic resonance imaging (MRI) is widely used to evaluate atrophy and enlargement of CSF spaces. The visual rating method (VRM) has been developed to evaluate the medial temporal atrophy (MTA) (16). VRM can be used easily and cost-effectively in clinical practice as part of a general diagnostic evaluation. VRM predicts the conversion of healthy controls to MCI, as well as MCI to AD (9,16,17). Its limitations include an inability to evaluate areas outside of the MTA and a reduction in diagnostic accuracy due to experience-based variations in the evaluations. The sensitivity of VRM has been 51–72% and the specificity has been 68–81% in predicting the progression of MCI to dementia (9).
Tensor-based morphometry (TBM) is a fully automated, voxel-based method that can objectively analyze local expansion or shrinking of brain tissue or CSF spaces in any brain area (18). The limitations include the computation time required to produce the results and the special expertise required for the analysis of results. However, TBM has been shown to be useful at the very early stages of dementia before severe cognitive decline emerges as well as in longitudinal studies where the progression of MCI (or early AD) to AD has been predicted (19–21).
The aim of this study was to evaluate the capabilities of VRM and TBM (26) to detect possible structural changes of the brain in stable and progressive MCI during a two-year follow-up period. In our earlier study (22), TBM differentiated between controls and MCI patients more accurately than VRM. Our hypothesis was that TBM more sensitively recognizes progressive changes in the MCI brain than VRM.
Material and Methods
Participants
The individuals were recruited to the study at Turku University Hospital (PET Centre and Division of Clinical Neurosciences). At baseline, the participants either had a diagnosis of amnestic MCI or were healthy controls. The MCI diagnosis was based on the criteria of Petersen et al. (23). During the follow-up period, some of the MCI individuals progressed to AD (the DSM-IV criteria and NINCS-ADRDA [National Institute of Neurological and Communicative Disorders and Stroke/Alzheimer’s Disease and Related Disorders Association]), while the rest of the MCI participants remained stable. The control individuals were healthy volunteers who had no history of neurological or psychiatric disease and who had scores within the age-adjusted Finnish norms in neuropsychological testing. Altogether, 113 participants were included. At baseline, there were 29 MCI individuals (MCIall): 11 remained stable (MCIs) and 18 progressed (MCIp) to AD during the 24-month follow-up period. None of the MCI participants were treated with acetylcholinesterase inhibitors or memantine during the study. Those individuals who had progressed to AD were directed to the national healthcare system for treatment initiation. The number of controls was 84. MRI scans of the participants’ brains were analyzed using both VRM and TBM.
The study was approved by the Joint Ethical Committee of the University of Turku and Turku University City Hospital and performed in accordance with the 1964 Declaration of Helsinki and its later amendments. The individuals received oral and written information about the study and gave informed consent prior to their inclusion in this study.
Neuropsychological testing
The neuropsychological tests used in this and our earlier study (22) were CERAD (24), the Logical Memory test from the Wechsler Memory Scale – Revised (25), and the Trail Making Test (26). The tests measure episodic memory, language, and visuospatial and executive functions. The aim of the tests was to ensure normal cognition of the controls and exclude widespread cognitive impairment in MCI patients. Neuropsychological testing was performed at baseline and after the 24-month follow-up time.
Magnetic resonance imaging
All participants underwent MRI scans at baseline. After the two-year follow up, the MCI individuals were re-scanned.
MRI imaging was performed with a 1.5-T Philips Intera (Best, The Netherlands) or a1.5-T MRI GE Signa Horizon LX EchoSpeed (GE Healthcare, Milwaukee, WI, USA). In both scanners, the sequences were axial, three-dimensional (3D) T1. The manual reconstruction of the sequences for visual evaluation was based on Scheltens et al. (17) and was made at a GE workstation (ADW 4.4, GE Healthcare). Frontal atrophy was evaluated from the original sequences by a neuroradiologist. More specific reconstruction and evaluation details of the MR scans have been previously described (22).
Visual rating method
Evaluation of MTL and CSF spaces was performed as described by Scheltens et al. (17). MTL atrophy was scaled from 0 (no atrophy) to 4 (severe atrophy). The absolute measurements of MTL and CSF spaces were proportioned to an absolute diameter of an inner calvarium of the skull to create results that would be independent of each participant’s head size. The frontal atrophy evaluation was based on Victoroff et al. (27) and was scaled from 0 (no atrophy) to 3 (severe atrophy). A more detailed description of the evaluations is given in our earlier study (22).
Tensor-based morphometry
In TBM, all study images were registered with multiple templates, and the determinant of the Jacobian matrix (the Jacobian) was computed for each voxel. The resulting average Jacobian described the amount of local voxel expansion or compression compared to the corresponding voxel in the mean anatomical template (MAT). For further analysis, the average Jacobians were combined within the Hammer’s brain atlas (28). The final TBM index was computed for each region of interest by measuring the similarity of each individual’s Jacobians with the typical AD-related pattern of Jacobians modelled from the ADNI dataset (29). High index values indicate AD-type shape changes while low values show similarity to the typical shape changes of healthy participants.
More technical details of the TBM are described in Koikkalainen et al. (29).
Statistical analysis
The control group had higher education than the MCIall group, but the difference only trended toward significant (P = 0.066) based on a Mann–Whitney U test. The groups had no age differences. However, as the differences in education and age may affect the results, they were used as covariates in the analysis. The analysis models included an analysis of the covariance model (ANCOVA) (continuous responses), logistic regression models (categorical data), and a cumulative logistic regression model (ordinal categorical responses with more than two levels) and a Spearman non-parametric correlation analysis.
In the analysis, the group differences at either baseline or follow-up, or between the time points, are abbreviated as the DEM (difference of estimated means) in VRM analysis and the DEIV (difference of the estimated index values) in TBM analysis. A negative DEM or DEIV means that in the comparison between groups, the latter group has higher average values than the first group; positive DEM or DEIV values indicate the opposite. In the analysis of frontal atrophy in VRM, the RO (ratio of coefficient) compares the odds for higher values between the groups. If the RO value is higher than 1, it is more likely that the first group has higher values than the second group. If the RO is smaller than 1, the interpretation is the opposite. All results were reported and P values for multiple group comparisons within the models were corrected using Tukey’s adjusted P values. The analyses were performed using SAS 9.2 (SAS Institute Inc., Cary, NC, USA).
Results
Demographic and neuropsychological characterizations
Demographic details of the individuals are shown in Suppl. Table 1 and neuropsychological characteristics of the participants are shown in Suppl. Table 2. At baseline, the MCI groups had significant impairments compared to controls in the logical memory scores and delayed recognition of wordlists, confirming the amnestic form of MCI and the absence of widespread cognitive decline. After the two-year follow-up, the MCIp group had highly significant impairments in almost all the cognitive domains compared to controls (comparison E) and it performed significantly worse on the MMSE and some episodic and executive functions compared to the MCIs group (comparison G) or compared to the group’s own baseline scores (comparison J). These characteristics highlight the clear separation of our study population into the MCI individuals, AD (MCIp 2 yr) participants and cognitively healthy controls.
Visual rating method
The results of VRM analysis are shown in Suppl. Table 3. At baseline, the MCIall group showed significantly higher hippocampal atrophy scores and smaller heights of the hippocampus and parahippocampal gyrus than the controls in the bilateral medial temporal lobes (comparison A). The width of the lateral ventricles and the right side of the combined CSF spaces were larger in the MCIall group than in the control group. When the MCIall group was divided into the MCIs and MCIp groups, the only statistically significant difference at baseline was in the width of the third ventricle for the MCIp group compared to controls (comparisons B and C). However, the numerical DEM values indicated more severe atrophy in more widespread areas in the MCIp group than in the MCIs group compared to the controls, although no statistically significant differences were seen.
During the two-year follow-up, the MCIs group remained stable compared to the controls (comparison D). In contrast, the MCIp group had developed significantly higher atrophy scores of the hippocampus and had wider CSF spaces than the controls (comparison E).
There were no significant differences between the MCIs and MCIp groups at baseline or after follow-up (comparisons F and G). However, the positive DEM values indicated that the atrophy changes extended to include more brain areas in the MCIp group than in the MCIs group at baseline and after follow-up.
When comparing the atrophy scores within the MCI groups at follow-up, the MCIs group remained stable compared to baseline (comparison H). Within the MCIp group the positive DEM values (line A in Suppl. Table 3) suggested some progression of atrophy, but this was not statistically significant (comparison J).
In the frontal atrophy scores, there were no significant differences between the study groups in any of the comparisons at any time points.
Tensor-based morphometry
The results of TBM analysis are shown in Suppl. Table 4, showing the estimates of index values (EIVs) and difference of the estimated index values (DEIVs) for the study groups. As described in our earlier study (22), high EIVs indicate similarity to Alzheimer’s disease and low EIVs indicate similarity to control individuals. The higher EIVs in the AD group compared with the control group resulted in negative DEIV, showing a better fit to the AD-type volume changes on average.
At baseline, the MCIall group differed significantly from the controls (comparison A) in the right side of the MTL and in the third ventricle. When the MCIall group was divided into the MCIs and MCIp groups, the differences compared to controls (comparisons B and C) were smaller, and the only statistically significant difference was the AD-type volume change of the third ventricle in the MCIp group. However, the negative DEIVs indicated more AD-type volume changes in both MCI groups compared to the control group.
At the two-year follow-up, TBM indicated that the MCIs group had developed significant changes in the bilaterally parahippocampal gyrus and ambiens, and on the right side of the combined MTL area compared to the controls (comparison D). At the same time, the MCIp group differed significantly from the controls (comparison E) in nearly all areas.
At baseline, there were no significant differences between the MCI groups (comparison F). At follow-up the only significant difference between MCI groups was in the left side of the anterior orbital gyrus (comparison G). Within the MCIs or MCIp groups no significant differences were seen during follow-up (comparisons H or J). However, all DEIVs within the MCIp and MCIs groups showed progression towards the AD-type volume changes.
At baseline, the DEIV of MCI participants showed a trend towards AD-type volume changes in the frontal areas, other temporal areas, and the parietal lobes. Statistically significant differences were seen in the MCIall and MCIp groups compared to controls (comparisons A and C). At follow-up, the MCIp group developed clearer AD-type volume changes and clearly differed from controls (comparison E). In the MCIs group, the only significant difference compared to controls (comparison D) was seen in the right lateral occipito-temporal area. In comparisons between or within the MCI groups, there were no statistically significant findings (comparisons E, G, H, or J). However, most DEIVs showed progression towards AD-type volume changes in these comparisons.
Fig. 1 shows the differences in the local volumes for the baseline and follow-up images for both the MCIs and MCIp groups. The MCIp group showed greater enlargement of the ventricles (red color) compared to the MCIs group. Additionally, slight cortical atrophy (blue color) can be seen in the MCIp group.
The average difference in the average Jacobians for the MCIs and MCIp groups during follow-up (group comparisons H and J in Suppl. Table 4). Red and blue colors show the voxels where the volume increase and decrease occurred, respectively, during follow-up. The results are overlaid on the axial slices of the MAT.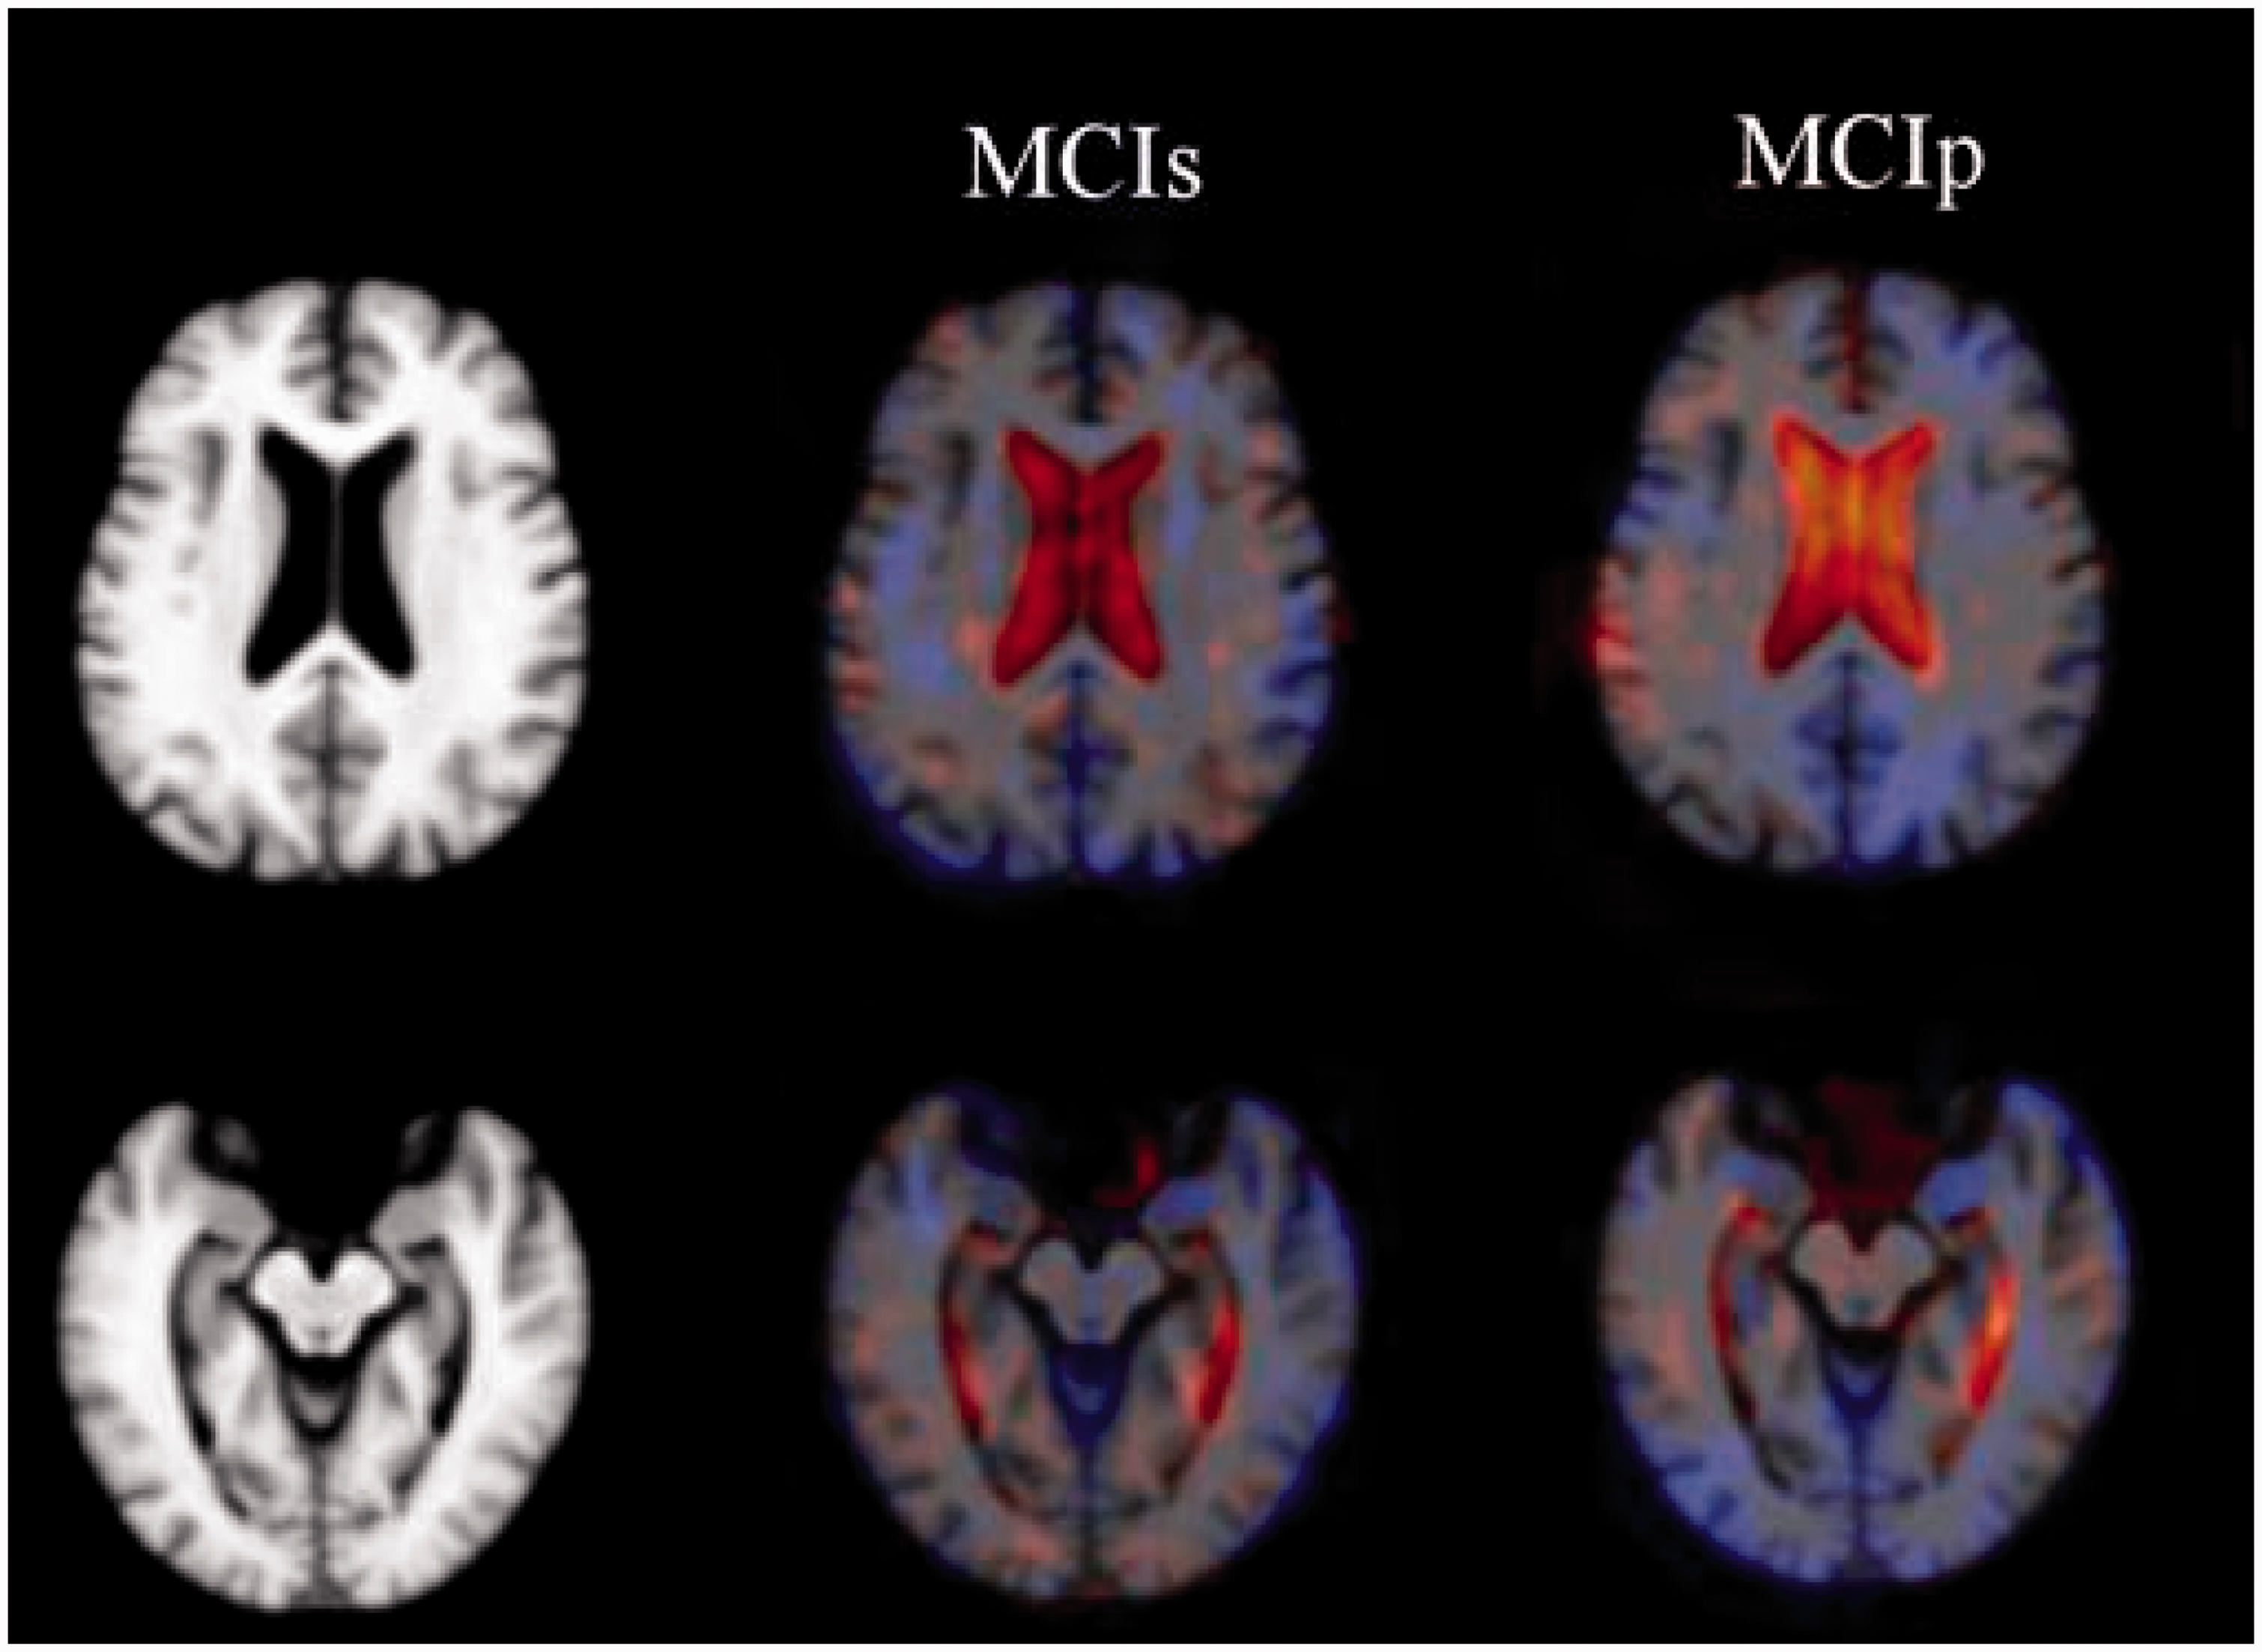
Correlation analysis
There was a significant correlation between the hippocampal VRM scores and the hippocampal EIVs of TBM in the controls (right: ρ = 0.32, P = 0.003; left: ρ = 0.32, P = 0.004). In the separate MCI groups, a significant association was seen in the MCIp both at baseline (right: ρ = 0.67, P = 0.002; left: ρ = 0.60, P = 0.007) and after the two-year follow-up (right: ρ = 0.78, P = 0.000; left: ρ = 0.81, P = 0.000). In MCIs, there was a significant association between the hippocampal VRM score and EIVs of TBM only at follow-up (left hippocampus: ρ = 0.81, P = 0.005), in addition to a trend level association in the right hippocampus (ρ = 0.61, P = 0.062), but not at baseline.
Discussion
The aim of this study was to detect and evaluate structural brain changes between and within the MCIs, MCIp and control groups during a two-year follow-up period using both VRM and TBM methods. At baseline, both VRM and TBM showed more atrophy in the MCIall and MCIp groups compared to the control group, but they did not show statistically significant differences between the MCIs group and the control group. At the two-year follow-up, both methods indicated more atrophy in the MCIp group than in controls, but only TBM found significant differences in atrophy between the MCIs and the control group.
As expected, at baseline, both VRM and TBM differentiated between the MCIall group and controls. However, at the subgroups level, both methods separated the MCIp group from the controls, but they did not differentiate the MCIs group from controls.
At the two-year follow-up, the MCIp group had progressed to Alzheimer’s disease, which was clearly seen in the neuropsychological results and was associated with structural changes evaluated by both methods. It was interesting that TBM showed some structural differences between the MCIs and control groups at follow-up, while at the same time, the MCIs group remained stable in the neuropsychological tests. This finding suggests that TBM is preconditioned to subtle volume changes that are not yet reflected in the cognitive status of the patients. However, as seen in the baseline results, minor findings can also be variable in small study groups.
The neuropsychological tests showed significant decline in memory functions within the MCIp group at follow-up (comparison J). However, neither TBM nor VRM had statistically significant results in this comparison, although general atrophy and reduction of volumes was indicated by the DEM and DEIV values. The small group sizes may partially explain the non-significant results especially in the TBM analysis.
In the frontal areas, statistically significant results were seen only by TBM as was expected based on our earlier study (22). The findings were mainly seen in the MCIall and MCIp groups compared to the controls. The results were similar in the other temporal areas and parietal lobes, which were only analyzed by TBM.
The methodological limitations were the same as in our earlier study (22). In VRM, the bias of evaluation was avoided using example images and guidelines (30) and by co-evaluation of the MR scans with wide differences in the independent evaluation. In TBM, the computation time requirements of the multi-template analysis, the possible inexactness in the atlas segmentation of the structures and Jacobian measurement of the volume changes alone are limitations of the analysis. The number of MCI individuals was relatively low, which might have influenced the changes seen after dividing the MCI group into the MCIs and MCIp groups. Additionally, differences between and within the MCIs and MCIp groups might have been seen in larger MCI groups. Furthermore, the two-year follow-up period is relatively short. A longer follow-up time might have revealed differences between the MCIs and MCIp groups, which may have also revealed MCIs participants who would progress later.
In conclusion, both VRM and TBM separated the MCIall and MCIp groups from the control group. At the two-year follow-up, both methods detected more atrophy in the MCIp group compared to controls, but only TBM found significant differences between the MCIs and the control group. It is of interest that neuropsychological tests did not find differences between the MCIs and control groups at follow-up, suggesting that it might be possible to detect minor structural progression in atrophy before cognitive change using TBM. The results need to be confirmed in a larger patient population.
Footnotes
Acknowledgments
The authors thank Sofia Männikkö, a biostatistician from Department of Biostatistics in Turku University, Finland, for her statistical expertise.
Declaration of Conflicting Interests
The author(s) declared the following potential conflicts of interest with respect to the research, authorship, and/or publication of this article: J Koikkalainen and J Lötjönen are shareholders in Combinostics Ltd.
Funding
The author(s) disclosed receipt of the following financial support for the research, authorship, and/or publication of this article: The study was supported by the Academy of Finland (project no. 133193), Sigrid Juselius Foundation, Turku University Hospital Clinical Grants, and Duodecim Foundation.